


1. Introduction
The late Mesozoic (Jurassic–Cretaceous; referred to as the ‘Yanshanian’ in China) geology of SE China is characterized by widespread igneous rocks consisting predominantly of granites and felsic volcanic rocks with sporadic mafic intrusive and extrusive rocks. It is generally believed that subduction of the palaeo-Pacific plate beneath SE China triggered the pervasive crustal deformation associated with the Yanshanian orogeny and the widespread volcanism (Fig. 1; e.g. Chen & Jahn, Reference Chen and Jahn1998; Zhou & Li, Reference Zhou and Li2000; Zhou et al. Reference Zhou, Sun, Shen, Shu and Niu2006; Li & Li, Reference Li and Li2007; Li, S. Z. et al. Reference Li, Li, Wang, Zhang, Wang and Liu2019). Several distinctly different models, however, have been proposed to explain the subduction process or geodynamics (for a summary see Li, J. H. et al. Reference Li, Dong, Cawood, Zhao, Johnston, Zhang and Xin2018, Reference Li, Ni, Wang, Bao, Huang and Dai2020), such as normal subduction (e.g. Lapierre et al. Reference Lapierre, Jahn, Charvet and Yu1997), shallow subduction (e.g. Zhou & Li, Reference Zhou and Li2000; Jiang et al. Reference Jiang, Jiang, Dai, Liao, Zhao and Ling2009), flat subduction (Li & Li, Reference Li and Li2007), repeated slab advance-retreat (Jiang, S. H. et al. Reference Jiang, Wang, Liu, Ni, Qing and Zhang2015; Wang et al. Reference Wang, Liu, Wang, Wang and Tao2016), mid-ocean ridge subduction (e.g. Ling et al. Reference Ling, Wang, Ding, Hu, Zhou, Zartman, Yang and Sun2009; Zhao et al. Reference Zhao, Guo, Fan, Zhang, Wu, Li and Yan2016) and subduction initiation in the Permian (e.g. Li & Li, Reference Li and Li2007, Reference Li and Li2012) or the Jurassic (e.g. Xing et al. Reference Xing, Yang, Chen, Shen, Wei and Zhou2004, Reference Xing, Lu, Chen, Zhang, Nie, Li, Huang and Lin2008, Reference Xing, Chen, Yang, Zhou, Li, Jiang and Chen2009; Guo et al. Reference Guo, Fan, Li, Zhao, Li and Yang2012; Liu et al. Reference Liu, Xu and Zou2012, Reference Liu, Xu and Xia2014, Reference Liu, Xu and Xia2016; Deng et al. Reference Deng, Liu, Zhang, Wang, Wang, Yang, Luo and Guo2014; Zhao, X. L. et al. Reference Zhao, Liu, Yu, Jiang, Mao, Zhou and Yu2015, Reference Zhao, Wang, Tian and Wu2017, Reference Zhao, Jiang, Yu, Xing and Yu2018a,b; Suo et al. Reference Suo, Li, Jin, Zhang, Zhou, Li, Wang, Liu, Wang and Somerville2019).

Fig. 1. Distribution map of Mesozoic volcanic rocks in SE China (modified after Zhou et al. Reference Zhou, Sun, Shen, Shu and Niu2006). The Middle–Late Jurassic volcanic rocks in the coastal regions of SE China: 1 – Lishui area, Zhejiang Province; 2 – Songyang area, Zhejiang Province; 3 – Longquan–Qinyuan area, Zhejiang Province; 4 – Zhenghe area, Fujian Province; 5 – Minqing area, Fujian Province; 6 – Dehua area, Fujian Province; 7 – Yong’an area, Fujian Province; 8 – Fengshun area, Guangdong Province; 9 – Dapeng area, Guangdong Province; 10 – Hong Kong.
There is a general consensus that the Early Cretaceous volcanic rocks were formed by the partial melting of ancient continental crust caused by the upwelling of asthenospheric mantle because of the break-off and/or the rollback of the palaeo-Pacific plate (Liu et al. Reference Liu, Xu and Zou2012, Reference Liu, Xu and Xia2014, Reference Liu, Xu and Xia2016; Li et al. Reference Li, Zhou, Lai, Chan and Chen2014, Reference Li, Li, Suo, Dai, Guo, Ge and Lin2017; Duan et al. Reference Duan, Zhao, Xing, Yang, Yu, Chen, Jin, Jiang and Li2015; Yan, X. et al. Reference Yan, Jiang and Jiang2016; Huang et al. Reference Huang, Wang, Pan, Liu and Sun2019). Nevertheless, the Late Jurassic volcanic rocks are rarely exposed in SE China, and have been insufficiently studied (Xing et al. Reference Xing, Lu, Chen, Zhang, Nie, Li, Huang and Lin2008; Li et al. Reference Li, Sun, Xing, Zhao, Zhou, Wong and Chen2009, Reference Li, Zhou, Lai, Chan and Chen2014; Zhang, W. et al. Reference Zhang, Yang, Chen, Wu and Wilde2018; Jia et al. Reference Jia, Mao and Zheng2019). Recent geological investigations in eastern Fujian Province identified massive Late Jurassic volcanic rocks both at the surface and in a drill core (Nanjing Centre of China Geological Survey, unpub. data), and the volcanic activity lasted until Early Cretaceous time, which provides an excellent opportunity to explore the genetic evolution of the volcanic rocks and tectonic transition in the Jurassic–Cretaceous period in SE China. In this paper, an integrated study of zircon U–Pb, Lu–Hf isotope compositions and whole-rock geochemistry was carried out for the Mesozoic volcanic rocks in eastern Fujian Province. This new data combined with previously published work allow us to address in detail (1) the petrogenesis and tectonic background of the volcanic rocks in eastern Fujian Province; and (2) late Mesozoic magmatism and the tectonic evolution of SE China.
2. Geological background
The South China Craton comprises two major Precambrian continental blocks: the Yangtze Block in the northwest and the Cathaysia Block in the southeast (Zhao & Cawood. Reference Zhao, Zhou and Zheng2013). The two blocks were sutured along the Jiangshan–Shaoxing fault zone during Neoproterozoic time (Fig. 1), although there is considerable debate about the nature of the amalgamation process (c. 830–810 Ma; Wang et al. Reference Wang, Zhou, Yan, Li and Malpas2013; Zhao et al. Reference Zhao, Zhou and Zheng2013; Zhang & Wang, Reference Zhang and Wang2016; Li, L. M. et al. Reference Li, Lin, Xing, Jiang and Xia2018; Lin et al. Reference Lin, Xing, Davis, Yin, Wu, Li, Jiang and Chen2018). The Cathaysia Block may be further divided into interior (Western Cathaysia) and coastal (Eastern Cathaysia) tectonic units along the Zhenghe–Dabu fault (Xu et al. Reference Xu, O’Reilly, Griffin, Wang, Pearson and He2007) or the NW Fujian fault (Lin et al. Reference Lin, Xing, Davis, Yin, Wu, Li, Jiang and Chen2018). Precambrian granites and high-grade metamorphic rocks in the Eastern Cathaysia unit are intruded by early Palaeozoic and late Mesozoic granites, or covered by Palaeozoic sediments and late Mesozoic volcanic rocks (Zhao & Cawood, Reference Zhao, Zhou and Zheng2013; Zhao et al. Reference Zhao, Jiang, Xing, Wang and Jin2019a).
The Mesozoic volcanic rocks in SE China are mainly located in the Eastern Cathaysia Block. The volcanic rocks are exposed widely with a total area of ~90 000 km2 and are characterized by large proportions of felsic volcaniclastic rocks (Zhou et al. Reference Zhou, Sun, Shen, Shu and Niu2006). The statistical results of previous studies show that Jurassic volcanic rocks are rarely exposed in SE China (for a summary see Cao et al. Reference Cao, Chu, Duan, Yu, Chen, Fan and Xing2020). They are mainly distributed in the Nanling region, and a few are scattered in the coastal region of SE China (Fig. 1). The volcanic outcrops in the Nanling region are mainly Early Jurassic (195–175 Ma) small-scale tholeiitic bimodal volcanic assemblages occurring as E–W linear arrays and are spatially associated with bimodal intrusive rocks and layered ultrabasic–basic rocks, proposed as a product of intracontinental lithospheric extension (e.g. Jiang et al. Reference Jiang, Jiang, Dai, Liao, Zhao and Ling2009; Zhu et al. Reference Zhu, Zhong, Li, He, Song, Ren, Chen, Sun and Liao2010; Ye et al. Reference Ye, Mao, Zhao, Liu and Chen2013; Bai et al. Reference Bai, Zhu, Zhong, Li, Liao and Sun2015; Cen et al. Reference Cen, Li, Wang, Pang, Li, Xing, Zhao and Tao2016; Gan et al. Reference Gan, Zhang, Barry, He and Wang2018). In contrast, the sporadic Middle–Late Jurassic (173–146 Ma) volcanic rocks in the coastal regions of SE China are mainly high-K calc-alkaline medium-acid volcanic rocks, with minor mafic rocks in some areas (e.g. Hong Kong; Li et al. Reference Li, Zhou, Lai, Chan and Chen2014). They are geochemically different from magmatic rocks of intracontinental extensional environments, but have geochemical affinities to arc magma (Guo et al. Reference Guo, Fan, Li, Zhao, Li and Yang2012; Li et al. Reference Li, Zhou, Lai, Chan and Chen2014, Reference Li, Xing, Xing, Chen, Duan, Yang and Hu2015; Zhang, W. et al. Reference Zhang, Yang, Chen, Wu and Wilde2018; Jia et al. Reference Jia, Mao and Zheng2019; Li, S. N. et al. Reference Li, Ni, Wang, Bao, Huang and Dai2020). In contrast, Cretaceous volcanic products are widely distributed in SE China. They were emplaced during two episodes, and the corresponding volcanic strata are referred to as the lower and upper volcanic series, separated by a ubiquitous regional unconformity (e.g. He & Xu, Reference He and Xu2012; Liu et al. Reference Liu, Xu and Zou2012). The rocks of the lower volcanic series were emplaced from 145 to 120 Ma (Xing et al. Reference Xing, Lu, Chen, Zhang, Nie, Li, Huang and Lin2008; Li et al. Reference Li, Sun, Xing, Zhao, Zhou, Wong and Chen2009; Cui et al. Reference Cui, Xie, Chen, Yu and Hu2010; Guo et al. Reference Guo, Fan, Li, Zhao, Li and Yang2012; Liu et al. Reference Liu, Xu and Zou2012, Reference Liu, Xu and Xia2014, Reference Liu, Xu and Xia2016; Duan et al. Reference Duan, Xing, Yu, Zhao, Jin and Chen2013), while those of the upper volcanic series are mainly exposed within the faulted basins (red-bed basins; Zhang, J. H. et al. Reference Zhang, Yang, Chen, Wu and Wilde2018 and references therein) or in locally thick volcanic layers (Yan, L. L. et al. Reference Yan, He, Jahn and Zhao2016, Reference Yan, He, Beier and Klemd2018), and have ages ranging from 115 to 90 Ma (Fig. 1; Duan et al. Reference Duan, Xing, Yu, Zhao, Jin and Chen2013; Yan, L. L. et al. Reference Yan, He, Jahn and Zhao2016; Li et al. Reference Li, Li, Suo, Dai, Guo, Ge and Lin2017). Both Cretaceous volcanic series are mainly composed of rhyolitic volcaniclastic rocks and rhyolites, and have geochemical affinities of arc magma (e.g. Li et al. Reference Li, Sun, Xing, Zhao, Zhou, Wong and Chen2009; Guo et al. Reference Guo, Fan, Li, Zhao, Li and Yang2012; Duan et al. Reference Duan, Xing, Yu, Zhao, Jin and Chen2013; Yan, L. L. et al. Reference Yan, He, Jahn and Zhao2016)
The Dehua–Youxi–Yongtai area (Dehua area; Fig. 2a), which is generally referred to as the ‘Golden Triangle’ prospecting area, is geographically located in central-eastern Fujian Province. Tectonically, it is located in the Eastern Cathaysia Block and the northwestern section of the Daiyunshan volcanic field. The volcanism was intense during late Mesozoic time, and the volcanic rocks are widely distributed in the Dehua area. The regional volcanic strata are the Late Jurassic to Early Cretaceous Nanyuan Formation and the late Early Cretaceous Shimaoshan Group (Fig. 2a). The Nanyuan Formation comprises a thick intermediate–acid pyroclastic sequence and is subdivided into four units: (1) a basal unit comprising andesite, dacite and subordinate volcaniclastic rocks; (2) a unit composed of dominantly rhyolite and rhyolitic ignimbrite with some interbedded sedimentary rocks; (3) a unit mainly composed of a sequence of dacite, dacitic and rhyolitic tuffaceous lava with intercalated volcaniclastic sedimentary layers; and (4) an uppermost unit composed of rhyolitic ignimbrite and interbedded sedimentary rocks (Feng et al. Reference Feng, Qi, Huang, Li, Xu, Zou, Wu, Wang and He1991).
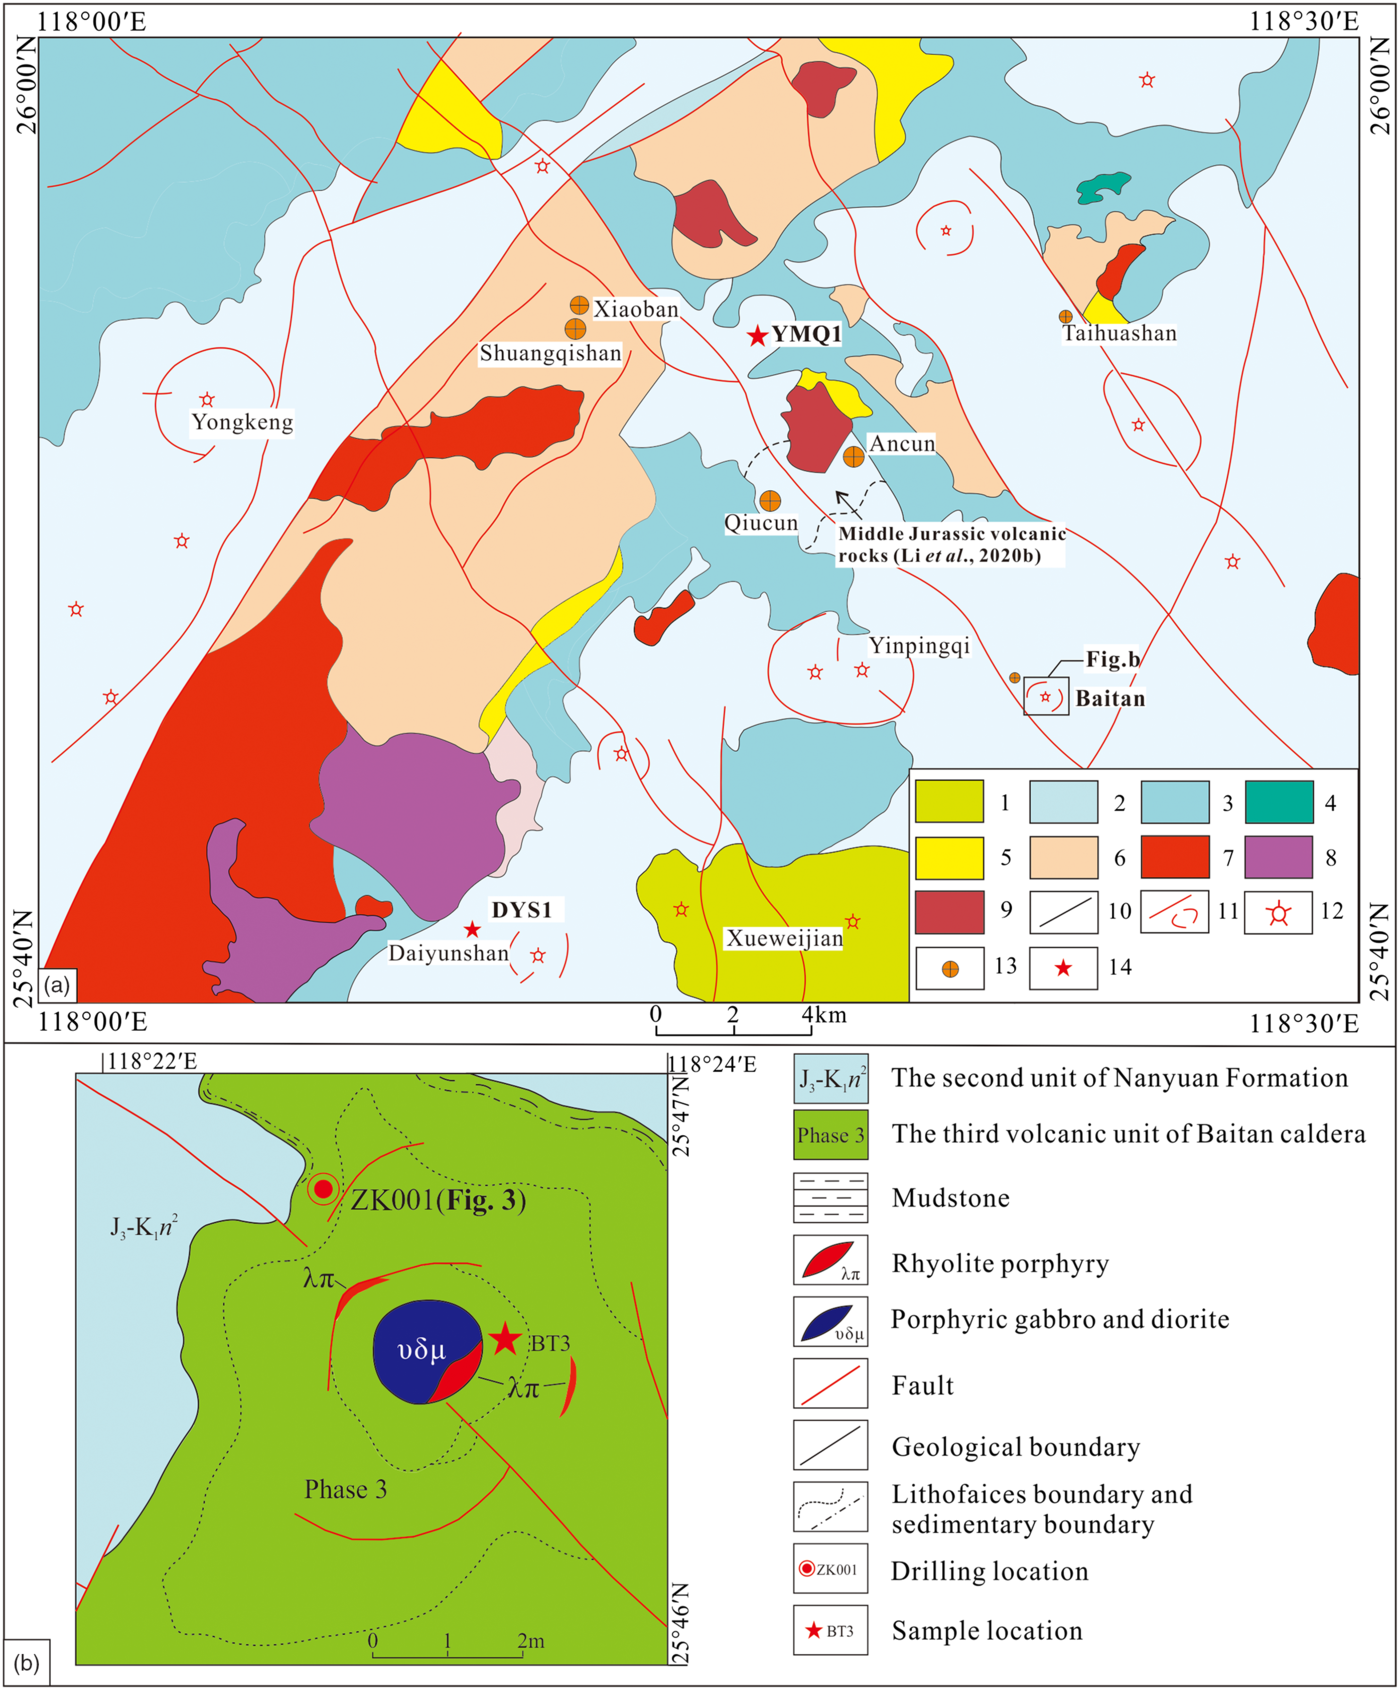
Fig. 2. (a) Simplified geological map of the Dehua region (modified after FIGSR, 2014) and (b) Baitan caldera showing the sample horizons and corresponding ages. 1 – late Early Cretaceous Shimaoshan Group; 2 – Late Jurassic – Early Cretaceous Nanyuan Formation; 3 – Jurassic clastic rocks; 4 – Triassic clastic rocks; 5 – Permian clastic rocks with carbonatite; 6 – Neoproterozoic metamorphic rocks; 7 – Yanshanian (Jurassic–Cretaceous) granites; 8 – Indosinian (Triassic–Permian) granites; 9 – Caledonian (Silurian) granites; 10 – geological boundary; 11 – faults and ring faults; 12 – craters; 13 – gold deposits; 14 – sample locations.
The Baitan caldera, in the southeastern part of the Dehua area, is exposed over an area of ~4 km2 and is characterized by concentrically zoned volcanic rocks and a ring fault (Fig. 2b). The caldera is composed of intermediate–acid volcanic rocks at the surface. They are intruded by rhyolite porphyry and porphyritic gabbro and diorite. In order to explore the characteristics of the deep volcanic strata, a borehole, located in the northwestern section of the Baitan caldera, was drilled through all the volcanic strata into the underlying Changlin Formation on 13 January 2018. The drill core (ZK001) consists of the Changlin Formation, composed of 150 m thick sedimentary rocks, and the overlying volcanic–sedimentary strata comprising ~850 m thick felsic volcanic rocks and interbedded sedimentary rocks (Fig. 3). Hence, it is representative of the characteristics of the late Mesozoic volcanism in the Baitan caldera and the southeastern Dehua area.

Fig. 3. Columnar section of ZK001 in the Baitan caldera showing the rock combinations of the three volcanic units and sampling horizons and corresponding ages in this work.
3. ZK001 drill core description and petrography
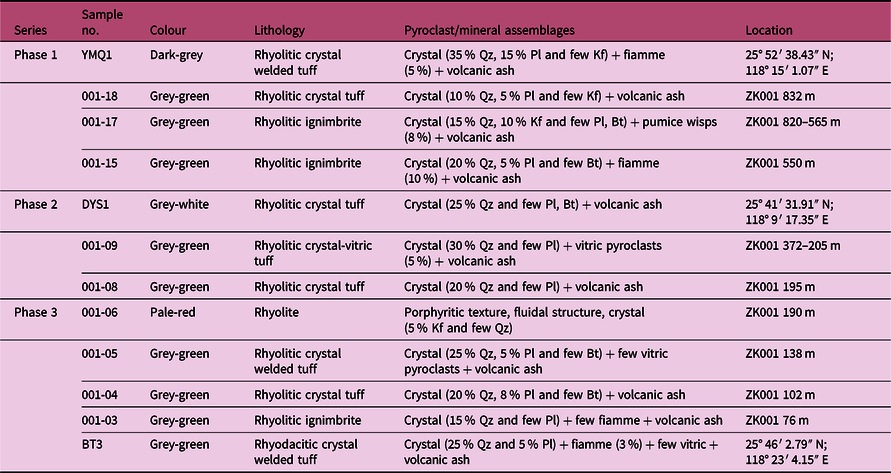
The samples for this study were primarily collected from a drill core (ZK001) in the Baitan caldera along with representative sections of the Nanyuan Formation in the Dehua region. A total of 31 samples were collected for geochemical and age analyses. The locations of the studied samples are shown in Figures 2 and 3, and the detailed lithological information and GPS positions of the studied samples are given in Table 1.
Table 1. Lithologies, pyroclast assemblages and sample locations of the late Mesozoic volcanic rocks from the Dehua area
According to the lithofacies, rock combinations and sedimentary intercalations in the drill core, the volcanic rocks in the Baitan caldera can be divided into three volcanic units (Fig. 3), representing three stages of caldera-forming eruptions. The first eruption formed pyroclastic density currents with a total thickness of ~350 m (the 18th to 15th layers of the drill core; Fig. 3). The base of the volcanic products is rhyolitic crystal tuff with quartz, plagioclase and biotite crystal fragments (Fig. 4a) and a small amount of glassy pumice wisps (< 3 %). The middle and upper parts are rhyolitic ignimbrite. Compacted and deformed still glassy pumice wisps and shards define a foliation, which is deflected around quartz, feldspar and biotite crystal fragments and lithoclasts (Fig. 4b, c). The first stage of volcanic activity ended with an ignimbrite containing minor fiamme (Fig. 4d) at the 15th layer of the drill core. There is an ~40 m thick sedimentary sequence at the top of the first volcanic unit (the 14th layer; Fig. 3), indicating a long volcanic intermission. The second volcanic unit, encompassing the 13th to 8th layers of the drill core, consists of rhyolitic ignimbrite, crystal-vitric tuff and crystal tuff, and has a thickness of ~300 m. The ignimbrite from the 13th layer has a flow-like structure, with 10 % crystal fragments in the lower part and 35 % crystal fragments in the upper part. The vitric pyroclasts, devitrified and recrystallized, are curved and chicken-bone shaped (Fig. 4e). Most crystal fragments are quartz, with obvious high-temperature biconical crystalline forms (Fig. 4f). Minor tuffaceous siltstones also occur at the top of the second volcanic unit (Fig. 4g). The third volcanic unit at the top of the drill core is dominated by flow-banded rhyolite (Fig. 4h) and rhyodacitic crystal welded tuff with a thickness of at least 200 m, and does not contain any sedimentary intercalations, which is different from the first and second units, indicating a continuous volcanic eruption (Fig. 3). The flow bands are typically up to 0.5–2 mm wide, and the rhyolites also have a spherulitic structure (Fig. 4i) and large glomerocrysts (Fig. 4j). The upper layer of the drill core and outcrop in the Baitan caldera is rhyodacitic crystal welded tuff, with 25 % crystal fragments, minor lithoclasts, fiamme and recrystallized glassy pumice wisps (Fig. 4k). The accessory mineral assemblage is magnetite, apatite, zircon, monazite and titanite in most felsic volcanic samples.
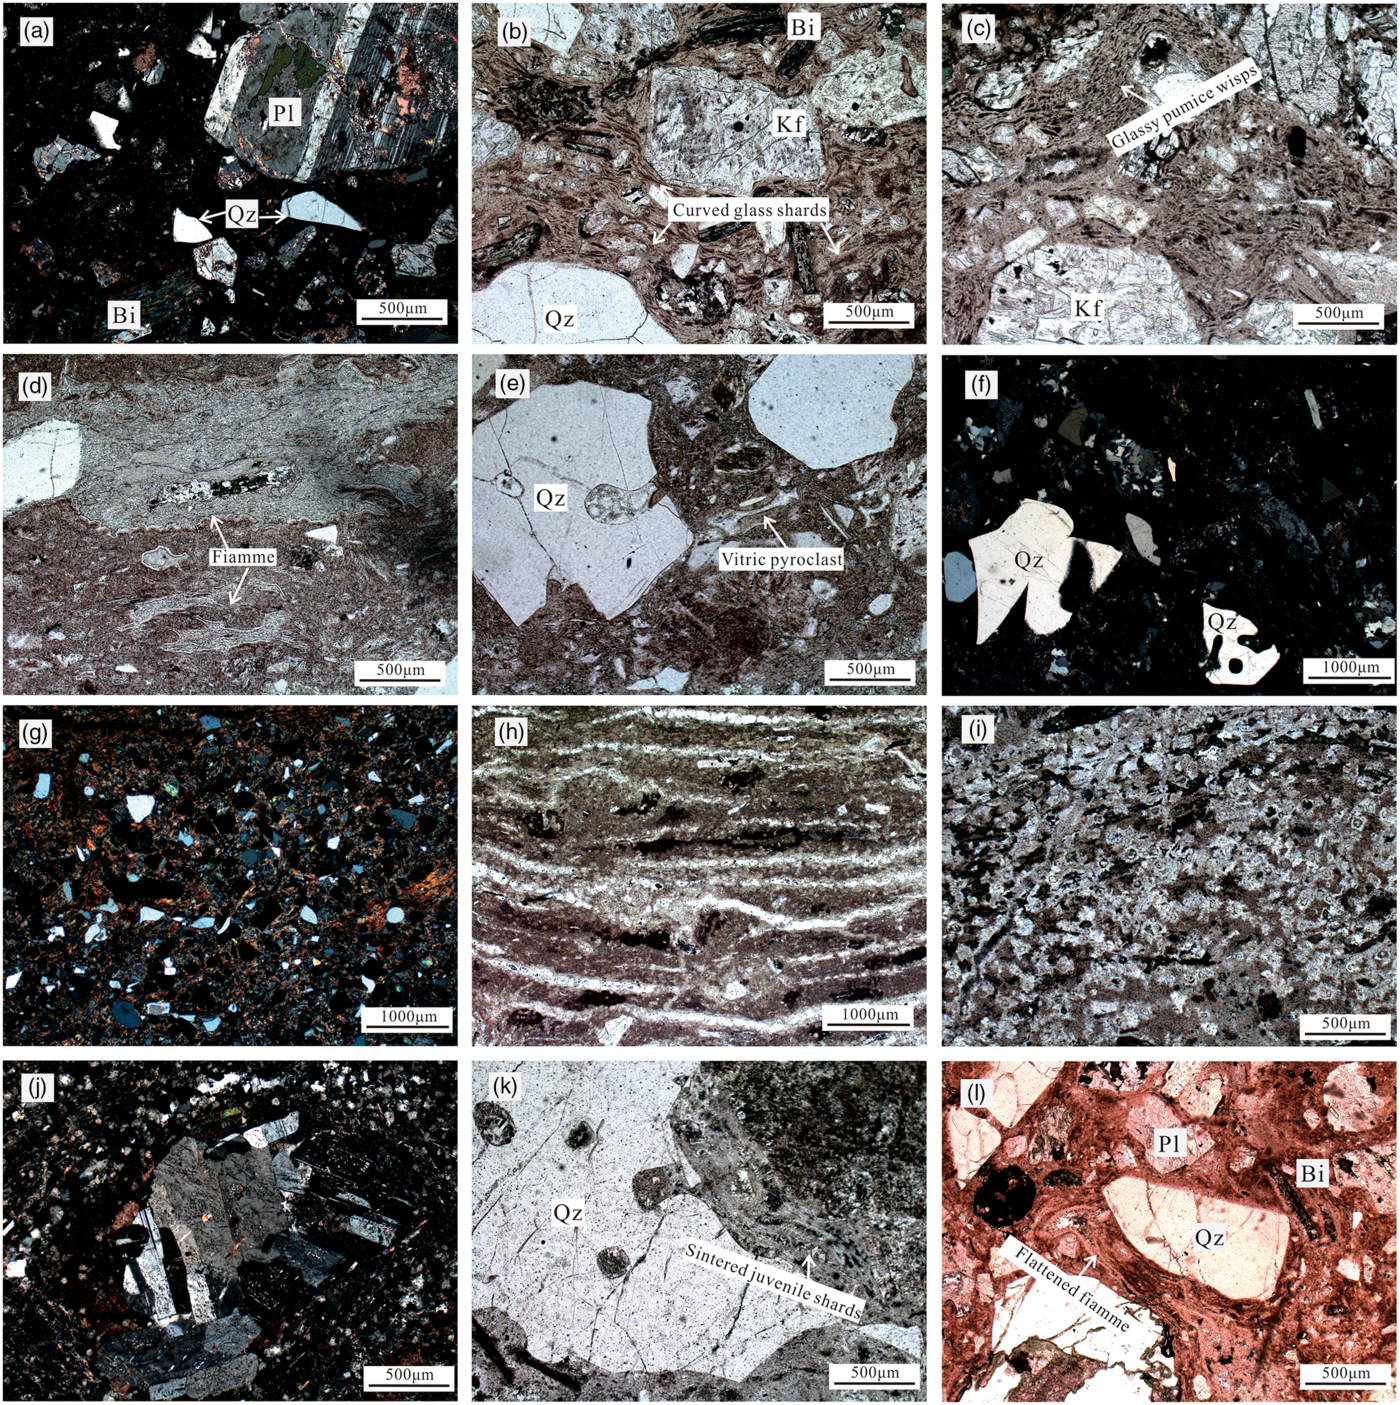
Fig. 4. Photomicrographs of the volcaniclastic rocks in the Dehua area (a, f, g and j in crossed nicols; others in parallel nicols). (a) Rhyolitic crystal tuff from the bottom of the drill core, showing the crystal fragments with a small amount of glassy pumice wisps. (b, c) Rhyolitic ignimbrite from the upper part of the first volcanic unit, showing an amount of crystal fragments and curved glass shards. (d) Rhyolitic ignimbrite from sample 001-15 with minor lacerated fiamme. (e) Rhyolitic crystal-vitric tuff from the second volcanic unit, showing the chicken-bone shaped vitric pyroclasts. (f) Rhyolitic crystal tuff from the upper part of the second volcanic unit. (g) Tuffaceous siltstones from the top part of the second volcanic unit. (h, i, j) Rhyolite from the bottom of the third volcanic unit, showing fluidal structure, spherulitic structure and large glomerocrysts of plagioclase. (k) Rhyodacitic crystal welded tuff from outcrop of the Baitan caldera, with crystal fragments and sintered juvenile shards. (l) Rhyolitic crystal welded tuff of sample YMQ1, showing crystal fragments and flattened fiamme. Qz – quartz; Kf – K-feldspar; Pl – plagioclase; Bi – biotite.
Two samples from outcrops in the study area were taken from the Nanyuan Formation (Fig. 2a). Sample YMQ1 from the northern part of study area is rhyolitic crystal welded tuff, with quartz, plagioclase and biotite crystal fragments and flattened fiamme (Fig. 4j). Its lithology is similar to the first volcanic unit. In contrast, sample DYS1 from the southwestern part of study area is rhyolitic crystal tuff, containing 15 % quartz and a few plagioclase crystal fragments, which is the same as the second volcanic unit.
4. Analytical methods
4.a. Zircon U–Pb isotope analyses
Zircon grains were separated from the volcanic rock samples through crushing and conventional magnetic and heavy liquid separation methods followed by handpicking under a binocular microscope. The selected grains were then mounted on adhesive tape, enclosed in epoxy resin and polished to approximately one-third to one-half their thickness for analysis. Cathodoluminescence (CL) images of the zircon grains were taken using a Mono CL3 detector (manufactured by Gatan, USA) attached to a scanning electron microscope (manufactured by JSM6510, JEOL, Japan) at the Nanjing Hongchuang Geological Exploration Technology Service Co. Ltd. These images helped in the selection of suitable spots for in situ U–Pb dating, rare earth element analysis and Lu–Hf analysis.
Zircon U–Pb dating was carried out using a Thermo X2 inductively coupled plasma mass spectrometer (ICP-MS; Thermo Corporation, USA). The ablation system was a GeoLas Pro (Coherent, Germany), which was hosted at the Analysis Centre in the Shandong Bureau of China Metallurgical Geology Bureau. Each analysis incorporated a background acquisition of ~20–30 s (gas blank), followed by 50 s of data acquisition from the sample. The ablated aerosol was carried by helium. Every seventh sample analysis was followed by two standard zircon 91500 (Wiedenbeck et al. Reference Wiedenbeck, Alle, Corfu, Griffin, Meier, Oberli, Quadt, Roddick and Spiegel1995), two NIST SRM610 and one PL measurement. The zircon U–Pb isotopic ratio was corrected by using zircon 91500 as an external standard. A detailed description of the analytical technique was reported by Ding et al. (Reference Ding, Liu and Yan2015). Fractionation correction and results were calculated by ICP-MS dataCal (Liu et al. Reference Liu, Gao, Hu, Gao, Zong and Wang2010). Common Pb was corrected using the method described by Anderson (Reference Anderson2002). The results were calculated using Isoplot/Ex_ver3 (Ludwig, Reference Ludwig2003).
4.b. Zircon Lu–Hf isotope analysis
Zircon Lu–Hf isotope analysis was conducted on the same spot as the previous U–Pb analyses according to the CL images, using a New Wave UP193FX laser-ablation microprobe attached to a Neptune multi-collector ICP-MS in the Experimental Testing Laboratory of Tianjin Centre of the China Geological Survey. The instrumental conditions and data acquisition were similar to those described by Wu et al. (Reference Wu, Yang, Xe, Yang and Xu2006) and Hou et al. (Reference Hou, Li, Zou, Qu, Shi and Xie2007). Analyses were performed predominantly with a beam diameter of 35 μm and a repetition rate of 8 Hz. Both He and Ar carrier gases were used to transport the ablated sample from the laser-ablation cell via a mixing chamber to the ICP-MS torch. Atomic masses 172, 173, 175 to 180 and 182 were simultaneously measured in the static-collection mode. Corrections for isobaric interference of 176Yb and 176Lu on 176Hf referred to Iizuka & Hirata (Reference Iizuka and Hirata2005), Wu et al. (Reference Wu, Yang, Xe, Yang and Xu2006) and Hou et al. (Reference Hou, Li, Zou, Qu, Shi and Xie2007). The reference zircon Mud Tank (176Hf/177Hf = 0.282507 ± 6; Woodhead & Hergt, Reference Woodhead and Hergt2005) and the standard zircon 91500 (176Hf/177Hf = 0.282284 ± 3; Wiedenbeck et al. Reference Wiedenbeck, Alle, Corfu, Griffin, Meier, Oberli, Quadt, Roddick and Spiegel1995) were used to monitor performance conditions and analytical accuracy.
The initial Hf values (in terms of ϵ Hf) were calculated using a decay constant of 1.867 × 10⁻¹¹ per year (Söderlund et al. Reference Söderlund, Patchett, Vervoort and Isachsen2004) for 176Lu and a chondritic model with 176Hf/177Hf = 0.282772 and 176Lu/177Hf = 0.0332 (Blichert-Toft & Albarede, Reference Blichert-Toft and Albarède1997). Depleted mantle Hf model ages (T DM) were calculated using the measured 176Lu/177Hf ratios of the zircons, referring to a model of depleted mantle with a present-day 176Hf/177Hf ratio of 0.28325 and 176Lu/177Hf = 0.0384 (Griffin et al. Reference Griffin, Pearson, Belousova, Jackson, Achterbergh, O’Reilly and Shee2000). ‘Crustal’ model ages (T DM2) were also calculated by projecting the initial 176Hf/177Hf ratios of the zircons onto the depleted mantle model growth line using a mean 176Lu/177Hf value (0.015) for the average continental crust (Griffin et al. Reference Griffin, Wang, Jackson, Pearson, O’Reilly, Xu and Zhou2002).
4.c. Major- and trace-element analysis
All major- and trace-element analyses for the samples were conducted at the National Geological Experimental Testing Centre, China Geological Survey. The major elements were determined by wavelength-dispersive X-ray fluorescence spectrometry (XRF) on fused glass, following a procedure described by Norrish & Hutton (Reference Norrish and Hutton1969) and with analytical uncertainties better than 0.5 %. For trace-element analyses, ~50 mg of the powdered sample was digested using a HF + HNO3 mixture in high-pressure Teflon bombs at 190 °C for 72 h. Rh was used as an internal standard to monitor signal drift during ICP-MS measurement. The trace elements were measured using a Finnigan Element II ICP-MS. Standards and duplicate analyses indicated that the precision of the trace-element analyses was generally better than 5 %, and the accuracy was better than 10 %.
5. Results
5.a. Zircon U–Pb ages
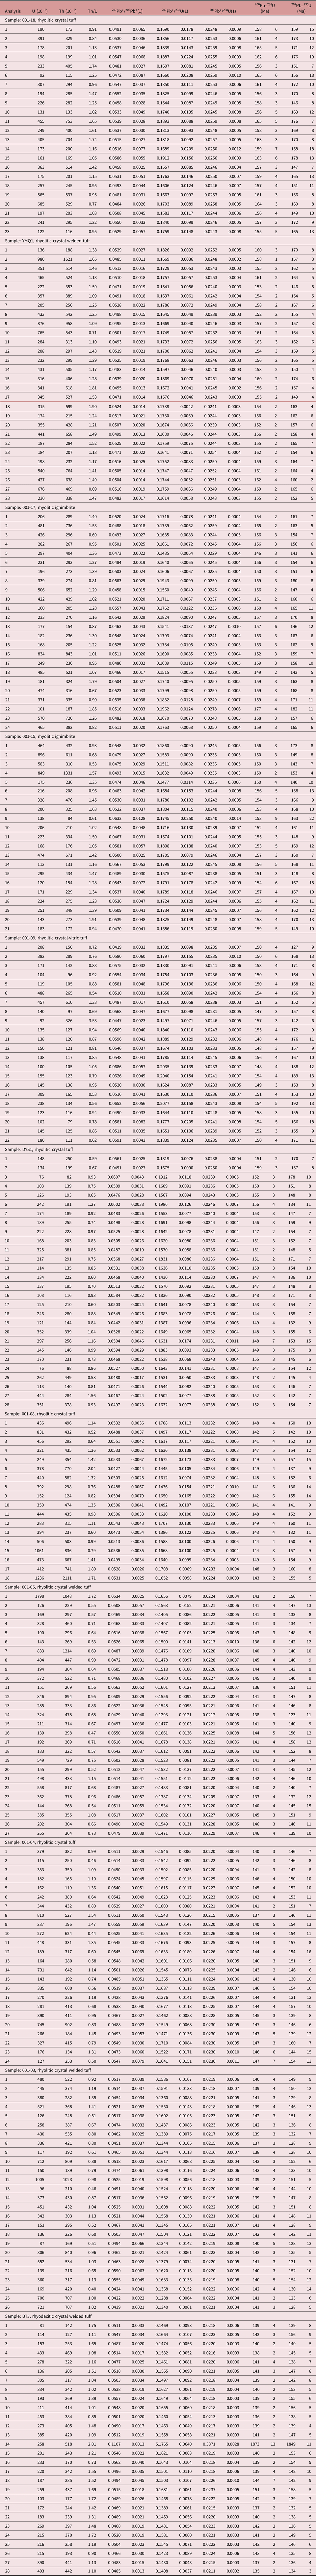
CL images of representative zircon grains and the Concordia diagrams and weighted averages of the zircon U–Pb dating are presented in Figure 5. The detailed dating results are listed in Table 2. Because of errors in counting statistics during the analysis, the 207Pb–206Pb ages are more precise for older (> 1 Ga) zircons, whereas the 206Pb–238U ages are more precise for younger zircons (Griffin et al. Reference Griffin, Belousova, Shee, Pearson and O’Reilly2004). Therefore, we use the 206Pb–238U ages for the zircons in the following discussion.
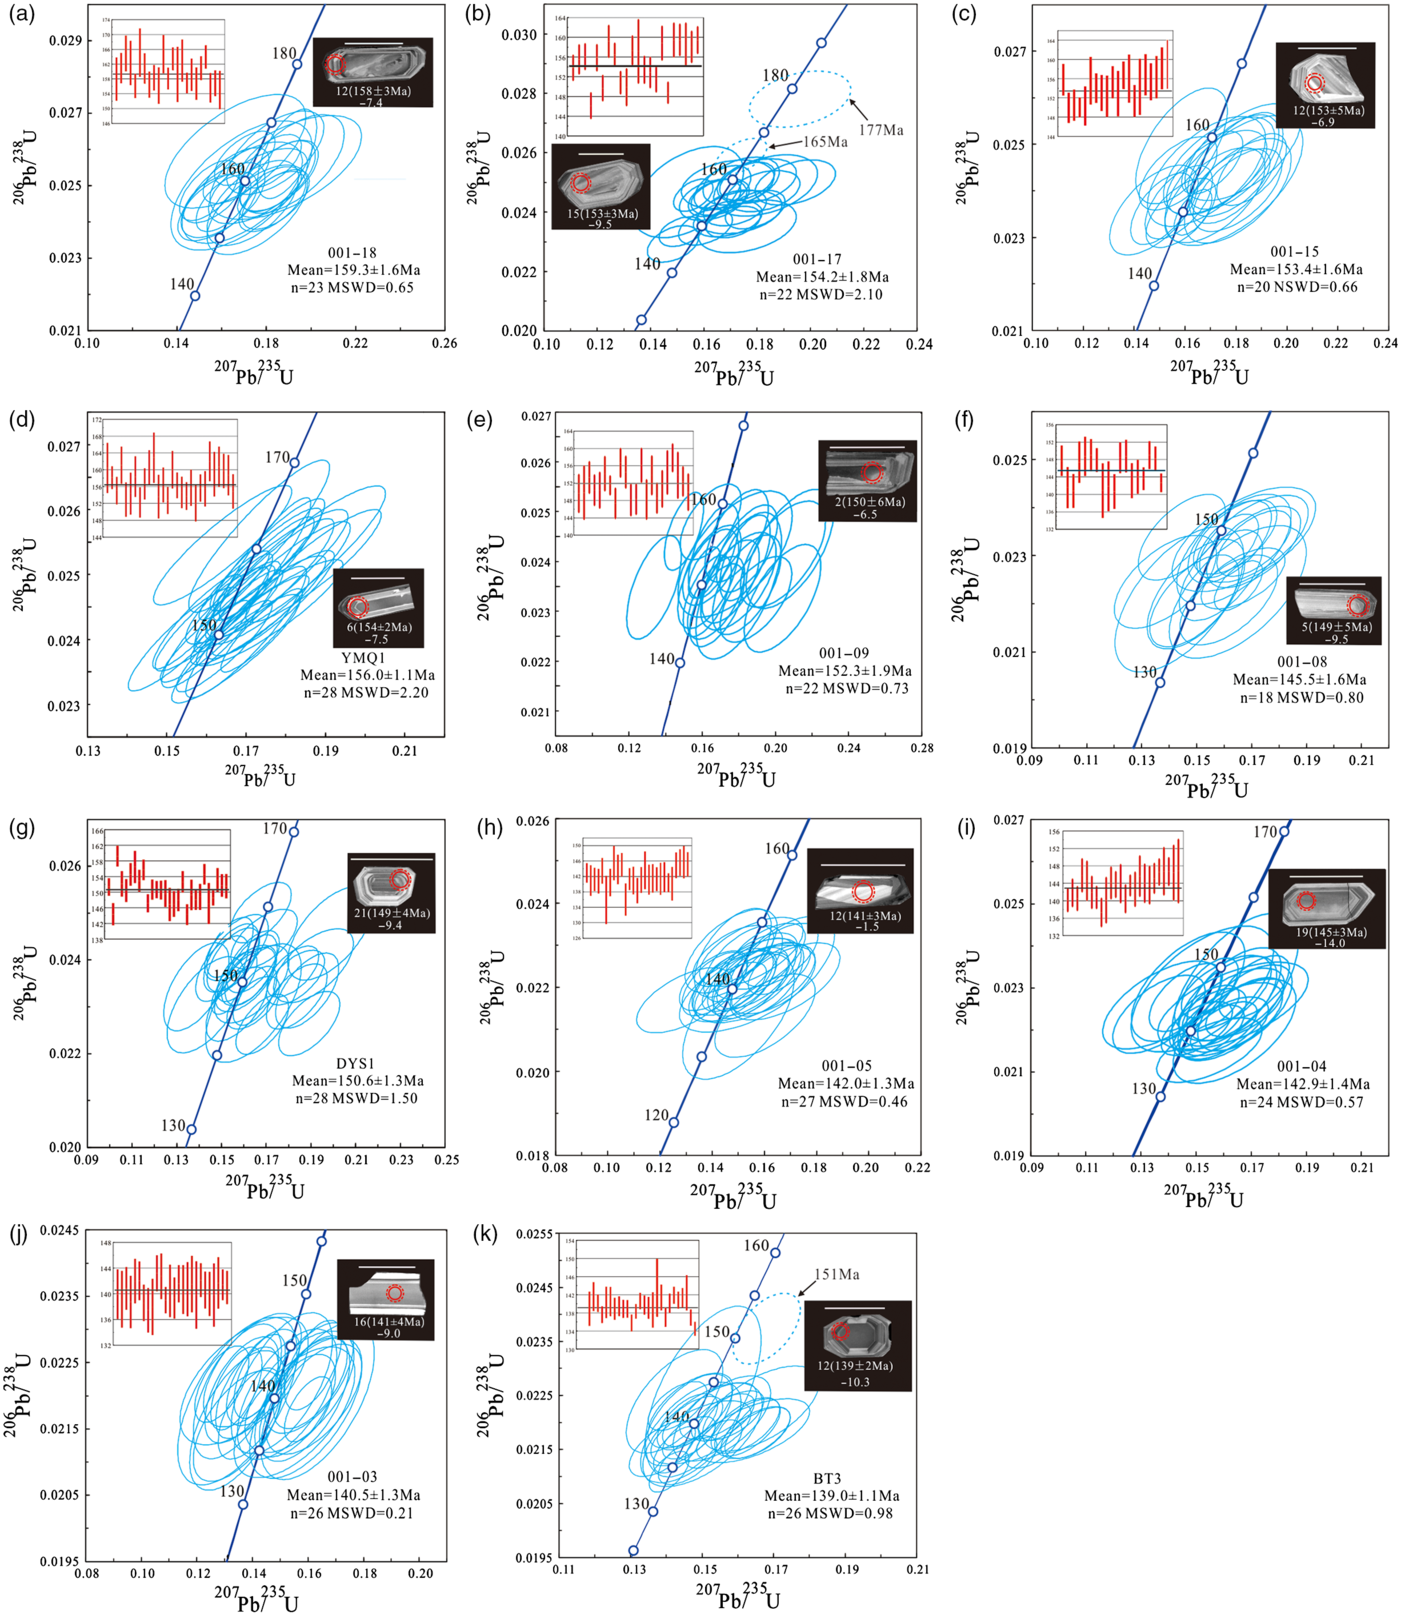
Fig. 5. CL images of representative zircon grains and zircon U–Pb Concordia diagrams and weighted average 206Pb–208Pb ages for volcanic rocks of the (a–d) first, (e–g) second and (h–k) third volcanic units. Smaller solid circles indicate the spots for U–Pb dating, whereas larger dashed circles indicate the spots for Hf isotope analyses. Age and ϵ Hf(t) values are also shown for each spot. All scale bars = 100 μm.
Table 2. LA-ICP-MS zircon U–Pb isotopic dating results for the volcanic rocks in the Dehua area
5.a.1. The first volcanic unit
All the zircons from the samples of the first volcanic unit of the Baitan caldera are euhedral and typically 100–250 μm long. They exhibit well-developed growth zoning with corresponding high Th/U ratios (> 0.5), which are typical characteristics of igneous zircons (Belousova et al. Reference Belousova, Griffin, O’Reilly and Fisher2002). Most of them are relatively transparent and colourless.
Twenty-three analyses on zircons from a rhyolitic crystal tuff from the bottom of the drill core (001-18, Fig. 4a) are all concordant and yield a weighted mean 206Pb–238U age of 159.3 ± 1.6 Ma (1σ; MSWD = 0.65; Fig. 5a), representing the beginning of the Baitan caldera eruption. Twenty-two analyses on zircons from rhyolitic ignimbrite from the middle part of the first volcanic unit (001-17, Fig. 4b, c) are all concordant and yield a weighted mean 206Pb–238U age of 154.2 ± 1.8 Ma (1σ; MSWD = 2.1; Fig. 5b). Meanwhile, two grains from this sample record older 206Pb–238U ages of 164.5 ± 2.5 Ma and 176.8 ± 3.9 Ma (Fig. 5b), which are in good agreement with the Middle Jurassic volcanism in the Qiucun area of the Dehua region (169~163 Ma, Li, S. N. et al. Reference Li, Ni, Wang, Bao, Huang and Dai2020), implying that they are xenocrysts. Twenty-one analyses on zircons from a rhyolitic ignimbrite from the upper part of the third volcanic unit (001-15, Fig. 4d) show a concordant and consistent age, with a weighted mean 206Pb–238U age of 153.4 ± 1.6 Ma (1σ; n = 20; MSWD = 0.66; Fig. 5c), with the exception of one zircon that was removed from the age calculation because of the excess error beyond the error level of the calculated weighted mean age. These three samples from the lower, middle and upper parts define the formation age of the first volcanic unit, ranging from 159 to 153 Ma.
Zircons from the rhyolitic crystal welded tuff (Fig. 4l) from the outcrop in the northern part of study area (Fig. 2a) are short-columnar, euhedral and small (≤ 150 μm). CL images and Th/U ratios indicate a typical magmatic origin. Twenty-eight concordant results yield a weighted mean 206Pb–238U age of 156.0 ± 1.1 Ma (1σ; MSWD = 2.2; Fig. 5d). Its lithology and age are similar to the lower part of the drill core, suggesting it belongs to the first volcanic unit.
According to the zircon U–Pb ages, the first volcanic unit is referred to the early stage of the Late Jurassic volcanic rocks (Phase 1 volcanic rocks).
5.a.2. The second volcanic unit
All zircon grains from the samples of the second volcanic unit of the Baitan caldera are euhedral and 100–200 μm long. They all show clear oscillatory zonations with high Th/U ratios of magmatic origin. All the analyses are concordant with a weighted mean 206Pb–208U age of 152.3 ± 1.9 Ma (001-09; 1σ; n = 22; MSWD = 0.73; Fig. 5e) and 145.5 ± 1.6 Ma (001-08; 1σ; n = 18; MSWD = 0.80; Fig. 5f) for the middle and upper parts of the second volcanic unit, respectively. One sample from a rhyolitic crystal tuff from the outcrop in the southern part of the study area (Fig. 2a) shows a concordant and consistent age, with a weighted mean 206Pb–238U age of 150.6 ± 1.3 Ma (DYS1, 1σ; n = 28; MSWD = 1.5; Fig. 5g). Its lithology and age are similar to the middle part of the drill core, suggesting it belongs to the second volcanic unit. These results demonstrate a formation age of the second volcanic unit ranging from 152 to 146 Ma, and the second unit can be referred to the late stage of the Late Jurassic volcanic rocks (Phase 2 volcanic rocks).
5.a.3. The third volcanic unit
All zircons from samples from the third volcanic unit of the drill core are euhedral and typically 100–250 μm long. They exhibit well-developed growth zoning with corresponding high Th/U ratios (> 0.4), which are typical characteristics of igneous zircons.
Three samples from different layers of the drill core show concordant and consistent ages, with weighted mean 206Pb–238U ages of 142.0 ± 1.3 Ma (001-05; 1σ; n = 27; MSWD = 0.46; Fig. 5h), 142.9 ± 1.4 Ma (001-04; 1σ; n = 24; MSWD = 0.57; Fig. 5i) and 140.5 ± 1.3 Ma (001-03; 1σ; n = 26; MSWD = 0.21; Fig. 5j). One sample of the rhyodacitic crystal welded tuff from the outcrop area of the Baitan caldera (BT3, Fig. 2b) yielded 28 analyses. Two grains record older 206Pb–238U ages of 151.2 ± 2.9 Ma and 1872.5 ± 13.4 Ma. The former is a captured zircon from the Late Jurassic volcanic rocks and the latter is likely derived from the Palaeoproterozoic basement of the Cathaysia Block. The other 26 grains are all concordant and yield a weighted mean 206Pb–238U age of 139.0 ± 1.1 Ma (1σ; MSWD = 0.98; Fig. 5k), representing the ending of the Baitan caldera eruption. The third volcanic unit, with a formation age ranging from 143 to 139 Ma, can be referred to the early stage of the Early Cretaceous volcanic rocks (Phase 3 volcanic rocks).
5.b. Major and trace elements
All major- and trace-element analysis results are shown in Table 3.
Table 3. Major- (wt %) and trace-element (ppm) compositions of volcanic rocks in the Dehua area
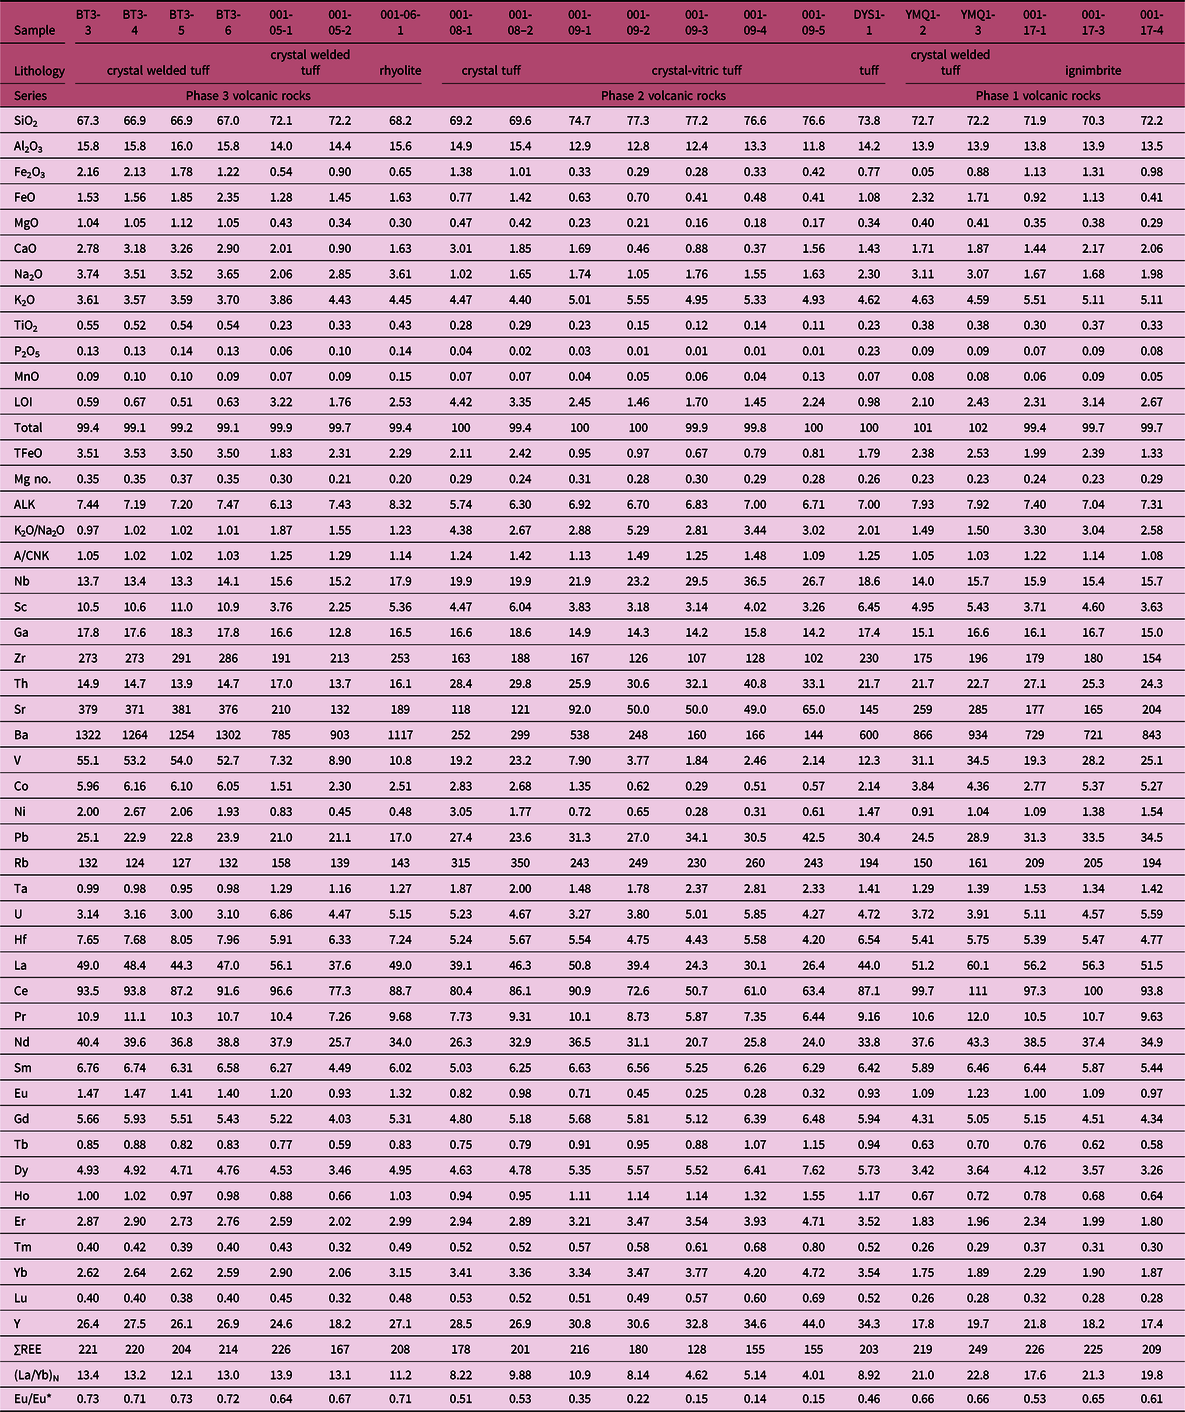
TFeO = FeO + Fe2O3 * 0.8998; Mg no. = molar MgO/(MgO + TFeO); Eu/Eu* = EuN/(SmN*GdN)1/2; N = chondrite-normalized.
5.b.1. Phase 1 volcanic rocks
The Phase 1 volcanic rocks have SiO2 contents of 70.3–72.7 wt %. They all fall in the rhyolite field on the TAS diagram (Fig. 6a). They have moderate alkali contents (Na2O + K2O = 7.04–7.93 wt %), relatively high K2O contents (4.59–5.51 wt %) and plot in the high-K calc-alkaline field on the K2O versus SiO2 diagram (Fig. 6b). They are peraluminous with A/CNK (molar Al2O3/(CaO + Na2O + K2O)) values of 1.03–1.22 (Fig. 6c).
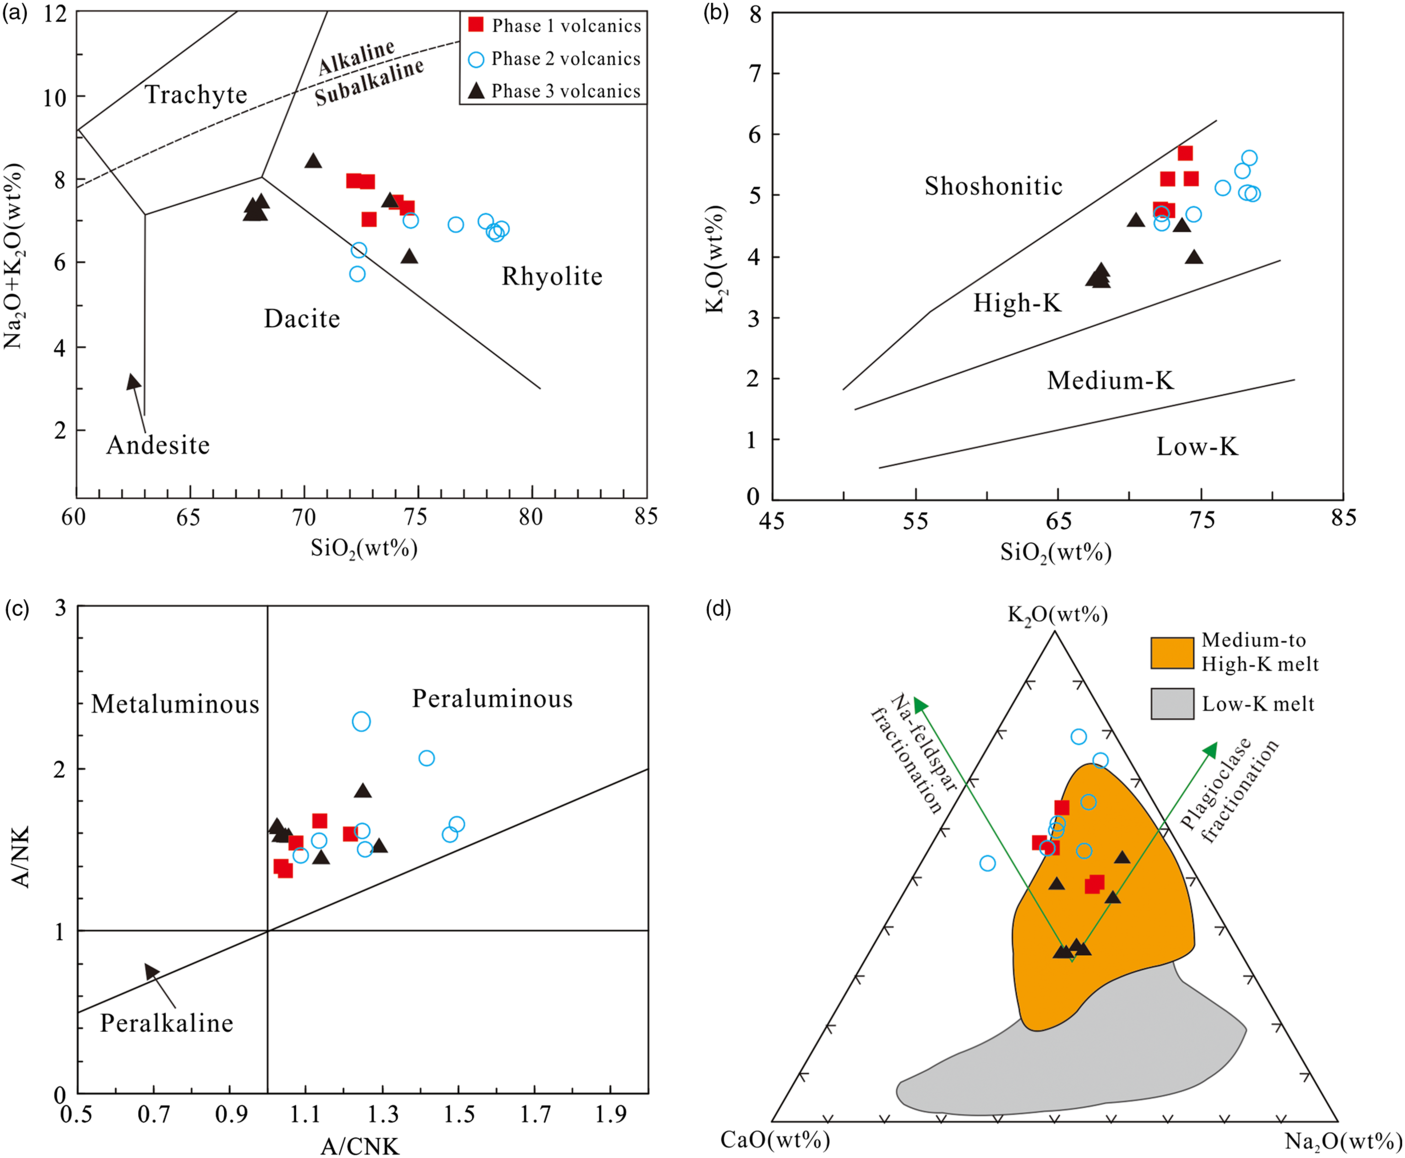
Fig. 6. Classification of the late Mesozoic volcanic rocks from the Dehua area based on (a) the total alkali v. silica (TAS) diagram (after Middlemost, Reference Middlemost1994); (b) K2O v. SiO2 diagram (after Le Bas, Reference Le Bas1986); (c) A/NK v. A/CNK plot; (d) K2O–Na2O–CaO triangle plot (after Guo et al. Reference Guo, Fan, Li, Zhao, Li and Yang2012).
The Phase 1 volcanic rocks have relatively high total rare earth element (∑REE) contents of 209–249 ppm and exhibit a strong enrichment of light REEs (LREEs) compared to heavy REEs (HREEs) with (LaN/YbN) ratios ranging from 17.6 to 22.8. They also show notable negative Eu anomalies (Eu/Eu* = 0.53–0.66; Fig. 7a). Primitive mantle-normalized trace-element patterns of the samples show significant negative Ba, Sr, Nb, Ta, Ti and P anomalies (Fig. 7b).

Fig. 7. (a) Chondrite-normalized REE patterns and (b) primitive mantle-normalized multiple trace-element diagrams for the late Mesozoic volcanic rocks in the Dehua area. The chondrite and primitive mantle values are from Sun & McDonough (Reference Sun, McDonough, Sun, McDonough, Saunders and Norry1989).
5.b.2. Phase 2 volcanic rocks
The Phase 2 volcanic rocks have SiO2 contents of 69.2–77.3 wt %. They almost fall in the rhyolite field on the TAS diagram (Fig. 6a). They have moderate alkali contents (Na2O + K2O = wt %), relatively high K2O contents (4.40–5.55 wt %) and plot in the high-K calc-alkaline field on the K2O versus SiO2 diagram (Fig. 6b). They are strongly peraluminous with A/CNK values of 1.09–1.49 (Fig. 6c).
The Phase 2 volcanic rocks have relatively low total REE contents of 128–216 ppm and exhibit a weak enrichment of LREEs compared to HREEs with (LaN/YbN) ratios ranging from 4.01 to 10.9. They also show the most notable negative Eu anomalies (Eu/Eu* = 0.14–0.53; Fig. 7a). Primitive mantle-normalized trace-element patterns of the samples show significant negative Ba, Sr, Nb, Ta, Ti and P anomalies (Fig. 7b).
5.b.3. Phase 3 volcanic rocks
The Phase 3 volcanic rocks have SiO2 contents of 66.9–72.2 wt %. They fall in the dacite and rhyolite field on the TAS diagram (Fig. 6a). They have high alkali contents (Na2O + K2O = 6.13–8.32 wt %), relatively low K2O contents (3.57–4.45 wt %) and plot in the high-K calc-alkaline field on the K2O versus SiO2 diagram (Fig. 6b). They are peraluminous with A/CNK values of 1.02–1.29 (Fig. 6c).
The Phase 3 volcanic rocks have relatively high total REE contents of 167–226 ppm and exhibit an enrichment of LREEs compared to HREEs with (LaN/YbN) ratios ranging from 11.2 to 13.9. They also show weak negative Eu anomalies (Eu/Eu* = 0.64–0.73; Fig. 7a). Primitive mantle-normalized trace-element patterns of the samples show negative Ba, Nb, Ta, Ti and P anomalies (Fig. 7b).
Generally, with increasing SiO2, contents of Fe2O3, MgO, Al2O3 and TiO2 from the late Mesozoic volcanic samples systematically decrease (Fig. 8), suggesting a process of magmatic differentiation. However, coherent variations between SiO2 and most trace elements in the Phase 1 and 3 volcanic rocks are lacking (Fig. 9), implying that fractional crystallization alone could not produce the observed trace-element variations.

Fig. 8. Major oxides v. SiO2 (in wt %) diagrams for the Mesozoic felsic volcanic rocks in the Dehua area.
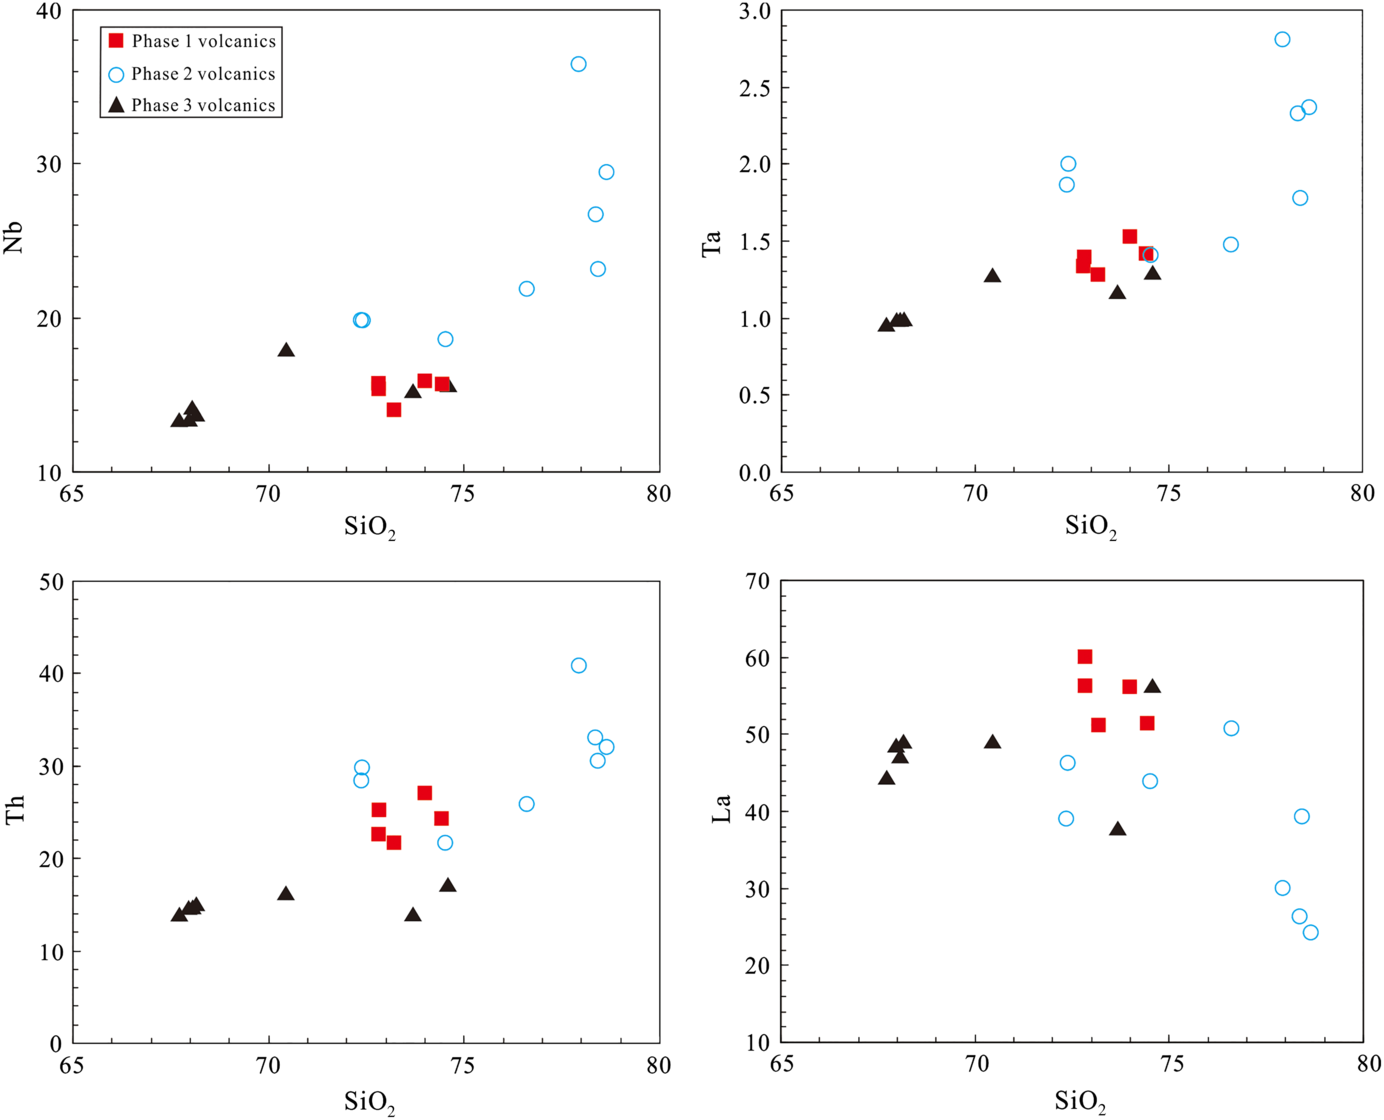
Fig. 9. selected trace elements v. SiO2 (in ppm) diagrams for the Mesozoic felsic volcanic rocks in the study area.
5.c. Zircon Hf isotopic compositions
A total of 11 samples were chosen for zircon Lu–Hf analyses. The zircon Hf analyses were performed on the same grains as those used for U–Pb dating (Fig. 5). The results of the Lu–Hf isotopic analyses are given in Table 4, and the frequency distribution diagrams of ϵ Hf(t) and T DM2 values are presented in Figure 10.
Table 4. Zircon Lu–Hf isotope compositions of the volcanic rocks in the Dehua area


Fig. 10. Histograms of (a) ϵHf(t) values and (b) T DM2 from the three stages of volcanic rocks.
5.c.1. Phase 1 volcanic rocks
The zircon Hf isotopic compositions of three samples, 001-18, 001-17 and 001-15, from the drill core are nearly identical. Twenty analyses for sample 001-18 from the bottom of the drill core yield initial 177Hf/176Hf ratios that range from 0.282371 to 0.282522 and ϵ Hf(t) values from −10.6 to −5.3 (average −8.0), corresponding to two-stage model ages (T DM2) of 1.88–1.54 Ga. Nineteen analyses for sample 001-17 from the drill core yield initial 177Hf/176Hf ratios that range from 0.282391 to 0.282553 and ϵ Hf(t) values from −10.0 to −4.4 (average −8.0), corresponding to T DM2 of 1.84–1.48 Ga. One zircon xenocryst with a 165 Ma age yields an ϵ Hf(t) value of −8.4. Twenty analyses for sample 001-15 from the drill core yield initial 177Hf/176Hf ratios that range from 0.282382 to 0.282545 and ϵ Hf(t) values from −10.4 to −4.7 (average −7.5), corresponding to T DM2 of 1.86–1.50 Ga. One sample YMQ1 also shows similar zircon Hf isotopic compositions. Twenty-four analyses yield initial 177Hf/176Hf ratios that range from 0.282374 to 0.282512 and ϵ Hf(t) values from −10.7 to −5.9 (average −8.3), corresponding toT DM2 of 1.88–1.57 Ga.
All four samples have relatively homogeneous zircon Hf isotope compositions. A total of 83 zircon grains yield initial 177Hf/176Hf ratios of 0.282371–0.282553 and ϵ Hf(t) values from −10.7 to −4.4, corresponding to T DM2 of 1.88–1.48 Ga (Fig. 10).
5.c.2. Phase 2 volcanic rocks
Two samples from different depths in drill core ZK001 and one sample from an outcrop were selected for Lu–Hf analysis. Zircon Hf isotope analyses were conducted on 20 grains from sample 001-09 from the lower part of the J32 volcanic rocks. These analyses yield initial 177Hf/176Hf ratios of between 0.282441 and 0.282560, and ϵ Hf(t) values of between −8.3 and −4.1 (average −6.6), with T DM2 ages from 1.73 to 1.46 Ga. Concordant and similar zircon Hf isotopic compositions were obtained for samples 001-08 from the drill core and DYS1 from the outcrop. Their (177Hf/176Hf)i ratios are 0.282376–0.282478 and 0.282386–0.282497, corresponding to ϵ Hf(t) values of −10.8 to −7.2 (average −9.1; n = 13) and −10.4 to −6.5 (average −9.0; n = 22). The T DM2 model ages are 1.88–1.65 Ga and 1.85 to 1.61 Ga, respectively.
Overall, a total of 55 zircon grains yield initial 177Hf/176Hf ratios of 0.282376–0.282560 and ϵ Hf(t) values of −10.8 to −4.1, corresponding to T DM2 of 1.88–1.46 Ga, which is similar to the Phase 1 volcanic rocks (Fig. 10).
5.c.3. Phase 3 volcanic rocks
Four samples from different depths in the drill core were selected for the Lu–Hf analyses. Zircon Hf isotope analyses were conducted on 19 grains from sample 001-05 from the fifth layer of the drill core ZK001. These analyses yield initial 177Hf/176Hf ratios that range from 0.282420 to 0.282642 and ϵ Hf(t) values of between −9.5 and −1.5 (average −5.6), with T DM2 ages from 1.79 Ga to 1.29 Ga (average 1.54 Ga). Nineteen analyses for sample 001-04 yield initial 177Hf/176Hf ratios that range from 0.282287 to 0.282592 and ϵ Hf(t) values from −14.0 to −3.2 (average −7.5), corresponding to T DM2 of 2.08–1.40 Ga. Nineteen analyses for sample 001-03 from the drill core yield initial 177Hf/176Hf ratios that range from 0.282347 to 0.282692 and ϵ Hf(t) values from −12.0 to 0.2 (average −9.1), corresponding to T DM2 of 1.95–1.18 Ga. Twenty-six analyses for sample BT3 yield initial 177Hf/176Hf ratios that range from 0.282289 to 0.282560 and ϵ Hf(t) values from −14.0 to −4.4 (average −9.4), corresponding to T DM2 of 2.08–1.47 Ga. With initial 176Hf/177Hf ratios of 0.282385 and T DM2 age of 1.86 Ga, the zircon xenocryst with a 151 Ma age resembles the three contemporaneous grains of the Phase 2 volcanic rocks. Meanwhile, the captured zircon with a 1873 Ma age has a low radiogenic Hf isotope composition, with an ϵ Hf(t) value of 4.4.
A total of 83 zircon grains from the Phase 3 volcanic rocks contain more variable zircon Hf compositions than the Phase 1 and 2 volcanic rocks (Fig. 10), implying that they have different magma sources.
6. Discussion
As discussed above, the late Mesozoic volcanic rocks in the study area were generated during Late Jurassic to Early Cretaceous times (159–139 Ma) and can be divided into three volcanic units. They have different rock assemblages, whole-rock geochemistry and zircon Hf isotopic compositions, suggesting different petrogenetic and tectonic implications.
6.a. Petrogenesis
Felsic magmas can be formed in various ways, such as differentiation of mafic magmas, mixing of different magmas and crustal remelting (Guo et al. Reference Guo, Fan, Li, Zhao, Li and Yang2012). Considering the large volume of the acidic volcanic rocks in SE China, it is unlikely that they were formed by the fractionation of basaltic magma (e.g. Liu et al. Reference Liu, Xu and Xia2014; Duan et al. Reference Duan, Zhao, Xing, Yang, Yu, Chen, Jin, Jiang and Li2015). Although the Phase 3 volcanic samples contain variable zircon Hf isotopic compositions in the study area, a lot of the ϵ Hf(t) values are far below the chondritic uniform reservoir (CHUR) line in Figure 12, suggesting that magma mixing would not account for the petrogenesis of these rocks. The lack of mafic microgranular enclaves in the Late Jurassic intrusive rocks of the Dehua area also argues against magma mixing as the major petrogenetic process (Li, S. N. et al. Reference Li, Ni, Wang, Bao, Huang and Dai2020). Therefore, crustal remelting is the more likely process for generating the felsic magmas in the Dehua area. We will outline a crustal melting and crust–mantle interaction model for the formation of the Mesozoic felsic volcanic rocks.
6.a.1. Magma differentiation
Before we use element and isotope compositions to discuss the process of crustal melting, we evaluate the possible effects of magma fractionation. As mentioned above, the major-element variations against SiO2 in the Mesozoic felsic lavas may plausibly be interpreted using a differentiation model (Fig. 8). Meanwhile, the Phase 2 volcanic rocks are the most geochemically evolved compared to the other groups, displaying the highest silica but lowest MgO, Fe2O3, Al2O3, CaO and P2O5 contents, with the strongest depletion of Ba, Sr, Eu, P, Zr and Ti elements and flattest chondrite-normalized REE distribution curves (Table 3; Figs 6–8). These characteristics suggest that fractional crystallization has taken place during the formation of these volcanic rocks. Negative Nb–Ti anomalies are considered to be related to fractionation of Ti-bearing phases (ilmenite, titanite, etc.), and negative P anomalies should result from apatite separation. Low MgO contents in these volcanic rocks suggests separation of mafic minerals, and petrographic evidence favours a probable fractionation of biotite. Strong Sr, Ba and Eu depletions require extensive fractionation of plagioclase and K-feldspar (Fig. 11a–c), because the proportion of feldspar is the lowest in the Phase 2 volcanic rocks (Table 1). The decrease in REEs and (La/Yb)N ratios with increasing SiO2 may suggest a separation of accessory minerals with high partition coefficients (Wu et al. Reference Wu, Jahn, Wilde, Lo, Yui and Lin2003), such as apatite, titanite, zircon, allanite and monazite (Fig. 11d), which are important accessory minerals in these felsic volcanic rocks.

Fig. 11. (a) Ba v. Sr, (b) Rb v. Sr, (c) Eu/Eu* v. Sr and (d) (La/Yb)N v. La diagrams for the Mesozoic felsic volcanic rocks in the Dehua area, showing the possible fractional phases during magmatic evolution. Qz – quartz; Kf – K-feldspar; Pl – plagioclase; Bi – biotite; Zr – zircon; Tit – titanite; Ap – apatite; Mon – monazite; Allan – allanite.
However, the variation trends between SiO2 and most trace elements in the Phase 1 and 3 volcanic rocks cannot be explained using such a model (Fig. 9). A negative covariation between Sr and Rb suggests plagioclase and K-feldspar as the major fractional phases (Fig. 11a, b), but fractionation would have elevated La and Nb and other incompatible element concentrations in the evolved melts (Guo et al. Reference Guo, Fan, Li, Zhao, Li and Yang2012), and such covariations have not been observed in the Phase 1 and 3 volcanic rocks (Fig. 9). We thus suggest only a subordinate role of fractional crystallization in generating these volcanic rocks. The partial melting of crustal protoliths is the most important cause of geochemical variation in the Phase 1 and 3 volcanic rocks.
6.a.2. Magmatic sources
In order to characterize the magmatic sources, we used a K2O–Na2O–CaO plot to compare the Mesozoic felsic volcanic rocks and experimental crustal melts, respectively, derived from low-K and medium- to high-K protoliths (Fig. 6d; Guo et al. Reference Guo, Fan, Li, Zhao, Li and Yang2012). These comparisons suggest that the studied felsic rocks were derived from medium- to high-K protoliths. Both have relatively low Sr contents (165–285 ppm and 132–381 ppm, respectively) and show negative Eu anomalies (Fig. 7a), which require that the source region be within the stability field of plagioclase and/or K-feldspar. They also have very high Ba concentrations (721–934 ppm and 785–1322 ppm, respectively), indicating that plagioclase rather than K-feldspar is the main residual assemblage in the source. However, the Phase 1 volcanic rocks have relatively lower HREEs (Yb = 1.75–2.29 ppm) and Y (17.4–21.8 ppm) contents and exhibit relatively steeper HREE patterns (GdN/YbN = 1.72–2.06; Fig. 7b), which suggests that garnet rather than amphibole is the main residual assemblage in the source. Experiments indicate that during the dehydration-melting of thickened lower continental crust under 1.5–2.0 GPa, plagioclase + garnet is the main residual mineral assemblage (Wyllie et al. Reference Wyllie, Osmaston and Morrison1984; Zhang, W. et al. Reference Zhang, Yang, Chen, Wu and Wilde2018). Hence, we consider that the Phase 1 volcanic rocks were formed by the melting of thickened lower crust. In contrast, the Phase 3 volcanic rocks have relatively higher HREEs and lower (La/Yb)N ratios, suggesting a shallow magmatic source.
6.a.3. Contributions of mantle-derived materials
Because of the high closure temperature of the zircon Hf isotopic system, zircon can record the characteristics of different types of source rocks (Su et al. Reference Su, Mao, Santosh and Xie2014). Therefore, the zircon Hf isotope system has become an important tool to constrain the origin of magmas, especially to decipher processes of crustal evolution and mantle–crust interaction (Griffin et al. Reference Griffin, Pearson, Belousova, Jackson, Achterbergh, O’Reilly and Shee2000, Reference Griffin, Wang, Jackson, Pearson, O’Reilly, Xu and Zhou2002). Eighty-three zircons from Phase 1 volcanic rocks yield ϵ Hf(t) values between −10.7 and −4.4 and two-stage Hf model ages between 1.88 Ga and 1.48 Ga, suggesting that they were mainly generated by partial melting of ancient crustal materials. However, on the ϵ Hf(t) versus U–Pb ages diagram (Fig. 12), the Hf isotopic data from these volcanic rocks plot between the crustal basement evolution region and the CHUR line. This phenomenon indicates that there is some participation of mantle-derived materials in the diagenesis process. Under the forward subduction influence of the palaeo-Pacific plate (e.g. Zhou et al. Reference Zhou, Sun, Shen, Shu and Niu2006), melting of the wet mantle wedge produced an amount of basaltic magma that ascended and underplated beneath the lower crust (Fig. 13). The basaltic magma heated the lower continent crust materials and induced partial melting to generate acidic magma, with limited physical mixing with the mantle-derived materials. Meanwhile, the zircon Hf isotopic compositions of the Phase 2 volcanic rocks are similar to those of the Phase 1 volcanic rocks, with ϵ Hf(t) values and two-stage Hf model ages ranging from −10.8 to −4.1 and 1.88 Ga to 1.46 Ga, respectively. This characteristic suggests that the two phases of Late Jurassic volcanic rocks have the same magmatic sources. They were generated by partial melting of thickened lower crust with limited contributions of mantle-derived materials.
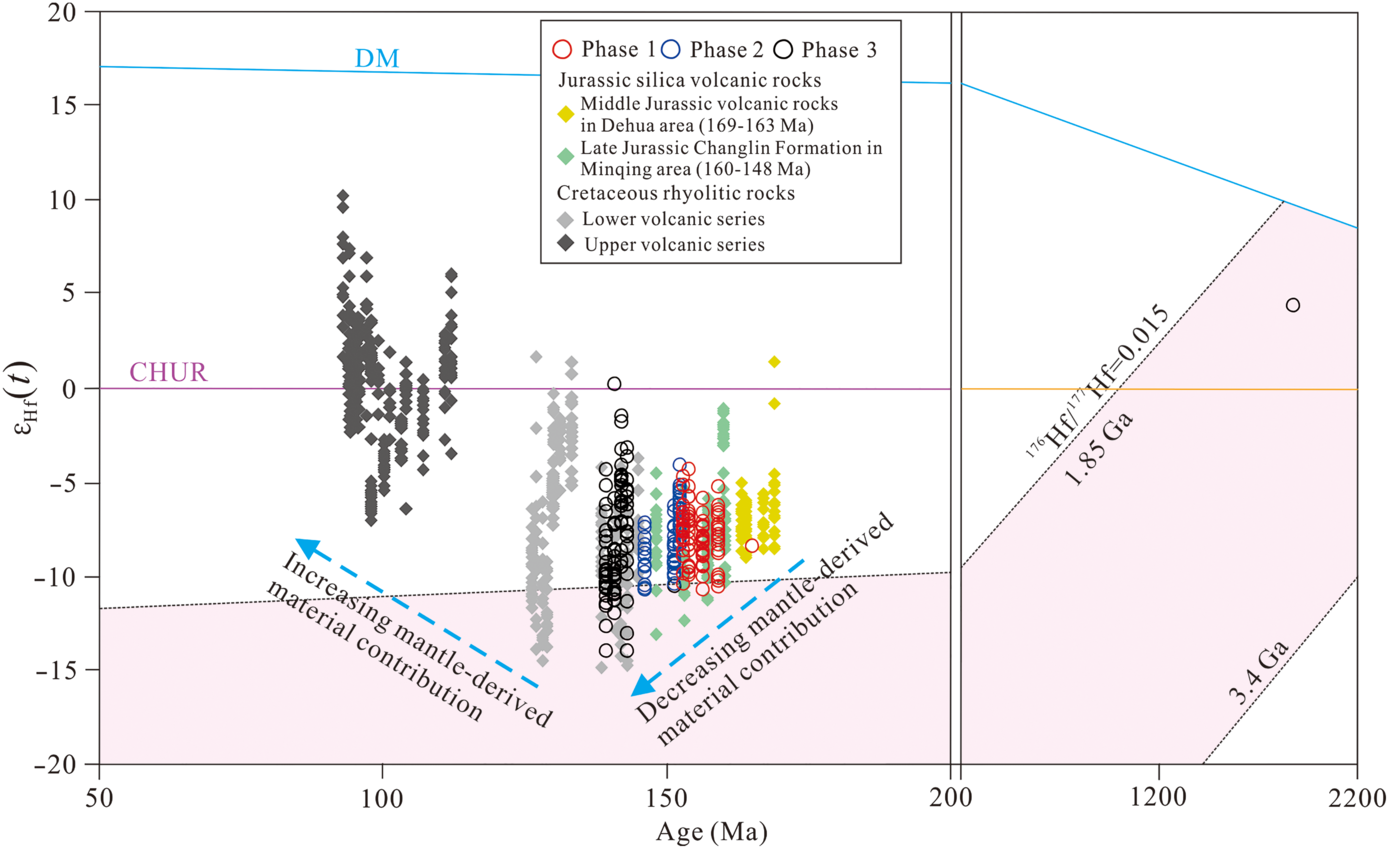
Fig. 12. ϵHf(t) v. zircon U–Pb age diagram for the late Mesozoic volcanic rocks in eastern Fujian Province; shaded region indicates Hf isotope evolution for the Cathaysia crustal basement after Liu et al. (Reference Liu, Xu and Zou2012). The data for the Middle Jurassic volcanic rocks in the Dehua area are from Li, S. N. et al. (Reference Li, Ni, Wang, Bao, Huang and Dai2020). The data for the Late Jurassic Changlin Formation in the Minqing area are from Liu et al. (Reference Liu, Xu and Xia2016). The data for the Cretaceous rhyolitic rocks of the upper and lower volcanic series are from Guo et al. (Reference Guo, Fan, Li, Zhao, Li and Yang2012), Duan et al. (Reference Duan, Zhao, Xing, Yang, Yu, Chen, Jin, Jiang and Li2015), Jiang, Y. H. et al. (2015), Liu et al. (Reference Liu, Xu and Xia2016) and Yan et al. (Reference Yan, He, Beier and Klemd2018). The increasing enriched trend in the ϵ Hf(t) values implies a decreasing mantle-derived material contribution during Middle to Late Jurassic times. In contrast, the ϵ Hf(t) values of the Cretaceous volcanic rocks show the opposite tendency, indicating an increasing mantle-derived material contribution.
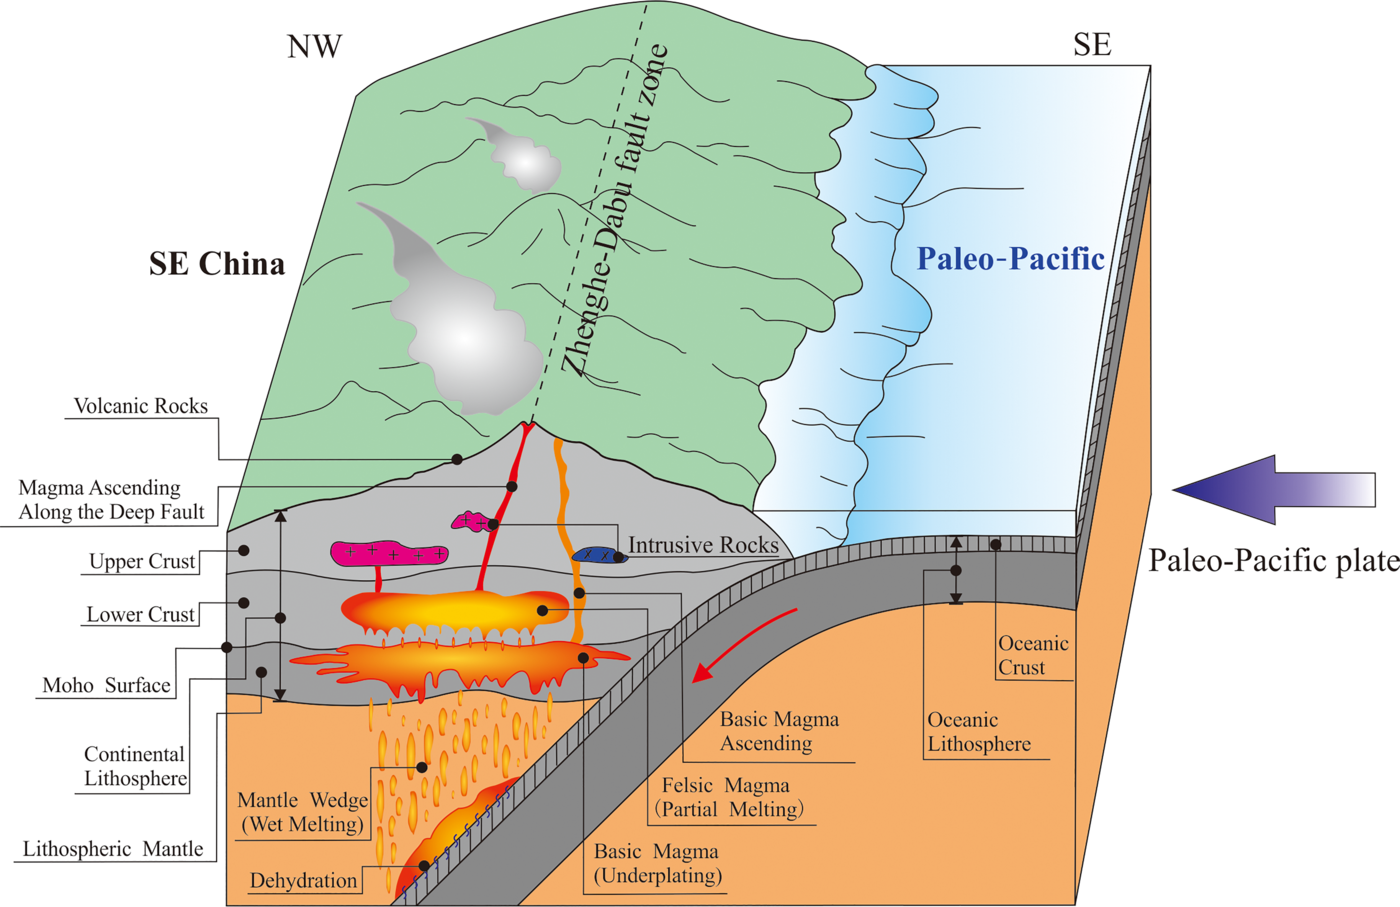
Fig. 13. Schematic model illustrating the magma origin of the Middle–Late Jurassic volcanic rocks along the Zhenghe–Dabu fault zone (modified after Zhao, L. L. et al. Reference Zhao, Wang, Tian and Wu2017).
The Phase 3 volcanic rocks, however, contain diverse Hf isotope compositions. The Early Cretaceous zircons yield more variable ϵ Hf(t) values and T DM2 model ages (ranging from −14.0 to 0.2 and 2.08 to 1.18 Ga, respectively), which is similar to the rhyolitic rocks of the lower volcanic series in eastern Fujian Province (Fig. 12). In contrast, the Late Jurassic zircon Hf isotopic compositions are relatively homogeneous, with ϵ Hf(t) ranges within 3–5 units (Figs 10, 12). On the ϵ Hf(t) versus U–Pb ages diagram (Fig. 12), some of the Hf isotopic data from the Phase 3 volcanic rocks display systematically higher zircon ϵ Hf(t) values and plot above the CHUR evolution line, suggesting more additions of mantle-derived materials than the Phase 1 and 2 volcanic rocks. Meanwhile, the ϵ Hf(t) values are mainly concentrated around −10 and far below the CHUR line (Fig. 12). A captured zircon of 1873 Ma age is also preserved in the Early Cretaceous volcanic strata. Both these observations support the source of the Phase 3 volcanic rocks as being Palaeoproterozoic crustal materials, with varying degrees of addition of juvenile materials.
To summarize the above discussion, it seems that there exists a temporal trend in the evolution of the Mesozoic felsic volcanic rocks in study area. Generally, zircon ϵ Hf(t) values increase from the Phase 1 and 2 to the Phase 3 volcanic rocks, while the depths of the magma source show the opposite trend. We thus believe that the Late Jurassic (Phase 1 and 2) volcanic rocks that experienced intensive fractional crystallization were generated in a compressional tectonic environment, whereas the Early Cretaceous (Phase 3) volcanism with more additions of mantle-derived materials formed in an extensional environment.
6.b. Tectonic evolution of SE China during late Mesozoic time
As mentioned above, the prevailing late Mesozoic magmatism in SE China is generally believed to be related to the subduction of the palaeo-Pacific plate. The late Mesozoic volcanism in the Dehua area formed different volcanic series derived from different magma sources, which may reflect different tectonic settings and geodynamic mechanisms.
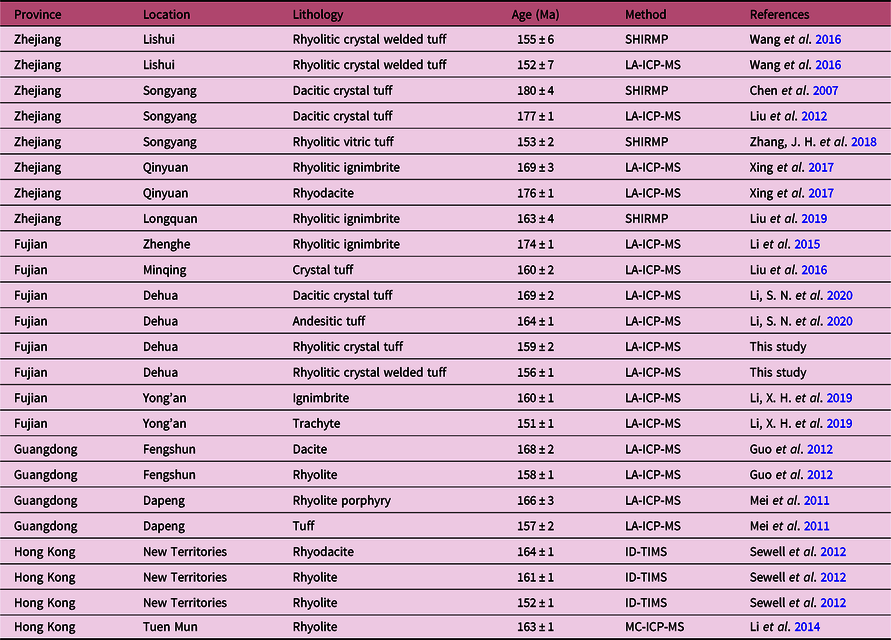
The Phase 1 and 2 volcanic rocks in the Dehua area are typical arc magmatism, with significant enrichment of large ion lithophile elements Rb, Th, U, K and LREEs, and depletion of high-field-strength elements Nb, Ta, Zr, Hf and HREEs (Fig. 7). These geochemical characteristics are similar to the Middle to Late Jurassic volcanic rocks in the coastal areas of South China (Guo et al. Reference Guo, Fan, Li, Zhao, Li and Yang2012; Li et al. Reference Li, Zhou, Lai, Chan and Chen2014, Reference Li, Xing, Xing, Chen, Duan, Yang and Hu2015; Zhang, W. et al. Reference Zhang, Yang, Chen, Wu and Wilde2018; Li, S. N. et al. Reference Li, Ni, Wang, Bao, Huang and Dai2020), suggesting they are continental arc volcanic rocks. The Late Jurassic volcanic rocks in this study contain relatively enriched zircon Hf isotopic compositions, which is similar to the Late Jurassic (157–148 Ma) volcanic rocks in the Minqing area, eastern Fujian Province (Fig. 12; Liu et al. Reference Liu, Xu and Xia2016). In contrast, the Middle Jurassic (168–163 Ma) volcanic rocks in the Dehua area (Li, S. N. et al. Reference Li, Ni, Wang, Bao, Huang and Dai2020) and 160 ± 2 Ma volcanic rocks in the Minqing area (Liu et al. Reference Liu, Xu and Xia2016) have relatively depleted zircon Hf isotopic compositions, with ϵ Hf(t) values ranging from −9.0 to 1.5 and −8.8 to −1.2, respectively (Fig. 12). The ϵ Hf(t) values becoming lower and lower from the Middle to Late Jurassic volcanic rocks could be considered to be due to decreasing mantle-derived material contributions (Liu et al. Reference Liu, Xu and Xia2016). Combined with Jurassic large-scale overthrust faults and folds in SE China (Li, J. H. et al. Reference Li, Cawood, Ratschbacher, Zhang, Dong, Xin, Yang and Zhang2020) and emplacement of 155 Ma S-type granites in the Nanling Range (Li et al. Reference Li, Sun, Xing, Zhao, Zhou, Wong and Chen2009), the Late Jurassic volcanic activity (159–146 Ma) that was generated by melting of thickened lower continental crust and experienced intensive fractional crystallization probably occurred during a regional compressive regime. Such a compressive tectonic environment may have been caused by a shallow-dipping palaeo-Pacific plate (Xing et al. Reference Xing, Lu, Chen, Zhang, Nie, Li, Huang and Lin2008; Li et al. Reference Li, Sun, Xing, Zhao, Zhou, Wong and Chen2009; Li, J. H. et al. Reference Li, Cawood, Ratschbacher, Zhang, Dong, Xin, Yang and Zhang2020). The volcanic activity, however, trends towards forming in an extensional environment. We propose that this abnormal phenomenon is due to the extensional activation of the Zhenghe–Dabu fault zone induced by the northwestern subduction of the palaeo-Pacific plate (Fig. 13). The Middle–Late Jurassic volcanic rocks that are distributed along the Zhenghe–Dabu fault zone (Fig. 1; Table 5) are good evidence. In contrast, the Phase 3 volcanic rocks in the study area contain more variable zircon ϵ Hf(t) values, and the Cretaceous volcanic rocks in eastern Fujian Province display a significantly different evolutionary trend compared to the Jurassic volcanic rocks (Fig. 12), suggesting an increasing mantle-derived material contribution in their petrogenesis. The combined geochemical features of the Phase 3 volcanic rocks in the study area and A-type granites in SE China (Zhao et al. Reference Zhao, Yu, Mao, Liu, Yu, Jiang, Chen, Hou and Peng2018c, Reference Zhao, Yu, Jiang, Mao, Yu, Chen and Xing2019b), together with the previous studies of Early Cretaceous volcanic rocks, granites, extensional structures and metamorphic core complexes (Guo et al. Reference Guo, Fan, Li, Zhao, Li and Yang2012; Yan, X. et al. Reference Yan, Jiang and Jiang2016; Chu et al. Reference Chu, Lin, Faure, Xue, Ji and Feng2019; Dong et al. Reference Dong, Li, Cawood, Gao, Zhang and Xin2020), indicate that the Early Cretaceous volcanic rocks in the study area were dominated by an extensional tectonic regime, such as post-orogenic extension triggered by subduction retreat of the palaeo-Pacific slab (Suo et al. Reference Suo, Li, Jin, Zhang, Zhou, Li, Wang, Liu, Wang and Somerville2019).
Table 5. Zircon U–Pb ages of the Middle to Late Jurassic volcanic rocks in SE China
Therefore, the Late Jurassic to Cretaceous volcanic rocks in the Dehua area can constrain the late Mesozoic geodynamic evolution of SE China: the subduction of the palaeo-Pacific plate started before 159 Ma and instituted a compressional tectonic regime at least until 146 Ma, and then produced an extensional tectonic regime after 143 Ma.
7. Conclusions
-
(1) Field observation and LA-ICP-MS zircon U–Pb dating indicate that the late Mesozoic volcanism in the Dehua area of eastern Fujian Province can be divided into three series: an early stage of Late Jurassic volcanic rocks (Phase 1, 159–153 Ma), a late stage of Late Jurassic volcanic rocks (Phase 2, 152–146 Ma) and an early stage of Early Cretaceous volcanic rocks (Phase 3, 143–139 Ma).
-
(2) The Phase 1 volcanic rocks are characterized by negative ϵ Hf(t) values and Palaeoproterozoic T DM2 ages, implying that they were most likely derived from the Palaeoproterozoic basement with limited addition of mantle-derived materials. Meanwhile, the Phase 2 volcanic rocks have similar ϵ Hf(t) values and more evolved geochemical characteristics.
-
(3) The Phase 3 volcanic rocks contain different Hf isotope compositions and whole-rock geochemistry compared to the Phase 1 and 2 volcanic rocks, implying they have different magmatic sources and tectonic implications.
-
(4) Detailed geochronological and geochemical data for the late Mesozoic volcanic rocks in the Dehua area imply that during Late Jurassic time, SE China was a continental arc related to the subduction and compression of the palaeo-Pacific plate. Since the beginning of Early Cretaceous time, the retreat of the subduction zone triggered the volcanic eruption.
Acknowledgements
This work is supported by National Key R&D Programme of China (grant No. 2016YFC0600210) and Chinese Geology Survey (projects No. DD20190045 and DD20190153). We are grateful to K. Chen and J. R. Tu for their help during zircon Lu–Hf isotope analyses. The manuscript benefitted greatly from the constructive and helpful reviews from the editor.


