1. Introduction
The evolution of orogenic belts is generally accompanied by various magmatic events (Pitcher, Reference Pitcher and Hsu1983; Zhao et al. Reference Zhao, Zheng, Zhang, Dai, Li and Liu2012, Reference Zhao, Dai and Zheng2013). For instance, adakites are usually generated by the partial melting of subducted oceanic crust (Defant & Drummond, Reference Defant and Drummond1990; Castillo, Reference Castillo2006), and small amounts of co-subduction granites may be generated during the deep subduction of continental crust (Zheng et al. Reference Zheng, Xia, Chen and Gao2011; Zhang et al. Reference Zhang, Yu, Zhou, Zhang, Dong and Zhang2015), while large-scale magmatic events always occur along with exhumation of the subducted plate (Zheng, Reference Zheng2012). The extension and collapse of the thickened orogenic belt in the post-orogenic stage may form vast amounts of granitic rocks by partial melting of the lower crust triggered by the upwelling of basaltic magma (Bonin, Reference Bonin2004; Li et al. Reference Li, He and Wang2013; Song et al. Reference Song, Niu, Su, Zhang and Zhang2014; Wang et al. Reference Wang, Liu, Xiao, Cao, Yu, Meert and Liang2014).
The Altyn orogenic belt (AOB) is an important subduction–collision complex in NW China, extending more than 1000 km to the NE and connecting the southern margin of the Tarim Basin and the northern margin of the Qaidam Basin (QB; Fig. 1b). The AOB records tectonic–magmatic events in the Neoproterozoic to the mid-Palaeozoic (Han et al. Reference Han, Chen and Cui2012; Guo et al. Reference Guo, Li, Zhang, Gao, Zhang, Li, Kong and Qian2015; Zhang et al. Reference Zhang, Zeng and Zhu2016), and underwent a complicated evolution including formation of the Archaean–Palaeoproterozoic continental nucleus and crystalline basement (Liu et al. Reference Liu, Che, Wang, Luo, Wang and Gao1998; Xu et al. Reference Xu, Yang, Zhang, Jiang, Li and Cui1999), Mesoproterozoic stable continental-margin deposition, Neoproterozoic plate rifting (Zhang et al. Reference Zhang, Meng and Yu2010, Reference Zhang, Yu and Mattinson2017; Wu et al. Reference Wu, Chen, Wu and Ernstc2018), and early Palaeozoic plate subduction–collision (Liu et al. Reference Liu, Che, Wang, Luo, Wang and Gao1998; Xu et al. Reference Xu, Yang, Zhang, Jiang, Li and Cui1999). These events were followed by late Palaeozoic denudation–peneplanation, and local shallow-sea deposition (Zhang et al. Reference Zhang, Meng and Yu2010; Yu et al. Reference Yu, Li, Zhang, Peng, Somerville, Liu, Wang, Li, Yao and Li2019), The Triassic extension, and major sinistral strike-slip occurred during the Late Jurassic to Early Cretaceous, resulting in the construction of a composite orogenic belt, which consists of geological complexes formed at various tectonic levels, and in a wide range of tectonic settings (Zhang et al. Reference Zhang, Yu and Mattinson2017; Wu et al. Reference Wu, Chen, Wu and Ernstc2018; Yu et al. Reference Yu, Li, Zhang, Peng, Somerville, Liu, Wang, Li, Yao and Li2019). Two ophiolite zones, termed as the south and the north Altyn ophiolite zones, are found in the AOB, indicating the occurrence of the North Altyn Ocean and the South Altyn Ocean (SAO) (Yang et al. Reference Yang, Wu and Shi2002). According to previous regional geological data, the AOB can be divided into five units from the north to the south, e.g. the North Altyn Block (NAB) (Fig. 1b, I), the North Altyn ophiolitic mélange zone (Fig. 1b, II), the Central Altyn Continental Block (CACB) (Fig. 1b, III), the South Altyn Continental Block (SACB) (also termed the Palaeozoic South Altun HP-UHP belt) (Fig. 1b, IV) and the early Palaeozoic Apa–Mangya Ophiolitic Mélange Belt (AMOB) (Fig. 1b, V) (Xu et al. Reference Xu, Yang, Zhang, Jiang, Li and Cui1999; Wu et al. Reference Wu, Gao, Lei, Qin, Liu, Li, Frost and Joseph2014, Reference Wu, Lei, Zhang, Chen, Wu and Li2016, Reference Wu, Chen, Wu and Ernstc2018).

Fig. 1. (a) Map of China showing location of study area. (b) Distribution of granitic rocks in the Altyn Orogenic Belt. (c) Geological map of the Mangya area.
The South Altyn Orogenic Belt (SAOB) consists of the AMOB and the SACB (Fig. 1c), and is an important structural unit in the AOB. Many authors have studied its Palaeozoic tectonic evolution (e.g. Xu et al. Reference Xu, Yang, Zhang, Jiang, Li and Cui1999; L Liu et al. Reference Liu, Zhang, Chen, Yang, Luo and Wang2007a, b, 2009, 2010, 2012; Ma et al. Reference Ma, Li, Sun, Xu, Lei, Wang and Duan2009; Cao et al. Reference Cao, Liu, Wang, Kang, Yang, Liang, Liao and Wang2013; Kang et al. Reference Kang, Liu, Wang, Cao, Yang, Wang and Liao2014; Wang et al. Reference Wang, Liu, Xiao, Cao, Yu, Meert and Liang2014; Wu et al. Reference Wu, Gao, Lei, Qin, Liu, Li, Frost and Joseph2014, Reference Wu, Lei, Zhang, Chen, Wu and Li2016, Reference Wu, Chen, Wu and Ernstc2018; Zhang et al. Reference Zhang, Yu and Mattinson2017; Yu et al. Reference Yu, Li, Zhang, Peng, Somerville, Liu, Wang, Li, Yao and Li2019). Previous research indicates that the high-pressure/ultra-high-pressure (HP/UHP) rocks were formed during the deep subduction of the SACB and underwent retrograde metamorphism twice after the peak metamorphism, indicating two episodes of uplift of the SACB after deep subduction (Liu et al. Reference Liu, Zhang, Chen, Yang, Luo and Wang2007a, b, 2009, 2010, 2012; Ma et al. Reference Ma, Li, Sun, Xu, Lei, Wang and Duan2009; Cao et al. Reference Cao, Liu, Wang, Kang, Yang, Liang, Liao and Wang2013; Kang et al. Reference Kang, Liu, Wang, Cao, Yang, Wang and Liao2014; Wang et al. Reference Wang, Liu, Xiao, Cao, Yu, Meert and Liang2014). Many Early Palaeozoic plutons have been discovered in the SAOB, which record key information on mantle–crust interaction, whereas fewer studies have been carried out on these plutons (Liu et al. Reference Liu, Sun, Xiao, Che, Luo, Chen, Wang, Zhang, Chen and Wang2002, Reference Liu, Wu, Gao, Lei and Qin2015; Ma et al. Reference Ma, Li, Sun, Xu, Lei, Wang and Duan2009; Kang et al. Reference Kang, Liu, Wang, Cao, Yang, Wang and Liao2014; Wu et al. Reference Wu, Gao, Lei, Qin, Liu, Li, Frost and Joseph2014, Reference Wu, Lei, Zhang, Chen, Wu and Li2016, Reference Wu, Chen, Wu and Ernstc2018). The Mangya Plutons crop out at the southern margin of the Altyn sinistral strike-slip fault (ASSF), extending more than 20 km in length and 8 km in width (Fig. 1b). These granitic rocks were triggered by different tectonic processes during the Palaeozoic orogeny in the SAOB, e.g. the newly discovered adakitic rocks may provide strong evidence for the subduction of the slab of the SAO, and the A-type granites were generated in the last stage of the orogeny. Thus, the Mangya plutons in this study are the ideal choice to reveal the Palaeozoic tectonic evolution of the SAOB.
The granitic rocks in the SAOB were divided into six episodes: 503–497 Ma, 483–458 Ma, 456–432 Ma, 424–385 Ma, 352–338 Ma and 265–264 Ma. The first and second plutonic episodes were triggered by the subduction of the oceanic crust of the SAO; the third episode was generated in post-collision setting; the fourth episode was formed in post-orogenic extensional environment; the fifth episode was related to the subduction of the Palaeo Tethys and the Palaeo Asian oceans, and the crust of the Altyn and Qilian orogenic belt thickened in this period; the sixth episode resulted from the reactivation of the ASSF (Wu et al. Reference Wu, Gao, Lei, Qin, Liu, Li, Frost and Joseph2014, Reference Wu, Lei, Zhang, Chen, Wu and Li2016, Reference Wu, Chen, Wu and Ernstc2018). Another model proposes that: at >517 Ma (granitic rocks, laser ablation inductively coupled plasma mass spectrometer (LA-ICP-MS); Kang et al. Reference Kang, Xiao, Gao, Xi and Yang2016), the oceanic crust began sinking, and some adakites were generated by the partial melting of the continental lithospheric mantle; during 504–487 Ma (eclogite, LA-ICP-MS; Liu et al. Reference Liu, Wu, Gao, Lei and Qin2015), the deep subduction of the continental crust occurred; from 451 to 462 Ma (eclogite, LA-ICP-MS; Liu et al. Reference Liu, Wu, Gao, Lei and Qin2015), the break-off and exhumation of the subducted continental crust occurred; and during 426–385 Ma (granites, LA-ICP-MS; Wu et al. Reference Wu, Gao, Lei, Qin, Liu, Li, Frost and Joseph2014, Reference Wu, Chen, Wu and Ernstc2018), the SAOB was in post-orogenic extensional environment (Liu et al. Reference Liu, Che, Wang, Luo and Chen1999, Reference Liu, Wang, Cao, Chen, Kang, Yang and Zhu2012, Reference Liu, Wu, Gao, Lei and Qin2015).
However, debate still remains: How many episodes of granitic magmatism occurred during the Palaeozoic in the AMOB, and what kind of tectonic setting is represented by each episode? When did the subduction of the SAO and the deep subduction of the continental crust initiate? To deal with these questions, here, we present new data from zircon U–Pb geochronological, Lu–Hf isotopic and whole-rock geochemical data of the Mangya plutons with a view to deciphering the early Palaeozoic magmatism and the dynamic processes in the SAOB.
2. Geological setting
The AOB is composed of HP/UHP metamorphic rocks, ophiolites, and magmatic rocks belonging to different orogenic stages and tectonic settings (Xu et al. Reference Xu, Yang, Zhang, Jiang, Li and Cui1999; L Liu et al. Reference Liu, Yang, Chen, Wang, Zhang, Yang and Cao2010, Reference Liu, Wang, Cao, Chen, Kang, Yang and Zhu2012, Reference Liu, Wu, Gao, Lei and Qin2015; Wu et al. Reference Wu, Gao, Lei, Qin, Liu, Li, Frost and Joseph2014, Reference Wu, Lei, Zhang, Chen, Wu and Li2016, Reference Wu, Chen, Wu and Ernstc2018). The SACB lies between the CACB and the ASSF, and is composed of amphibolite-facies felsic gneiss, marbles and mafic amphibolites (Liu et al. Reference Liu, Wang, Cao, Chen, Kang, Yang and Zhu2012, Reference Liu, Wu, Gao, Lei and Qin2015). The HP/UHP rocks in the SACB include eclogite, pelitic gneiss, garnet iherzolite, garnet pyroxenite and granitic gneiss, which are exposed in the Jianggalasayi, Qingshuiquan and Yinggelesayi areas, extending more than 200 km (Fig. 1b). The UHP rocks (eclogite) underwent granulite (~450 Ma) and amphibolites-facies retrograde metamorphism after peak metamorphism (~500 Ma) (L Liu et al. Reference Liu, Wang, Chen, Zhang and Liu2009, Reference Liu, Yang, Chen, Wang, Zhang, Yang and Cao2010, Reference Liu, Wang, Cao, Chen, Kang, Yang and Zhu2012, Reference Liu, Wu, Gao, Lei and Qin2015). The AMOB extends almost 700 km along the southern margin of the ASSF (Fig. 1b, -V), and is composed of Early Palaeozoic ophiolites, mafic–ultramafic rocks, and late Tonian to early Cambrian deposits.
The geological units in the Mangya area include Cambrian–Ordovician greyish-green tuff sandstones, which were intruded by alkali feldspar granites and quartz monzonites (Fig. 1c). The Neoarchaean–Palaeoproterozoic formations and the Palaeozoic granitic rocks are mostly overlain by Mesozoic–Cenozoic formations (Fig. 1c). The granitoid associations are alkali feldspar granite, quartz monzonite, quartz monzodiorite, granodiorite, diorite and monzonitic granites. According to our field investigation, the alkali feldspar granites and quartz monzonites locate at the SE of the research area, and both plutons are 1.5–2 km in width and 15–20 km in length, extending roughly in an E–W direction (Fig. 1c). The diorites locate at both sides of the E–W-trending fault, and the monzonitic granites locate at the west of the north-side diorites, while the quartz monzodiorites and granodiorites locate at the south of the south-side diorites (Fig. 1c). The alkali feldspar granites intrude into the quartz monzonites. The quartz monzodiorites and granodiorites are mostly overlain by Mesozoic–Cenozoic formations, so their relationship is difficult to observe. The north-side diorites are intruded by the monzonitic granites, and the south-side diorites are intruded by the quartz monzodiorites and granodiorites.
3. Sampling and analytical techniques
Twelve fresh samples were collected from the Mangya plutons for geochemical, zircon U–Pb and Hf isotopic analyses in this study, including samples CL101, CL108, CL128, CL140, CL143-5, CL139, CL130, CL133, CL136, CL102, CL114 and CL147. The sample location and numbers are shown in Figure 1c.
3.a Major and trace elements
Twelve samples were collected for whole-rock geochemical analyses at the Hebei Institute of Regional Geological and Mineral Resource Survey, Langfang, Hebei Province, China. Oxide concentrations were measured using a 3080 E X-ray fluorescence spectrometer. Na2O, MgO, Al2O3, SiO2, P2O5, K2O, CaO, TiO2, MnO, Fe2O3 and FeO content determinations were based on the GB/T14506. 28 1993 standard, and H2O+, CO2 and loss on ignition (LOI) on GB/T14506. 2-1993, GB9835-1988 and LY/T1253-1999. The relative standard deviations were lower than 2–8 %. Rare earth elements (REEs: La, Ce, Pr, Nd, Sm, Eu, Gd, Tb, Dy, Ho, Er, Tm, Yb, Lu and Y) and trace elements (Cu, Pb, Hf, Ta, Sc, Cs, V, Co and Ni) were analysed using an ICP-MS (PlasmaQuad Excell) with JY/T016-1996 as the executive standard. The precision for most elements was 10−8, while that of Zr and Ba was 10−6 and that for Hf and Nb was 10−7. The relative standard deviations were less than 10 %. The analytical results are listed in Table 1.

Fig. 2. (a, c–f) Field pictures showing the characteristics of the outcrops. (b) Hand specimen showing the texture of the diorite. (a2–f2) Photomicrographs of the samples showing the mineral associations. Bt – biotite; Hbl – hornblende; Kfs – K-feldspar; Pl – plagioclase. Q – quartz.
Table 1. Major and trace elements concentrations and ratios of the samples in this study

3.b Zircon U–Pb dating
Zircon U–Pb analyses were performed using an LA-MC (multi-collector)-ICP-MS apparatus at the Institute of Geology, Chinese Academy of Geological Sciences, and detailed procedures were according to Hou et al. (Reference Hou, Li, Zou, Qu, Shi and Xie2007). The spots were ~32 µm in size, while the data were calibrated by the reference zircon, M127 (Nasdala et al. Reference Nasdala, Hofmeister, Norberg, Martinson, Corfu, Dörr, Kamo, Kennedy, Kronz, Reiners, Frei, Kosler, Wan, Götze, Häger, Kröner and Valley2008). Standard zircon was analysed initially and repeated after every five spots. Reference standards were the GJ-1 zircon (599.8 ± 1.7 Ma (2σ); Jackson et al. Reference Jackson, Pearson, Griffin and Belousova2004) and the Plesovice zircon (337.13 ± 0.37 Ma (2σ); Sláma et al. Reference Sláma, Košler, Daniel, Crowley, Gerdes, Hanchar, Horstwood, Morris, Nasdala, Norberg, Schaltegger, Schoene, Tubrett and Whitehouse2008). The ICPMSDataCal program was used for data processing (Liu et al. Reference Liu, Yang, Chen, Wang, Zhang, Yang and Cao2010). Most analysis spots with 206Pb/204Pb > 1,000 were not corrected for common lead. Analyses with unusually high 204Pb were excluded from the calculations because common lead in inclusions was assumed to have affected the data. The analytical data are listed in Supplementary Table S1 in Supplementary Material available online at https://doi.org/10.1017/S0016756820000126 and graphically plotted on Concordia diagrams with 1σ error. The weighted mean ages are calculated using Isoplot (Ludwig, Reference Ludwig2003) with 1σ errors at 95 % confidence.
3.c Hf isotopic analyses
In situ zircon Hf isotope analyses were performed using a GeoLasPro 193 nm laser-ablation microprobe attached to a Neptune MC-ICP-MS at the Institute of Geology, Chinese Academy of Geological Sciences. Instrumental and data acquisition conditions were according to Hou et al. (Reference Hou, Li, Zou, Qu, Shi and Xie2007). A stationary spot was used for the analysis, with a beam diameter of 44 µm, depending on the size of the ablated domains. Helium was used as the carrier gas to transport the ablated samples from the laser-ablation cell to the ICP-MS torch via a mixing chamber filled with argon. To correct the isobaric interferences from 176Lu and 176Yb on 176Hf, the 176Lu/175Lu = 0.02658 and 176Yb/173Yb = 0.796218 ratios were determined (Chu et al. Reference Chu, Taylor, Chavagnac, Nesbitt, Boella, Milton, German, Bayon and Burton2002). For instrumental mass bias corrections, an exponential law was applied to normalize the Yb and Hf isotope ratios to a 172Yb/173Yb ratio of 1.35274 (Chu et al. Reference Chu, Taylor, Chavagnac, Nesbitt, Boella, Milton, German, Bayon and Burton2002) and to a 179Hf/177Hf ratio of 0.7325. The mass bias behaviour of Lu was assumed to follow that of Yb. Mass bias correction protocol details have been described in detail by Hou et al. (Reference Hou, Li, Zou, Qu, Shi and Xie2007). Zircon GJ-1 was used as the reference standard during routine analyses, with a weighted mean 176Hf/177Hf ratio of 0.282007 ± 0.000007 (2σ) that was indistinguishable from the weighted mean 176Hf/177Hf ratio of 0.282000 ± 0.000005 (2σ). The Hf model age (single-stage model age) (TDM) was calculated on the basis of a depleted-mantle source with a present-day 176Hf/177Hf ratio of 0.28325 by using the 176Lu decay constant, 1.865 × 10⁻¹¹ a−1 (Scherer et al. Reference Scherer, Munker and Mezger2001). The crust (two-stage) Hf model age (TDMC) was calculated based on the assumption of a mean 176Lu/177Hf value of 0.015 for an average continental crust (Griffin et al. Reference Griffin, Wang, Jackson, Pearson, O’Reilly, Xu and Zhou2002). Analytical results are listed in Table 2.
Table 2. Zircon Lu–Hf isotopic data of Mangya plutons

4. Petrography and results
4.a Petrography
The petrographic features of the samples are shown in Table 3.
Table 3. Geological features of the plutons from Mangya in this study

Ap – apatite; Bi – biotite; Hbl – hornblende; Kfs – K-feldspar; Pl – plagioclase; Qtz – quartz; Zr – zircon.
4.b Chronology
Ten samples were collected for LA-ICP-MS zircon U–Pb dating, including samples CL101 and CL108 (quartz monzonite), CL140 (diorite), CL128 (diorite), CL139 (quartz monzodiorite), CL143-5 (granodiorite), CL136 and CL137 (monzonitic granite), CL102 and CL147 (alkali feldspar granite). The analytical results are shown in Supplementary Table S1 in Supplementary Material available online at https://doi.org/10.1017/S0016756820000126.
The trace element composition of zircon varies significantly according to formation process (crystallization vs recrystallization) and fluid/melt involved. Zircon overgrowths crystallized during high-temperature metamorphism in equilibrium with partial melt have compositions similar to magmatic zircon, i.e. rich in U, Y, Hf and P, displaying steep REE patterns with positive Ce anomalies and negative Eu anomalies. Their low Th/U ratio (<0.07) is the only chemical feature that distinguishes them from magmatic zircon (Rubatto, Reference Rubatto2002). The ratios of Th/U are 1:3 and 1:7 in felsic melts and mafic melts, respectively, implying that mafic melts do not allow relatively more Th into the zircon structure than U, but both more U and Th (Kirkland et al. Reference Kirkland, Smithies, Taylor, Evans and McDonald2015). This is consistent with crystal chemical theory, where relatively more elements with larger ionic radii than the ideal are admitted into a thermally expanded lattice, but favoured elements are those closest to the ideal size.
The zircon grains of samples CL101 and CL108 are short column crystals (Fig. 3), with a length/width ratio in the range 1.5:1–3:1. The cathodoluminescence (CL) images show clear oscillatory zoning (Fig. 3). The Th/U ratios are in the ranges 0.76–1.91 (avg. 1.18) and 0.73–1.24 (avg. 0.98), respectively (Supplementary Table S1 in Supplementary Material available online at https://doi.org/10.1017/S0016756820000126), indicating that the zircons are of magmatic origin. Forty spots were analysed for each sample, and the 206Pb/238U mean ages are 510.7 ± 3.2 Ma and 501.3 ± 4.6 Ma, respectively (Fig. 4a, b), representing their crystallization ages.

Fig. 3. CL images and U–Pb ages of the plutons in the Mangya area. Red circles – analysed spots of LA-ICP-MS analysis; green circles – analysed spots of Lu–Hf analysis.

Fig. 4. U–Pb concordia diagram for the zircon grains of the plutons in the Mangya area.
Most of the zircon grains in samples CL128 and CL140 show prismatic features (Fig. 3), with a length/width ratio in the range 2:1–3:1, and the CL images show oscillatory zoning, with a few grains containing old inherited zircon cores. The Th/U ratios are in the ranges 0.13–1.71 (avg. 0.70) and 0.14–2.42 (avg. 1.02) (Supplementary Table S1 in Supplementary Material available online at https://doi.org/10.1017/S0016756820000126), respectively, showing features of magmatic origin. Forty points were analysed for each sample, and the 206Pb/238U mean ages are 483.7 ± 3.2 Ma and 493.9 ± 3.5 Ma (Fig. 4c, d), respectively, representing their crystallization ages.
The zircon grains of samples CL139 and CL143-5 are in the form of long columns (Fig. 3), with a length/width ratio ranging from 1.5:1 to 4:1, and show zonal textures in the CL images. The ratios of Th/U range from 0.17 to 1.58 (avg. 0.55) and 0.14 to 1.70 (avg. 0.68) (Supplementary Table S1 in Supplementary Material available online at https://doi.org/10.1017/S0016756820000126), respectively, revealing a magmatic origin for the zircons. The analysed 30 and 40 spots of samples CL139 and CL143-5 yielded 206Pb/238U mean ages of 469.7 ± 3.2 Ma and 478.9 ± 2.8 Ma, respectively (Fig. 5a, b), implying their crystallization ages.

Fig. 5. U–Pb concordia diagram for the zircon grains of the plutons in the Mangya area.
The zircon grains of samples CL136 and CL137 are in long column crystal form, while a few are in short column form, with a length/width ratio ranging from 1.5:1 to 3.5:1, and show clear oscillatory zoning in the CL images (Fig. 3). The Th/U ratios range from 0.14 to 1.03 (avg. 0.32) and 0.26 to 1.03 (avg. 0.53), respectively (Supplementary Table S1 in Supplementary Material available online at https://doi.org/10.1017/S0016756820000126), reflecting a magmatic origin for the zircons. Thirty spots were analysed for each of the two samples, and the 206Pb/238U mean ages are 450.0 ± 3.5 Ma and 433.1 ± 6.1 Ma, respectively (Fig. 5c, d), representing their crystallization ages.
The zircon grains of samples CL102 and CL147 are prismatic, with a length/width ratio in the range 1:1–4:1, and show clear oscillatory zoning in the CL images (Fig. 3). The Th/U ratios range from 0.37 to 0.73 (avg. 0.53) and 0.31 to 0.60 (avg. 0.43), respectively (Supplementary Table S1 in Supplementary Material available online at https://doi.org/10.1017/S0016756820000126), showing features of magmatic origin. For each sample, 31 and 30 points were analysed, and the 206Pb/238U mean ages are 418.8 ± 3.7 Ma and 409.0 ± 2.5 Ma (Fig. 5e, f), respectively, implying their crystallization ages.
Thus, the quartz monzonites were emplaced at c. 511–501 Ma; the diorites at c. 494–483 Ma; the quartz monzodiorites at c. 479–469 Ma; the monzonitic granites at c. 450–433 Ma; and the alkali feldspar granites at c. 419–409 Ma.
4.c Geochemistry
4.c.1 Major elements
In the Mangya plutons, the monzonitic granites and the alkali feldspar granites contain the highest content of SiO2 and (Na2O + K2O), and the lowest ratios of Na2O/K2O. The diorites have the lowest content of (Na2O + K2O), with the highest ratios of Na2O/K2O (Table 1). The data of the quartz monzonites plotted in the alkaline area, while those of the other plutons plotted in the sub-alkaline area (Fig. 6a). The aluminium saturation index (ASI) of the plutons ranges from 0.77 to 0.91, 0.97 to 1.15, 1.11 to 1.19 and 0.96 to 1.00, respectively, indicating that the plutons for the quartz monzonites and alkali feldspar granites are aluminous, the diorites quartz monzodiorites and granodiorites are aluminous to weak peraluminous, and the monzonitic granites are peraluminous (Fig. 6b). Most of the data of the Mangya plutons plotted in the Magnesian area (Fig. 6c), except that for the plutons for the alkali feldspar granites, which fell in the Ferroan area (Fig. 6c). The data of all plutons are mostly in the MK CA to HK CA area, except that of the quartz monzonites, which plotted in the SHO area (Fig. 6d). The SiO2 content of the diorites, granodiorites and the quartz monzodiorites displays an obvious negative correlation with P2O5 (Fig. 7a). All the plutons display negative correlation in the diagram of SiO2 vs TiO2, FeOT and MgO (Fig. 7b, d, e).

Fig. 6. (a) SiO2–(Na2O + K2O) diagram for the plutons in the Mangya area (after Middlemost, Reference Middlemost1994; Irvine & Baragar, Reference Irvine and Baragar1971). (b) A/CNK–A/NK diagram (Rickwood, Reference Rickwood1989); (c) SiO2–Fe* diagram (Frost & Frost, Reference Frost and Frost2008); (d) K2O–SiO2 diagram (Maniar & Piccoli, Reference Maniar and Piccoli1989). Fe* = FeOT/(FeOT + MgO).

Fig. 7. Harker diagrams.
4.c.2 Trace elements
All the samples analysed are depleted in high-field-strength elements (HFSEs) and are partially enriched in large-ion lithophile elements (LILEs), although the contents of the elements vary slightly in different samples. On a trace element spider diagram, the quartz monzonites display negative anomalies of Nb, Ta, Ti, P and Sr (Fig. 8a), and the diorites and the quartz monzodiorites show negative anomalies of Ba, Nb, Ta, P, and positive anomalies of Sr, Zr and Hf (Fig. 8c). The monzonitic granites show significantly negative Ti and P anomalies and weak negative Nb and Ta anomalies, while showing positive anomalies of Zr and Hf (Fig. 8e). The alkali feldspar granites show significant negative Ba, Sr, Ti and P anomalies (Fig. 8g).

Fig. 8. Primitive-mantle-normalized trace-element spider diagrams (a, c, e, g) (normalizing values from Sun & McDonough, Reference Sun, McDonough, Saunders and Norry1989) and chondrite–normalized REE distribution patterns (b, d, f, h) (normalizing values from Taylor & McLennan, Reference Taylor and McLennan1985) of the plutons in the Mangya area.
4.c.3 Rare earth elements
The total content of the rare earth elements (TREEs) for the quartz monzonites is in the range 255.48–339.51 ppm, and the LREE/HREE ratio ranges from 10.13 to 12.43, exhibiting right-slanting curves with a weak negative Eu anomaly (Eu* = 0.74–0.93) (Table 1; Fig. 8b). The TREEs of the diorites and that of the quartz monzodiorites vary greatly (Fig. 8d). The TREEs of the diorites is 53.65 ppm, and the LREE/HREE ratio is 12.03, with a weak positive Eu anomaly (Eu* = 1.48) (Table 1). The TREEs of the other plutons ranges from 27.65—to 295.69 ppm (Table 1), and sample CL143-5 shows a strong positive Eu anomaly (Eu* = 5.82), while sample CL139 displays a weak negative Eu anomaly (Eu* = 0.73) (Fig. 8d). The TREEs of the monzonitic granites is in the range 31.14–190.69 ppm, with the LREE/HREE ratios ranging from 4.11 to 15.56 (Table 1). The TREEs of the alkali feldspar granites ranges from 197.63—to 506.99 ppm, with LREE/HREE ratio in the range 5.09–10.48, and the samples show strong negative Eu anomalies (Eu* = 0.14–0.24) (Table 1; Fig. 8h).
4.c.4 Hf isotopes
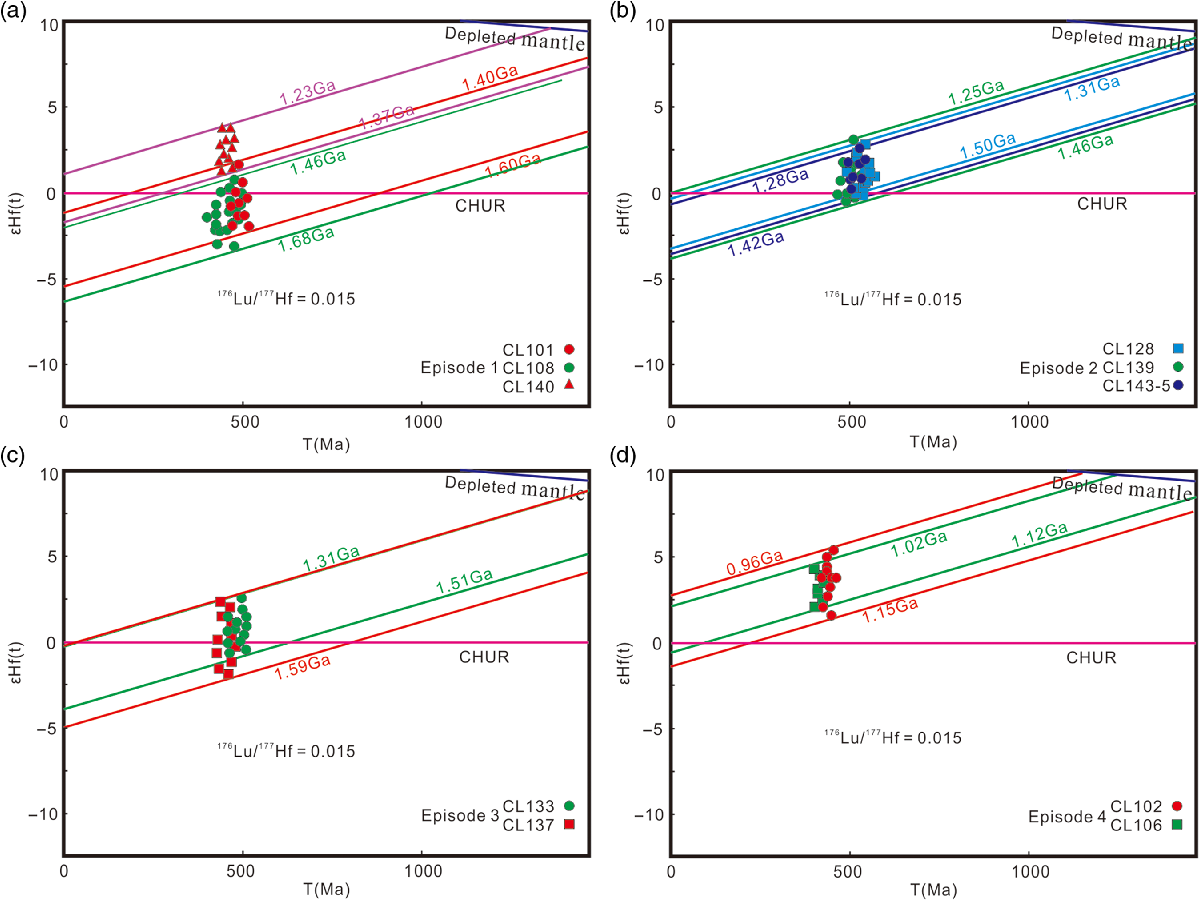
Samples CL101 and CL108 were selected from the quartz monzonites for Hf isotopic analysis, and 10 and 32 zircon grains were analysed for each sample (Table 2). The ϵ Hf(t) values are in the ranges −1.88 to −0.32 (avg. −1.11) and −3.51 to −0.35 (avg. −1.77), and the tDM2 ages range from 1601 to 1476 Ma (avg. 1546 Ma) and 1670 to 1490 Ma (avg. 1573 Ma). These two samples contain two and one positive ϵ Hf(t) values, with the tDM2 ages ranging from 1466 Ma to 1400 Ma and 1464 Ma, respectively (Fig. 9a).

Fig. 9. Zircon ϵHf(t) values vs age (Ma) for the plutons in the Mangya area.
Samples CL140 and CL128 were selected from the diorites for Hf isotopic analysis, and 20 and 23 zircon grains were analysed for each sample (Table 2). The ϵ Hf(t) values of sample CL140 range from 1.24 to 3.90 (avg. 2.63), and the tDM2 ages range from 1381 to 1214 Ma (avg. 1297 Ma) (Fig. 9a). The ϵ Hf(t) values of sample CL128 are positive, ranging from 0.04 to 2.36 (avg. 0.76), with three negative values (−0.66 to −0.06), and the tDM2 ages range from 1453 to 1309 Ma (avg. 1,405 Ma) (Fig. 9b).
Samples CL139 and CL143-5 were selected from the quartz monzodiorites and granodiorites for Hf isotopic analysis. Twenty-one zircon grains were analysed for each sample (Table 2). The ϵ Hf(t) values are in the ranges 0.05–3.05 (avg. 1.01) and 0.41 to 2.34 (avg. 1.67), and the tDM2 ages range from 1447 to 1316 Ma (avg. 1383 Ma) and 1422 to 1283 Ma (avg. 1347 Ma), respectively. Sample CL139 includes four negative values (−0.31 to −0.03), with the tDM2 ages in the range 1464–1447 Ma (avg. 1456 Ma) (Fig. 9b).
Samples CL137 and CL133 were selected from the monzonitic granites for Hf isotopic analysis, and 20 and 13 zircon grains were analysed for each sample (Table 2). Both samples contain almost half negative ϵ Hf(t) values ranging from −1.27 to −0.02 (avg. −0.53) and −2.57 to −0.47 (avg. −1.01), with the tDM2 ages in the ranges 1,509–1453 Ma (avg. 1464 Ma) and 1586–1448 Ma (avg. 1,505 Ma), respectively. The remaining half positive ϵ Hf(t) values of both samples range from 0.31 to 1.96 (avg. 0.78) and 0.35 to 1.72 (avg. 0.92), and the tDM2 ages are in the ranges 1416–1308 Ma (avg. 1,383 Ma) and 1,398–1,305 Ma (avg. 1,361 Ma) (Fig. 9c), respectively.
Samples CL102 and CL106 were selected from the alkali feldspar granites for Hf isotopic analysis, and 17 and 20 zircon grains were analysed for each sample, respectively. The ϵ Hf(t) values of both samples are positive, ranging from 3.70 to 7.19 (avg. 5.49) and 4.53 to 6.14 (avg. 5.16), and the tDM2 ages are in the range 1175–976 Ma (avg. 1058 Ma) and 1112–1007 Ma (avg. 1071 Ma), respectively (Table 2; Fig. 9d).
5. Discussion
5.a Petrogenesis of the Mangya plutons
The quartz monzonites are proposed to be I-type granitic rocks according to mineral associations and geochemical features, i.e. negative correlation between SiO2 and P2O5 (Fig. 7a) and rich in hornblende (Fig. 2a2), and all the samples plotted in I-type area (Fig. 10a, b) (Altherr et al. Reference Altherr, Holl, Hegner, Larger and Kreuzer2000). Zircon ϵ Hf(t) values are mainly negative, with a few positive values (Fig. 9a), indicating that the source rocks are mainly composed of Mesoproterozoic (1,601–1,476 Ma) ancient crustal materials, mixed with a small amount of juvenile crustal components. Thus, we infer that the plutons were generated by the partial melting of the Mesoproterozoic crust triggered by the upwelling of basaltic magma during the spreading of the SAO.

Fig. 10. (a, b) Plots of granite genetic types (after Whalen et al. Reference Whalen, Currie and Chappell1987). (c) Plot of Sr/Y vs Y (after Drummond & Defant, Reference Drummond and Defant1990). (d) Plot of (La/Yb)N–YbN (Defant & Drummond, Reference Defant and Drummond1990).
The diorites show features of I-type plutons, i.e. rich in hornblende (Fig. 2b2), ASI < 1.00 (Fig. 6b), and Na2O content is higher than K2O content. As shown in Figure 10a, b, sample CL128 plotted in the I-type area. The diorite also shows features of oceanic adakite, i.e. enriched LILEs (Rb, Sr), depleted in HFSEs (Ba, Nb, Ta, P) (Fig. 8a), high content of Sr (605.18 ppm), low content of Y (6.89 ppm) and Yb (0.66 ppm), and high Sr/Y ratio (88) (Table 1). As shown in Figure 10c, d, the sample plotted in the adakite area, and in Figure 11a the samples plotted in the meta-basalt area. The geochemical characteristics of the sample are similar to the adakitic rocks generated by partial melting of subducted oceanic crust (K2O/Na2O < 0.71 and CaO/Al2O3 > 0.2) (Defant & Drummond, Reference Defant and Drummond1990), i.e. low ratios of K2O/Na2O (0.53) and CaO/Al2O3 (0.39) (Table 1), and positive ϵ Hf(t) values (Fig. 9b). Hence we propose that subduction of the SAO occurred in this period, and these rocks were generated by the partial melting of the subducted slab.

Fig. 11. (a) Plot of Al2O3/(MgO + FeOT) vs CaO/(MgO + FeOT) (Altherr et al. Reference Altherr, Holl, Hegner, Larger and Kreuzer2000). (b) Plot of Ta/Yb vs Th/Yb (Gorton & Schandl, Reference Gorton and Schandl2000). (c) Plot of Rb vs (Y + Nb) (Pearce et al. Reference Pearce, Harris and Tinele1984). (d) Plot of R1 vs R2 (Batchelor & Bowden, Reference Batchelor and Bowden1985). R1 = 4 * Si − 11 * (Na + K) − 2 * (Fe + Ti); R2 = 6 * Ca + 2 * Mg + Al; Si, Na, K, Fe, Ti, Ca, Mg and Al represent their atomic percentage contents.
The quartz monzodiorites and granodiorites show features of I-type plutons, i.e. negative correlation between SiO2 and P2O5 (Fig. 7a), enriched in LILEs (Rb, Sr and K) and depleted in HFSEs (Nb, Ta and P) (Fig. 8c), and all samples plotted in the I-type area (Fig.10a, b). The rocks also contain high contents of Sr (427.93–565.66 ppm), low contents of Y (2.42–19.05 ppm) and Yb (0.37–1.43 ppm), with high ratios of Sr/Y (39.82–233.51), showing features of adakite. In Figure 11a, the samples plotted in the meta-greywacke area, and considering the positive ϵ Hf(t) values (Fig. 9b), we propose that the rocks were generated by the partial melting of Mesoproterozoic–Neoproterozoic juvenile crust (1447–1283 Ma) triggered by the upwelling of the basaltic magma.
The monzonites show features of S-type granites, i.e. 1.24 > ASI > 1.44 (Fig. 6b), low content of TiO2 (0.10–0.25 %), FeOT (0.60–1.37%), CaO (0.40–1.61%) and MgO (0.34–0.49%), and Na2O% < K2O% (Table 1) (Whalen et al. Reference Whalen, Currie and Chappell1987; Ghani et al. Reference Ghani, Searle, Robb and Chung2013). The rocks also show features of I-type granites, i.e. negative correlation between P2O5 and SiO2 (Fig. 7a), lack of Al-rich minerals, rich in LILEs (Rb and K) and depleted in HFSEs (Ta, P, Nb and Ti) (Fig. 8e, f). Therefore, we infer that these rocks might belong to the I–S transitional type. Considering the half positive and half negative ϵ Hf(t) values of the samples, we suggest that the granites were generated by the partial melting of Mesoproterozoic juvenile crust (1398–1305 Ma) and Mesoproterozoic ancient crust (1586 Ma–1448 Ma) (Fig. 9c) triggered by the underplating of the basaltic magma from the deep-seated magma chambers.
The alkali-feldspar granites exhibit features of A-type granites, i.e. 1.00 > ASI > 0.96 (Fig. 7b), enriched in SiO2 (76.81–78.53%) and (Na2O + K2O) (7.91–8.89%), lack of CaO (0.34–0.54%) and MgO (0.11–0.14%) (Table 1), similar ratios of 104 × Ga/Al (avg. 2.62) (Whalen et al. Reference Whalen, Currie and Chappell1987; Ghani et al. Reference Ghani, Searle, Robb and Chung2013), and in Figure 10a, b, all the samples plotted in the A-type area. The ϵ Hf(t) values are positive, indicating that the source rocks were composed of Neoproterozoic (1175–976 Ma) juvenile crustal materials. We propose that the granites were generated by the partial melting of the Neoproterozoic juvenile crust triggered by substantial emplacement of mafic magma.
5.b Episodes of magmatic events in the AMOB
The Mangya plutons preserve abundant information for the Palaeozoic tectonic evolution in the SAOB. Based on our new data for the Mangya plutons and previous studies, we divide the early Palaeozoic granitic magmatism in the AMOB into six episodes.
Episode 1 (510.7–493.9 Ma);
Episode 2 (483.7–458.3 Ma);
Episode 3 (450.0–433.1 Ma);
Episode 4 (418.8–403.9 Ma);
Episode 5 (352–338 Ma) (Wu et al. Reference Wu, Chen, Wu and Ernstc2018);
Episode 6 (265–264 Ma) (Wu et al. Reference Wu, Gao, Lei, Qin, Liu, Li, Frost and Joseph2014, Reference Wu, Chen, Wu and Ernstc2018).
5.c Geodynamic processes
Zhang et al. (Reference Zhang, Meng and Yu2010) and Liu et al. (Reference Liu, Wang, Yang, Luo, Cao and Huang2013, Reference Liu, Wu, Gao, Lei and Qin2015) proposed northward subduction of the oceanic crust of the SAO (Zheng Reference Zheng2012; Zheng et al. Reference Zheng, Xiao and Zhao2013), which closed at 500 Ma. The HP and UHP metamorphic belts in the SAOB were formed during the northward subduction of the SAO, and were uplifted twice at 450 Ma and 420 Ma (Liu et al. Reference Liu, Wang, Yang, Luo, Cao and Huang2013), respectively. However, according to the previous studies and new data for the Mangya plutons, we suggest that the subduction of the SAO probably occurred after 483.7 Ma, as discussed below.
Zircon Lu–Hf isotopic analyses show that the ϵHf(t) values of the Mangya plutons all straddled the chondritic unifractionated reservoir (CHUR) line (Fig. 9). Therefore, we propose subduction of the oceanic crust of the SAO in the Early Palaeozoic. For the plutons, the Th/Ta ratios range from 7.17 to 13.60 (avg. 10.94), 16.12 to 510.01 (avg. 183.57), 7.84 to 33.35 (avg. 18.31) and 4.57 to 11.02 (avg. 8.15), respectively (Table 1). The ratios for the diorites, quartz monzodiorites and granodiorites vary greatly, and are closer to ocean island arc (OIA) rocks, while the quartz monzonites and the monzonitic granites are closer to active continental margin (ACM) rocks, and the alkali feldspar granites are closer to the OIA rocks (Foley, Reference Foley1990; Sajona et al. Reference Sajona, Maury, Bellon, Cotton and Defant1996; Gorton & Schandl, Reference Gorton and Schandl2000). As shown in Fig. 11c, d, and according to the geochemical and Hf isotopic data, we infer that the quartz monzonites were formed in an extending and thinning environment during the spreading of the SAO (Wu et al. Reference Wu, Gao, Lei, Qin, Liu, Li, Frost and Joseph2014, Reference Wu, Lei, Zhang, Chen, Wu and Li2016, Reference Wu, Chen, Wu and Ernstc2018), the diorites, quartz monzodiorites and granodiorites are related to the subduction of the oceanic crust of the SAO, the monzonitic granites were generated in a syn-collision setting, indicating the closure of the SAO and the collision of the QB with the SACB, and the alkali feldspar granites were generated in post-orogenic extensional environment.
Thus, we propose a model for the early Palaeozoic tectonic evolution in the SAOB based on our new data and previous studies. From 511 to 494 Ma, a series of magmatic events occurred during the spreading of the SAO, and episode one plutons formed, showing I-type granitic features (Fig. 12a). The SAO began sinking from 484 Ma to 458 Ma, and large-scale I-type plutons formed at the northern margin of the AMOB (Fig. 12b). At the early stage in this period, a series of adakitic rocks were generated by the partial melting of the subducted slab of the SAO. Subsequently, the upwelling of the deep-seated magma caused partial melting of the lower crust and large scale I-type plutons were generated. The deep subduction of the continental crust occurred in this period, and the subducted continental crust underwent UHP metamorphism (Fig. 12b). From 450 Ma to 433 Ma, the SAO closed, the QB collided with the SACB resulting from the dragging of the previous sinking oceanic crust and break-off of the subducted SAO oceanic slab occurred (Fig. 12c). As the magmatic events continued, isostatic adjustment and extension occurred among different blocks which formed during the orogeny in the SAOB, resulting in the formation of deep-seated magma chambers. The heat provided by the mafic magma triggered the partial melting of the upper crust, and a series of I–S transitional type granites formed (Fig. 12c). From 419 Ma to 404Ma, the AMOB was in a post-orogenic extensional environment triggered by the delamination of the sinking oceanic crust, and A-type granites were extensively generated (Fig. 12d). From 352 to 338 Ma, a series of S-type granites were generated triggered by the subduction of the Palaeo Tethys and the Palaeo Asian oceans, and the crust of the Altyn and Qilian orogenic belt thickened (Wu et al. Reference Wu, Chen, Wu and Ernstc2018). From 265 to 264 Ma, some I-type granites were generated, resulting from the reactivation of the ASSF (Wu et al. Reference Wu, Chen, Wu and Ernstc2018).
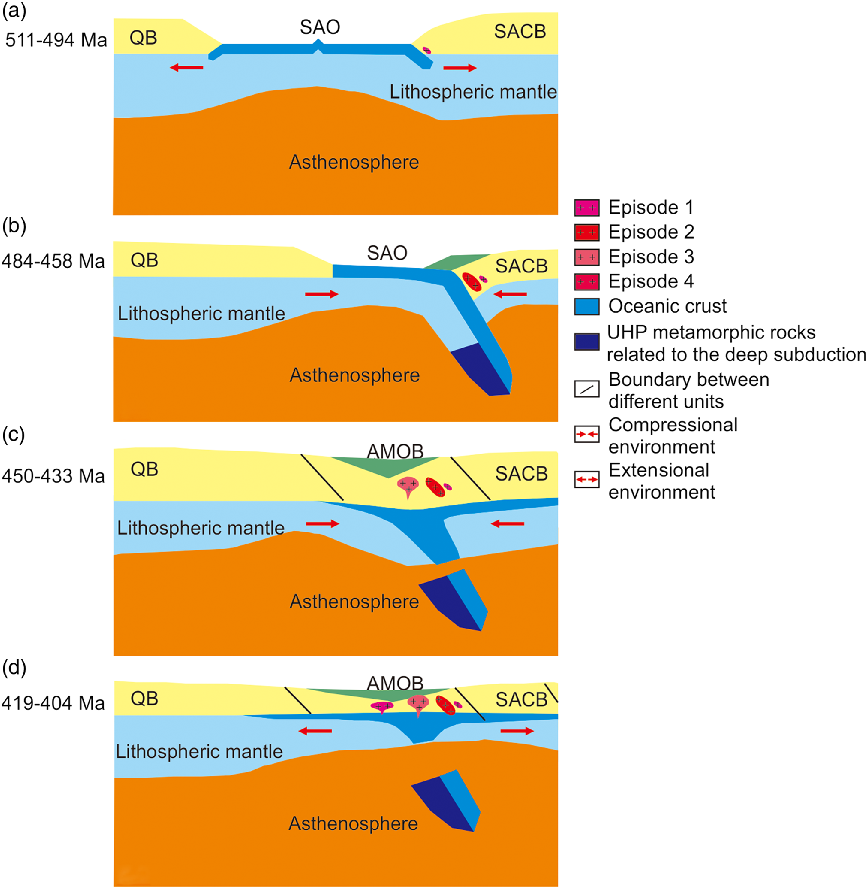
Fig. 12 Schematic model of the plate tectonic evolution and magmatism in the AMOB, looking west at the time of granites emplacement.
6. Conclusion
(1) According to our new data and previous studies, we divide the Early Palaeozoic plutons in the research area into four episodes: 511–494 Ma, 484–458 Ma, 450–433 Ma and 419404 Ma.
(2) Petrochemical and zircon Hf isotopic studies show that: the quartz monzonites were generated by partial melting of Mesoproterozoic ancient crust; the diorites were generated by partial melting of the continental lithospheric mantle; the quartz monzodiorites and granodiorites were generated by partial melting of Mesoproterozoic–Neoproterozoic juvenile crust; the monzonitic granites were generated by partial melting of Mesoproterozoic juvenile and ancient crusts; the alkali feldspar granites were derived from Neoproterozoic juvenile crust.
(3) We propose a model for the early Palaeozoic tectonic evolution in the SAOB. From 511 to 494 Ma, a series of magmatic events occurred during the spreading of the SAO, forming some I-type granitic rocks. The SAO began sinking from 484 to 458 Ma, forming large-scale I-type plutons at the northern margin of the AMOB. During 450–433 Ma, the SAO closed, and the QB collided with the SACB resulting from the dragging of the previous sinking oceanic crust. Break-off of the subducted SAO oceanic slab also occurred in this period. As the magmatic events continued, a series of I–S transitional type granites formed. During 419–404 Ma, the AMOB was in a post-orogenic extensional environment, and A-type granites were extensively generated.
Supplementary material
To view supplementary material for this article, please visit https://doi.org/10.1017/S0016756820000126
Acknowledgements
This work was supported by National Natural Science Foundation of China (Grant Nos. 41872071) and China Geological Survey Projects (grant Nos. DD20190006).