


1. Introduction
Ever since Harland (Reference Harland1971) elucidated transpression in the Caledonian Spitzbergen, a large number of studies have advanced our understanding of the principles governing various transpression types (Sanderson & Marchini, Reference Sanderson and Marchini1984; Fossen & Tikoff, Reference Fossen and Tikoff1993, Reference Fossen, Tikoff, Holdsworth, Strachanand and Dewey1998; Tikoff & Fossen, Reference Tikoff and Fossen1993; Robin & Cruden, Reference Robin and Cruden1994; Soto, Reference Soto1997; Ghosh, Reference Ghosh, Koyi and Mancktelow2001; Fossen, Reference Fossen2016). These principles have been successfully tested in many terrains (e.g. Sylvester, Reference Sylvester1988; Fossen et al. Reference Fossen, Tikoff and Teyssier1994; Tikoff & Teyssier, 1994; Tikoff & Greene, Reference Tikoff and Greene1997; Dewey et al. Reference Dewey, Holdsworth, Strachan, Holdsworth, Strachan and Dewey1998; Jones et al. Reference Jones, Holdsworth, Clegg, McCaffery and Tavarnelli2004; Iacopini et al. Reference Iacopini, Carosi, Montomoli and Passchier2008; Cruciani et al. Reference Cruciani, Montomoli, Carosi, Franceschelli and Puxeddu2015; Graziani et al. Reference Graziani, Montomoli, Iaccarino, Menegon, Nania and Carosi2020; Simonetti et al. Reference Simonetti, Carosi, Montomoli, Cottle and Iaccarino2020 a, b). Several landmark contributions on the polyphase folding and strain partitioning in transpression zones have been made during the last couple of decades (e.g. Jones & Tanner, Reference Jones and Tanner1995; Allen et al. Reference Allen, Alsop and Gemchuzhnikov2001; Tavarnelli et al. Reference Tavarnelli, Holdsworth, Klegg, Jones and McCaffrey2004; Carreras et al. Reference Carreras, Cosgrove and Druguet2013; Li et al. Reference Li, Sun, Rosenbaum, Cai, Chen and He2016).
In the NW Indian Shield, the several-hundred-kilometre-long Great Boundary Fault (GBF) has been variously interpreted as a reverse fault, reactivated normal fault or reactivated thrust with occasional references to strike-slip motion (Heron, Reference Heron1936; Coulson, Reference Coulson1967; Iqbaluddin et al. Reference Iqbaluddin, Sharma, Mathur, Gupta and Sahai1978; Prasad, Reference Prasad1984; Verma, Reference Verma1996; Sinha-Roy et al. Reference Sinha-Roy, Malhotra and Mohanty1998; Choudhuri & Guha, Reference Choudhuri and Guha2004). The structural geometry and tectonics of the bends in the GBF are not, as yet, addressed. This study focuses on one of the prominent bends in the southwestern part of the GBF around Chittaurgarh, Rajasthan.
2. Geological setting
The NE–SW-trending Aravalli mountain range, a gravity high, occurs as a prominent geomorphic horst in the NW Indian Shield (Mishra et al. Reference Mishra, Singh, Tiwari, Gupta and Rao2000; Dwivedi et al. Reference Dwivedi, Chamoli and Pandey2019). Geologically, it is a mosaic that consists of the Aravalli mobile belt, the Delhi mobile belt and vestiges of the basement. The basement, known as the Banded Gneissic Complex (BGC), consists of 2.45–3.5-Ga-old gneisses, granitoids and associated rocks (Sivaraman & Odom, Reference Sivaram and Odom1982; Gopalan et al. Reference Gopalan, MacDougall, Roy and Murali1990; Wiedenbeck & Goswami, Reference Wiedenbeck and Goswami1994; Roy & Kröner, Reference Roy and Kröner1996; Wiedenbeck et al. Reference Wiedenbeck, Goswami and Roy1996). The Aravalli and Delhi mobile belts consist of metasedimentary and meta-igneous assemblages that evolved during the c. 2.0–1.8 Ga and c. 1.1–0.8 Ga orogenies, respectively (Choudhari et al. Reference Choudhuri, Gopalan and Sastry1984; Volpe & MacDougall, Reference Volpe and MacDougall1990; Tobisch et al. Reference Tobisch, Collerson, Bhattacharya and Mukhopadhyay1994; Wiedenbeck & Goswami, Reference Wiedenbeck and Goswami1994; Deb et al. Reference Deb, Thorpe, Krstic, Crofu and Davis2001). Table 1 gives a generalized stratigraphy and available radiometric ages of the basement and mobile belts in the Aravalli terrain.
Table 1. A generalized stratigraphic succession of the Aravalli terrain

A series of NE–SW-trending tectonic lineaments, each running for a few hundred kilometres and penetrating up to near Moho depth (c. 40 km), cut the Aravalli mountain range in separate blocks (Sinha-Roy et al. Reference Sinha-Roy, Malhotra and Mohanty1998; Mishra et al. Reference Mishra, Singh, Tiwari, Gupta and Rao2000; Dwivedi et al. Reference Dwivedi, Chamoli and Pandey2019). These lineaments occur as (from west to east): (i) the Phulad and Kaliguman shear zones bounding the bulk of the Delhi mobile belt on the west and east, respectively; (ii) the Delwara and Banas Faults that run along the BGC–Aravalli boundary; (iii) the Rakhabdev Fault that splits the Aravalli mobile belt into a platform sequence in the east and a turbidite sequence in the west; and (iv) the Great Boundary Fault running along the eastern boundary of the Aravalli terrain (Fig. 1). Among these lineaments, the Phulad shear zone and Rakhabdev Fault are regarded as the Proterozoic suture zones in the plate tectonic model for the evolution of the Aravalli range (Sinha-Roy et al. Reference Sinha-Roy, Malhotra and Mohanty1998).

Fig. 1. A simplified geological map of Aravalli terrain showing major tectonic lineaments and different lithounits (after Sinha-Roy et al. Reference Sinha-Roy, Malhotra and Mohanty1998). Inset shows Aravalli terrain in India.
The Great Boundary Fault (GBF), the focus of this study, crops out for > 400 km from Sapotara in the NE to Chittaurgarh and beyond in the SW (Fig. 1). Geophysical surveys have imaged the subsurface extension of the GBF for another 400 km north of Sapotara, under the Gangetic alluvium (Tiwari, Reference Tiwari, Sinha-Roy and Gupta1995). Dipping at a steep angle to the NW, the GBF occurs as reverse fault that emplaces the pre-Vindhyan rocks over the younger platform sediments of the Vindhyan Supergroup (Ray et al. Reference Ray, Martin, Veizer and Bowring2002). A series of small tear faults punctuate the GBF sporadically.
All along its strike length from Sapotara to Parsoli, the GBF runs parallel to the NNE–NE-trending folds in the adjacent Vindhyan sediments (Figs 2a, b, 3a). However, an exception seems to occur near Chittaurgarh, where the NE-trending GBF apparently truncates the N–S-trending folds in the Vindhyan sediments (Fig. 3b; Sinha-Roy et al. Reference Sinha-Roy, Kirmani, Reddy, Sahu and Patel1986). SW of Chittaurgarh, the GBF swerves to assume a parallelism with the N–S-trending folds. The study area around Chittaurgarh is therefore a pivotal point in the geometry of the GBF. With the help of satellite imagery, high-resolution outcrop mapping and structural analysis, we describe the structural characteristics and tectonic setting of the GBF around the Chittaurgarh area.

Fig. 2. Tectonic setting of the Great Boundary Fault (GBF). (a) Digital elevation model (DEM). N–S-trending folds appear truncating against the NE-trending GBF between Chittaurgarh and SW of Parsoli in the southwestern part. White arrow points to bend in the GBF around Chittaurgarh, the study area. (b) Anaglyph; DEMs of two areas, enclosed in rectangles 1 and 2, are shown in Figure 3a and b, respectively. CH – Chittaurgarh. Compare with (a) for the GBF trace and other locations. Observations through red–blue or red–cyan glasses provide distinct 3D visualization of the refolding.

Fig. 3. DEM images of the two areas in rectangles 1 and 2 in Figure 2b. (a) GBF runs parallel to ENE-trending folds in the NE and middle sectors. (b) In the SW sector, NE-trending GBF runs obliquely to N–S-trending folds (e.g. FS). White arrow points to the bend in the GBF around Chittaurgarh. CH – Chittaurgarh; FS – Fort synform.
3. Evidence from satellite imagery
We used two types of remote sensing datasets to decipher the large-scale structural pattern in the GBF: (i) 149 tiles of a digital elevation model (DEM) from the Advanced Land Observing Satellite (ALOS) Phased Array type L-band Synthetic Aperture Radar (PALSAR) data; and (ii) 14 scenes of Sentinel-2 multispectral data in 13 bands with 10, 20 and 60 m spatial resolution and 290 km field of view. A combination of principal component analysis and different filters was used for image enhancement. Superimposition of the geological features, extracted from Sentinel images and the ALOS PALSAR DEM, brought out the characteristic structural pattern in the GBF (Figs 2–4). Observing the anaglyph images obtained from the Sentinel images through red-blue or red-cyan glasses provides three-dimensional (3D) visualization of the structures in the GBF (Fig. 2b). A description of the remote sensing techniques used in this study is provided in online Supplementary Material S1 (available at http://journals.cambridge.org/geo).

Fig. 4. DEM showing examples of characteristic refolding in the GBF. (a) NE segment of the GBF around the Kushalipura–Hajjam Kheri area. (b) SW segment around the Mandalgarh–Parsoli area. F 1 – early fold; F 2 – late fold.
LandSat imagery and the DEM reveal that the GBF is a tectonic zone that contains intensely deformed Vindhyan sediments (Fig. 2a, b). The width of this zone varies from 10–15 km to 200–300 m. The processed images show distinct refolding of the early folds by the late folds over the entire GBF. Here, we present two typical examples of large-scale structures in the GBF. The first example is from the NE sector of the GBF around Kushalipura–Hajjam Kheri area (Fig. 4a). The second example shows refolded folds in the SW sector of the Mandalgarh–Parsoli area (Fig. 4b). Both examples highlight the occurrence of refolded folds in the GBF zone.
4. GBF around Chittaurgarh
A simplified stratigraphic order of the lithounits across the GBF is given in Table 2. The Berach Granite, a component of the Banded Gneissic Complex, occupies the low-lying plains in the hanging wall of the GBF. On the GBF footwall, the synclinal hills and anticlinal valleys expose the Kaimur Sandstone – Suket Shale beds and the Nimbahera Limestone–Nimbahera Shale beds, respectively (Fig. 5a).
Table 2. Lithounits and structural characteristics in the GBF core and damage zone in the study area. GBF – Great Boundary Fault.


Fig. 5. (a) Geological map of the study area (after Prasad, Reference Prasad1984). FC (core) and DZ (damage zone) of the GBF in the Berach River–Fort section. (b) Lower-hemisphere equal-area projection of poles to bedding surface in a large-scale F 1 fold, the Fort synform, in the damage zone (after Srivastava & Sahay, Reference Srivastava and Sahay2003).
This study is based on the observations along the Berach River Fort section that exposes the GBF core and the damage zone (Caine et al. Reference Caine, Evans and Forster1996; Choi et al. Reference Choi, Edwards, Ko and Kim2016). We distinguish the core from the damage zone on the basis of characteristic structures and contrast in deformation intensity (Table 2). Three successive phases of folds, F 1, F 2 and F 3, and ductile shear zones are the characteristic structures in the shale beds occupying the core. By contrast, the damage zone rocks, affected by only a single phase of folding, are cut by the mesoscopic-scale brittle-ductile shear zones and striated faults. The deformation intensity, inferred qualitatively from frequency distribution and complexity of structures, is higher in the core than in the damage zone. The damage zone-core boundary runs approximately along the lithological contact between the Nimbahera Limestone and Nimbahera Shale beds (DZ and FC in Fig. 5a). With progressive decrease in the intensity of deformation towards the east, the damage zone grades into undeformed wall rock, the flat-lying Vindhyan sediments.
4.1. The GBF damage zone
The bedding surface (S 0) in the damage zone is deformed into N–S trending and open to gentle large-scale F 1 folds. The Fort synform is a typical example of the large-scale structure in the damage zone (Fig. 5a, b). A weak axial plane cleavage (S 1) is occasionally associated with the F 1 folds, in particular, in the limestone beds (Fig. 6). The mesoscopic-scale structures characterizing the damage zone are the conjugate pairs of brittle-ductile shear zones (BDSZ) containing en échelon veins and striated faults (Fig. 7a–c). Oriented consistently on the limbs and hinge zone, the BDSZ and striated faults post-date the large-scale F 1 folding.

Fig. 6. Sub-horizontal bedding (S 0) and N–S-striking upright axial plane cleavage (S 1) around an F 1 fold hinge zone in the damage zone. Rock type: Nimbahera Limestone.

Fig. 7. Characteristic mesoscopic structures in GBF damage zone. (a) Conjugate pair of strike-slip brittle-ductile shear zones containing en échelon quartz veins (plan view; S 0 is sub-horizontal and the veins are upright). Half-barbed arrows indicate shear sense. (b) An upright striated strike-slip fault. The slip direction is horizontal (parallel to striae) and slip-sense is dextral. White arrow – direction of movement of the missing block. (c) A striated thrust cuts the sub-horizontal bedding surface (S 0) at a low angle. Hanging wall moves in the direction of black arrow. All examples are from the sandstone beds on the western limb of the Fort synform.
The angular relationship between the en échelon veins and the shear zone boundary reveals unambiguous shear sense in the BDSZ (Ramsay & Huber, Reference Ramsay and Huber1983). Similarly, the slip direction is inferred along a line that is perpendicular to the intersection of veins and shear zone boundary. These criteria reveal horizontal-dextral and horizontal-sinistral shear sense in the complementary sets of conjugate BDSZ. Without exception, the veins in the sandstone and limestone beds are infilled by quartz and carbonate minerals, respectively. Such a strong lithological control on vein composition implies that the syntectonic fluids were derived from the respective host rocks. A fluid inclusion study by Srivastava & Sahay (Reference Srivastava and Sahay2003) reveals the development of the BDSZ by syntectonic Na-Ca-Cl brines at 160–200°C temperature and 53 MPa pressure.
In addition to the BDSZ, two groups of mesoscopic-scale striated faults cut through the damage zone rocks. The first group consists of conjugate pairs of strike-slip faults that are characterized by sub-vertical dip angles and sub-horizonal striae (Figs 7b, 8a). The orientations, slip sense and slip direction on the striated strike-slip faults and the corresponding BDSZ are consistent. The second group of striated faults contains conjugate pairs of thrusts (Figs 7c, 8b). Striae on the thrusts reveal a dominantly up-dip movement of the hanging wall. We used the direct inversion method for palaeostress estimation from the strike-slip faults and the BDSZ, and the thrusts (Angelier, Reference Angelier1990, Reference Angelier and Hancock1994; Srivastava et al. Reference Srivastava, Lisle and Vandycke1995; Srivastava & Sahay, Reference Srivastava and Sahay2003). The results show that the striated strike-slip faults/brittle-ductile shear zones and the thrusts are compatible with horizontal ENE–WSW-directed maximum compression, σ1 (Fig. 8a, b). However, the shape factor, ϕ = (σ2−σ3)/(σ1−σ3), determined via palaeostress analyses, is insignificant due to the Andersonian geometry of the BDSZ and the striated faults (Angelier, Reference Angelier and Hancock1994). In a recent review, Lacombe (Reference Lacombe2012) addresses the issues related to palaeostress estimation from the inversion of fault-slip data and a comparison with the contemporary stress patterns.

Fig. 8. Results of palaeostress analysis in the damage zone. (a) Strike-slip structures, faults and brittle-ductile shear zones. (b) Compressional structures, thrusts. σ1 orientation is consistent in (a) and (b). After Srivastava & Sahay (Reference Srivastava and Sahay2003).
4.2. The GBF core
The GBF core, a zone of intense deformation in the Nimbahera Shale, is spectacularly exposed along the Berach River flowing in the vicinity of the Berach Granite. The core is characterized by numerous metre-scale doubly-plunging en échelon folds and thin mylonite-bearing ductile shear zones. Outcrop-scale refolded folds and deformed lineations are common in the core. In contrast to the damage zone, the core lacks any brittle-ductile shear zones, en échelon veins or striated faults. We highlight the deformation style in the GBF core by using the evidence from high-resolution outcrop mapping and structural analysis of the mesoscopic-scale fabric data.
4.2.a. Folds
Overprinting relationships, such as the refolded folds and deformed intersection lineations, help to distinguish three successively developed fold groups (F 1, F 2 and F 3) in the GBF core (Figs 9a, b, 10a, b). F 1 folds, developed on bedding surfaces (S 0) and intrafolial quartz veins, occur as variably oriented isoclines and rootless hinge zones. Deformed intersection lineations (S 0/S 1), occurring as curvilinear traces on F 2 fold surfaces, imply a non-coaxial refolding of F 1 folds during F 2 folding (Fig. 9b).

Fig. 9. Overprinting relationships in the GBF core. (a) Open and asymmetric F 2 folds refold the F 1 folds traced by thin quartz veins. F 1 axial trace, marked by yellow line, is parallel to S 1. (b) Traces of thin quartz veins occur as deformed F 1 lineations on F 2 fold surfaces. Rock type: Nimbahera Shale.

Fig. 10. Relationship between F 1 and F 2 folds in the GBF core. (a) Refolding of an isoclinal F 1 fold by an upright-non-plunging F 2 fold trending 042°. F 1 hinge line plunges at variable angles. (b) Schematic diagram shows refolding of an F 1 fold by F 2 fold. F 1 fold geometry varies from recumbent to reclined on the hinge zone and limbs of F 2 fold, respectively. hl – hinge line. Rock type: Nimbahera Shale.
Characteristically open to close and symmetric to asymmetric F 2 folds, traced by S 0//S 1 surfaces, are ubiquitous in the GBF core. In contrast to the heterogeneously oriented F 1 folds, F 2 folds are characterized by consistently NNE–NE-striking upright axial planes and doubly-plunging hinge lines. Evidence from the outcrop-scale refolded folds reveals that the variation in F 1 fold orientation is primarily due to the superposition of F 2 folds (Fig. 10a). F 1 folds occurring on F 2 hinge zones and limbs are commonly recumbent and reclined, respectively (Fig. 10b). Several outcrops show such an en échelon arrangement of F 2 folds that implies dextral shear sense in the GBF core (Fig. 11). The hinge line bifurcation, an artefact of buckling (Sahay & Srivastava, Reference Sahay and Srivastava2005 a), is yet another characteristic of F 2 folds in the GBF core. Commonly, an antiform bifurcates into two such branch antiforms that share a common synform. The resultant hourglass outcrop pattern juxtaposes the main antiform and shared synform along a common axial trace (Fig. 12a). F 3 folds, trending characteristically NNW–NW, are infrequently developed as broad warps. Although rare, the interference between F 2 and F 3 produces axial culminations, consisting of curvature accommodation folds, at a few outcrops (Fig. 12b). Both F 2 and F 3 folds lack any axial plane cleavage.

Fig. 11. En échelon arrangement of doubly-plunging F 2 folds suggests dextral shear sense in the GBF core. Rock type: Nimbahera Shale. 1–4 – hinge lines.

Fig. 12. Hourglass map pattern and culmination in the GBF core. (a) Bifurcation of a fold hinge line juxtaposes the main antiform and shared synform along a common axial trace, and produces an hourglass map pattern. After Sahay & Srivastava (Reference Sahay and Srivastava2005 a). (b) Axial culmination in subarea IV. Student Priyanka Hazarika for scale. Rock type: Nimbahera Shale beds.
4.2.b. Deformed intersection lineations
F 2 fold surfaces commonly contain deformed intersection lineations that represent curvilinear F 1 hinge lines (Fig. 9b). We traced these lineations by overlaying transparent sheets on individual F 2 folds. Upon unrolling the tracings about F 2 hinge lines, the F 1 lineations assumed a dominantly ENE–WSW-directed rectilinear pattern (Fig. 13a, b). Two inferences can be drawn from such unrolled patterns: (i) F 1 hinge lines were dominantly trending ENE–WSW before the superimposition of F 2 folds; and (ii) F 2 folds were developed by the flexural-slip mechanism (Ramsay, Reference Ramsay1967; Ghosh & Chatterjee, Reference Ghosh and Chatterjee1985; Ramsay & Huber, Reference Ramsay and Huber1987). Several other lines of evidence supporting flexural-slip during F 2 folding are class 1B fold geometry and the occurrence of hinge-line-normal striae on the bedding surfaces.

Fig. 13. (a) Unrolled patterns of deformed intersection lineations (F 1) occurring in F 2 folds in the Nimbahera Shale beds. (b) Rosette obtained by scaling and overlapping mid-points of 49 unrolled F 1 lineation patterns. ENE–WSW-directed rectilinear patterns are predominant.
4.2.c. Shear zones
Numerous decimetre-thin ductile shear zones occur as characteristic structures in the GBF core (Sahay & Srivastava, Reference Sahay and Srivastava2005 b). Typically, the shear zones consist of mylonitized quartz veins, millimetre-thin dark phyllonite bands and oxidized opaques. Based on the angular relationship with the bedding surface, we classify the shear zones into three descriptive types: (i) concordant shear zones that run parallel to bedding surface and trace F 2 folds (Fig. 14a, b); (ii) discordant shear zones that cut across F 2 folds (Fig. 14c); and (iii) hybrid shear zones that are partly concordant and partly discordant. Two sets of quartz veins, V 1 and V 2, are associated with the shear zones. V 1 veins run parallel to the bedding surfaces (S 0) tracing the isoclinal F 1 folds. V 2 veins cut across the V 1 veins and show characteristic lateral offsets along the shear surfaces (Fig. 14b). The ductile shearing initiated during or before F 2 folding and outlasted the development of F 2 folds and V 2 veins in the GBF core.

Fig. 14. Ductile shear zones in the Nimbahera shale beds of the GBF core. (a) A concordant shear zone running parallel to bedding (S 0). V 1 quartz veins run parallel to the mylonite foliation in the shear zone. (b) Thin V 1 veins trace isoclinal F 1 fold (indicated by thick white arrow) in a concordant shear zone (after Sahay & Srivastava, Reference Sahay and Srivastava2005 b). Thick V 2 veins, cutting across the V 1 veins, are offset sinistrally. (c) Discordant shear zone contains a domino structure that is made up of imbricated quartz veins. S 0 – bedding surface.
Microstructures, such as the S-C (schistosité et cisaillement) fabric, dominos and asymmetric quartz boudins are common in all three types of shear zones (Fig. 14b, c). Different stages of dynamic recrystallization can be traced through microstructures in the shear zones. The core-and-mantle structure, containing σ-porphyroclasts, represents an early stage of mylonitization (Fig. 15a). With a progressive increase in the intensity of shearing, the mylonite assumed a banded structure that consists of alternate bands of coarse quartz-ribbons and biotite-rich fine-grained recrystallized quartz (i and ii in Fig. 15b). Finally, the static recrystallization took over the dynamic recrystallization, resulting in development of foam texture (Fig. 15c; Hobbs et al. Reference Hobbs, Means and Williams1976; Passchier & Trouw, Reference Passchier and Trouw1998).

Fig. 15. Microstructures in shear zone mylonites in the GBF core (cross-polarized light). (a) Core-and-mantle structure produced as a result of subgrain rotation during dynamic recrystallization. Arrow indicates a σ-porphyroclast. (b) Mylonite containing alternate bands of ribbon-quartz (i) and biotite-rich fine-grained quartz (ii). (c) Foam texture formed as a result of static recrystallization. (a) and (b) after Sahay & Srivastava (Reference Sahay and Srivastava2005 b).
5. Structural characteristics of the GBF core
The structures on both banks of the Berach River, exposing the GBF core, are similar. For the sake of brevity, we therefore present the structural analysis of the GBF core exposed on the NW bank. Based on the homogeneity in F 2 hinge line orientation, we divided the GBF core into four subareas, I to IV (Fig. 16). In each subarea, high-resolution mapping by the tape-and-compass method was followed by structural analysis by routine techniques (Turner & Weiss, Reference Turner and Weiss1963; Ramsay, Reference Ramsay1967; Ramsay & Huber, Reference Ramsay and Huber1987). The mapping scale varies from 1:400 to 1:100 depending upon the complexity of structures in the individual subareas. F 1 folds are too small and F 3 folds are too rare for map representation; our maps therefore show the distribution of F 2 folds and ductile shear zones (Figs 17–19). The rock type in all four subareas is Nimbahera Shale.

Fig. 16. Fold axial traces and shear zones in the GBF core. Rock type: Nimbahera Shale. Dotted lines mark boundaries of subareas I to IV on the NW bank of Berach River.

Fig. 17. (a) F 2 folds and shear zones in the shale beds in subarea I of the GBF core (after Sahay & Srivastava, Reference Sahay and Srivastava2005 b). Concordant shear zones (CSZs) run parallel to bedding surface, whereas discordant shear zones (DSZs) cut across the bedding surface. Gently non-planar doubly-plunging F 2 folds, branched hinge lines and hourglass structures are common. (b) Poles to F 2 axial planes and hinge lines. (c, d) Poles to concordant and discordant shear zones and respective stretching lineations. hl – hinge line; axl pl – axial plane; ln – stretching lineation.
5.a. Structural analysis
Among the three groups of folds in the GBF core, NNE–NE-trending and doubly-plunging F 2 folds are abundant in all subareas (Figs 17–19). Branched fold hinge lines, sigmoidal axial traces and hourglass structures are the common outcrop patterns in the GBF core. The starfish-like outcrop pattern in subarea IV represents an axial culmination that contains several curvature-accommodation folds (Fig. 19a; Lisle et al. Reference Lisle, Styles and Freeth1990). Table 3 summarizes the results of structural analysis in individual subareas I–IV.
Table 3. Outline of structural characteristics in subareas I to IV in the GBF core (Fig. 16). CSZ – concordant shear zone; DSZ – discordant shear zone; Ln – stretching lineations.

5.b. Generalized structural pattern
The generalized structural architecture of the GBF core is obtained by synoptic analysis that combines the observations from all four subareas (Fig. 20a–g). Both the synoptic structural analysis and the map patterns reveal that the F 2 folds control the structural geometry of the GBF core. Over the large scale, the bedding-parallel cleavage surface is folded about the SW-plunging axis that parallels the mesoscopic-scale F 2 fold hinge lines (Fig. 20b, c). F 1 folds, although rarely preserved, are heterogeneously oriented (Fig. 20a). F 3 folds occur as gentle, upright warps that plunge at low to moderate angles towards the NW (Fig. 20e).
The concordant shear zones trace F 2 folds that dominantly plunge at low angles towards the SW (cf. Fig. 20b, f). Stretching lineations on these shear zones are parallel or sub-parallel to F 2 hinge lines in the GBF core (Fig. 20c, f). By contrast, discordant shear zones and corresponding stretching lineations show heterogeneous orientations (Fig. 20g).
Ductile shear zones in the core differ from BDSZ in the damage zone in several respects. First, the BDSZ are consistently oriented, whereas the ductile shear zones are folded and heterogeneously oriented (cf. Figs 8a, 20f, g). Second, the ductile shear zones record a protracted history of shearing from pre- or syn-F 2 to post-F 2 folding, while the BDSZ post-date F 1 folding. Third, the microstructures in the ductile shear zones, such as the bulging recrystallization, subgrain rotation and quartz ribbons (Fig. 15a, b), suggest a peak temperature (> 300°C) that is substantially higher than that for the development of the BDSZ (160–200°C) as determined from a fluid-inclusion study (Srivastava & Sahay, Reference Srivastava and Sahay2003). Finally, the quartz veins in ductile shear zones are commonly mylonitized, whereas those in BDSZ are fibrous and show no recrystallization or cataclastic grain size reduction.
6. Discussion
The polyphase folds are characteristically confined within the GBF core. The damage zone contains single-phase folds that die out into flat-lying sediments towards the east in the interior of the Vindhyan basin. The confinement of folds in the GBF and their progressive disappearance towards the interior of the Vindhyan basin indicate the existence of a genetic link between the folds and the GBF. Whether the polyphase folds in the core formed in three temporally discrete deformation phases or due to flow perturbations during a progressive shearing (Platt, Reference Platt1983; Hudleston et al. Reference Hudleston, Schultz-Ela and Southwick1988; Alsop & Holdsworth, Reference Alsop and Holdsworth2002) remains unresolved due to a lack of geochronological data.
As mentioned in Section 4.1, numerous strike-slip BDSZ faults and thrusts cut through the GBF damage zone. Srivastava & Sahay (Reference Srivastava and Sahay2003) propose that the BDSZ and the thrusts correspond to two discrete phases of movements on the GBF. Detailed scrutiny of the outcrops reveals a lack of consistent and unambiguous overprinting relationships between the strike-slip structures and the thrusts. We therefore infer that the strike-slip structures and the thrusts were developed in a common transpressive deformation. This inference is corroborated by the palaeostress directions given by the inversion of fault-slip data (Fig. 8a, b). Both the strike-slip structures and thrusts are compatible with the horizontal ENE–WSW-directed maximum compression σ1 (Fig. 8a, b). It is likely that an episodic interchange in the local stresses, σ2 and σ3, in a regionally transpressive regime resulted in the development of strike-slip structures and thrusts in the damage zone.
The orthorhombic symmetry of conjugate structures, namely the BDSZ, strike-slip faults and thrusts, and the symmetric geometry of large-scale folds (e.g. the Fort synform), point to a contraction or pure-shear-dominated deformation in the damage zone. By contrast, several lines of evidence, such as the en échelon fold arrangement (Fig. 11), rotated S-surfaces in ductile shear zones (Fig. 14b), imbricate quartz veins in dominos (Fig. 14c), rotated σ-porphyroclasts (Fig. 15a) and asymmetric boudins all indicate a wrench or simple shear-dominated deformation in the GBF core.
Two main lines of evidence reveal dextral shear sense in the transpression. First, the en échelon pattern of F 2 folds is consistent with dextral shear sense (Fig. 11). Second, ENE–WSW-directed horizontal σ1, obtained from palaeostress analysis of striated faults, the BDSZ and thrusts (Fig. 8a, b), is consistent with dextral shear sense on the NE-striking GBF around Chittaurgarh. Combining the above lines of evidence, we interpret a strain-partitioned dextral transpression in the GBF in the study area (Fig. 21). The contrast in lithology and mechanical anisotropy, with respect to the compositional layering, fissility and ease of inter-layer slip, may have contributed to strain partitioning in the GBF.
According to Sinha-Roy (Reference Sinha-Roy2007), an oblique convergence led to the impingement of the dominantly granitic and rigid Bundelkhand craton on the Aravalli terrain during the Neoproterozoic period. The indentation resulted in the development of a top-to-the-E piggy-back sequence of reverse faults that includes the GBF as a frontal fault. We note that the GBF runs parallel to the irregular boundary of the rigid indenter, the Bundelkhand craton. Mimicking the bend in the western margin of the Bundelkhand craton, the GBF swerves from NE to N–S near Chittaurgarh. Beyond Sapotara, the northern extension of the GBF diverts from NE to E–W under the Gangetic Alluvium. This diversion in the GBF is also parallel to the Faizabad ridge, a part of the Bundelkhand craton (Tiwari, Reference Tiwari, Sinha-Roy and Gupta1995; Valdiya, Reference Valdiya and Paliwal1998). Based on the above observations, we infer that the shape of the Bundelkhand craton controls the curviplanar geometry of the GBF.
7. Conclusions
High-resolution outcrop mapping highlights the structural contrast between the damage zone and core and reveals the relationship between the GBF and the folds. Whereas the map pattern in the GBF core is controlled by NE-trending F 2 folds, the damage zone map pattern is controlled by N–S-trending F 1 folds. Apart from the large-scale F 1 folds, the mesoscopic-scale brittle-ductile shear zones, en échelon veins and striated faults are the distinctive structures in the damage zone. By contrast, three successively developed fold groups, F 1, F 2 and F 3, and the ductile shear zones are the characteristic structures in the GBF core. Outcrop mapping brings out the parallelism between the GBF and F 2 fold axial traces. Although not evident on the satellite imagery due to the limitation of the scale, F 2 folds are traceable by high-resolution outcrop mapping in the GBF core around Chittaurgarh (Figs 17–19). For several hundred kilometres along its strike length, the GBF runs parallel to F 2 axial traces.

Fig. 18. (a) F 2 folds and shear zones in the shale beds in subarea II of the GBF core. NNE-trending F 2 folds assume NE trend in the eastern part due to increased shearing intensity. (b) Subarea III: sigmoidal, doubly-plunging and branched folds are common in the eastern part. (i–vi) Lower-hemisphere equal-area projections. hl – hinge line; axl pl – axial plane; ln – stretching lineation.

Fig. 19. (a) Map pattern in the shale beds in subarea IV. Starfish outcrop pattern, the axial culmination, contains curvature accommodation folds. (b) Scatter in the F 2 hinge line and axial plane orientations are due to F 3 folding. Lower-hemisphere equal-area projections.
It is well known that the GBF is a reverse fault (Heron, Reference Heron1936; Coulson, Reference Coulson1967; Iqbaluddin et al. Reference Iqbaluddin, Sharma, Mathur, Gupta and Sahai1978; Sinha-Roy et al. Reference Sinha-Roy, Malhotra and Mohanty1998). However, our study shows that the ENE–WSW-directed oblique compression was partitioned into a dominant contraction in the damage zone and a dominant dextral shearing in the core (Fig. 21). The GBF is a strained-partitioned zone of dextral transpression in the study area.

Fig. 20. (a–g) Results of synoptic structural analysis in the GBF core. Lower-hemisphere equal-area projections. S 0 – bedding surface; S 1–F 1 – axial plane cleavage; hl – hinge line; axl pl – axial plane; CSZ – concordant shear zone; DSZ – discordant shear zone; n – number of observations.
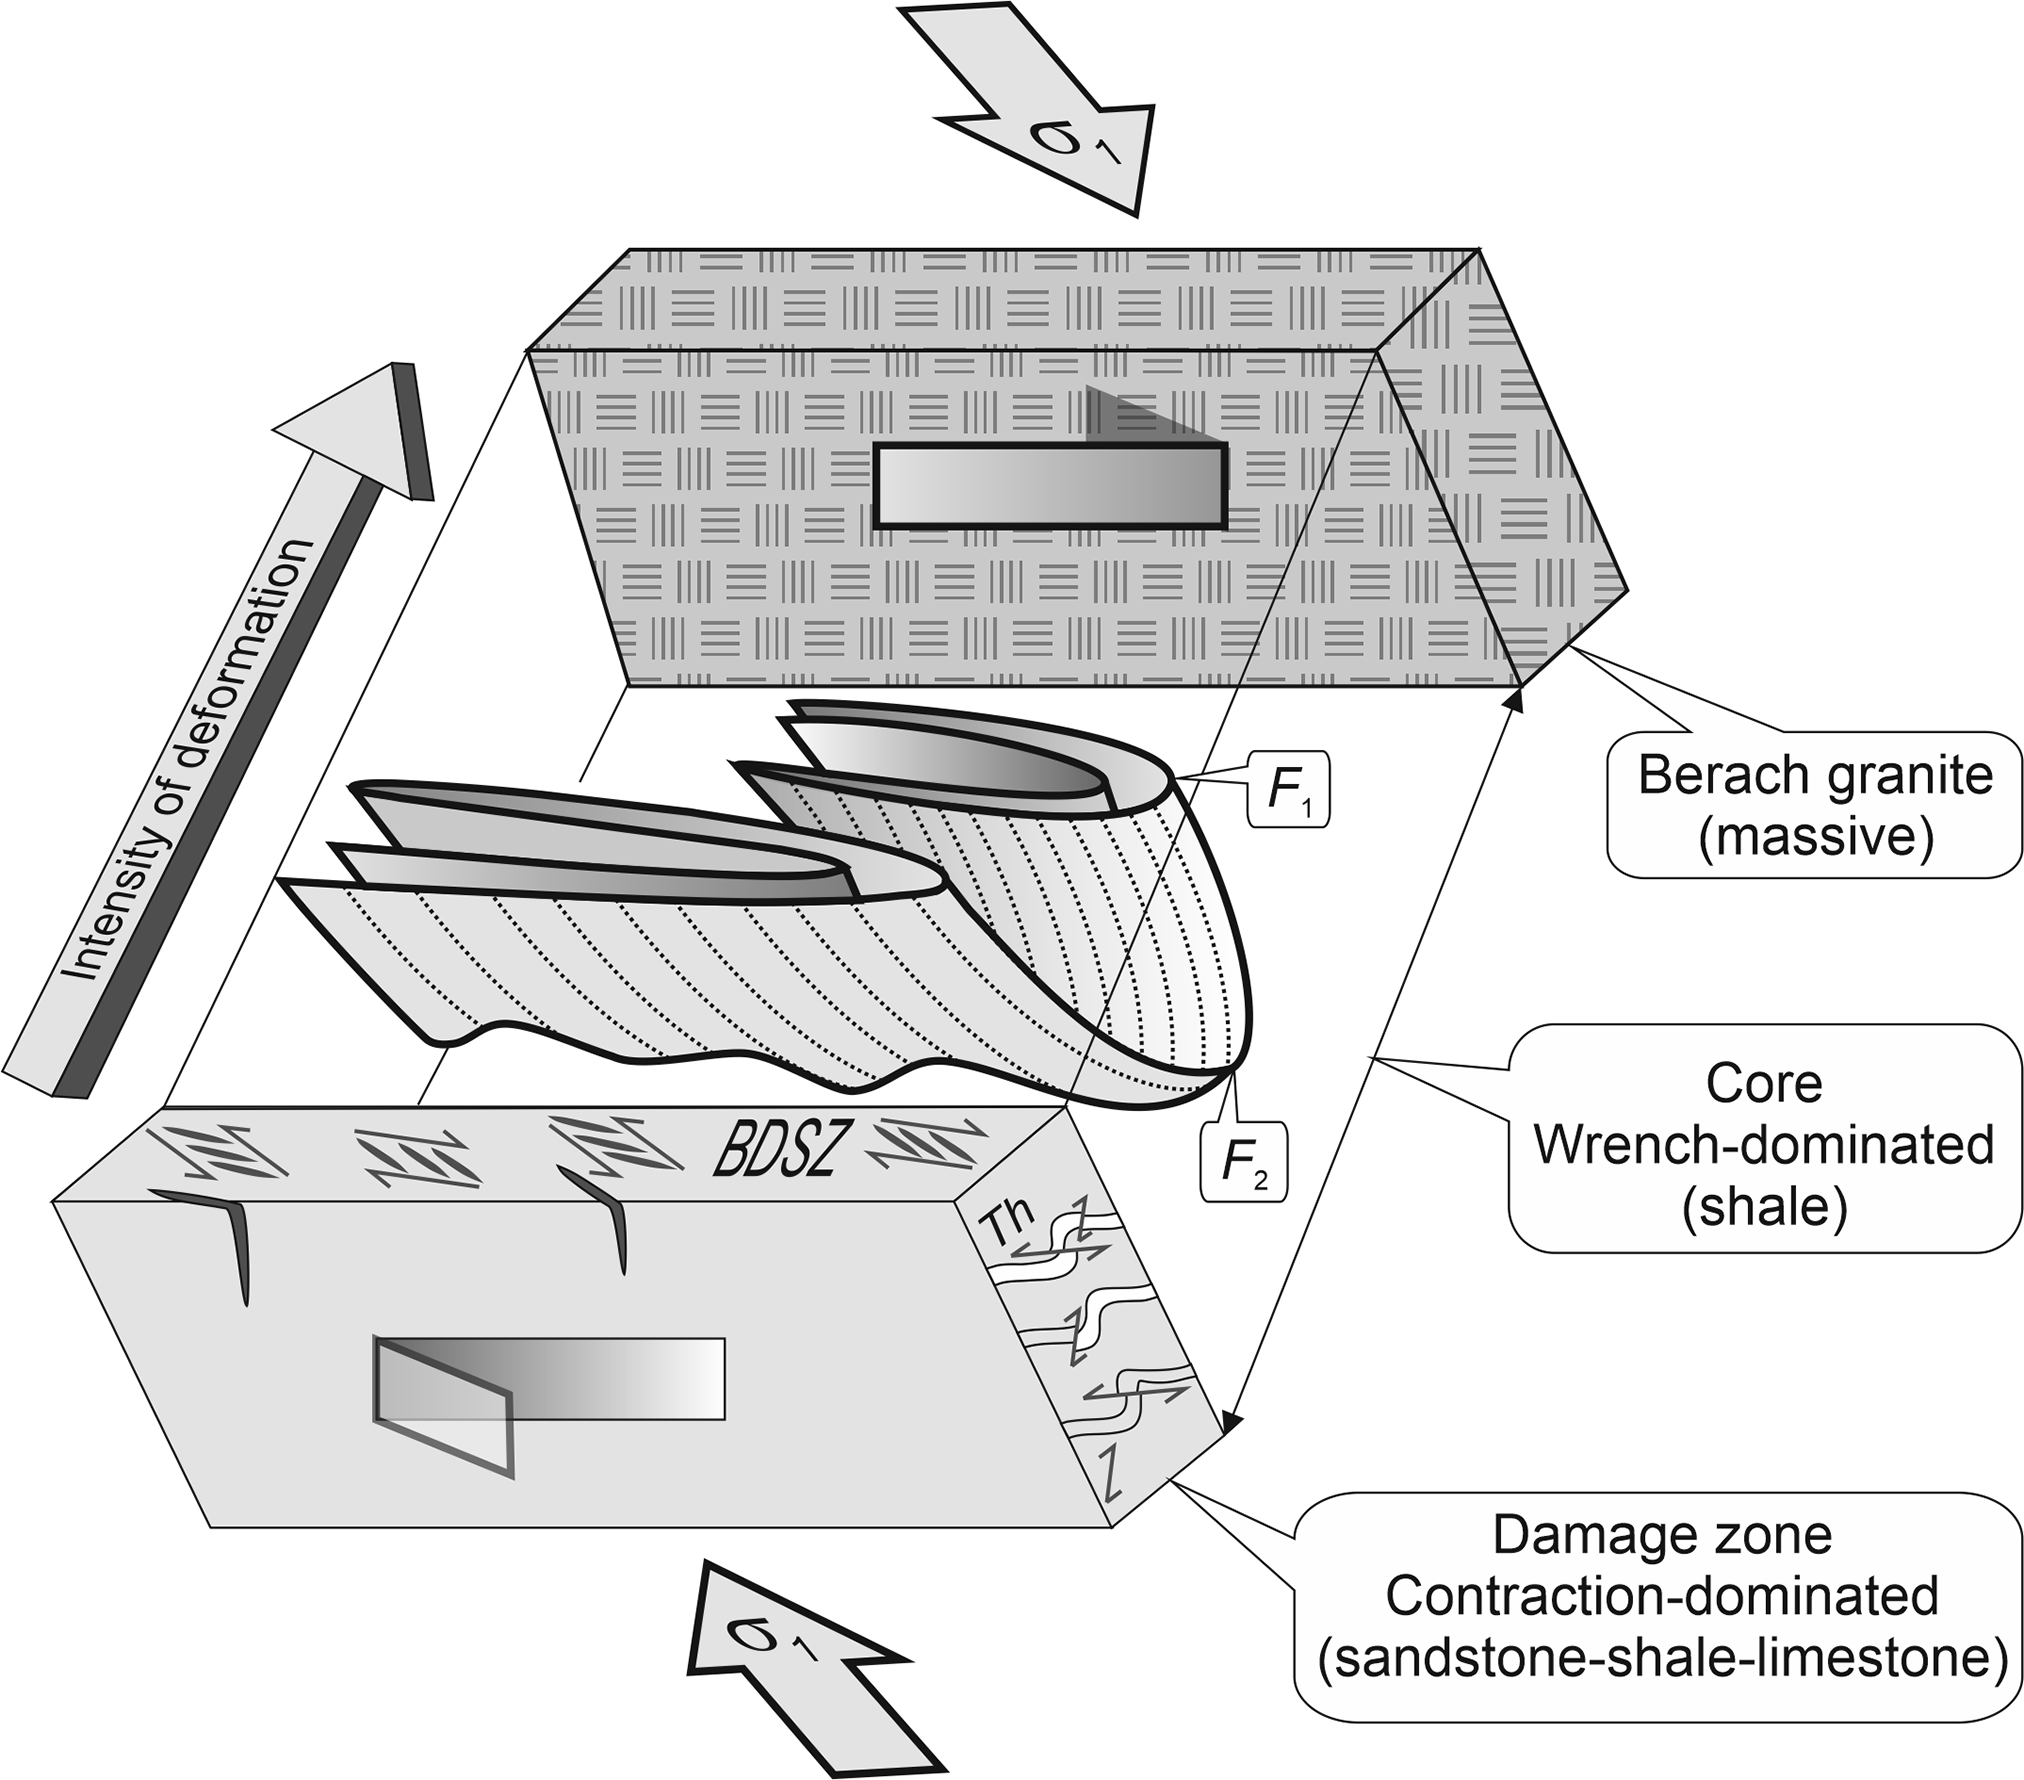
Fig. 21. Schematic model shows prominent representative structures in the strain-partitioned GBF (not to scale). Dotted lines on F 2 fold surfaces represent deformed F 1 lineations. For simplicity, locally developed F 3 folds are not shown. The increase in the intensity of deformation is inferred qualitatively from the frequency distribution and complexity of structures. BDSZ – strike-slip type of conjugate brittle-ductile shear zones containing en échelon veins; Th – conjugate thrusts.
Acknowledgements
Erudite comments and constructive suggestions from Professor Olivier Lacombe and the two anonymous reviewers helped to improve the manuscript considerably. We are grateful to Gargi Sen, Priya Pachauri and several Masters students for their help during the fieldwork. We thank Elsevier, Current Science and Geological Society of India for permission to reproduce some of the figures from our articles published earlier. This study is funded by JC Bose Fellowship SR-S2-/JCB-46/2012 of the Department of Science and Technology and grant no. 24(0364)/20/EMR-II of the Council of Scientific and Industrial Research, Government of India.
Conflict of interest
None.


