


1. Introduction
The Middle Permian is characterized by several regression–transgression couplets, including a global large-scale regression during late Middle Permian times to the lowest level of the Phanerozoic Eon (Hallam & Wignall, Reference Hallam and Wignall1999; Wardlaw et al. Reference Wardlaw, Davydov, Gradstein, Gradstein, Ogg and Smith2004; Haq & Schutter, Reference Haq and Schutter2008; Kofukuda et al. Reference Kofukuda, Isozaki and Igo2014). The regression–transgression events are stratigraphically recorded by Middle Permian marine deposits in South China, located in the palaeo-Tethyan region, including Guangxi (Qiu et al. Reference Qiu, Sun, Wang and Zou2014a), Guizhou (Shen & Xu, Reference Shen and Xu2005) and Sichuan (Isozaki et al. Reference Isozaki, Yao, Ji, Saitoh, Kobayashi and Sakai2008; Saitoh et al. Reference Saitoh, Isozaki, Yao, Ji, Ueno and Yoshida2013) provinces. Numerous studies have been conducted to investigate various aspects of the regression–transgression couplets coupled with relative sea-level variations in Middle Permian times (Chen et al. Reference Chen, Jin and Shi1998; Wang & Sugiyama, Reference Wang and Sugiyama2000; Yang et al. Reference Yang, Liu and Shi2004; Rygel et al. Reference Rygel, Fielding, Frank and Birgenheier2008; Bond & Wignall, Reference Bond and Wignall2009), e.g. sequence stratigraphy (Tong et al. Reference Tong, Yin and Zhang1999; Bhattacharya & Banerjee, Reference Bhattacharya and Banerjee2015) and sedimentary facies analysis in conjunction with refined biostratigraphy (Isozaki et al. Reference Isozaki, Yao, Ji, Saitoh, Kobayashi and Sakai2008; Wignall et al. Reference Wignall, Védrine, Bond, Wang, Lai, Ali and Jiang2009; Saitoh et al. Reference Saitoh, Isozaki, Yao, Ji, Ueno and Yoshida2013; Kofukuda et al. Reference Kofukuda, Isozaki and Igo2014; Qiu et al. Reference Qiu, Sun, Wang and Zou2014a). Additionally, a variety of proxies have been used to decipher the environmental and climatic responses to past sea-level fluctuations, including bulk rock and clay mineral compositions, total organic carbon (TOC) and Sr/Ca ratios (Adatte et al. Reference Adatte, Keller and Stinnesbeck2002; Jarvis et al. Reference Jarvis, Mabrouk, Moody, Murphy, Sandman, Salem and El-Hawat2008), stable isotopes (Stüben et al. Reference Stüben, Kramar, Berner, Stinnesbeck, Keller and Adatte2002; Siddall et al. Reference Siddall, Rohling, Almogi-Labin, Hembleben, Meischner, Schmelzer and Smeed2003; Olde et al. Reference Olde, Jarvis, Uličný, Pearce, Trabucho-Alexandre, Čech, Gröcke, Laurin, Švábenická and Tocher2015), benthic and planktonic foraminifera and diatoms (Galeotti & Coccioni, Reference Galeotti and Coccioni2002; Brett & Mclaughlin, Reference Brett and Mclaughlin2009; Bak, Reference Bak2015; Wendler et al. Reference Wendler, Wendler and Clarke2016), fossil coral reefs (Yamamoto et al. Reference Yamamoto, Iryu, Sato, Chiyonobu, Sagae and Abe2006; Camoin & Webster, Reference Camoin and Webster2015) and salt-marsh sediments (Shaw & Ceman, Reference Shaw and Ceman1999; Brain et al. Reference Brain, Kemp, Horton, Culver, Parnell and Cahill2015), fossil plant and otolith assemblages (Sandoval et al. Reference Sandoval, O’Dogherty and Guex2001; Girone, Reference Girone2005; Jank et al. Reference Jank, Wetzel and Meyer2006; Beiranvand et al. Reference Beiranvand, Ghasemi-Nejad and Kamali2013), carbonate microfacies (Han et al. Reference Han, Hu, Li and Garzanti2016) and the organic molecular compound index method (Wang et al. Reference Wang, Cui, Shao, Zhang, Dong and Liu2015). Based on the palaeopedology of the Permian deposits, there have been extensive studies regarding palaeoclimate and palaeoenvironment reconstructions (Tabor & Montañez, Reference Tabor and Montañez2005; Tabor et al. Reference Tabor, Montañez, Scotese, Poulsen and Mack2008, Reference Tabor, Smith, Steyer, Sidor and Poulsen2011); however, little attention has been paid to the palaeosols for the interpretation of sea-level changes.
Rygel et al. (Reference Rygel, Fielding, Frank and Birgenheier2008) performed a meta-analysis on over 100 published Permian eustatic sea-level records that were based on a variety of proxies. While these authors attempted to normalize the results to account for the type of proxy that was used to reconstruct sea-level (e.g. Haq & Schutter, Reference Haq and Schutter2008; Bak, Reference Bak2015; Olde et al. Reference Olde, Jarvis, Uličný, Pearce, Trabucho-Alexandre, Čech, Gröcke, Laurin, Švábenická and Tocher2015), a number of challenges remain. The reason for this is that subtle changes in sedimentation may not be discernable from lithofacies or fossil communities related to changes in depositional depths away from coastal areas (Sames et al. Reference Sames, Wagreich, Wendler, Haq, Conrad, Melinte-Dobrinescu, Hu, Wendler, Wolfgring, Yilmaz and Zorina2016). Even though the pinning point method may quantitatively provide a relative sea-level history (Goldstein & Franseen, Reference Goldstein and Franseen1995), short-term sea-level variations may not be detected by sequence-stratigraphic data.
Palaeosols (fossil soils), unlike marine sedimentary records, are formed at the Earth’s surface and provide a direct record of the environmental conditions at the time of their formation (Retallack, Reference Retallack2001; Sheldon & Tabor, Reference Sheldon and Tabor2009; Tabor & Myers, Reference Tabor and Myers2015). Even rare palaeosols can be useful for interpreting specific geological events (Gvirtzman et al. Reference Gvirtzman, Martinotti, Moshkovitz and Van Couvering1997; Álvaro et al. Reference Álvaro, Vliet-Lanoë, Vennin and Blanc-Valleron2003; Narkiewicz & Retallack, Reference Narkiewicz and Retallack2014; Tsatskin et al. Reference Tsatskin, Sandler and Avnaim-Katav2015), for example, acid-sulfate soils. Acid-sulfate soils, which form in coastal zones and mangrove swamp environments, alternating between exposure to air and inundation by the sea (Dent & Pons, Reference Dent and Pons1995; Fanning et al. Reference Fanning, Rabenhorst, Burch, Islam, Tangren, Dixon and Schulze2002; Fitzpatrick, Reference Fitzpatrick and Roach2003; Fitzpatrick et al. Reference Fitzpatrick, Shand, Merry and Jennings2009; Ljung et al. Reference Ljung, Maley, Cook and Weinstein2009), are soils in which sulfuric acid may be produced, is being produced, or has been produced in certain amounts (Pons, Reference Pons and Dost1973; Dent & Pons, Reference Dent and Pons1995), and contain iron sulfide minerals (predominantly as the mineral pyrite (FeS2)) or their oxidation products (e.g. jarosite, gypsum). Thus, acid-sulfate soils may be used to provide insights into relative sea-level fluctuations in response to environmental changes.
Palaeosols are common at the contact between the Middle Permian Maokou Formation and Emeishan basalts, which are distributed extensively in Yunnan, Guizhou and Sichuan provinces of SW China (He et al. Reference He, Xu, Chung, Xiao and Wang2003, Reference He, Xu, Guan and Zhong2010). The hiatus provides an excellent opportunity to examine the palaeoenvironments at the transition between the Maokou Formation and Emeishan basalts. In this study, we collected samples of pyrite-bearing palaeosols developed at the contact between the Maokou limestone and Emeishan basalts in the Sichuan Basin of SW China. Our aim is to (1) examine the potential of coastal palaeosols as indicators of relative sea-level variations and other palaeoenvironmental changes; (2) provide a description of the palaeosols and their Permian distribution in SW China; and (3) to reveal the potential causes for short-term sea-level fluctuations in late Middle Permian times in the SW Sichuan Basin of South China.
2. Geological setting
The Sichuan Basin is a rhomboid-shaped sedimentary basin located in SW China (Tan et al. Reference Tan, Li, Liu, Luo, Zhou, Wu and Ding2011; Zhu et al. Reference Zhu, Wang, Xie, Xie and Liu2015) (Fig. 1a) and has a surface area of ~180 × 103 km2 (Zhao et al. Reference Zhao, Xu, Wang, Wang, Wang, Bian and Li2011; Zhu et al. Reference Zhu, Wang, Xie, Xie and Liu2015). During Middle–Late Permian times, the Sichuan Basin of the South China platform was situated in the southwest of the Yangtze plate (Fig. 2a), lying in the palaeo-equatorial eastern palaeo-Tethys (Wang & Jin, Reference Wang and Jin2000) (Fig. 2b).

Fig. 1. Sketch map of the studied section in the southwestern Sichuan Basin, South China. (a) Location of the Sichuan Basin in China. (b) Location of the studied section in the Sichuan Basin.
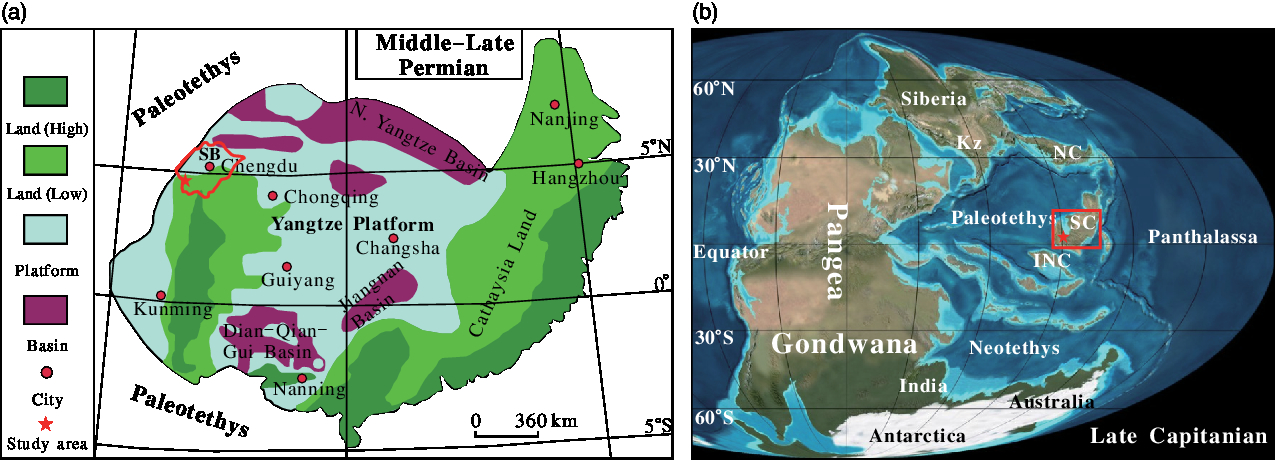
Fig. 2. Middle–Late Permian palaeogeography of (a) South China (modified from Wang & Jin, Reference Wang and Jin2000; palaeolatitude after Zhang, Reference Zhang1997); SB – Sichuan Basin; and (b) the world (modified from Blakey, Reference Blakey and Wong2007); NC – North China; SC – South China; Kz – Kazakhstan.
In the Mount Emei region, the Maokou Formation conformably overlies the Middle Permian Qixia Formation, composed of ~280 m thick dark limestone, and is unconformably overlain by the Emeishan volcanic successions, which have a thickness of ~230 m (Bureau of Geology and Mineral Resources of Sichuan Province, 1991) (Fig. 3). The Maokou Formation consists mainly of ~345 m of medium-bedded to massive limestone and contains a Tethyan marine fauna of fusulinids, brachiopods, gastropods, rugose coral, calcareous algae and crinoids (He et al. Reference He, Xu, Chung, Xiao and Wang2003; Isozaki et al. Reference Isozaki, Yao, Matsuda, Sakai, Ji, Shimizu, Kobayashi, Kawahata, Nishi, Takano and Kubo2004, Reference Isozaki, Yao, Ji, Saitoh, Kobayashi and Sakai2008), as evidence of a shallow-marine carbonate-platform.

Fig. 3. (a) Stratigraphic framework of the Middle and Upper Permian in the SW Sichuan Basin; triangle – location of sampling sections. The conodont zones, which were dominated by J. xuanhanensis and J. altudaensis, are derived from Lai et al. (Reference Lai, Wang, Wignall, Bond, Jiang, Ali and Sun2008) and Sun et al. (Reference Sun, Lai, Wignall, Widdowson, Ali, Jiang, Wang, Yan, Bond and Védrine2010). (b) Sketch map of the reverse fault. (c) Emeishan basalts unconformably overlying the Maokou Formation. (d) The hiatus between the Emeishan basalts and Maokou Formation. (e) The tree stump residues preserved in the Maokou Formation owing to the reverse fault. Hammer for scale is ~28 cm long.
The studied section (29° 34′ 45.24″ N, 103° 24′ 39.92″ E) crops out near the Qingyin Power Station in the Mount Emei region of the SW Sichuan Basin (Fig. 1b). The section is ~2 m of mudstone and shale, with a 20 cm thick limestone, below the Emeishan basalts, and it sharply overlies the uppermost Maokou limestone, which contains remains of fish, ostracods and the conodonts Jinogondolella xuanhanensis and Jinogondolella altudaensis (Lai et al. Reference Lai, Wang, Wignall, Bond, Jiang, Ali and Sun2008; Sun et al. Reference Sun, Lai, Wignall, Widdowson, Ali, Jiang, Wang, Yan, Bond and Védrine2010) (Fig. 3a). The 20 cm thick limestone between the mudstone and shale is dominated by Hindeodus excavatus (Lai et al. Reference Lai, Wang, Wignall, Bond, Jiang, Ali and Sun2008).
The palaeosols are younger than the underlying Maokou limestone and older than the Emeishan basalts. The overlying Emeishan basalts are stratigraphically well constrained to the upper Middle Permian (260 Ma) (Huang et al. Reference Huang, Cawood, Hou, Yang, Ni, Du, Yan and Wang2016), determined by zircon SHRIMP U–Pb measurements (Zhou et al. Reference Zhou, Malpas, Song, Robinson, Sun, Kennedy and Keays2002; He et al. Reference He, Xu, Huang, Luo, Shi, Yang and Yu2007; Zi et al. Reference Zi, Fan, Wang, Cawood, Peng, Sun and Xu2010), ID-TIMS results for the basalts (Shellnutt et al. Reference Shellnutt, Denyszyn and Mundil2012) and magnetostratigraphic and bio-lithostratigraphic observations (Jin & Shang, Reference Jin, Shang, Yin, Dickins, Shi and Tong2000; Ali et al. Reference Ali, Thompson, Zhou and Song2005). The conodont J. xuanhanensis from the limestone underlying the palaeosols in the section (Sun et al. Reference Sun, Lai, Wignall, Widdowson, Ali, Jiang, Wang, Yan, Bond and Védrine2010) points to a late Capitanian (~262 Ma) age for the Maokou limestone. Jin & Shang (Reference Jin, Shang, Yin, Dickins, Shi and Tong2000) have also assigned the limestone below the Emeishan basalts to the upper Middle Permian based on conodonts and fusulinids. Thus, the palaeosols between the Maokou limestone and Emeishan basalts developed between ~262 and ~260 Ma, close to the Middle–Late Permian transition. Moreover, the palaeosol section at Qingyin was within the tropical zone (palaeolatitude ~5° N) in Middle Permian times (Zhang, Reference Zhang1997).
3. Sampling and laboratory analysis
Samples (EML01 and EML02) were taken from each horizon (Fig. 3a), air dried, sieved (<2 mm) and ground, then used to analyse the chemical properties of the palaeosol (e.g. carbonate content, TOC and sulfur), physical properties (e.g. colour), mineral composition of the bulk palaeosols and weight percentages of the major and minor elements. Moreover, six limestone samples (Fig. 3a) were collected from the limestone of profiles EML01 (EML01-3-1, -2, -3) and EML02 (EML02-3-1, -2, -3); thus, three samples per limestone interval (Fig. 3) were used for carbonate microfacies (MF) determinations. The carbonate content in the samples was measured by adding diluted 1 N HCl to produce CO2, and then by converting the volume of CO2 into carbonate concentration (%) (Dreimanis, Reference Dreimanis1962), and the organic carbon content was determined by the Walkley-Black titration method (Singer & Janitzky, Reference Singer and Janitzky1987). The analysed error for the carbonate and organic carbon content was lower than 1 % and 0.5 %, respectively. Total sulfur (TS) content was determined using the barium sulfate turbidimetry spectrophotometry method (Fu et al. Reference Fu, Ding, Wu and Lin2007) and has an error of ±0.005 %. Colour was identified following the Munsell soil colour system (Munsell Color, 2000).
The bulk mineralogy was detected using X-ray diffractometry (XRD) (Model X-Pert, produced by the Philips Company) with a voltage of 50 kV and a current of 35 mA at Sichuan University, China. Major and trace elements of the samples were analysed by X-ray fluorescence spectrometry (PW2403 X, Holland) at the Key Laboratory of West China’s Environmental System, Lanzhou University, China. Analytical uncertainty was typically lower than 0.1 % for major elements, and 0.1–2 ppm for most trace elements. Thin-sections of individual palaeosols were prepared for micromorphological observation using a polarizing petrographic microscope to view and a camera to capture images, and were described using the micromorphological terminology of Bullock et al. (Reference Bullock, Fedoroff, Jongerius, Stoops, Tursina and Babel1985) and Stoops et al. (Reference Stoops, Marcelino and Mees2010). Carbonate microfacies were described based on the nomenclature of Dunham (Reference Dunham1962) and interpreted according to Flügel (Reference Flügel2010).
4. Results
4.a. Palaeosol description and analysis
Two palaeosols (EML02 and EML01) were identified in a 2 m thick zone marking the contact between the Maokou Formation and Emeishan basalts in the SW Sichuan Basin based on several large tree stumps, abundant root traces and obvious soil structures and horizons (Fig. 4b, c, d, f). The older palaeosol was named EML02 and the younger one EML01 (Fig. 4a, b, c). These palaeosols can be interpreted using comparisons with the properties of modern soils.

Fig. 4. Field photographs in the studied area. (a) Emeishan basalts unconformably overlying the Maokou Formation. (b) EML01 palaeosol. (c) EML02 palaeosol. (d) The pyrite-bearing Bg horizon in the EML02 palaeosol. (e) Close-up of tree stumps showing tree trunk fossil buried in the contact between the Emeishan basalts and Maokou Formation. (f) Pyrite crystals from the EML01 palaeosol. (g) Close-up of EML02 palaeosol. Hammer for scale is ~28 cm long.
4.a.1. Macro- and microscopic description of the palaeosols
Both of the palaeosols (EML02 and EML01) are mudstone or shale, and have a clear and sharp upper and lower lithological boundary (Fig. 4). There is a 20 cm thick limestone bed (Sample No. EML01-3), which is greenish-grey in colour (5BG 6/1), between the two palaeosols (Figs 3a, 4a). The palaeosol EML02 overlies limestones of the Maokou Formation, and the palaeosol EML01 overlies the thin bed of limestone.
Palaeosol EML02 has an 18 cm thick black (N 2.5/1) organic-rich (Ah) horizon, which has converted to a coal seam that is grey in colour (N 25/1) owing to diagenesis. The 60 cm thick Bg horizon of palaeosol EML02 has yellowish brown (10YR5/6) mottles of iron-oxide-stained mudstone. Large amounts of pyrite are scattered through the Bg horizon (Fig. 4d). In thin-sections, root traces are generally horizontally to sub-horizontally oriented in the Bg horizon, suggesting a high water table (Fig. 5f). The transition between the Bg horizon and the underlying limestone is abrupt. This limestone of the Middle Permian Maokou Formation is bluish grey (5PB 6/1) in colour and contains abundant conodonts (J. xuanhanensis).

Fig. 5. Photomicrographs of pedogenic features observed in thin-sections of vertically oriented palaeosol samples. PPL – plane-polarized light. (a) Abundant organic material (OM), and fine and vertical downward-bracing roots (Rt; dark colour) in the EML01 palaeosol (Ah horizon, PPL). (b) Close-up view on the left side of image (a) showing fragments and fine and vertical downward-bracing roots (dark colour) in the EML01 palaeosol (Ah horizon, PPL). (c) Pyrite (Py) framboids and plant material (dark colour) in the EML01 palaeosol (Bg horizon, PPL). (d) Organic material infilling the interstices between limestone fragments in the EML01 palaeosol (Bg horizon, PPL). (e) Limestone fragments and organic material mixed in the EML01 palaeosol (Bg horizon, PPL). (f) Strongly ferruginized fossil plant material within the groundmass of the EML02 palaeosol (Bg horizon, PPL).
Overlain by the Emeishan basalts, the EML01 palaeosol consists of an Ah–Bg profile with a thickness of 55 cm. The organic horizon (Ah) has a thickness of 15 cm (Fig. 4b). Root traces are evident, reaching a depth of 50 cm, with a black colour (N 2.5/1). In particular, a carbonized tree trunk, which can be recognized by downward branching, was abruptly terminated by deposition of basalt lava and remained perpendicular in the Ah horizon (Fig. 4a, e). Some 70 cm of the trunk base width is preserved in a bedding plane exposure (Fig. 4a). In thin-section in situ carbonaceous roots are mostly horizontally branching, but a few fine rootlets with root hairs are vertically oriented and tapering downward in the Ah horizon (Fig. 5a, b). The Bg horizon has a thickness of 40 cm and shows colours varying from dark greyish brown (10YR 4/2) with prominent yellowish brown (10YR 5/8) iron-oxide mottles to bluish grey (5PB 6/1) with a massive blocky ped structure. Abundant pyrite crystals are found in the Bg horizon with variable diameters from 5 to 10 mm (Fig. 4f). The thin-section also exhibits similar pedogenic features in this horizon (Fig. 5c). Framboidal pyrite precipitation associated with organic material within the soil matrix is evident (Fig. 5c). In addition, mixed limestone fragments and organic material were distributed in the Bg horizon of palaeosol EML01 (Fig. 5d, e).
Throughout the section, significant differences in macromorphological properties, particularly regarding the tree root traces and in situ strata characteristics of the basalt–palaeosol–limestone sequences, are observed. More than three large tree stumps collapsed in the same direction (Figs 3d, e, 4a, e), and the strata experienced relative movement due to a small thrust fault (Fig. 3b, d, e). Regional tectonic movements that occurred in SW China during Middle Jurassic – Early Cretaceous times were largely responsible for the fault (Hou et al. Reference Hou, Chen and Lu2002; Ali et al. Reference Ali, Lo, Thompson and Song2004).
4.a.2. Chemical properties of the palaeosols
In the older (EML02) palaeosol, carbonate content in the surface horizon (4.6 %) is lower than in the Bg horizon (13.5 %), and carbonate in the Ah horizon of the younger (EML01) profile of 14.8 % is also lower than in the Bg horizon (29.1 %) (Fig. 6). Total organic carbon contents (TOC) in the EML02 samples fluctuate in the range of 0.9–2.3 %, whereas the EML01 palaeosol yielded TOC values of 1.8–2.6 % (Fig. 6). TS contents in the Ah and Bg horizons of the EML02 palaeosol are 0.13 % and 0.79 %, respectively. The Ah and Bg horizon of the EML01 palaeosol have TS contents of 0.21 % and 1.18 %, respectively (Fig. 6).
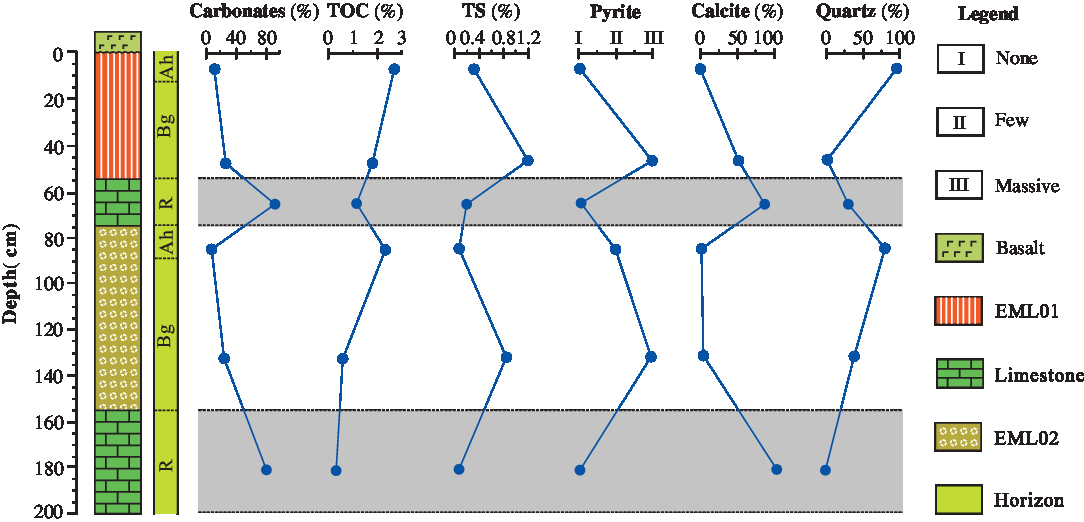
Fig. 6. Depth profiles of general characteristics and relative mineral content for the studied section.
4.a.3. Elemental composition and geochemistry of the palaeosols
In the two analysed palaeosols, most of the major and trace elements show relatively higher contents in the Ah and Bg horizons compared to the underlying limestone, except for Ca and Mn (Fig. 7).
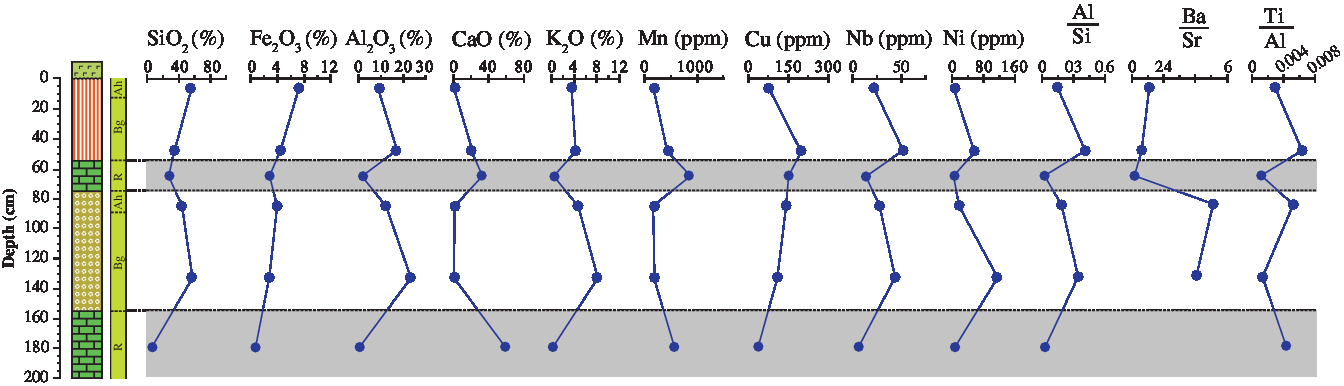
Fig. 7. Major- and trace-element contents varying with depth for the studied section.
Obtained elements were used for calculating the molecular ratios, which have been used as a geochemical proxy for evaluating pedogenic processes in palaeosols (Retallack, Reference Retallack2001; Sheldon & Tabor, Reference Sheldon and Tabor2009; Li et al. Reference Li, Wen and Huang2016), such as the index of clayeyness (Al/Si; Ruxton, Reference Ruxton1968), provenance (Ti/Al; Retallack, Reference Retallack2001) and the barium/strontium ratio (Ba/Sr; Retallack, Reference Retallack2001). The Al/Si ratio is a function of the clayeyness of a palaeosol (Retallack, Reference Retallack2001), varying throughout the section from 0.03 to 0.44. Fe2O3 exhibits low concentrations (<10 %) in the two palaeosol profiles, generally decreasing slightly with depth, while the proportions of Al2O3, K2O and Mn generally increase with depth in both palaeosols (Fig. 7). The Ti/Al ratio is used as a provenance indicator because Ti contents may be quite variable among different types of rocks, even as Al contents are relatively constant (Retallack, Reference Retallack2001; Sheldon & Tabor, Reference Sheldon and Tabor2009). Minor variation in Ti/Al values occurred in the examined horizons of the two palaeosols, ranging from 0.0016 to 0.0067 (Fig. 7). The Ba/Sr ratio is taken as a means of assessing weathering intensity (i.e. leaching) (Sheldon & Tabor, Reference Sheldon and Tabor2009), and the values measured in the profiles exhibit great variations, ranging from 0.08 to 5.10 (Fig. 7). The EML02 palaeosol shows high Ba/Sr values (>2). The SiO2 content in the examined palaeosol profiles ranges from 33.9 % to 57.3 % (Fig. 7), which is high in comparison to the underlying limestone (generally between 4.8 % and 27.1 %). Moreover, the Al/Si ratio values in both palaeosols display an increasing trend from the Ah horizon to the Bg horizon suggesting clay formation, i.e. the development of a B horizon. In contrast, there is a decreasing trend in the Ba/Sr ratio from the surface to the subsurface Bg horizon of the examined palaeosol profiles (Fig. 7).
4.a.4. Mineral composition of the palaeosols
XRD analysis of EML02 shows that quartz is dominant, and illite and/or smectite and pyrite are present in small quantities in the Ah horizon (EML02-1) of the older (EML02) palaeosol. Pyrite, illite and/or smectite, gypsum, quartz and feldspar were identified in the Bg horizon (EML02-2) (Fig. 8). In addition, the Maokou limestone (EML02-3) was entirely composed of calcite.
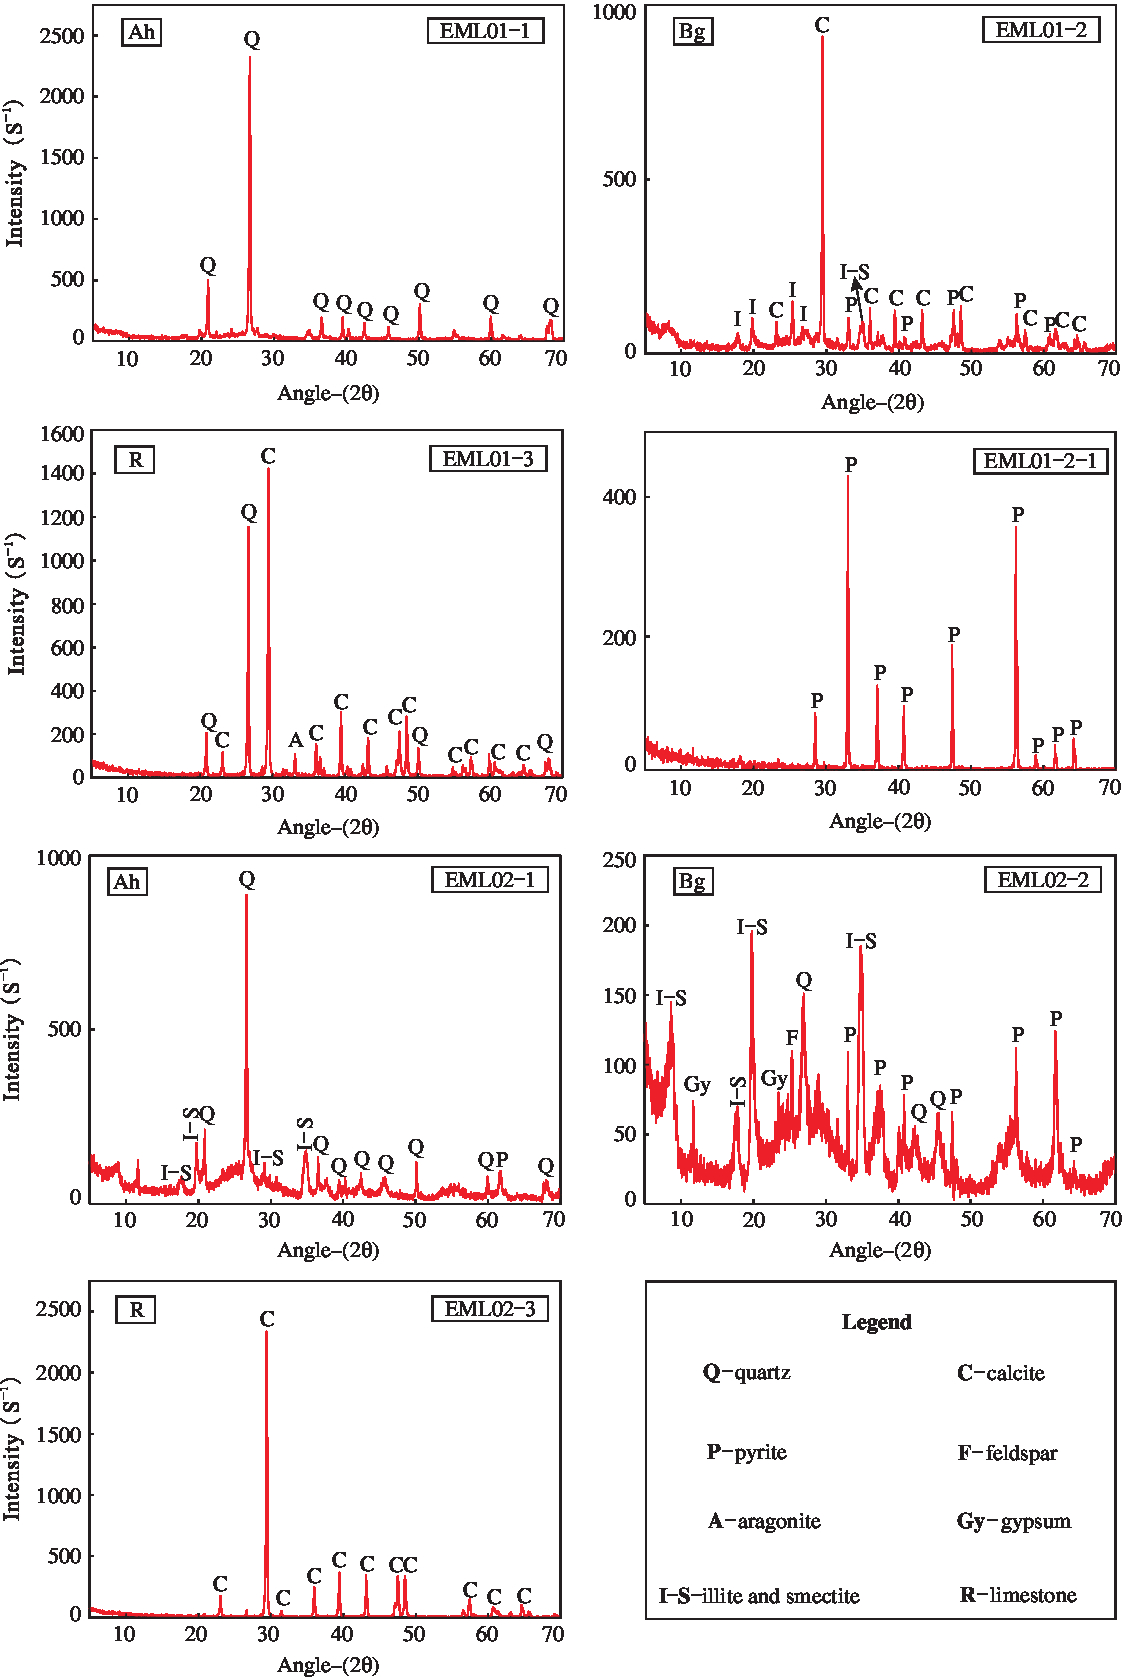
Fig. 8. Whole-rock X-ray patterns for the studied section.
The whole-rock X-ray patterns indicate that the Ah (EML01-1) horizon is mainly composed of quartz, whereas the Bg horizon (EML01-2) is dominated by calcite, pyrite and illite and/or smectite (Fig. 8). Micromorphological observations also confirm the presence of calcite and pyrite in the Bg horizon (Fig. 5c, e). The limestone sample (EML01-3) interbedded between the two palaeosols consists dominantly of calcite and quartz, with identified small amounts of aragonite. Moreover, large phenocrysts (EML01-2-1) are composed of pure pyrite (Fig. 8).
4.b. Carbonate microfacies analysis
On the basis of texture, grain composition and fossil content, as well as the nomenclature of Dunham (Reference Dunham1962), two characteristic microfacies were identified: bioclastic packstone (Fig. 9a) and ostracod mudstone/wackestone (Fig. 9b). These represent the bluish grey (5PB 6/1) limestone (EML02-3) (Fig. 3) at the base of palaeosol EML02, and the 20 cm thick greenish-grey (5BG 6/1) limestone (EML01-3) (Fig. 3) underlying the palaeosol EML01, respectively.

Fig. 9. The microfacies from the EML02 and EML01 limestones in the studied section. XPL – cross-polarized light. (a) Bioclastic packstone with common algae sections (a) and rare foraminifera (f) (sample EML02-3-2). (b) Ostracod mudstone/wackestone with ostracods (o) and bivalve fragments (b) (sample EML01-3-2).
4.b.1. MF2: Bioclastic packstone
In this microfacies, carbonate grains represent ~50 % of the rock and are dominated by algae fragments, such as Dasycladaceae, Udoteaceae and Gymnocodiaceae, together with rare foraminifera and other fragments of invertebrate organisms. Intergranular pores are filled with carbonate mud (Fig. 9a).
4.b.2. MF1: Ostracod mudstone/wackestone
This microfacies is dominated by low-diversity bioclasts, including ostracods and bivalve fragments, occupying ~10 % of the rock (Fig. 9b).
5. Discussion
5.a. Palaeosol interpretation and comparison
5.a.1. Environment of palaeosol formation
Dark grey colours, generally in association with fossil plant accumulations, coal levels, pseudomorphs after pyrite and iron-oxide mottles in the two palaeosols are characteristics of locally reducing or mixed redox conditions (Kraus & Aslan, Reference Kraus and Aslan1993; Sheldon, Reference Sheldon2005; De la Horra et al. Reference De la Horra, Galán-Abellán, López-Gómez, Sheldon, Barrenechea, Luque, Arche and Benito2012). The studied palaeosols, interbedded with marine limestones, are considered to have developed in coastal environments. Similar morphological features and mineral compositions are also presented in palaeosols from Middle Permian strata of the SE Iberian Ranges, Spain (De la Horra et al. Reference De la Horra, Galán-Abellán, López-Gómez, Sheldon, Barrenechea, Luque, Arche and Benito2012), the Pennsylvanian Paganzo Group of the Paganzo and Río Blanco basins of NW Argentina (Gulbranson et al. Reference Gulbranson, Montañez, Tabor and Limarino2015) and Lower Permian strata in north-central Texas (Tabor & Montañez, Reference Tabor and Montañez2004), and are interpreted as having formed in poorly drained, shallow depressions on the regionally extensive coastal plain or in coastal environments (Gulbranson et al. Reference Gulbranson, Montañez, Schmitz, Limarino, Isbell, Marenssi and Crowley2010, Reference Gulbranson, Montañez, Tabor and Limarino2015).
The higher SiO2 contents in both palaeosol profiles compared to that in the underlying limestone may be due to detrital quartz introduced into intertidal sedimentary environments. The increase of Cu, Nb and Ni concentrations in the palaeosols relative to the underlying limestones is likely due to the precipitation of these elements within the palaeosols resulting from the higher contents in the parent shales and mudstones and weathering of the overlying basalts (Wang et al. Reference Wang, Zhu and Ye2009, Reference Wang, Zhu and Wang2011; Mo & Li, Reference Mo and Li2015). The minor variation in Ti/Al values occurring in the examined palaeosols suggests that there was no change in the sediment source.
5.a.2. Palaeosol interpretation
The pedogenic features and properties of the two studied palaeosols between the Maokou Formation and Emeishan basalts can be correlated with modern acid-sulfate soils developed in coastal environments, e.g. concerning the presence of characteristic minerals such as pyrite and gypsum (Figs 4, 5, 6, 7) and high TS content (Fig. 6).
Abundant pyrite occurs in the Bg horizons of both studied palaeosols (Fig. 4f, g), with framboidal pyrite present (Fig. 5c). Distinct pyrite peaks were determined using XRD (Fig. 8). The presence of pyrite is a key indicator of acid-sulfate soils (van Breemen, Reference van Breemen, Kittrick, Fanning and Hossner1982; IUSS Working Group WRB, 2006; Fanning et al. Reference Fanning, Rabenhorst, Balduff, Wagner, Orr and Zurheide2010). XRD-detected gypsum in the studied palaeosols is also commonly documented within acid-sulfate soils (Carson et al. Reference Carson, Fanning, Dixon and Kittrick1982; Doner & Lynn, Reference Doner, Lynn, Dixon and Weed1989; Ritsema & Groenenberg, Reference Ritsema and Groenenberg1993; Jennings & Driese, Reference Jennings and Driese2014).
The palaeosol sulfur content features are analogous to modern acid-sulfate soils (Boman et al. Reference Boman, Åström and Fröjdö2008; Gröger et al. Reference Gröger, Proske, Hanebuth and Hamer2011; Jayalath et al. Reference Jayalath, Mosley, Fitzpatrick and Marschner2016). The studied palaeosols have a typical organic matter profile characterized by higher contents in the top horizon and lower contents in the substratum. The values are generally lower than those of corresponding modern soils, perhaps owing to biotic decomposition or burial dissolution (Krull & Retallack, Reference Krull and Retallack2000; Retallack, Reference Retallack2001). However, the carbonized remnants of organic material are observed in the soil matrix and voids (Fig. 5). The highest percentage of TS appears in the Bg horizons of both palaeosols. Sulfate is produced when pyrite undergoes oxidation on soil exposure to the atmosphere. Pyrite oxidation is also accompanied by free sulfuric acid production causing high acidity (van Breemen, Reference van Breemen, Kittrick, Fanning and Hossner1982; Ritsema & Groenenberg, Reference Ritsema and Groenenberg1993; Kawahigashi et al. Reference Kawahigashi, Do, Nguyen and Sumida2008; Jayalath et al. Reference Jayalath, Mosley, Fitzpatrick and Marschner2016).
Typically, modern acid-sulfate soils include low pH values between 3 and 5, pyrite concentrations and yellow mottles on ped surfaces or in the soil matrix (van Breemen, Reference van Breemen, Kittrick, Fanning and Hossner1982; Wilson et al. Reference Wilson, White and Melville1999; Fitzpatrick, Reference Fitzpatrick and Roach2003; IUSS Working Group WRB, 2006; Fitzpatrick et al. Reference Fitzpatrick, Shand, Merry and Jennings2009). Although pH measurement in ancient palaeosols cannot reveal the genuine (prior to burial) values, it is assumed that the Bg horizons in the Qingyin palaeosols would be strongly acidic because of the pyrite and high sulfur content (Dent & Pons, Reference Dent and Pons1995). Ancient acid-sulfate soils show a relatively low Fe content (Fig. 7), with a maximal value in the A horizon. Periodic fluctuations of the water table characteristic for these soils may have caused Fe leaching (Fanning & Fanning, Reference Fanning and Fanning1989; Golez & Kyuma, Reference Golez and Kyuma1997). The increase of Al2O3, K2O and Mn with depth can be attributed to oxidation of the pyrite in the Bg horizons (Shamshuddin et al. Reference Shamshuddin, Muhrizal, Fauziah and Van Ranst2004) because the mobility of Al, Ni, Cu and other potentially toxic metals gradually strengthens as soil acidification is enhanced (Shotyk, Reference Shotyk, Martini and Chesworth1992; Golez & Kyuma, Reference Golez and Kyuma1997; Åström, Reference Åström1998; Sohlenius & Öborn, Reference Sohlenius and Öborn2004; Nordmyr et al. Reference Nordmyr, Åström and Peltola2008). Ba/Sr ratio values higher than 2 in the EML02 palaeosol also indicate that the soils formed under acidic conditions (Retallack, Reference Retallack2001).
Jarosite mottles and nodules are not found in the palaeosols in our study, in contrast to the Upper Cretaceous and Paleocene acid-sulfate palaeosols in the USA (McSweeney & Fastovsky, Reference McSweeney and Fastovsky1987; Retallack, Reference Retallack1994). Our acid-sulfate palaeosols rather resemble soils in the humid tropical climate of Indonesia (Konsten et al. Reference Konsten, Breemen, Suping, Aribawa and Groenenberg1994), Malaysia (Muhrizal et al. Reference Muhrizal, Shamshuddin, Fauziah and Husni2006) and Vietnam (Kawahigashi et al. Reference Kawahigashi, Do, Nguyen and Sumida2008), which do not contain jarosite. Jarosite nodules were not found in Texas either (Jennings & Driese, Reference Jennings and Driese2014). The absence of mottles in the studied palaeosols is possibly attributed to: (1) strongly reducing conditions in the case of the palaeosol formation (e.g. abundant organic matter) unfavourable for the persistence or formation of jarosite (Konsten et al. Reference Konsten, Breemen, Suping, Aribawa and Groenenberg1994; Michael et al. Reference Michael, Fitzpatrick and Reid2015), and (2) the higher dissolution rate of jarosite (Chu et al. Reference Chu, Lin, Wu, Lu and Long2006; Jennings & Driese, Reference Jennings and Driese2014), and/or (3) the formation of ferrous sulfate other than jarosite in the case that pyrite was oxidized owing to the low redox potential from the organic matter in the sulfuric horizon (Husson et al. Reference Husson, Verburg, Phung and Van Mensvoort2000; Muhrizal et al. Reference Muhrizal, Shamshuddin, Fauziah and Husni2006). In light of the physical properties in combination with the mineralogical and geochemical features, the palaeosols are considered comparable with modern acid-sulfate soils (Husson et al. Reference Husson, Verburg, Phung and Van Mensvoort2000; Powell & Martens, Reference Powell and Martens2005; Kawahigashi et al. Reference Kawahigashi, Do, Nguyen and Sumida2008).
Significant amounts of carbonates (e.g. calcite) in acid-sulfate soils are rarely present in the humid tropics, because soil formation is affected by acidic water and non-calcareous sediments from the catchment (Pons & van Breemen, Reference Pons, van Breeman, Dost and van Breeman1982; Ritsema & Groenenberg, Reference Ritsema and Groenenberg1993). However, carbonates were detected in the Bg horizon of the EML01 palaeosol (Figs 6, 8), which formed in the palaeo-equatorial zone (Fig. 2b). It is supposed that calcite in this horizon is inherited from the limestone. Micromorphologically, uniform-sized, rounded calcite fragments were observed in the Bg horizon (Fig. 5e). These are distinct from pedogenic carbonates, which commonly show a mixture of calcite with phyllosilicates, quartz and other minerals, and have various sizes and forms, e.g. fracture fillings or brecciated fragments (Khormali et al. Reference Khormali, Abtahi and Stoops2006; Wanas & Abu El-Hassan, Reference Wanas and Abu El-Hassan2006; Cleveland et al. Reference Cleveland, Nordt and Atchley2008; Robins et al. Reference Robins, Deurlington, Buck and Brock-Hon2015).
5.b. Upper Middle Permian palaeosol distribution in SW China
The palaeosols observed at Qingyin, Emeishan, are not the only examples at the boundary between the overlying Emeishan basalts and the limestone of the Maokou Formation. Clay-rich palaeoweathering sequences on the Maokou Formation overlain by Emeishan basalts have been reported in Guizhou, Sichuan and Yunnan provinces of SW China (He et al. Reference He, Xu, Chung, Xiao and Wang2003, Reference He, Xu, Guan and Zhong2010) (Fig. 10), but were restricted to the Upper Yangtze Craton, and not observed in the lower Yangtze and South China Block (He et al. Reference He, Xu, Chung, Xiao and Wang2003). The palaeoweathering transition zones vary in thickness from 1 to 5 m (Fig. 10b), and are generally composed of pyrite-bearing claystone, thin layers of coal and siliceous rocks, analogous to the palaeosol sequence observed at Qingyin in the SW Sichuan Basin (He et al. Reference He, Xu, Chung, Xiao and Wang2003, Reference He, Xu, Guan and Zhong2010; Lai et al. Reference Lai, Wang, Wignall, Bond, Jiang, Ali and Sun2008; Sun et al. Reference Sun, Lai, Wignall, Widdowson, Ali, Jiang, Wang, Yan, Bond and Védrine2010). Furthermore, those coal-forming and root trace-bearing materials in the palaeosols might be considered to be marine mangrove-like plants (Shao et al. Reference Shao, Zhang, Ren and Lei1998), which are integral and active components of the coastal landscape (McKee et al. Reference McKee, Cahoon and Feller2007) and key indicators of plant growth in acid-sulfate soils (Nguyen et al. Reference Nguyen, Ta and Tateishi2000). Pyrite-bearing claystone derived from the deposition of intertidal sediments (Lin & Melville, Reference Lin and Melville1992, Reference Lin and Melville1993; Ritsema & Groenenberg, Reference Ritsema and Groenenberg1993) can form rapidly in coastal sedimentary settings owing to the reaction between sulfides and iron oxyhydroxides (Fanning et al. Reference Fanning, Rabenhorst, Burch, Islam, Tangren, Dixon and Schulze2002). These palaeoweathering crusts situated in the southwest of the Yangtze Plate, which were situated in the eastern palaeo-Tethys around the equator during Middle–Late Permian times (Wang & Jin, Reference Wang and Jin2000) (Fig. 1a), are also classified as acid-sulfate palaeosols. This is because most of the acid-sulfate soils formed within estuaries, swamps, and coastal and river plains near the equator or in tropical and subtropical regions owing to the waterlogged conditions from the interaction of seawater and abundant organic material (Dent, Reference Dent1992; Fitzpatrick, Reference Fitzpatrick and Roach2003), with the morphological and mineralogical properties mentioned above. Claystone and palaeoweathering features, as well as roughly correlative coastal acid-sulfate soils, all in the interval between the Maokou limestone and basalt (Fig. 10), likely manifest a widespread regional palaeopedological phenomenon in the Upper Yangtze Craton.

Fig. 10. (a) Palaeoenvironment and distribution of palaeoweathering surfaces and palaeosols in SW China modified from Dai et al. (Reference Dai, Chekryzhov, Seredin, Nechaev, Graham, Hower, Ward, Ren and Wang2016) and He et al. (Reference He, Xu, Wang and Luo2006). (b) Stratigraphic variation of five representative sedimentary successions.
5.c. Sea-level fluctuations and depositional environment changes in SW China
5.c.1. Relative sea-level indicated by palaeosols
Palaeopedological analysis allows us to reveal the connection of the palaeosols with the relative sea-level changes in the SW Sichuan Basin. Two distinct acid-sulfate palaeosols, separated by a thin limestone bed at Qingyin, and comparable weathered claystone facies were widespread in the Upper Yangtze Craton (Fig. 10). Acid-sulfate soils generally form in intertidal conditions where sources of sulfates, iron and other salts originate from seawater and estuarine sediments, which are within less than 5 m above sea-level and 0.5–1.5 m below sea-level in coastal regions (Walker, Reference Walker1972; Lin & Melville, Reference Lin and Melville1993; Fitzpatrick, Reference Fitzpatrick and Roach2003; Powell & Martens, Reference Powell and Martens2005). For example, modern acid-sulfate soils in SE Queensland, Australia, generally occur 1.5 m below sea-level, whereas in Central Queensland, where tides are much higher, acid-sulfate soils are common in coastal plain landscapes of less than 5 m elevation (Ross, Reference Ross2002). From the perspective of palaeopedology, the palaeosols and their fossil tree stumps imply subaerial exposure. Thus, acid-sulfate palaeosols reveal a fall of relative sea-level from the underlying marine limestones, which is consistent with the normal regression in sequence stratigraphy (Emery & Myers, Reference Emery and Myers1996; Catuneanu, Reference Catuneanu2002, Reference Catuneanu2019).
It can be assumed that the elevation in the Qingyin area at the time when these palaeosols were formed was between 5 m above sea-level and 0.5–1.5 m below sea-level. In a broader geographic perspective, similar acid-sulfate palaeosols across SW China may serve as a potential relative sea-level marker, which can outline the boundary between the land and ocean, and indicate the extent of sea coverage at that time in situations when other credible evidence is lacking.
5.c.2. Relative sea-level revealed by the limestone
High-resolution microfacies analysis can give us an insight into the depositional environments and water depth changes in the SW Sichuan Basin.
5.c.2.1. MF2: Bioclastic packstone
The relatively well-preserved bioclasts indicate that these grains are in situ, indicating an autochthonous depositional environment. Benthic calcified calcareous algae of Dasycladaceae, Udoteaceae and Gymnocodiaceae grow in tropical and subtropical environments with normal salinity, warm, shallow water (Flügel, Reference Flügel2010). Considering the relative high fossil diversity and content as well as the micritic matrix, the limestone microfacies of EML02 represents a low-energy, shallow-marine carbonate platform sheltered from wave action (Flügel, Reference Flügel2010). Dasycladalean algae extend to depths of 5–6 m below the low-tide level, but can extend down to 12 m in shallow-marine environments (Johnson, Reference Johnson1961; Wray, Reference Wray1977). Dasycladalean and udoteacean algae of Cenozoic sediments are indicative of a depth of 10–12 m below low-tide level, but are found at a depth of 25 m on rare occasions (Humane & Kundal, Reference Humane and Kundal2005; Kundal & Humane, Reference Kundal and Humane2007; Kundal, Reference Kundal, Kundal and Humane2010, Reference Kundal and Tiwari2014). Gymnocodiacean algae likely have a wider palaeodepth (Flügel, Reference Flügel2010); however, together with Dasycladalean and Udoteacean algae, this microfacies could have been deposited at shallow palaeodepths of 5–12 m, and likely no more than 25 m.
5.c.2.2. MF1: Ostracod mudstone/wackestone
The MF1 is characterized by very low bio-diversity and poorly preserved fossils, mainly including ostracods and bivalves, which is in contrast with the MF2 bioclastic packstone, representing EML01-3. Compared with the MF2, the MF1 indicates an intertidal, or even supratidal, environment above the low-tide level, and a more restricted and shallower environment with abnormal water circulation and salinity. Such an environment suggests an intertidal water depth of no more than 10 m depending on the tide (Flügel, Reference Flügel2010).
5.c.3. Sea-level fluctuations and depositional environment changes in SW China
Sea-level is recorded by two acid-sulfate palaeosols and two beds of limestone at Qingyin in the SW Sichuan Basin. The relative sea-level variations can be estimated by the palaeosol and limestone sequences. The magnitude of relative sea-level fall is less than 6.5 m based on the development of acid-sulfate soils, whereas the relative sea-level rise is close to the surface and usually less than 10 m, as suggested by the deposition of the thin limestone. The topmost limestone of the Maokou Formation suggests a shallow-marine environment with a depth of 5–25 m, and therefore the amplitudes of relative sea-level fluctuations range from 0 to a maximum of 25 m in late Middle Permian times of the Sichuan Basin in SW China, which is within the range of previous research examining the global sedimentary record (Ross & Ross, Reference Ross, Ross, Scholle, Peryt and Ulmer-Scholle1995; Haq & Schutter, Reference Haq and Schutter2008; Rygel et al. Reference Rygel, Fielding, Frank and Birgenheier2008). Correspondingly, the depositional environment shifted from shallow-marine to intertidal or even supratidal facies, and subsequently to tidal-flat facies, ultimately with littoral to continental volcanic facies during late Middle Permian times (Fig. 11).
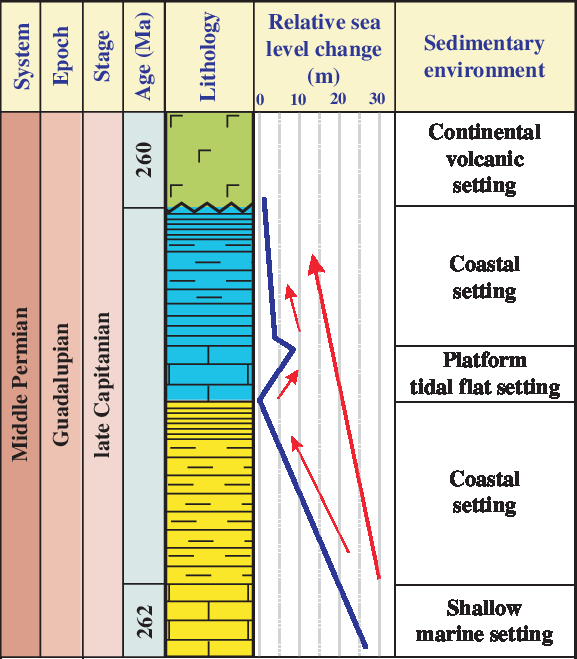
Fig. 11. Chronostratigraphic column of the SW Sichuan Basin showing the change in relative sea-level and depositional environments. Shallow-marine setting is as identified in Lai et al. (Reference Lai, Wang, Wignall, Bond, Jiang, Ali and Sun2008) and continental volcanic setting is derived from He et al. (Reference He, Xu, Chung, Xiao and Wang2003). The blue line refers to the relative sea-level change fluctuation curve and the red line represents the trend line of relative sea-level change.
From the view of sequence stratigraphy, the progradational pattern of the facies does not mean the fall of relative sea-level, and actually may be a forced regression; in that case the sea-level is probably rising (Emery & Myers, Reference Emery and Myers1996; Catuneanu, Reference Catuneanu2002, Reference Catuneanu2019). The acid-sulfate palaeosol facies on top of the marine limestone in the studied areas certainly reveal marine regression events. But the marine regression, in this case, is possibly produced by a fall of relative sea-level or a forced regression.
As the relative sea-level is falling, the emerged seafloor is exposed to erosional processes (truncation) and incision by fluvial systems. Besides the acid-sulfate palaeosols at Qingyin, the palaeosol-like sequences (palaeoweathering crusts) (He et al. Reference He, Xu, Chung, Xiao and Wang2003; Lai et al. Reference Lai, Wang, Wignall, Bond, Jiang, Ali and Sun2008; Sun et al. Reference Sun, Lai, Wignall, Widdowson, Ali, Jiang, Wang, Yan, Bond and Védrine2010) and palaeokarsts (He et al. Reference He, Xu, Guan and Zhong2010), formed under aerial or subaerial conditions on the Maokou Formation and overlain by the Emeishan basalts, ranged in thickness from 1 to 5 m and are distributed widely in Guizhou, Sichuan and Yunnan provinces of SW China. The presence of extensively developed palaeosols and palaeokarsts with a thickness of less than 5 m that occurred during <2 Ma years (~262–260 Ma) in SW China definitely reveals that the submerged seafloor is exposed, weathered and eroded.
The sedimentary hiatuses marked by these palaeosols and palaeokarsts illustrate that the rate of sediment supply is less than the rate of sediment accommodation at the shoreline, and the marine regressions indicated by the palaeosols are the normal regression (i.e. fall of relative sea-level) rather than a forced regression in sequence stratigraphy (Emery & Myers, Reference Emery and Myers1996; Catuneanu, Reference Catuneanu2002, Reference Catuneanu2019).
Two marine regressions, i.e. the ~0–18.5 m and ~3.5 m fall of sea-level, were respectively inferred in SW China for late Middle Permian times (~262–260 Ma) (Fig. 11). Ross & Ross (Reference Ross, Ross, Scholle, Peryt and Ulmer-Scholle1995) suggested that the amplitudes of the sea-level fluctuations ranged between 10 and 100 m in South China during Capitanian times according to the third-order depositional sequences of the Permian. Furthermore, the short-term sea-level fluctuations were not more than 75 m on a global scale in Capitanian times (~265.8–260.4 Ma) according to the seismostratigraphic and sedimentological data. In addition, Lai et al. (Reference Lai, Wang, Wignall, Bond, Jiang, Ali and Sun2008) reported that the sedimentary environment of the Mudstone Unit of the Maokou Formation in northern Sichuan, which is time-equivalent with the interval between the Maokou Formation and Emeishan basalts in the present study, was an extremely shallow-water setting, such as a lagoon/tidal-flat environment. However, our results are somewhat different from those estimated by Isozaki et al. (Reference Isozaki, Yao, Ji, Saitoh, Kobayashi and Sakai2008) and Saitoh et al. (Reference Saitoh, Isozaki, Yao, Ji, Ueno and Yoshida2013), who postulated depths of over 150 m in northern Sichuan, using different methods.
5.d. Implications for sea-level changes in SW China in late Middle Permian times
Sea-level fluctuations during Capitanian times in SW China, situated in the eastern palaeo-Tethys, were characterized by short-term regression–transgression events associated with a long-term global marine regression in Capitanian times. The long-term regression resulted in the substantial sea-level drop at the Middle–Late Permian boundary (Fig. 12), which is clearly recorded by an extensive unconformity in South China and by termination of the thick reef complex in SW North America (Ross & Ross, Reference Ross, Ross, Scholle, Peryt and Ulmer-Scholle1995; Hallam & Wignall, Reference Hallam and Wignall1999; Tong et al. Reference Tong, Yin and Zhang1999; Jin et al. Reference Jin, Shen, Henderson, Wang, Wang, Wang, Cao and Shang2006; Haq & Schutter, Reference Haq and Schutter2008; Kofukuda et al. Reference Kofukuda, Isozaki and Igo2014; Bhattacharya & Banerjee, Reference Bhattacharya and Banerjee2015).

Fig. 12. Reconstructed sea-level curve for SW China and the world showing the relative sea-level changes during Capitanian time. The conodont zones are derived from Qiu et al. (Reference Qiu, Wang, Zou, Yan and Wei2014b) and the timescale is modelled after Wardlaw et al. (Reference Wardlaw, Davydov, Gradstein, Gradstein, Ogg and Smith2004). The sea-level curve for Laibin, Guangxi, is from Qiu et al. (Reference Qiu, Wang, Zou, Yan and Wei2014b), the pink and blue lines for northern Sichuan are from Isozaki et al. (Reference Isozaki, Yao, Ji, Saitoh, Kobayashi and Sakai2008) and Saitoh et al. (Reference Saitoh, Isozaki, Yao, Ji, Ueno and Yoshida2013), and the global curve is from Haq & Schutter (Reference Haq and Schutter2008). Dark blue boxes are common sea-level change magnitude values; light blue boxes represent the size of rare events of Rygel et al. (Reference Rygel, Fielding, Frank and Birgenheier2008).
Some workers have provided estimates of the amplitude of sea-level changes in northern Sichuan thus far. Isozaki et al. (Reference Isozaki, Yao, Ji, Saitoh, Kobayashi and Sakai2008) and Saitoh et al. (Reference Saitoh, Isozaki, Yao, Ji, Ueno and Yoshida2013) reported that sea-level rose significantly in two steps, resulting in change of the sedimentary environment from a euphotic shelf (generally shallower than 150 m) to a disphotic slope/basin (a depth of between 150 and 250 m) in Capitanian times (Saitoh et al. Reference Saitoh, Ueno, Isozaki, Nishizawa, Shozugawa, Kawamura, Yao, Ji, Takai, Yoshida and Matsuo2014) based on the stratigraphic changes in litho- and bio-facies in northern Sichuan (Fig. 12). Qiu et al. (Reference Qiu, Wang, Zou, Yan and Wei2014b) reported that the sea-level variations in the Laibin area of Guangxi during Capitanian times were within the transition zone between the lower slope and platform margin according to the sedimentary facies analysis (Fig. 12). However, the palaeopedological results presented here suggest that sea-level initially dropped by up to 6.5 m, followed by a rise of up to 10 m, and again dropped within the scope of 6.5 m in late Capitanian times (~262–260 Ma). Overall, our results suggest that the short-term variations in sea-level in SW China were consistent with the long-term decline on a global scale (Fig. 12).
Long-term sea-level variations are thought to be driven largely by slow tectonic processes that influence the volumetric capacity of the ocean basins, whereas short-term changes may be attributed to glaciation (Haq & Schutter, Reference Haq and Schutter2008). Moreover, Isozaki (Reference Isozaki2009a) suggested that mantle superplume activity was likely responsible for the global-scale sea-level drop around the Guadalupian/Lopingian boundary. In this study, the sea-level fluctuations in Capitanian times are possibly linked to global climatic fluctuations and regional tectonic activities (Isozaki, Reference Isozaki2006; Isozaki et al. Reference Isozaki, Kawahata and Ota2007, Reference Isozaki, Yao, Ji, Saitoh, Kobayashi and Sakai2008, Reference Isozaki, Aljinović and Kawahata2011). The global cooling episode in late Middle Permian times coupled with the Kamura event, a unique oceanographic event, occurred in the mid-superocean (Isozaki, Reference Isozaki2006; Isozaki et al. Reference Isozaki, Kawahata and Ota2007, Reference Isozaki, Aljinović and Kawahata2011; Fielding et al. Reference Fielding, Frank and Isbell2008; Isozaki & Aljinović, Reference Isozaki and Aljinović2009; Fujimoto et al. Reference Fujimoto, Otoh, Orihashi, Hirata, Yokoyama, Shimojo, Kouchi, Obara, Ishizaki, Tsukada, Kurihara, Manchuk and Sersmaa2012). In particular, a relatively cool climate prevailed in the tropical domain (Isozaki, Reference Isozaki2009b; Isozaki & Aljinović, Reference Isozaki and Aljinović2009) and resulted in seawater from the oceans evaporating and then snowing onto high elevation continental ice (Kofukuda et al. Reference Kofukuda, Isozaki and Igo2014). Thus, global cooling may have caused a global regression that influenced South China. In addition, the palaeokarst on top of the Maokou Formation, including palaeokarst relief, sinkholes, caves and tower karst, are geomorphological evidence of a tropical climate in SW China (Guizhou, Sichuan and Yunnan; He et al. Reference He, Xu, Chung, Xiao and Wang2003, Reference He, Xu, Guan and Zhong2010). Meanwhile, marine deposits covering the palaeokarst were also recorded in Guizhou and Sichuan provinces of SW China (He et al. Reference He, Xu, Wang and Luo2006). A regressive and transgressive phase is associated with regional basin uplift or depression. A regional tectonic uplift (i.e. the ‘Dongwu Movement’) in most of the South China Block occurred in latest Middle Permian times (Hu, Reference Hu1994; Editing Committee of Stratigraphy, 2000), which may have been related to the Emeishan basalts (He et al. Reference He, Xu, Wang and Xiao2005), and might have contributed to the exposure of the regressive carbonate platform and the karst and palaeosol formation. Furthermore, soil formation, burial and erosion are usually related to changes in tectonic and climatic conditions (Muhs & Bettis, Reference Muhs and Bettis2003; Retallack, Reference Retallack2008). Therefore, the formation of acid-sulfate palaeosol–limestone sequences may have been a result of sea-level changes linked to the global climatic conditions and regional tectonic activities in late Middle Permian times.
In the present study, the joint analysis of coastal plain palaeosols and carbonate microfacies offers a tool for estimating relative sea-level changes or water depths, which can help to detect multiple and small-scale variations in the sea-level. Coastal acid-sulfate soils overlying marine sediments are widely distributed in tropical or subtropical zones, such as in Indonesia (Konsten et al. Reference Konsten, Breemen, Suping, Aribawa and Groenenberg1994), Malaysia (Muhrizal et al. Reference Muhrizal, Shamshuddin, Fauziah and Husni2006) and Vietnam (Kawahigashi et al. Reference Kawahigashi, Do, Nguyen and Sumida2008), and this specific kind of soil has been reported from other geological periods (Kraus, Reference Kraus1998). Palaeopedology combined with carbonate microfacies analysis may therefore be used to determine sea-level changes over geological time.
6. Conclusions
In the SW Sichuan Basin, a section composed of two palaeosols separated by a 20 cm thick limestone was observed from the contact between the Maokou Formation and Emeishan basalts. Integration of pedological analysis based on micromorphological, morphological, mineralogical and geochemical properties and sedimentological analysis based on carbonate microfacies determination revealed that the studied palaeosols have developed as acid-sulfate soils in a coastal setting with subaerial exposure like modern acid-sulfate soils. Comparable sedimentary facies with acid-sulfate palaeosols are widespread in the Upper Yangtze Craton of South China and outline a large region of intertidal palaeoenvironments. The palaeosol–limestone alternation is also evidence of relative sea-level fluctuations. The depositional environment experienced a series of changes from shallow-marine to littoral, followed by tidal-flat and back to littoral. These depositional environments were overlain by continental basalts in late Capitanian times.
The magnitude of relative sea-level fluctuations likely ranged from 0 to 25 m, judging from the relationship between the acid-sulfate-soil-like palaeosols and carbonate microfacies. Marine regression was likely related to the global cooling episode and regional tectonic uplift. A short transgression within late Capitanian times recorded within the thin limestone underlying the coal-bearing shale was not reported in the other areas of South China, but marked a major environmental change in SW China. It may be related to localized depression caused by mantle plume-related substantial uplift and erosion activity in SW China. Hence, we speculate that global cooling caused the long-term Capitanian marine regression, aided by uplift of the Sichuan Basin during late Middle Permian times. We propose that the sequence of coastal acid-sulfate soils overlying limestone can provide a new tool for the estimation of sea-level fluctuations.
Acknowledgements
This study was funded by the National Natural Science Foundation of China (Grant Nos. 41771248 and 41371225) and the National Basic Research Program of China (Grant No. 2012CB822003). The authors would like to thank two anonymous reviewers for their valuable and detailed comments and suggestions.


