1. Introduction
Transverse drainages (TDs) are gorges incised through resistant topographic highs. Water gaps are TDs which have retained their connection to an upstream watershed, while wind gaps are those which have lost their connection to an upstream watershed through some source of relative uplift.
Perhaps because of the lack of objective physical criteria for their identification, surveys of transverse drainages are largely absent from the literature and current identification systems tend to focus upon methods of formation rather than morphology (Burbank, Meigs & Brozovi’c, Reference Burbank, Meigs and Brozovi’c1996; Zelilidis, Reference Zelilidis2000; Douglass et al. Reference Douglass, Meek, Dorn and Schmeeckle2009). A reason for the dearth of such studies may be the lack of accepted criteria for identifying TDs, perhaps because traditional topographic tools such as elevation profiles cannot distinguish TDs from normal stream segments (Lee, Reference Lee2013).
An initial model for identifying TDs through the use of Google Earth imagery was developed for the Susquehanna River basin, Pennsylvania (Lee, Reference Lee2013), and is here expanded and integrated with the GIS program Global Mapper to include the delineation of watershed boundaries in an internally drained region in Fars Province, Iran. Wind and water gaps in internally draining regions can give insight into the evolution of the drainage basin and, by extension, into the larger tectonic development of the surrounding region as the formation of internally draining regions is closely tied to the tectonic history of an area.
2. Area of study
Internal drainage results when an integrated fluvial system is defeated by an uplifted barrier (Sobel, Hilley & Strecker, Reference Sobel, Hilley and Strecker2003). Internally drained regions (IDRs) can be small, such as the Great Divide Basin of Wyoming, US (Roehler, Reference Roehler1992), or large, such as the Tibetan Plateau, the Puna-Altiplano of South America and the Tarim basin of China (Sobel, Hilley & Strecker, Reference Sobel, Hilley and Strecker2003; Strecker et al. Reference Strecker, Alonso, Bookhagen, Carrapa, Hilley, Sobel and Trauth2007; Carroll, Graham & Smith, Reference Carroll, Graham and Smith2010).
The IDR studied here is located within the Simply Folded Zone of the Zagros Mountains, a mountain range of the Alpine–Himalayan system which stretches for approximately 2000 km from the Anatolian Fault in eastern Turkey to the Minab Fault near the Makran region in the SE of Iran (Fig. 1) (Beydoun, Clarke & Stoneley, Reference Beydoun, Clarke, Stoneley, Macqueen and Leckie1992; Shaban, Sherkati & Miri, Reference Shaban, Sherkati and Miri2011). The structure of the region is the result of folding and thrusting of Palaeozoic–Mesozoic deposits of the Arabian margin and platform and of the overlying Cenozoic foreland (Stocklin, Reference Stocklin, Burk and Drake1974; Berberian & King, Reference Berberian and King1981; Lacombe, Grasemann & Simpson, Reference Lacombe, Grasemann and Simpson2011; Shaban, Sherkati & Miri, Reference Shaban, Sherkati and Miri2011; Mouthereau, Lacombe & Vergés, Reference Mouthereau, Lacombe and Vergés2012). Active deformation in the Zagros is thought to be confined at present to the Simply Folded Zone and to have initiated at c. 5–8 Ma (Homke et al. Reference Homke, Vergés, Garcés, Emami and Karpuz2004; Emami, Reference Emami2008; Khadivi et al. Reference Khadivi, Mouthereau, Larrasoaña, Vergés, Lacombe, Khademi, Beamud, Melinte-Dobrinescu and Suc2010). Mapping of deformed fluvial and marine terraces along the Mand and Daliki rivers and the Persian Gulf coast has demonstrated that deformation of the sedimentary cover is primarily aseismic, probably as a result of basement decoupling (Oveisi et al. Reference Oveisi, Lavé, Van Der Beek, Carcaillet, Benedetti and Aubourg2009). Detachment folding in this area was also affected by the mobilization of pre-existing salt domes and diapirs (Sherkati & Letouzey, Reference Sherkati and Letouzey2004; Sherkati et al. Reference Sherkati, Molinaro, Frizon de Lamotte and Letouzey2005; Jahani et al. Reference Jahani, Callot, Letouzey and Frizon de Lamotte2009).

Figure 1. (a) General location map showing major tectonic regions, faults and regional drainages, after Casciello et al. (Reference Casciello, Vergés, Saura, Casini, Fernández, Blanc, Homke and Hunt2009) and Walker, Ramsey & Jackson (2011). MZT – Main Zagros Thrust, HZF – High Zagros Fault, MFF – Mountain Front Fault. (b) Razak IDR region, showing ephemeral streams and lakes (small dotted lines and shaded areas within the IDR) and names of anticlines on IDR sub-basin boundaries (hatched outlines with white labels). Black dots represent water gaps, white dots represent wind gaps. ESRI World Imagery.
The IDR is bordered by the watersheds of the Mand River to the west and the Kul River to the east. The drainage paths of both rivers were strongly influenced by the migration of deformation from the northeast to the southwest, which created folds that diverted previous stream channels and influenced the development of their channel morphologies (Tucker & Slingerland, Reference Tucker and Slingerland1996; Burberry, Cosgrove & Liu, Reference Burberry, Cosgrove and Liu2007, Reference Burberry, Cosgrove and Liu2008; Vergés, Reference Vergés, Nichols, Paola and Williams2007). Lateral linkage of propagating fold segments similar to those studied in Kurdistan may also have affected drainage development in the Fars region (Ramsey, Walker & Jackson, Reference Ramsey, Walker and Jackson2008; Bretis, Bartl & Grasemann, Reference Bretis, Bartl and Grasemann2011; Zebari, Reference Zebari2013).
Informally named the Razak region by Allen et al. (Reference Allen, Saville, Blanc, Talebian and Nissen2013), the IDR is bounded by strike-slip and reverse faulting and consists of a series of shallow ponded lakes and basins filled with Quaternary sediments that isolate peaks of resistant Cenozoic and Mesozoic limestone (Walker, Ramsey & Jackson, Reference Walker, Ramsey and Jackson2011). It was first identified by Mouthereau et al. (Reference Mouthereau, Tensi, Bellahsen, Lacombe, De Boisgrollier and Kargar2007) and later studied in depth by Walker, Ramsey & Jackson (Reference Walker, Ramsey and Jackson2011), who identified dry valleys and wind gaps within several basins in the IDR.
Based on their topographic analysis, Walker, Ramsey & Jackson (Reference Walker, Ramsey and Jackson2011) hypothesized an antecedent river origin for the wind gaps in the IDR and inferred the past occurrence of transverse and parallel river segments, but presumed that no evidence for the past drainage path of the IDR streams is preserved in the geomorphology of the region.
However, while gross morphological features may not reveal palaeodrainage, detailed topographic analyses may offer insight into former drainage paths. For example, since the lowest point in any externally draining watershed represents the exit path of drainage from that watershed, it was reasoned that the lowest elevation on the catchment boundary of an IDR should represent the exit point for drainage from that basin prior to the loss of connectivity with surrounding watersheds. To test this hypothesis, however, accurate knowledge is required about both the location and the profile of the watershed boundaries.
Geographic Information Systems (GIS) are often used for generating watersheds and basin boundaries, and have been used to determine palaeolake boundaries in Australia and Africa (DeVogel et al. Reference DeVogel, Magee, Manley and Miller2004; Leblanc et al. Reference Leblanc, Favreau, Maley, Nazoumou, Leduc, Stagnitti, Van Oevelen, Delclaux and Lemoalle2006). However, elevation data for commonly available Digital Elevation Models (DEMs) in mountainous areas are often inaccurate (Fisher et al. Reference Fisher, Amos, Bookhagen, Burbank, Godard, Whitmeyer, Bailey, De Paor and Ornduff2012; Tooth, Reference Tooth, Shroder, Switzer and Kennedy2013; Saville, Reference Saville2013; AbuBakr et al. Reference AbuBakr, Ghoneim, El-Baz, Zeneldin and Zeid2013), which limits the usefulness of GIS for analysing such regions. In this study, the problem of erroneous DEM terrain elevations was rectified by importing a hand-corrected 90m Shuttle Radar Topography Mission (SRTM) DEM into Global Mapper (J. de Ferranti & C. Hormann, unpub. data, 2014: http://www.viewfinderpanoramas.org/dem3.html) and by integrating GIS functionality with Google Earth.
While the optical imagery hosted by Google Earth has been widely used to identify and locate geologic and geomorphic features, studies integrating GIS programs with Google Earth have been limited. A common element of those studies which have combined Google Earth and GIS analysis is the visual identification of geological structures which are then further analysed by a GIS. For example, AbuBakr et al. (Reference AbuBakr, Ghoneim, El-Baz, Zeneldin and Zeid2013) used Google Earth to manually trace faults and lineaments in the Sinai Peninsula and Fisher et al. (Reference Fisher, Amos, Bookhagen, Burbank, Godard, Whitmeyer, Bailey, De Paor and Ornduff2012) measured fault slip using Google-Earth-hosted imagery of the Owens Valley of California.
In this study, Google Earth was used to identify wind and water gaps which were then quantified and analysed in Global Mapper, a more traditional GIS. Google Earth was also used to correct errors in DEM elevations and to refine basin catchment borders for watersheds generated by Global Mapper.
3. Methods
The process of palaeodrainage reconstruction included the identification and quantification of TDs, the delineation of the IDR watershed and the generation of a palaeodrainage based upon basin characteristics.
3.a. Criteria for identification of TDs
Identification of TDs is made possible by the recognition that there are two mappable characteristics that distinguish transversely draining streams from normal stream segments:
-
1. transversely draining streams flow from a region of lower elevation into a region of higher elevation and then back into a region of lower elevation; and
-
2. contour lines constrict through the breached topographic high.
To facilitate the identification of constricted contour lines, B. Zoltan's (unpub. data, 2011: https://productforums.google.com/forum/#!msg/gec-weather-climate-moderated/_fU8MuYal6M/m5vFpDTaXvMJ) Google Earth sea-level rise slider was modified for the Razak study to allow a horizontal plane to transgress or regress upon the Google Earth surface, following the insight of Dordevic (Reference Dordevic, Whitmeyer, Bailey, De Paor and Ornduff2012) that Google Earth time sliders can be used to elevate objects such as models or overlays (Fig. 2). Mayer et al. (Reference Mayer, Menichetti, Nesci and Savelli2003) used a DEM to perform a similar function in a study of the Italian Apennines, projecting a horizontal surface downwards in order to test the hypothesis that the TDs in the orogen formed progressively seawards as folds emerged. Global Mapper was also used to generate polygons covering areas of less than 5° slope, which were imported into Google Earth to aid in identification of the areas of lower elevation upstream of TDs.

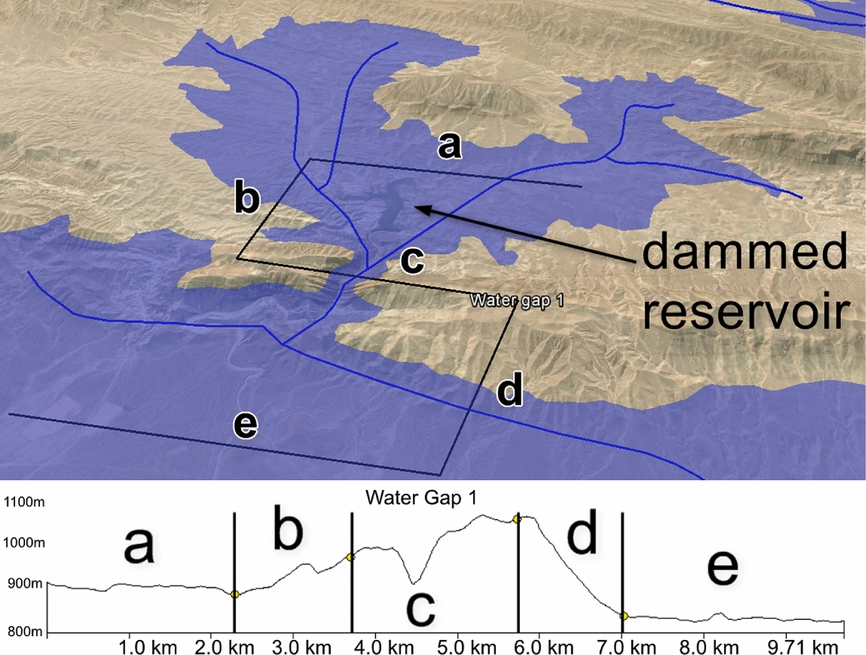
Figure 2. Water Gap #1 in Google Earth with sea level set at 930m asl to demonstrate constriction of contours through TD. Letters refer to the five different segments of the S-line. Map data: Google, Digital Globe, CNES/Astrium. Lower: S-line demonstrates M-shaped elevation profile. This TD appears to be a wind gap because the channel base in segment c is at a higher elevation than the upstream channel in segment a; the presence of the dammed reservoir in the Google Earth view reveals that this TD is not a wind gap but a true water gap, however. For TDs with erroneous elevation values such as this, the adjusted channel base elevations of the c segments were obtained by averaging the channel elevations of segments a and e.
Once a TD was identified by visual inspection, Google Earth's elevation tool was used to characterize lower elevations of its downstream and upstream segments and the higher elevation of the breached structure by means of an S-shaped line connecting three parallel traverses of the stream channel: upstream, across and downstream of the topographic high. The elevation generated by this S-line displays a characteristic M-shape (Fig. 2). The S-line was also used to distinguish wind gaps, whose ridge-breaching channels lie at a higher elevation than either the upstream or downstream channels (Lee, Reference Lee2013). Proxies such as the direction of channel tributaries and of rill and gully streams on the ridge flanks were used to distinguish water gaps from wind gaps when the elevation data were ambiguous.
The final criteria for TD identification include:
-
1. visual observation of stream or stream channel on Google Earth;
-
2. continuity of structure observed across the TD;
-
3. sea-level rise slider shows filled contour interval, demonstrating constriction through TD; and
-
4. diagnostic S-line and M-shaped profile constructed.
Once TDs were identified their S-lines were imported into Global Mapper, which was used to compute the orientation and depth of the TD and to generate watersheds upstream of the breached high. A total of 35 water gaps and 34 wind gaps were identified within the IDR (Fig. 3). Topographic evidence suggests the existence of other TDs, but a conservative approach was taken to avoid over-counting. (For the TD data table, see the online Supplementary Material available at http://journals.cambridge.org/geo; shapefiles and Google Earth KMZ files are available upon emailed request.)

Figure 3. Watershed boundaries for Razak IDR sub-basins and drainage network produced by Global Mapper's Generate Watershed command, using for basin fill the highest fill necessary to produce connectivity with a sub-basin (170 m for Area E). Capital letters refer to IDR sub-basins. The straight lines in the drainage network are indicative of stream networks crossing the basin fill surface generated by Global Mapper and represent a virtual lake surface. Stars indicate low points on sub-basin boundaries that may have been former points of cross-basin integration; boxes indicate converging ridges illustrated in close-up view in (a) and (b) below. ESRI World Imagery.
The azimuths of the b and d stream-parallel segments of the S-lines were aggregated to serve as a proxy for the azimuths of stream flow through the TDs. Flow directions within the TDs were found to have preferred values, which appeared to be controlled by regional structure. Water gaps were more often oriented orthogonal to ridges while the azimuths of wind gaps, many representing beheaded stream channels running parallel to ridge axes, were both parallel and orthogonal to regional structure.
3.b. Delineation of internally draining region boundaries
Since IDRs have no external drainage, the area draining to the lowest point of any basin is equivalent to the basin catchment area. To identify these low points in the Razak IDR, Walker, Ramsey & Jackson's (Reference Walker, Ramsey and Jackson2011) map of the area was transformed into a Google Earth overlay (Simpson et al. Reference Simpson, De Paor, Beebe, Strand, Whitmeyer, Bailey, De Paor and Ornduff2012) and low elevations within the IDR were visually selected and exported as points into Global Mapper. Once the true base elevations were identified the Generate Watershed command was used to delineate their watersheds, which were then cross-checked with Google Earth. Six adjacent internally draining sub-basins were identified within the Razak IDR, with a combined area of 7356 km2 (Fig. 3; for basin data table see the online Supplementary Material available at http://journals.cambridge.org/geo).
3.c. Basin fill computation and palaeodrainage streamflow generation
Global Mapper computes watersheds by first filling basins to a user-specified elevation and then using an eight-direction pour point algorithm to calculate the flow direction at each location. Since the lowest elevation on the boundary of an IDR should represent the exit point for drainage from that basin prior to the loss of connectivity with surrounding watersheds, the number used for basin fill for the IDR was calculated from the highest basin fill necessary to produce connectivity within a sub-basin (170 m for Area E).
The resulting drainage consisted of two networks (Fig. 3):
-
1. a large drainage to the north, consisting of sub-basins A, B, D and E all draining centrally into basin C, which in turn drained WNW into the Mand watershed; and
-
2. a smaller basin to the south consisting solely of sub-basin F, whose streamlines drained ESE into the Mand watershed.
The straight lines in the drainage network indicate stream networks crossing the basin fill surface generated by Global Mapper and represent, in effect, a virtual lake surface. Assuming that there has been no significant tectonic reordering of the topography, this stream network should represent the most recent palaeodrainage of the Razak IDR prior to the loss of external connectivity.
4. Drainage development in the Razak IDR
Based on their topographic analysis, Walker, Ramsey & Jackson (Reference Walker, Ramsey and Jackson2011) proposed that the drainage in the Razak IDR was antecedent to the folding that created the topographic highs and made the following hypotheses.
-
1. A river system similar to the adjacent Mand and Kul rivers once flowed in transverse and parallel segments through the Razak IDR.
-
2. Tributaries of the abandoned river network would have flowed transverse to the structure to join a single trunk stream.
-
3. Wind gaps preserved on fold crests delimited the location of streams traversing anticlinal ridges.
-
4. The main river took the most direct route between successive wind gaps.
-
5. The trunk stream flowed to the southwest in its upper reaches then bent abruptly to the east, although wind gaps within the south-western part of the IDR suggest a possible connection to a westwards-flowing river.
-
6. The original through-going river was abandoned.
4.a. Methods of transverse drainage formation
Antecedence is one of four major mechanisms that have been proposed to explain the formation of TDs. The other three are superimposition, stream capture (also known as stream piracy) and overflow (Clark, Reference Clark1989; Morisawa, Reference Morisawa1989; Bishop, Reference Bishop1995; Burbank, Meigs & Brozovi’c, Reference Burbank, Meigs and Brozovi’c1996; Twidale, Reference Twidale2004; Douglass & Schmeeckle, Reference Douglass and Schmeeckle2007; Douglass et al. Reference Douglass, Meek, Dorn and Schmeeckle2009). While antecedence and superimposition both assume a pre-existing drainage network, superimposed streams are believed to have maintained their original channel and direction of flow as they downcut through buried ridges while antecedent streams preserved their original course during uplift of buried resistant layers. In stream capture, streams erode headwards or laterally through divides to capture the drainages of other streams, while overflow refers to the phenomenon of impounded water overtopping a barrier.
The main problems with an antecedent origin for the Razak IDR are the preferred orientation of TD directions and the persistence of water gaps in what would have been antecedent tributary streams while the major trunk stream was defeated.
Oberlander (Reference Oberlander1965) noted that one of the chief requisites for antecedence and superimposition is a lack of consistency in angles of approach and transection of structural barriers, since both mechanisms imply formation of the drainage network before the establishment of current relief. The study results indicate a very strong consistency in orientation of the TD streams however, implying a strong topographic control.
Further insight comes from the innovative experiments of Douglass & Schmeeckle (Reference Douglass and Schmeeckle2007) who used stream tables, misters and expandable bladders to simulate all four mechanisms of TD formation. Although their experiments were at a much reduced scale, Paola et al. (Reference Paola, Straub, Mohrig and Reinhardt2009) have pointed out the ‘unreasonable effectiveness’ of small-scale modelling, noting that civil engineers have successfully used small-scale models for over a century (Lee, Reference Lee2013).
In their antecedence experiments, Douglass & Schmeeckle (Reference Douglass and Schmeeckle2007) found that trunk streams were more likely to be successful than tributaries in incising rising high grounds. Under Walker, Ramsey & Jackson's (Reference Walker, Ramsey and Jackson2011) model however, since the transverse tributary streams in the Razak IDR were antecedent to the rising ridges, the persistence of water gaps to the present means that some tributary streams were able to overcome the rising resistant high ground while the main trunk stream did not.
In addition, rivers are very sensitive to elevation changes under conditions of steady base level. This is demonstrated for example by the beheaded drainage of many streams around the Great Lakes resulting from glacial activity (Fleeger, Reference Fleeger1997; Harper, Reference Harper1997), and by the work of Burrato, Ciucci & Valensise (Reference Burrato, Ciucci and Valensise2003) and Burrato et al. (Reference Burrato, Vannoli, Fracassi, Basili and Valensise2012) who showed that the Po River of Italy has responded with channel changes to blind thrusts that have no expression at the surface. River channels can also shift rapidly in response to tectonically imposed changes (Burbank & Anderson, 2001) and to changes in water, sediment yield and substrate composition (Twidale, Reference Twidale2004; Wohl, Reference Wohl2012).
Since the upstream watersheds and the depth of incision of transversely draining streams through a resistant high can both be measured, and since catchment area is related to erosive ability (Howard, Dietrich & Seidl, Reference Howard, Dietrich and Seidl1994), TDs offer a unique opportunity to model erosion into underlying bedrock. This is essential for any large-scale landscape model, since it creates relief and is the critical link between tectonics and erosional processes via base level control (Howard, Dietrich & Seidl, Reference Howard, Dietrich and Seidl1994; Sklar & Dietrich, Reference Sklar and Dietrich2004). In the Razak IDRs, the difference between the base of the incised channel and the highest point on the cross-breach segment of the S-line was used as a proxy for the depth of a water gap, while the upstream watersheds were generated with Global Mapper (Fig. 4). There was no statistical correlation between the depths of the IDR water gaps and their upstream watersheds, which might have been expected if watershed is proportional to stream power and if the tributary network was inherited from an antecedent or superimposed stream.
Figure 4. Plot of TD depth vs. upstream watershed area for IDR water gaps, showing lack of correlation between upstream watershed area and TD depth (area axis is logarithmic).
4.b. Alternative models of TD formation
It is unlikely that the Razak IDRs were formed by a pre-existing stream network, under either an antecedent or a superimposition model, because of: (1) the apparent topographic control of TD orientation in the Razak IDR; (2) the lack of correlation of watershed area with depth of incision into topographic highs; and (3) the present-day persistence of water gaps on what would have been antecedent tributary streams while their trunk stream no longer exists.
Alternative origins for the Razak TDs include stream capture or basin overflow, both of which invoke drainage younger than or contemporaneous with uplift.
Under stream capture, headwards erosion into the cuestas and folds of the IDR would have created the current system of TDs either subsequently to or contemporaneous with uplift. However, stream capture is a controversial theory. While Twidale (Reference Twidale2004) has pointed out apparent stages in the breaching of divides in places such as the Flinders Range of Australia, Bishop (Reference Bishop1995) questioned headwards erosion as a mechanism for stream capture and others doubt the ability of seepage erosion and groundwater sapping to erode bedrock valleys in resistant rocks (Lamb et al. Reference Lamb, Howard, Johnson, Whipple, Dietrich and Perron2006; Lamb, Reference Lamb2008; Lamb & Dietrich, Reference Lamb and Dietrich2009).
Although some of Douglass & Schmeeckle's (Reference Douglass and Schmeeckle2007) stream piracy experiments succeeded, they found that the conditions necessary for completion were restricted, supporting Bishop's (Reference Bishop1995) caution against the routine invocation of stream piracy as a mechanism of TD formation. The results of their stream piracy experiments would also tend to support Horton's (Reference Horton1945) theory of a belt of non-erosion at headward reaches of catchments (Lee, Reference Lee2013).
Ultimately, Douglass & Schmeeckle (Reference Douglass and Schmeeckle2007) concluded that the key to TD formation is the establishment of knickpoints. Models of stream capture through headwards erosion need to explain how the mechanisms available for erosion of head stream catchments, including overland flow, rain splash and spring sapping, could be capable of creating enough shear stress to create knickpoints and erode resistant rocks at the interfluve divides, especially given the small size of the streams near the divides.
4.c. Palaeobasin model for transverse drainage formation in the Razak IDR
Of the four mechanisms tested by Douglass & Schmeeckle (Reference Douglass and Schmeeckle2007), only overflow proved to be an unequivocal success. A basin spill-over model for the origin of the Razak IDR would explain the topographic control of both water and wind gaps, and is also supported by the flat topography and the presence of permanent and ephemeral lakes of the central parts of the sub-basins. In addition, under a basin spill-over model watershed area would not tend to be correlated with incision.
In their stream table experiments Douglass & Schmeeckle (Reference Douglass and Schmeeckle2007) found that, given two or more outlets from an overflowing basin, one will erode faster leaving the others as wind gaps. Since all TDs on the boundary of an IDR are wind gaps by definition, the deepest wind gap should represent the most recent point of integration with the adjacent basin while higher wind gaps on the watershed borders may represent former points of basin integration.
To test this hypothesis, the borders of the sub-basins were examined in profile view for wind gaps. On the shared boundary between Area A and the region to the north of the IDR, there is a channel-like feature whose base is only slightly higher in elevation than the boundary minimum elevation to the south, suggesting the possibility that drainage networks extended at one time from the northern area into the IDR (northern-most star in Fig. 3). Currently, the Kul River flows through the area north of the IDR and exits to the southeast through the nose of two converging ridges. Interestingly, the palaeodrainage exit from the Razak IDR through Area C passes through converging ridges whose topography is very similar to the drainage exit of the Kul River from the area north of the IDR (Fig. 3a, b).
In a normal series of integrated lake basins, drainage proceeds from areas of higher elevation to those of lower elevation (Sack, Reference Sack, Parsons and Abrahams2009). The same holds true for the Razak palaeodrainage, with the exception of Area E which has a lower average elevation than Area C into which it drains, raising the possibility that drainage at one time proceeded southwards from Area C into Area E. Examination of the boundary of Area E in profile view did reveal a channel-like feature on the shared border with Area F to the south, whose base is only a few metres higher than the exit point for drainage on the northern border with Area C (southern-most star in Fig. 3).
AbuBakr et al. (Reference AbuBakr, Ghoneim, El-Baz, Zeneldin and Zeid2013) used a GIS to flatten terrain in order to demonstrate a palaeodrainage through a dry valley in the Sinai Peninsula. In Global Mapper, it is possible to accomplish the converse effect by creating a triangulated irregular network (TIN), a vector-based representation of a surface that can be used to simulate a raised topographic high. By creating a TIN to block both the palaeodrainage pour point of Area C into the Mand watershed and the flow of the Kul River through the converging ridges north of the IDR, a palaeodrainage was generated that passed from the area north of the IDR, down through all of the sub-basins and out into the current path of the Shur 1 River, which ultimately drains into the Mand watershed to the west (Fig. 5).

Figure 5. Upper figure shows drainage path generated with TINs (marked by Xs) blocking exits for drainage from both northern area and Area C. Dashed line shows future path of Kul River after loss of connectivity of northern area with Area A. Boxes (a–d) refer to close-up views of basin interconnection points illustrated below, with dotted lines representing sub-basin watershed boundaries. In each close-up view, thick curved arrow (blue online) represents through-going drainage, solid S-lines are water gaps and dashed S-lines are wind gaps. White areas are Global-Mapper-generated virtual sea-level-rise surfaces used to emphasize the drainage morphology through the TDs. Straight black arrows in (a–c) indicate direction of streamflow through TDs and arrow in (d) indicates location of water gap in profile W–E below. Connection between areas (a) A and C; (b) C and E; and (c) E and F. (d) Exit from Area F into Mand River watershed, showing location of profile W–E (below) across the Kuh-e Khonj anticline, which forms part of the southern border of Area F. ESRI World Imagery.
4.d. Palaeolake reconstruction
Global Mapper can create a surface on a DEM that simulates rising water level or a filled basin. This was used to create a virtual lake surface in each of the largest basins (A, C, E and F) whose elevation is just below that of their spill-over points, which would have been the minimum level of any interconnecting lakes in the network (Fig. 6). If the areas of low slope within the basin represent the previous lake bottoms, then a comparison with the virtual lake surfaces provides a visual estimate of the amount of post-external drainage tectonic warping.

Figure 6. Overlay of virtual lake surfaces (cross-hatched areas) showing general correspondence with areas of slope <5° (white areas). Profile N–S shows basin fill corresponding to elevations slightly below pour points into adjacent sub-basins. Numbers below area names on profile indicate weighted average elevations of low slope areas within each sub-basin.
There was a strong correspondence between the area covered by the virtual lake surfaces and the area covered by the low-slope polygons in all the IDR sub-basins. There was less overlap between the virtual lake surface and the low-slope areas in the area north of the IDR, which might be indicative of tectonic activity.
The profile in Figure 6 is drawn through the flattest parts of the IDR, originating in the area to the north of the IDR and exiting through the southeast corner of Area F. The virtual lake surfaces are shown filling the basins, along with the weighted average elevations of the low-slope areas within each sub-basin. The profile illustrates the large difference in elevation between the combined northern area and Area A and the sub-basins to the south. The elevation-influenced difference in potential energy between sub-basins may have been a factor in the creation of TDs downstream of the basin overflow points.
4.e. Analysis of sub-basin interconnections
Figure 5a–d provides close-up views of the IDR connection points illustrated in the upper part of Figure 5, with Global-Mapper-generated virtual sea-level-rise surfaces (white areas) used to emphasize the morphology. The arrow track represents the presumed original through-going drainage from the area north of the IDR down through all the basins and exiting through Area F, while the individual arrows represent the sense of direction of streams through the present-day TDs.
The connection point between areas A and C (Fig. 5a) is characterized by water gaps downstream of the through-going palaeodrainage across the boundary wind gap, while the connection between areas C and E (Fig. 5b) is characterized by several water gaps oriented in the opposite direction of the presumed original palaeodrainage. The connection between areas E and F (Fig. 5c) has one broad water gap upstream of the boundary whose flow is opposite to the palaeodrainage and two water gaps downstream of the boundary which are aligned with the palaeodrainage direction.
If the water gaps formed from a basin lake overflowing a divide, these configurations suggest that most of the water gaps near the areas A–C and E–F interconnections were formed primarily by the original north–south through-going drainage, while the water gaps near the Area C–E connection were created after erosion in the western part of Area C reversed the drainage flow through Area E from south to north.
A longitudinal profile across the bounding ridge to the south of Area F (Fig. 5, lower) shows a water gap surrounded on either side by a series of progressively higher wind gaps. Ramsey, Walker & Jackson (Reference Ramsey, Walker and Jackson2008) proposed that the water gap was formed by the successive pinching of propagating folds, but this topographic analysis suggests that the gap may have been produced at least in part by basin overspill from Area F.
The direction of palaeodrainage reconstructed here agrees well with the Walker, Ramsey & Jackson (Reference Walker, Ramsey and Jackson2011) reconstruction in the northern part of the network, but diverges in the southern portion of the IDR where they hypothesized that the drainage turned east, exiting the region through Area E. While acknowledging that the drainage could have continued to the west or the south, they held that there was no evidence for the latter two paths. The analysis here however suggests that the original IDR palaeodrainage flowed in a continuous south-westerly direction from the region north of the current IDR into Area F, and connected ultimately with the Mand watershed to the west. The decrease in elevation of the basins from the northeast towards the southwest is also consistent with the well-documented stepwise uplift of the basement toward the northeast in the Zagros region (Blanc et al. Reference Blanc, Allen, Inger and Hassani2003; Sherkati & Letouzey, Reference Sherkati and Letouzey2004; Molinaro et al. Reference Molinaro, Leturmy, Guezou, Frizon de Lamotte and Eshraghi2005; Sherkati et al. Reference Sherkati, Molinaro, Frizon de Lamotte and Letouzey2005; Sherkati, Letouzey & de Lamotte, Reference Sherkati, Letouzey and Frizon de Lamotte2006; Leturmy, Molinaro & de Lamotte, Reference Leturmy, Molinaro, de Lamotte, Leturmy and Robin2010; Farzipour-Saein, Nilfouroushan & Koyi, Reference Farzipour-Saein, Nilfouroushan and Koyi2013). The formation of structurally controlled lakes is consistent with Mouthereau, Lacombe & Vergés’ (Reference Mouthereau, Lacombe and Vergés2012) suggestion that the south-westwards propagation of deformation in the Fars arc was probably too rapid for rivers to keep pace with fold uplift, preventing incision by antecedence or superposition.
Regional fracture patterns are well-known sources of control on river drainage patterns (Twidale, Reference Twidale2004; Twidale & Bourne, Reference Twidale and Bourne2007; Bourne & Twidale, Reference Bourne and Twidale2011), and may have had a role in controlling TD formation in the basin spill-over model. Given the ridge-perpendicular orientation of most of the Razak TDs, cross-axial extensional fractures oriented perpendicular to the fold axis would be the most likely candidate for nascent TDs on the flanks of the Razak IDR ridges (Stearns & Friedman, Reference Stearns, Friedman and Gould1972; Nelson, Reference Nelson1979; Fossen, Reference Fossen2010). However, the stress field in the Zagros region is complex. While fault-related fractures have been shown to control river development in Kurdistan (Reif et al. Reference Reif, Decker, Grasemann and Peresson2012), Bretis, Bartl & Graseman (Reference Bretis, Bartl and Grasemann2011) did not see an influence of fracture on drainage pattern on two anticlines in the northwest Zagros. McQuillan (Reference McQuillan1973) found that fracture density was independent of structural setting in the Asmari limestone reservoir rock of the Khuzestan oilfield belt of SW Iran and Lacombe, Bellahsen & Mouthereau (Reference Lacombe, Bellahsen and Mouthereau2011) found that fracture patterns in the folded strata of the Zagros Simply Folded Belt in the Fars region are heterogeneous and complex, probably resulting from the interplay between both kinematic boundary conditions and local deformational events. More study is necessary before a conclusion can be drawn about the influence of fracture upon TD formation in the Razak IDR.
5. Palaeodrainage reconstruction
The basin flow analysis presented here is consistent with an integrated lake system that formed as a direct result of fold growth. Wind gaps at sub-basin boundaries represent former spill-over points from higher basins. This is supported by TD orientation, flattened topography of the basins, streamflow lines generated by the GIS analysis and the presence of ephemeral lakes in the largest basins. In addition, sub-basins are a common feature of many palaeolakes (Sack, Reference Sack, Parsons and Abrahams2009). This interpretation is also consistent with Douglass & Schmeeckle's (Reference Douglass and Schmeeckle2007) stream table experiments which showed that, given two or more outlets from a overflowing basin, one will erode faster leaving the others as wind gaps.
A possible sequence of events can be constructed as follows (Fig. 7).

Figure 7. Reconstruction of palaeodrainage development in the Razak IDR. Arrow track represents main direction of drainage, Xs mark TINs blocking drainage exits. North is upwards in all figures. (a) Palaeodrainage reconstruction with TINs blocking exits of drainage into Kul River watershed area and into Mand River watershed from Area C. Dashed line marks future path of the Kul River. (b) TIN in northern area is removed, simulating redirection of drainage from north of IDR through converging ridges into the Kul River watershed. (c) TIN in Area C is removed, simulating erosion through converging ridges causing redirection of drainage into Mand River watershed of Areas A, B, C, D and E. This reconstruction represents the most recent drainage configuration prior to loss of external drainage. ESRI World Imagery.
-
1. Fold growth initiated the formation of a series of interconnecting lakes extending to the southwest from the area north of the current IDR and draining ultimately into the Mand watershed, whose spill-over points are now marked by wind gaps (Fig. 7a). Other wind and water gaps in the basins, some of which still contain relict streams, may mark discharge over the basin boundaries that occurred prior to the preferential selection of one point of basin spill-over.
-
2. Erosion and/or regional tilting in the south-eastern corner of the area to the north of the IDR redirected drainage around the current IDR towards the present course of the Kul watershed, creating a wind gap between the northern area and Area A at their former point of interconnection (Fig. 7b).
-
3. Erosion on the western catchment border of Area C lowered base level enough to redirect drainage from Area E into Area C, creating a wind gap between Areas E and F at their point of interconnection, while Area F retained its south-eastwards drainage flow into the Mand watershed (Fig. 7c).
-
4. Continued aridification of the climate caused the lakes to evaporate to a level below their points of connectivity to the Mand watershed and to become ephemeral.
Since the region is seismically active (Walker, Ramsey & Jackson, Reference Walker, Ramsey and Jackson2011), earthquake activity may have influenced the defeat of external drainage in the area. Faulting is suggested by a steep scarp at the boundary between areas E and C, and may be the cause of the anomalously low average elevation of Area E relative to Area C.
6. Initiation of internal drainage
Precise dating is difficult in this region due to the scarcity of organic remains for radiocarbon dating (Walker & Fattahi, Reference Walker and Fattahi2011) and the lack of documentation of climatic cycles and events known from other parts of the globe (Kehl, Reference Kehl2009). However, since basin spillover implies drainage subsequent to or contemporaneous with formation of topographic relief, the c. 5–8 Ma onset for folding in the Fars region provides the outer constraint on the initiation of the IDR drainage network.
The limit on the most recent age of external connectivity would be the desiccation of the basin lakes. Walker & Fattahi (Reference Walker and Fattahi2011) found indications of substantial amounts of surface water in now arid parts of eastern Iran as recent as 7.8 ka. While the timing of the shift from basins containing large bodies of standing water to modern-day arid conditions remains uncertain, Fattahi et al. (Reference Fattahi, Walker, Talebian, Sloan and Rasheedi2014) found evidence that the South Golbaf palaeolake located about 350 km to the NE of the IDR held significant amounts of water from c. 13.5 ka until c. 6.3 ka, at which point over-spilling resulted in the rapid and synchronous termination of lacustrine deposition.
Studies of alluvial fan abandonment have also been used to constrain periods of climate change throughout eastern Iran. Regard et al. (Reference Regard, Bellier, Braucher, Gasse, Bourlès, Mercier, Thomas, Abbassi, Shabanian and Soleymani2006) reported surface abandonment ages of 5.6±0.06 to 44.0±3.4 10Be ka for the Hormuz Strait area and Walker & Fattahi (Reference Walker and Fattahi2011) found indications of a regional abandonment of alluvial fan surfaces at c. 10±3 ka. Alluvial fan studies, sediment core investigations and cosmogenic dating studies might help to better constrain the onset of internal drainage in the Razak IDR. Additionally, stratigraphic studies may help to relate the sediments in the IDR to the Agha Jari formation, which is considered to have been formed by fluvial systems ancestral to the present river systems in the Mesopotamian foreland basin (Vergés, Reference Vergés, Nichols, Paola and Williams2007).
7. Conclusion
This topographic analysis suggests that the Razak IDR represents a series of formerly integrated lake basins which have since dried up, possibly due to climatic aridification and tectonic activity. While topographic analysis alone is insufficient to give a complete picture of a basin's geomorphic evolution, the techniques described here are easily adaptable to both larger and smaller internally drained regions. They may also be helpful in analysing the drainage evolution of other internally drained basins and for suggesting future areas of study.
Acknowledgements
The author gratefully acknowledges the comments of the reviewers, which led to substantial improvement of the manuscript.
Supplementary material
To view supplementary material for this article, please visit http://dx.doi.org/10.1017/S0016756814000685