


1. Introduction
The Singhbhum Craton (SC) of India is separated from the Chhotanagpur Gneissic Complex (CGC) in the north by the Tamar–Porapahar shear zone, and in the south it is separated from the Eastern Ghats Mobile Belt (EGMB) by the Sukinda shear zone. The North Singhbhum Mobile Belt (NSMB) is the part of the Central Indian Suture Zone (CISZ), situated north of the Singhbhum Archaean centre (Mukhopadhyay, Reference Mukhopadhyay2001) and comprises metamorphosed rocks of varying protoliths such as volcanoclastic, siliciclastic and pelitic compositions (Sarkar & Saha, Reference Sarkar and Saha1962). The NSMB is part of the Older Metamorphic Group (OMG) of peninsular India. The OMG as a supracrustal must have been initially deposited as sediments and volcanics on an earlier basement, now unidentifiable in the region. The transformation and remobilization of initially deposited sediments and volcanics generating granitic rocks might have been the major cause of their non-recognizable nature. In addition, there are also evidences of several later-generation granites that are now grouped in the Singhbhum Granite Complex (SGC). The study area, Kandra (22° 47′ to 22° 55′ N, 86° 00′ to 86° 05′ E; Fig. 1a, b) lies c. 20 km NW of Jamshedpur city, Jharkhand, and is characterized by a well-developed Barrovian facies series. It includes rock types such as mica schist, amphibolites, and quartzites, etc. These rocks are of Proterozoic age and represent a part of Singhbhum Orogeny (Saha, Reference Saha1970; Matin et al. Reference Matin, Banerjee, Gupta and Banerjee2012; Banerjee & Matin, Reference Banerjee and Matin2013). Previously, different aspects of the geology of this area have been described by various workers (Dunn & Dey, Reference Dunn and Dey1942; Mitra, Reference Mitra1954; Roy, Reference Roy1966; Chakraborty & Sen, Reference Chakraborty and Sen1967; Lal & Singh, Reference Lal and Singh1978; Lal et al. Reference Lal, Ackermand and Singh1987; Dwivedi & Lal, Reference Dwivedi and Lal1992; Dwivedi et al. Reference Dwivedi, Singh and Prakash1993). Based on the first appearance of the index minerals, this area may be divided into four metamorphic zones: (1) biotite zone, (2) garnet zone, (3) staurolite zone, (4) sillimanite zone (Prakash et al. Reference Prakash, Patel, Tewari, Yadav and Yadav2017). In this metamorphic belt, kyanite appears much earlier than staurolite and it occurs sporadically in staurolite schists. Hence, it is not possible to demarcate kyanite isograd separately on the geological map. The rare occurrence of kyanite in staurolite indicates that sillimanite is not derived from kyanite and is derived from staurolite (Prakash et al. Reference Prakash, Patel, Tewari, Yadav and Yadav2017). The metamorphic events in this area show clear evidence of polyphase metamorphism. The main aims of the present paper are (i) to demarcate the study area into different metamorphic zones based on mineral chemistry and discontinuous reactions, (ii) to construct P–T phase equilibria modelling (pseudosections) for the four metamorphic zones delineated, (iii) to propose a P–T gradient followed by the metamorphites of the area, and then (iv) finally the integrated approach will indicate the cause of the regional metamorphism.

Fig. 1. (a) Simplified geological map of Singhbhum craton showing the main lithological units and structural elements as well as the location of the study area (modified after Chakraborty et al. Reference Chakraborty, Sengupta, Biswas and Sengupta2015). The area marked by the box is elaborated in (b); SBG, Singhbhum Granite; MG, Mayurbhanj Granite; C, Chakradharpur Granite; Dm, Dhanjori Metavolcanics; Kv, Volcanics of Kolhan Group; S, Soda Granite; DV, Dalma Volcanics; A, Arkasani Granophyre. (b) Geological map of the study area delineated into different zones and isograds (modified after Prakash et al. Reference Prakash, Patel, Tewari, Yadav and Yadav2017).
2. Geological setting
Existing geochronological data suggest Palaeoproterozoic (~2.2–1.60 Ga) magmatism, metamorphism and deformation with imprints of Mesoproterozoic reactivations registered in different places of northern Singhbhum (Table 1, reviewed in Chakraborty et al. Reference Chakraborty, Sengupta, Biswas and Sengupta2015). The supracrustal rocks of Dhanjori, Chaibasa, Dhalbhum, Dalma and Chandil formations are enclosed between the Singhbhum Granitoid (SG) batholith in the south and Chottanagpur Gneissic complex (CGC) in the north and occur as a 200 km long and 50–60 km wide broadly east–west-trending curvilinear belt (Mazumder, Reference Mazumder2005; Mazumder et al. Reference Mazumder, Van Loon, Mallik, Reddy, Arima, Altermann, Eriksson and De2012a, b; Bhattacharya et al. Reference Bhattacharya, Nelson, Thern and Altermann2014). Cooling of the vast volume of Archaean Singhbhum granite possibly induced an isostatic readjustment. The associated tensional regime and deep-seated fractures controlled the formation of the Proterozoic Singhbhum basin. In accordance with Reddy & Evans (Reference Reddy, Evans, Reddy, Mazumder, Evans and Collins2009), the crust was at that time (1900–1800 Ma) thickened and rigid enough to allow surface and internal geological processes comparable to those prevailing today. The Proterozoic volcano-sedimentary succession consists of successively younger Dhanjori, Chaibasa, Dhalbhum, Dalma and Chandil formations of the Singhbhum crustal province record sedimentation and volcanism in a varying tectonic scenario (Mazumder, Reference Mazumder2005), hence it assumes immense geological significance (Eriksson et al. Reference Eriksson, Mazumder, Sarkar, Bose, Altermann and Van der Merwe1999, Reference Eriksson, Mazumder, Catuneanu, Bumby and Ilondo2006; Mazumder et al. Reference Mazumder, Bose and Sarkar2000; Mazumder, Reference Mazumder2005). According to Sengupta & Chattopadhyay (Reference Sengupta and Chattopadhyay2004), the Chaibasa Formation is characterized by dominantly arenaceous lithology whereas the Dhalbhum Formation is largely argillaceous. Acharyya et al. (Reference Acharyya, Gupta and Orihashi2010) suggested the Dhanjori Formation is of Late Archaean – Palaeoproterozoic age (poorly constrained between 2600 and 2100 Ma), and Sarkar et al. (Reference Sarkar, Ghosh, Lambert and Sarkar1986) assigned the age of the Chaibasa Formation (shallow-marine) as Palaeoproterozoic (c. 2200 Ma). Reasonably, shearing along the SSZ is a much younger geological event (c. 1600 Ma) than the formation of the units (>2100 Ma) affected by it. The metapelties of the area around Kandra (Fig. 1) belong to the Chaibasa Formation of the Singhbhum Group which represents a part of the Precambrian Orogenic cycle of Singhbhum region (Dunn & Dey, Reference Dunn and Dey1942; Naha, Reference Naha1961; Mazumder et al. Reference Mazumder, Van Loon, Mallik, Reddy, Arima, Altermann, Eriksson and De2012a, b; Chakraborty et al. Reference Chakraborty, Sengupta, Biswas and Sengupta2015). Structurally, the area represents the southern portion of the Singhbhum anticlinorium of the Singhbhum fold belt and is separated from the low-grade metamorphic rocks of the southern Singhbhum by a major shear zone designated as the Singhbhum Shear Zone (SSZ) (Fig. 1a). The region north of the SSZ is characterized by a sequence of mica schist, often garnetiferous, with numerous bands of amphibolite, hornblende schist and quartzite, metamorphosed to amphibolite facies. Dunn & Dey (Reference Dunn and Dey1942) grouped these formations into the ‘Chaibasa’ stage and placed them in the lower part of the Iron Ore Series. Iyengar & Murthy (Reference Iyengar and Murthy1982) renamed this stage as Ghatsila Formation, and Sarkar & Saha (Reference Sarkar and Saha1962) placed them in the Singhbhum Group. Huge basic magmatism took place during the extensional event which is represented by the Dhanjori and Dalma formations and may be represented as the first stage of the Palaeoproterozoic volcanics (Fig. 1a). In the northern part, these sequences are overlain by a sequence of low-grade rocks comprising magnetite phyllite, chlorite schist, carbon phyllite and orthoquartzite forming a belt south of the Dalma Volcanics. They have been called the Dhalbhum Formation (Table 1) and placed in the Singhbhum Group by Sarkar & Saha (Reference Sarkar and Saha1962). Finally, the volcano-sedimentary protolith of the North Singhbhum Fold belt was deformed and metamorphosed during the second phase of orogenesis (Fig. 1a).
Table 1. Generalized lithological and chronological events in the North Singhbhum Fold Belt (NSFB) and Singhbhum Shear Zone (SSZ) (modified after Chakraborty et al. Reference Chakraborty, Sengupta, Biswas and Sengupta2015)

Notes: Reviewed in 1Mazumder et al. (2012a, b), 2Roy et al. (2002b), 3Mahato et al. (2008), 4Sarkar et al. (1985), 5Pal and Rhede (2013), 6Roy et al. (2002a), 7Reddy et al. (2009), 8Sengupta et al. (2000).
In the study area, three types of planar structures have been recognized: (i) the bedding S1, (ii) the axial plane foliation S2 on bedding S1 (Fig. 2b) and (iii) crenulation cleavage S3 on microfolded S2 (Fig. 2d). The area displays two phases of deformation (D1 and D2) and two episodes of the medium-pressure type of metamorphism (M1 and M2). During the first phase of deformation (D1), the rocks were folded in E–W-trending isoclinal folds (F1) overturned to the south, and the foliation S2 developed. D1 is superimposed by D2 which folded the limbs of F1 folds and formed northerly-trending folds (F2) and the crenulation cleavage S3. The restricted study area falls within the domain sharing all the above-mentioned features; however, the rocks exposed in the study area incorporating fine- to medium-grained schistose rock display only a few partially developed features which can be clearly seen at the regional scale (Mahadevan, Reference Mahadevan2002). The M1 phase of metamorphism falls prior to the D1 phase of deformation and S2 tectonic fabric development, whereas the M2 metamorphic episode is associated with a late to post-D2 deformation event and is synchronous with S2 fabric evolution (Mahato et al. Reference Mahato, Goon, Bhattacharya, Mishra and Bernhardt2008).

Fig. 2. (a) Field photograph of foliated chlorite phyllite at Subarnarekha river. (b) Chlorite phyllite showing light green colour with S1 bedding plane parallel to the S2 schistosity plane and S3 plane makes an acute angle with these planes at Goradih. (c) Feldspathic phyllite near Gidibera. A crude foliation is also present in it. (d) Biotite schist showing intense shearing with S1 bedding plane parallel to the S2 schistosity plane and crenulation cleavage S3 on micro-folded S2 at Kanki. (e) Garnet–mica schist in which garnet occurs as coarse grains and partly enclosed by the foliation defined by the micaceous minerals.
The dominant rock types are metapelites (chlorite–biotite schist/phyllite, garnet/chlorite mica schist, staurolite–garnet–kyanite schist, sillimanite–garnet–mica schist) with occasional intercalations of metabasics (amphibolite). In this area, joints are well developed in amphibolites and quartzites (Fig. 3c). A few discontinuous micaceous quartzite bands (Fig. 3d) and lenses of quartz and kyanite within the metapelites have also been found. These rocks are metamorphosed by a regional event of metamorphism and show the highest grade in the south-central and central portion of the area, gradually decreasing towards the NNE and SSW. Key-horizon layers and top-to-bottom sedimentary structures are absent, making it difficult to establish the detailed stratigraphy of the study area. However, broad parallelism exists between the isograds and the axial trends of the regional folds. Spatial variation in metamorphic conditions of this area has been shown in the zonal map Figure 1b, whereupon the attitudes of different structural elements are superimposed. The isograds have been drawn chiefly on the basis of the first appearance of the index minerals. Kyanite in the present area has sporadic occurrence and does not follow any pattern.

Fig. 3. (a) Highly foliated feldspathic phyllite with folded S1 and S2 schistosity showing transposition of planar fabric at hinge zones at Sanjay river in Parbatipur. (b) Silvery feldspathic phyllite at Parbatipur. A crude foliation is also present in it. (c) Outcrop of amphibolite rock at Gopinathpur with three sets of joints J1, J2 and J3. (d) Outcrop of folded quartzite with E–W strikes and steep northerly plunging axisnear Kandra. (e) Outcrop of garnet–staurolite–mica schist near Bholadih. (f) Outcrop of sillimanite–gneiss with dark-coloured ferromagnesian minerals near Kandra. Garnet occurs as coarse porphyroblast along with fine needle-shaped sillimanite.
3. Sample description
A detailed field study has revealed the presence of different rocks in different zones which are grouped as follows:
i Biotite zone – Biotite schist (S5)
ii Garnet zone – Garnet–biotite–muscovite schist (SG1)
iii Staurolite zone – Garnet–staurolite–chlorite–mica schist (K13)
iv Staurolite zone – Staurolite–mica schist (K14)
v Sillimanite zone – Sillimanite schist (SS1)
3.a. Biotite zone
The rocks of this zone include schists, phyllites, and quartzite with or without kyanite. Phyllites and biotite schist are well exposed around Subarnrekha river c. 8 km NE of Kandra town. Phyllites are foliated metamorphic, shiny, fine-grained rocks consisting of white mica which shows preferred orientation. Primarily it is composed of quartz, chlorite and sericite mica. It belongs to low-grade metamorphic rock and shows a gradation in the degree of metamorphism between slate and schist. Biotite schist is schistose in character with a dazzling silvery-white or golden-green surface (Fig. 2a, b). The chlorite mica schist is green in colour and is punctuated by the occurrence of quartz veins and lenses (Fig. 2c). Foliation (S2) is defined by the parallel orientation of white mica and chlorite. In few specimens, mineral lineation is observed on the S3 foliation defined by elongation of chlorite flakes. With an increase in the amount of feldspar, the phyllites grade into feldspathic phyllite (Fig. 3b) in which augens of feldspar are conspicuous. Sometimes, chlorite occurs as discontinuous patches and streaks within the quartzo-feldspathic mass. The phyllites grade into mica schist in the vicinity of the garnet isograd, and the biotite schist consists of biotite, chlorite, muscovite and quartz (Fig. 2d).
3.b. Garnet zone
Garnet–biotite–muscovite schist is exposed c. 5 km north of Raipur and Gidibera. It also occurs c. 20 km south of Kandra in and around Gangpur. The garnet–biotite–muscovite schists of this zone are medium- to coarse-grained, light green to greenish grey in colour due to the predominance of chlorite. Garnet, chlorite, muscovite and quartz are the predominant constituent minerals in the rock. Garnet ranges in size from 0.5 mm to c. 2.0 mm (Fig. 2e). Garnet–biotite–muscovite schists are medium- to fine-grained rock with distinct schistosity defined by the arrangement of biotite and muscovite flakes (Fig. 3a).
3.c. Staurolite zone
The staurolite zone marked by garnet–staurolite–chlorite–mica schist extends from 18 km south around Sobhapur and also in and around Kandra town. It is also exposed near Ramchandrapur which is c. 5 km SE of Kandra. The lithotype recording the staurolite zone is staurolite–garnet–mica/kyanite schists. The schists of this zone are coarse-grained, brown-coloured rock with well-developed S2 schistosity marked by oriented muscovite and biotite (Fig. 3e). Large staurolite crystals, ranging in size from 0.5 to 2.5 mm length, are fairly abundant. They show random orientation along the S2 foliation. Garnet crystals range in size from 0.5 to 2.0 mm in diameter and are fairly abundant.
3.d. Sillimanite zone
Sillimanite schist is well exposed around Raghunathpur and Karangura, 2 km north of Kandra. It is also observed at Bhaduagora, Pathargora and Nandidih to the south of Kandra town. The sillimanite-bearing schists are light to dark grey in colour and are coarse-grained with well-developed S2 foliation defined by the parallel alignment of micas interlayered with quartzite (Fig. 3d). Sillimanite is fine-needle-shaped (Fig. 3f) and staurolite crystals are smaller in grain size. Garnet crystals range in size from 0.5 mm to c. 2 mm in diameter.
4. Textural relationship
4.a. Biotite zone
The rocks of this zone include schists, phyllites, and quartzite with or without kyanite. Prograde chlorite (0.10 to 1.4 mm long) occurs in the biotite zone. Coarse flakes of chlorite are interlayered with muscovite and biotite along S2 foliation (Fig. 4a). The quartzites are of grey, light brown or yellow colour, medium-grained and consist predominantly of quartz, sericite and chlorite.

Fig. 4. (a) Well-developed flakes of chlorite and biotite in biotite schist (sample no. S5). (b) The inclusion of biotite and chlorite present at the core of garnet porphyroblast indicating that garnet formed due to the expanse of biotite and chlorite in garnet–biotite–muscovite schist (sample no. SG1). (c) Relict chlorite and biotite within garnet porphyroblast in garnet–biotite–muscovite schist (sample no. SG1). (d) Garnet porphyroblast containing inclusions of biotite, chlorite and ilmenite indicating the formation of garnet from them in garnet–biotite–muscovite schist (sample no. SG1). (e) Post-kinematic poikiloblastic garnet in garnet–biotite–muscovite schist with a late, nearly inclusion-free rim. The core contains the inclusion of ilmenite, muscovite and quartz minerals (sample no. SG1). (f) Dextrally rotated euhedral garnet porphyroblast and strain slip cleavage produced due to intense shearing. S1 terminates against S2 schistosity plane in garnet–biotite–muscovite schist. The texture suggests the growth of the garnet in the centre of the photomicrograph is from pre (the core with inclusions orthogonal to the external foliation) to early (the external free-inclusions rim) to the D1 tectonic event (sample no. SG1).
4.b. Garnet zone
In thin-section, S1 foliation is deformed by tight F2 micro-folding associated with an S2 axial-plane schistosity. Resorbed chlorite and biotite are present at the core of the garnet porphyroblast, indicating prograde crystallization of garnet from chlorite and biotite (Fig. 4b, c, d). In thin-sections, micas define the main foliation (S2) and wrap the garnet crystal, so garnet growth pre-dates the foliation. The core of the garnet with sigmoidal inclusions (but not continuing in the external foliation) points to a pre-D1 tectonic event (Fig. 4f). Garnet grains commonly occur as porphyroblasts, which are xenoblastic and sieved with inclusions of quartz, biotite, muscovite and ilmenite (Fig. 4e). At times, small idioblastic to sub-idioblastic grains, with their rim free of any inclusion, are also present (Fig. 4f). Garnet is characterized by spiral or rotational Si defined by inequant quartz and ilmenite. The foliation S2 wraps around garnet with pressure shadow areas of quartz (Fig. 5a).
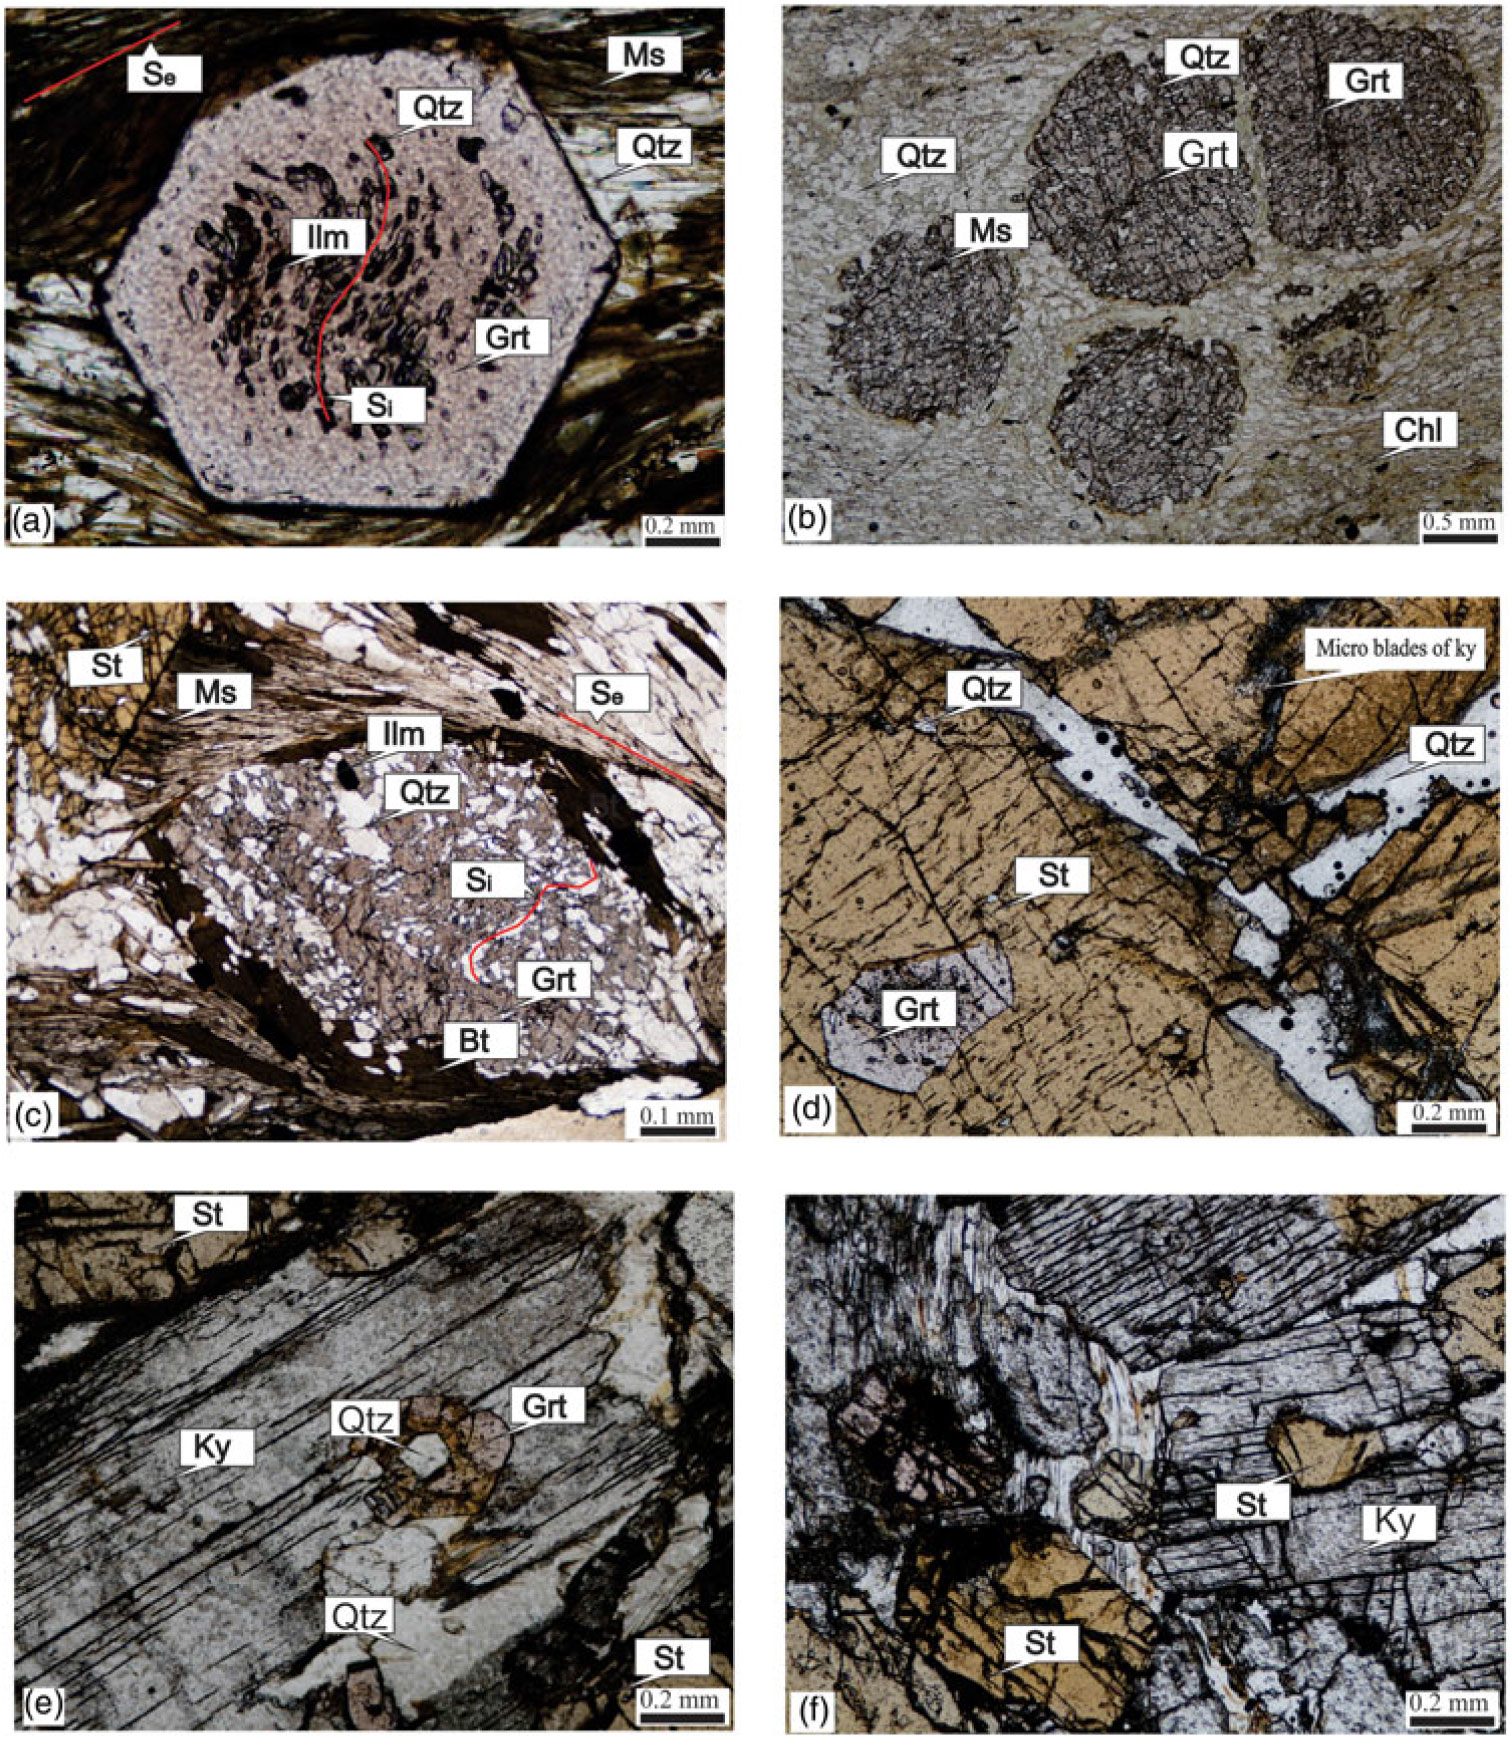
Fig. 5. (a) Photomicrograph of garnet–biotite–muscovite schist (sample no. SG1) showing inclusion-rich core with Si discordant with Se, surrounded by the inclusion-free rim in dextrally rotated garnet porphyroblast (sample no. SG1). (b) Fractured and rounded garnet porphyroblasts with inclusions of quartz and opaque in chloritic groundmass in garnet–muscovite–chlorite schist (sample no. SG1). (c) Oval-shaped highly poikiloblastic garnet containing linear Si of inequant quartz discordant with the foliation Se encloses the poikiloblastic garnet. The texture suggests the growth of the garnet in the centre of the photomicrograph is from pre (the core with inclusions orthogonal to the external foliation) to early (the external free-inclusions rim) to the D1 tectonic event (sample no. K14). (d) Large porphyroblasts of staurolite with inclusions of garnet and microblades of kyanite in garnet–staurolite–mica schist (sample no. K14). (e) Large blades of kyanite with the inclusion of garnet in garnet–staurolite–mica schist (sample no. K14). (f) Blades of kyanite with the inclusion of staurolite and in contact with staurolite in garnet–staurolite–mica schist (sample no. K14).
Near the staurolite–biotite isograd, the size of the garnet increases significantly (up to 1.0 mm in diameter). Besides the prograde crystallization of chlorite, its retrograde formation from garnet and biotite is also seen, where the garnet xenoblasts are enclosed within chlorite mass (Fig. 5b).
4.c. Staurolite zone
The lithotype recording the staurolite zone is staurolite–garnet–mica/kyanite schists. In a thin-section, the S2 foliation shows prominent microfolding associated with the development of an S3 axial plane foliation that can be classified as crenulation cleavage. Skeletal xenoblastic crystals of highly sieved garnet, with coarse equant inclusions of quartz which are comparable in grain size to the quartz occurring in the matrix, are very common in this zone (Fig. 5c). The textural relations suggest that growth of garnet occurred after the development of S1 foliation, with respect to D1 deformation. The inclusion of garnet occurs in staurolite (Fig. 5d), which suggests the crystallization of garnet preceded that of staurolite. Locally, garnet and staurolite occur as inclusions within kyanite, indicating prograde metamorphism (Fig. 5e, f). Staurolite also occurs as xenoblasts enclosed within an aggregate of biotite and muscovite or in coarse porphyroblasts of muscovite (Fig. 6a).
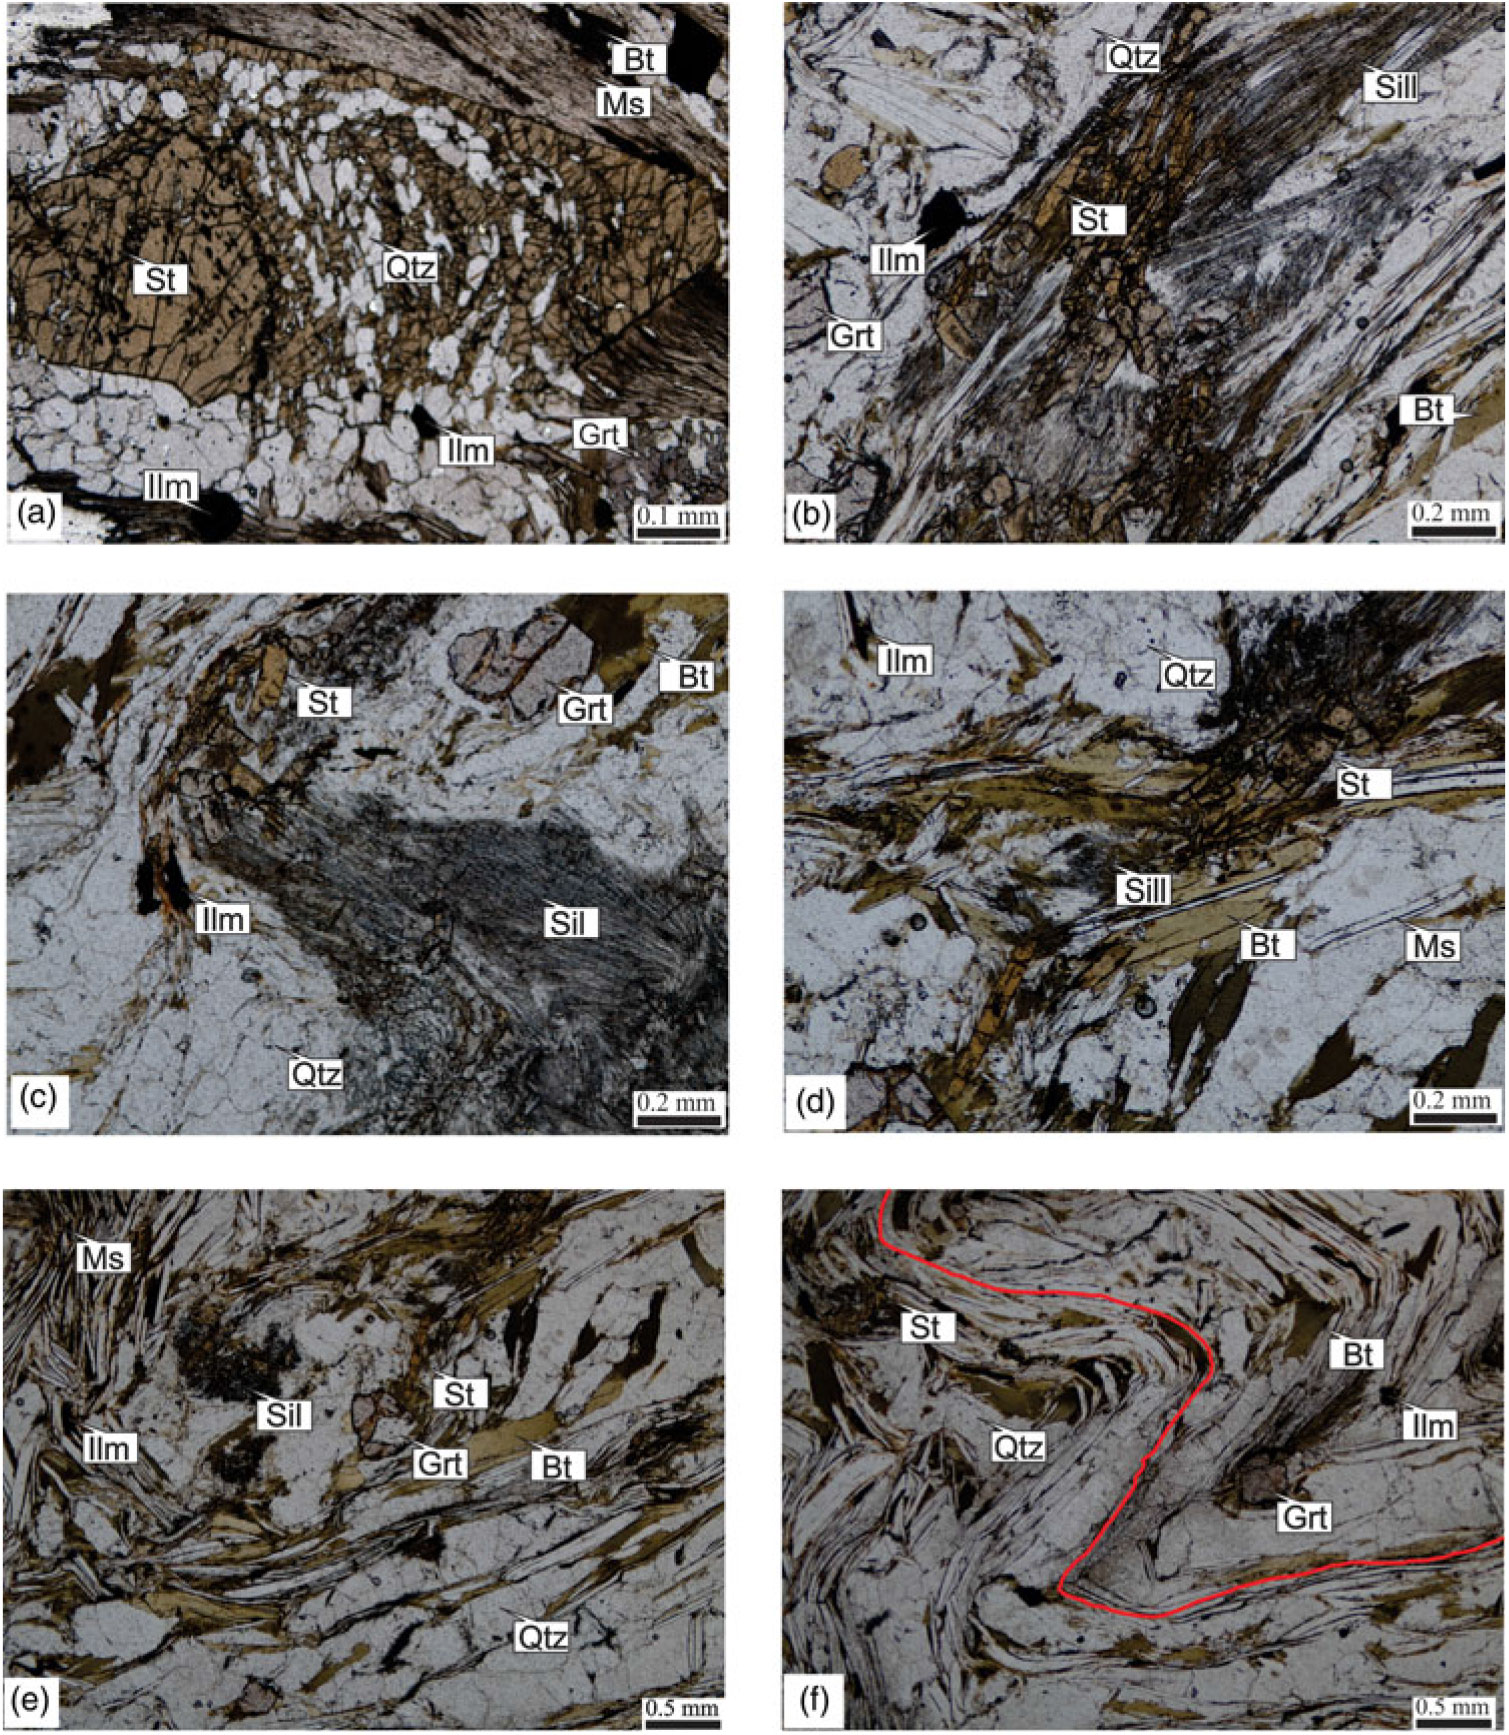
Fig. 6. (a) Sieved staurolite containing linear Si of inequant quartz discordant with the foliation Se encloses the poikiloblastic staurolite in garnet–biotite–muscovite schist (sample no. K14). (b) Relict garnet porphyroblast replaced by fibrolite occurs along with biotite in sillimanite schist (sample no. SS1). (c) Fibrolite with relics of staurolite and post-tectonic garnet in sillimanite schist (sample no. SS1). (d) Relict staurolite replaced by fibrolite occurs along with biotite and muscovite foliation in sillimanite schist (sample no. SS1). (e) Sillimanite intergrowth along with muscovite, staurolite, garnet, in sillimanite schist (sample no. SS1). (f) Microfolding of the foliation S2 with relics of staurolite and post-tectonic garnet in sillimanite schist (sample no. SS1).
4.d. Sillimanite zone
These rocks show schistose lepidoblastic texture with well-developed S2 schistosity, which is defined by the parallel orientation of muscovite and biotite. Sometimes, S2 is micro-folded with the development of S3 crenulation cleavage at high angles. Biotite and muscovite flakes are sharply folded along these microfolds, and ilmenite follows the orientation of mica along these microfolds. Few muscovite flakes are found oriented parallel to the axial plane of the S2 fold. Sillimanite commonly occurs as fibrolite mats (Fig. 6b, c). In one sample, i.e. sillimanite–garnet–biotite schist that is devoid of muscovite, coarse radiating needles of sillimanite have been observed. Fibrolites are randomly oriented and intimately intergrown with biotite or muscovite or both (Fig. 6d). Fibrolite also occurs at the grain borders of garnet, quartz and as inclusions within it. Fibrolite mats are deformed and folded along with the microfolded S2 foliation (Fig. 6e, f). The textural features described above indicate post-tectonic crystallization of fibrolite and sillimanite with respect to D1. Mostly, sillimanite occurs as fibrolite mats intergrown with staurolite in this zone. Textural features indicate the formation of sillimanite from the breakdown of staurolite (Fig. 6e).
5. Mineral chemistry
The mineral chemistry was carried out by a CAMECA-SX Five electron microprobe (EPMA) at the Department of Geology, Banaras Hindu University, Varanasi. Wavelength-dispersive spectrometry and a LaB6 filament have been deployed for quantitative analyses. An accelerating voltage of 15 kV, a beam current of 10 nA and a beam diameter of 1 μm along with TAP, LPET and LLIF crystals were employed for measurement. A number of natural and synthetic standards were used for calibration. After repeated analyses, it was found that the error on major element concentrations is less than 1 % of each oxide’s weight per cent. Representative mineral chemistry of various phases is provided in Tables 2–8.
Table 2. Representative analyses of garnet (12 oxygen basis)

XMg = Mg/(Mg + Fe2+); C – core; R – rim;
Grt = garnet, Bt = biotite, Ms = muscovite, Chl = chlorite, St = staurolite, Sil = sillimanite.
Table 3. Representative analyses of chlorite (28 oxygen basis)

XMg = Mg/(Mg + Fe2+); C – core; R – rim;
Grt = garnet, Bt = biotite, Ms = muscovite, Chl = chlorite, St = staurolite, Sil = sillimanite.
Table 4. Representative analyses of biotite (22 oxygen basis)

XMg = Mg/(Mg + Fe2+); C – core; R – rim;
Grt = garnet, Bt = biotite, Ms = muscovite, Chl = chlorite, St = staurolite, Sil = sillimanite.
Table 5. Representative analyses of muscovite (22 oxygen basis)

XMg = Mg/(Mg+Fe2+); C – core; R – rim;
Grt = garnet, Bt = biotite, Ms = muscovite, Chl = chlorite, St = staurolite, Sil = sillimanite.
Table 6. Representative analyses of staurolite (23 oxygen basis)

XMg = Mg/(Mg + Fe2+); C – core; R – rim;
Grt = garnet, Bt = biotite, Ms = muscovite, Chl = chlorite, St = staurolite, Sil = sillimanite.
Table 7. Representative analyses of plagioclase (8 oxygen basis)

XCa = Ca/(Ca + Na + K); C – core; R – rim;
Grt = garnet, Bt = biotite, Ms = muscovite, Chl = chlorite, St = staurolite, Sil = sillimanite.
Table 8. Representative analyses of K-feldspar (24 oxygen basis)

XK = K/(Ca + Na + K); C – core; R – rim;
Grt = garnet, Bt = biotite, Ms = muscovite, Chl = chlorite, St = staurolite,
Sil= sillimanite.
5.a. Garnet
Garnet consists mainly of almandine component which ranges from 68 to 77 %. In these garnets, pyrope, spessartine and grossularite components range from 10 to 15 %, 3 to 9 % and 1 to 5 % respectively. In the area around Kandra, bulk EPMA analysis of the garnet indicates an increase in MnO% of garnet from the staurolite towards the high-grade sillimanite zone and also towards the low-grade garnet zone. The [Mg/(Mg + Fe2+) = XMg] varies from 0.11 to 0.14 in the garnet zone, 0.14 to 0.16 in the staurolite zone and 0.16 to 0.18 in the sillimanite zone. It is evident that there is a gradual increase of XMg in the garnet with increasing grade of metamorphism. Based on stoichiometric considerations, the andradite component was found to be <5 %.
5.b. Chlorite
As the chlorites of the area are analysed by microprobe, the content of Fe3+ is calculated stoichiometrically. However, the ubiquitous presence of magnetite possibly suggests moderate Fe3+ in these chlorites (up to 0.2 per formula unit (pfu)). Thus, it is assumed that the chlorites belong to the oxidized class. The plots of the analyses of the chlorite show that these are mainly ripidolite.
The aluminium contents of chlorite from different zones range between 21 and 24 wt % and do not reveal any significant change with the grade of metamorphism. The high Al content of the chlorites from the Kandra area is related to the ubiquitous association of these chlorites with muscovite and sericite.
The XMg values in the chlorites vary from 0.51 to 0.58 in the biotite/garnet zone and 0.50 to 0.51 in the staurolite zone. Chlorite is expected in rocks of similar bulk composition through continuous reaction:
 $${\rm{Garnet\, zone}}:{\rm{ Chlorite }} + {\rm{ muscovite }} + {\rm{ quartz }} \\ = {\rm{ biotite }} + {\rm{ garnet }} + {\rm{ }}{{\rm{H}}_{\rm{2}}}{\rm{O}}$$
 $${\rm{Staurolite\,zone}}:{\rm{ Chlorite }} + {\rm{ muscovite }} \\ = {\rm{ biotite }} + {\rm{ staurolite }} + {\rm{ quartz }} + {\rm{ }}{{\rm{H}}_{\rm{2}}}{\rm{O}}$$
This feature is evident when the chlorites of the biotite/garnet zone and the staurolite zone are compared. Considerably higher XMg in the chlorite in the biotite/garnet zone compared to that in the staurolite zone suggests the effect of bulk composition in controlling this ratio because the textural features suggest crystallization of chlorite during the syntectonic phase of D1 deformation, while in the higher-temperature zones it reacted with other minerals and disappeared. This feature can also be controlled by oxygen fugacity (Zane et al. Reference Zane, Sassi and Guidotti1998), as well as composition of altered minerals, such as amphibole, biotite, etc., but bulk composition as controlling factor seems to be more appropriate in the present case.
5.c. Biotite
The XMg in the biotite varies in the different zones as follows: 0.43 to 0.44 in the biotite zone, 0.44 in the garnet zone, 0.48 to 0.53 in the staurolite zone, 0.55 to 0.57 in the sillimanite zone, showing a slight increase in the XMg of biotite with the grade of metamorphism in the area. The Ti content is almost constant from the biotite zone to the starolite zone but it is considerably higher in the sillimanite zone.
5.d. Muscovite
Chemical analysis shows that there is a gradual increase of XMg in muscovite with increasing grade of metamorphism. The muscovites of the Kandra area contain 0.03–0.36 TiO2 pfu and do not show any correlation with grade of metamorphism. There is a general decrease in the TiO2 content of muscovite with the modal rise in muscovite–biotite/chlorite + staurolite. Thus, the TiO2content of these muscovites shows a correlation with the host rock composition. Guidotti (Reference Guidotti1970) has shown that the jump in Ti content of muscovite coincides with a sharp modal decrease in muscovite, on the basis of which he suggested that the increase in Ti content of micas is primarily due to the concentration effect which results in a modal decrease in muscovite and hence total mica. The phengitic content is recognized by higher trisilicic muscovite (i.e. more than 6.00 pfu on the basis of 22 oxygens). Reaction (1), although it explains the association of garnet–muscovite–chlorite–biotite in pelitic rocks of the garnet zone in the Kandra area, does not take into consideration the reduction in the phengitic component of white mica which is evident from the comparison of the biotite and garnet zones of the Kandra area. It is therefore proposed that reaction (1) explains the observed mineralogical assemblage in the garnet zone pelites of the area.
5.e. Staurolite
The XMg values in the staurolite range from 0.18 to 0.19 in the staurolite zone and 0.18 to 0.17 in the sillimanite zone. Thus, XMg decreases from the staurolite to the sillimanite zone. Similarly, the decrease in XMg of the staurolite from staurolite zone to sillimanite zone (and also from the core to the rim) may be attributed to continuous reaction:
 $${\rm{Sillimanite\,zone}}:{\rm{ Staurolite }} + {\rm{ muscovite }} + {\rm{ quartz }} \\ = {\rm{ sillimanite }} + {\rm{ biotite }} \pm {\rm{ garnet }} + {\rm{ }}{{\rm{H}}_{\rm{2}}}{\rm{O}}$$
5.f. Feldspar
The XAn content of plagioclase feldspar has been determined by microprobe and varies in different zones as follows: biotite zone 0.22, garnet zone 0.24, staurolite zone 0.25–0.27 and sillimanite 0.29. The XOr content of K-feldspar ranges from 0.60 to 0.73 in sillimanite schist.
6. Metamorphic P–T conditions
6.a. Geothermobarometry
An effort has been made to calculate the pressure and temperature (P–T) conditions of schists of various zones, viz. biotite zone, garnet zone, staurolite zone and sillimanite zone, of the investigated area simultaneously by using conventional thermobarometry and the winTWQ program. A garnet–biotite thermometer was been applied for the garnet zone. The average temperature obtained for the above pair is 525 °C (Fig. 7). The estimated average temperature for a plagioclase – K-feldspar pair for the sillimanite zone is 650 °C (Fig. 7). A simplified thermometer empirically calibrated by Henry et al. (Reference Henry, Guidotti and Thomson2005) based on the Ti content and XMg in the biotite was applied for different zones. The average temperatures estimated using this thermometer for the biotite, garnet, staurolite and sillimanite zones are 565 °C, 578 °C, 585 °C and 620 °C respectively. Pressure estimates were obtained from a garnet–plagioclase–biotite–muscovite–quartz assemblage employing different calibrations (Fig. 7). The winTWQ program calculates the location of reaction equilibria in P–T spaces using the thermodynamic data of Berman (1988, updated Reference Berman1991) and Berman & Aranovich (Reference Berman and Aranovich1996) for the end-member phases. Given the offset of end-member phases and a specified P–T window, winTWQ calculates all possible equilibria, stable and metastable, applicable to that rock. The end-member phases used in the winTWQ program calculations for the biotite zone include albite, annite, beta-quartz, chlorite, eastonite, hematite, magnetite, muscovite, phlogopite, siderite and water. There are five possible equilibria that can be written for the selected end-member phases. Using these equilibria for sample S5 gives precise intersection (Fig. 8a; Table 9) at 4.4 kbar, 438 °C. The end-member phases used in the winTWQ program calculations for the garnet zone include annite, chlorite, grossular, hematite, K-feldspar, kyanite, magnetite, margarite, muscovite, pyrope and water. There are four possible equilibria that can be written for the selected end-member phases. Using these equilibria, for sample SG1 a precise intersection is obtained (Fig. 8b; Table 9) at 4.9 kbar, 545 °C. The end-member phases used for the staurolite zone include almandine, annite, anorthite, grossular, K-feldspar, phlogopite, pyrope, staurolite and water. Using these equilibria, sample K14 gives precise intersection (Fig. 8c;Table 9) at 5.4 kbar, 550 °C. Similarly, for the sillimanite zone, end-member phases used include albite, annite, beta-quartz, K-feldspar, paragonite, phlogopite, pyrope, sillimanite, staurolite and water. There are six possible equilibria that can be written for the selected end-member phases. Use of these equilibria for sample SS1 gives precise intersection (Fig. 8d; Table 9) at 6.4 kbar, 675 °C.

Fig. 7. (a) Coexisting garnet–biotite pairs (garnet zone) and derivative temperature (°C) at 5 kbar. (b) Coexisting garnet–chlorite pairs (staurolite zone) and derivative temperature (°C) at 5.5 kbar. (c) Coexisting plagioclase – K-feldspar (sillimanite zone) pairs and derivative temperature (°C) at 6.5 kbar. (d) Coexisting garnet–lagioclase–biotite–muscovite–quartz assemblage (garnet zone) and derivative pressure (kbar) at 550 °C (e). Coexisting garnet–plagioclase–biotite–muscovite–quartz assemblage (staurolite zone) and derivative pressure (kbar) at 550 °C. (f) Coexisting garnet–plagioclase–biotite–muscovite–quartz assemblage (sillimanite zone) and derivative pressure (kbar) at 700 °C.

Fig. 8. Calculated P–T conditions for different zones obtained by application of the winTWQ program using the equilibria listed in Table 9. Schematic P–T grid illustrating the stability fields for different metamorphic zones of metamorphism. Calculated P–T values for different zones are shown by yellow solid circles. Al2SiO5 triple point and emerging univariant curves after Holdaway (Reference Holdaway1971). Anatexis minimum curve for plagioclase (An26) after Bucher & Grapes (Reference Bucher and Grapes2011). Different equilibria reactions are shown, as determined experimentally. The solid line with an arrow indicates the postulated P–T gradient during the prograde regional metamorphism.
Table 9. Simultaneous calculation of P–T by winTWQ program

Phases used in calculation: Ab, albite; Alm,almandine; An, anorthite; Ann, annite; Chl, chlorite; Eas, eastonite; Gr, grossular; Hm, hematite; Kfs, k-feldspar; Ky, kyanite; Mrg, margarite; Ms, muscovite; Mt, magnetite; Pg, paragonite; Phl, phlogopite, Py, pyrope; Qtz, beta-quartz; Sd, siderite; Sil, sillimanite; St, staurolite; dS and dV are calculated at 1 bar and 298 K.
6.b. Phase equilibria modelling
The prograde metamorphic history of the schists in and around the Kandra area is constrained using various P–T pseudosections relevant to the mineral assemblages preserved in different rocks of the area. These pseudosections involve the use of the preferred bulk composition of rocks to predict the metamorphic mineral assemblages at equilibrium within a certain pressure–temperature window (Powell & Holland, Reference Powell and Holland1988; Holland & Powell, Reference Holland and Powell1998; White et al. Reference White, Powell and Holland2001, Reference White, Powell and Clarke2003, Reference White, Powell and Holland2007; Clark & Hand, Reference Clark and Hand2010). The pseudosections have a major advantage over P–T petrogenetic grids in that they portray and quantify multivariant equilibria. Respective stability fields of different mineral assemblages bounded by either univariant reaction lines or zero mode isopleths, at a range of P–T conditions, can be shown by phase equilibria modelling. The bulk rock compositions of the representative samples collected from the study area were analysed using X-ray fluorescence (XRF) technique (Siemens Sequential X-ray Spectrometer SRS 3000 (Wavelength Dispersive) at Wadia Institute of Himalayan Geology, Dehradun, India). The amount of H2O used for P–T pseudosection calculations was approximated from the ‘loss on ignition’ (LOI) value obtained during XRF analysis. Based on the amounts of major oxides obtained from bulk rock analysis along with the calculated amount of H2O, P–T pseudosections were constructed using Perple_X software (version 6.7.2). For the different metamorphic zones, different pseudosections have been constructed. The detailed formula, notation and sources of the solution models are given in Table 10. Based on the mineral assemblages and compositions, an 11-component system MnNCKFMASHTO (MnO–Na2O–CaO–K2O–FeO–MgO–Al2O3–SiO2–H2O–TiO2–Fe2O3) was chosen for pseudosection construction.
Table 10. Solution notation, formula and model sources for phase

The pressure range considered for the biotite zone is 2–6 kbar, and the temperature range is 327–627 °C; for the garnet zone the pressure ranges from 3 to 8 kbar, and temperature from 300 to 700 °C; for the staurolite zone, P and T values ranges respectively between 3 and 8 kbar and 300 and 900 °C; for the sillimanite zone, the pressure range between 4 and 8 kbar and temperature range between 427 and 827 °C were taken. The P–T conditions derived through XMg and XTi biotite (sample no. S5) intersect at 445 °C and 4.4 kbar for the biotite zone (Fig. 9a, b). The pseudosection (sample no. SG1) was contoured by XMg garnet and XMg biotite isopleths. The calculated isopleths intersect at 5 kbar and 540 °C for the garnet zone (Fig. 10a, b). The pseudosection (sample no. K13) is contoured by XMg garnet, XMg biotite and XMg staurolite isopleths. The calculated isopleths for XMg garnet and biotite intersect at 5.3 kbar and 550 °C for the staurolite zone (Fig. 11a, b). The pseudosection (sample No. SS1) was contoured by XMg garnet, XMg staurolite and XMg biotite isopleths. The calculated isopleths for XMg garnet and biotite intersect at 6.4 kbar and 675 °C for the sillimanite zone (Fig. 12a, b). P–T pseudosection calculations were constructed to model peak conditions for the present mineral assemblages. The calculation reliability is dependent on the uncertainties in effectual bulk composition (chemical refraction caused by the growth of garnet porphyroblast), fluid infiltration, partial melting and compositional zoning in the garnet (Tinkham & Ghent, Reference Tinkham and Ghent2005). Therefore, a small variation in both the whole-rock geochemistry and equilibrating P–T condition cannot be ruled out.

Fig. 9. (a) Calculated P–T pseudosection for biotite schist (sample no. S5) in the MnNCKFMASHTO system. Bulk composition in wt % (Na2O 3.04, CaO 2.23, K2O 4.41, FeO 7.38, Fe2O3 0.92, MgO 3.47, Al2O3 25.22, SiO2 49.17, H2O 1.76, TiO2 0.82, H2O 2.45, MnO 0.06). (b) The pseudosection has been contoured for the isopleths XMg and XTi biotite. P–T condition obtained using biotite composition by the intersection of XMg and XTi.

Fig. 10. (a) Calculated P–T pseudosection for garnet–biotite–muscovite schist (sample no. SG1) in the MnNCKFMASHTO system. Bulk composition in wt % (Na2O 1.63, CaO 1.39, K2O 1.23, FeO 3.28, Fe2O3 0.41, MgO 1.78, Al2O3 20.44, SiO2 60.32, H2O 2.06, TiO2 0.86, MnO 0.19). (b) The pseudosection has been contoured for the isopleths XMg garnet and XMg biotite. P–T condition obtained using the intersection of XMg (garnet) and XMg (biotite).

Fig. 11. (a) Calculated P–T pseudosection for garnet–staurolite–mica schist (sample no. K13) in the MnNCKFMASHTO system. Bulk composition in wt % (Na2O 1.17, CaO 0.49, K2O 3.73, FeO 3.28, Fe2O3 0.41, MgO 3.22, Al2O3 20.33, SiO2 57.09, H2O 1.76, MnO 0.07, TiO2 1.03, H2O 1.46). (b) The pseudosection has been contoured for the isopleths XMg garnet, XMg biotite and XMg staurolite. P–T condition obtained using the intersection of XMg (garnet) and XMg (biotite).

Fig. 12. (a) Calculated P–T pseudosection for sillimanite schist (sample no. SS1) in the MnNCKFMASHTO system. Bulk composition in wt % (Na2O 1.88, CaO 0.98, K2O 4.84, FeO 5.57, Fe2O3 0.70, MgO 2.32, Al2O3 24.33, SiO2 55.39, H2O 1.76, TiO2 1.03, H2O.2.22, MnO 0.1). (b) The pseudosection has been contoured for the isopleths XMg garnet, XMg biotite and XMg staurolite. P–T condition obtained using the intersection of XMg (garnet) and XMg (biotite).
7. Discussion
7.a. P–T conditions of prograde metamorphic zones
The textural study of phyllites and schists has revealed a time relation between crystallization and deformation. Crystallization of biotite is earlier than garnet because the former constitutes the S2 foliation and occurs as inclusion in garnet. Garnet precedes the formation of staurolite and has commonly a synkinematic core while staurolite is mostly later syn- to post-tectonic as evidenced by the parallelism of Si with Se of S2. In a few thin-sections, garnet with ‘S’-shaped Si trails is in contact with staurolite with straight Si trails (Fig. 5c). Kyanite as such appears earlier well within the biotite zone, but kyanite coexisting with staurolite shows textural feature indicating its crystallization later than staurolite, e.g. staurolite crystals are approximately aligned parallel to S2 foliation while kyanite occurs as idioblastic to subidioblastic crystals cutting across the foliation. Similarly, sillimanite post-dates staurolite as it occurs with muscovite pseudomorphs after staurolite. The time relation between kyanite and sillimanite is not clear in the area on account of the sporadic occurrence of kyanite. Nevertheless, from the evidence of fibrolitization of kyanite, as mentioned by Roy (Reference Roy1966), it is evident that sillimanite started crystallization later than kyanite. In the Kandra area, there is textural evidence of the close association of sillimanite with staurolite, and similarity of the mineral assemblages of staurolite–kyanite and sillimanite zones suggests the formation of sillimanite-bearing schists from pre-existing staurolite schists. The formation of garnet from chlorite–muscovite is not readily evident from the textural relation of the pelites of the garnet zone. However, retrogression of garnet to chlorite suggests that chlorite may have been involved. Similarly, partial retrogression of staurolite to chlorite and white mica probably indicates that staurolite may form by reactions involving chlorite and muscovite. It is also possible to reconcile that metamorphic reaction inferred to have been in progress by the comparison of the compatible mineral assemblages on either side of the isograd as shown in Figure 8e. As the reactions proceed, there is a gradual reduction and ultimate disappearance of one or more reactant minerals, compensated by the appearance and growth of product minerals. It is thus not surprising that textural evidence indicates that all the mineral assemblages of the higher-grade zones that have passed through low-grade zones mapped in space in the Kandra area correspond to the time sequence and can be reconciled with the metamorphic reactions inferred to have been in progress.
P–T pseudosections in relevant model systems have been constructed for different zones. The calculated isopleths in the above P–T pseudosections were corroborated with obtained probe data of different mineral phases from these representative rock samples. The pressure and temperature conditions are estimated by comparing the natural assemblages and metamorphic reactions derived for each isograd with experimentally determined analogous mineral reactions, and through various models of mineral equilibria. Metamorphic conditions have been estimated using an internally consistent winTWQ program and Perple_X software in the MnNCKFMASHTO model system. The combination of these approaches suggests the following temperatures (±50° C) and pressures (±0.5 kbar): 440 °C / 4.5 kbar for the biotite zone, 550 °C / 5.0 kbar for the garnet zone, 600 °C / 5.5 kbar for the staurolite zone and 675 °C / 6.5 kbar for the sillimanite zone.
For a characterization of the P–T regime during metamorphism, the garnetiferous lithologies are most suitable, since a set of reasonably well-calibrated geothermobarometers based on pressure-sensitive net-transfer reactions and Fe–Mg exchange equilibria are available. Application of thermobarometry is plagued by a number of important factors that contribute as sources of error, e.g. re-equilibrium during retrogression, quality of thermobarometric formulations, extrapolations, restraints and sensitivity of thermometers, analytical errors in microprobe data, effect of other components in solid solutions, effect of cation order/disorder, error analyses and blocking effect (Spear, Reference Spear1993). The temperatures calculated using the winTWQ program and pseudosection modelling compare well with those obtained from conventional thermobarometry (Figs 7, 8). The yielded differences are 0.3–0.9 kbar in pressure values for PMg and PFe, respectively. Such variation in absolute pressure values could be related to the uncertainties associated with thermochemical data in locating the end-member reactions.
7.b. Mechanisms for metamorphic zones
Due to the absence of top and bottom criteria, no relation has been established between the metamorphism and stratigraphic depth (Sarkar & Saha, Reference Sarkar and Saha1977; Bhattacharya & Sanyal, Reference Bhattacharya and Sanyal1988). So far as the relation with tectonic depth is concerned, the lower-grade rocks occupy shallower tectonic level towards the directions of axial plunge and in the flanks of the geoanticlinorium of Dunn (Reference Dunn1929) and Dunn & Dey (Reference Dunn and Dey1942), later termed Singhbhum anticlinorium by Sarkar & Saha (Reference Sarkar and Saha1962). The higher-grade rocks occur at deeper tectonic levels away from the plunge direction towards the region of axial culmination (Naha, Reference Naha1965; Matin et al. Reference Matin, Banerjee, Gupta and Banerjee2012). It is worth mentioning here that the transposition of planar fabric at hinge zones has been noticed in the study area near the bank of Sanjay river in Parbatipur (Fig. 3a). It is a significant signature of intense shearing. The general straight trend of the isograd in the NSMB may be correlated with very low plunge (Naha, Reference Naha1965; Ray & Gangopadhyay, Reference Ray and Gangopadhyay1971; Banerjee & Matin, Reference Banerjee and Matin2013).
Turner (Reference Turner1968) suggested that temperature corresponding to the amphibolite and granulite facies could not be maintained at levels above 50–80 km by burial alone. In accordance with Turner (Reference Turner1968), Kent (Reference Kent1991) and Mahato et al. (2008), the heat flow during regional metamorphism of the Kandra area might have been much higher than the ‘normal’ value of 10–15 °C km−1. James (Reference James1955) and Ray et al. (Reference Ray, Kumar, Reddy, Roy, Rao, Srinivasan and Rao2003) have calculated geothermal gradients based on the assumption that the metamorphic isograds are on the order of 100 °C apart and therefore indicate a gradient of 70 to 130 °C km−1. The higher the magnitude of the heat flow, the greater is the rise of temperature with increasing depth. According to Ray et al. (Reference Ray, Kumar, Reddy, Roy, Rao, Srinivasan and Rao2003) and Bucher & Grapes (Reference Bucher and Grapes2011), in many areas the geothermal gradient accounts for 60 °C km−1 within the uppermost few kilometres of depth. However, in other areas (Jones, Reference Jones1988; Drury, Reference Drury1991), e.g. the Hungarian basin, the geothermal gradient is c. 54 °C km−1 or as much as 100 °C km−1 (Dövényi et al. Reference Dövényi, Horváth, Liebe, Gálfi and Erki1983). Furthermore, there is broad localization in the form of elongate high-temperature zones along the axes of the Singhbhum metamorphic belt. There must be some mechanism for the localization of metamorphic heat. The direction of elongation of higher-temperature zones in the Singhbhum region is generally parallel to the fold axis of the geoanticlinorium, and thus anisotropic heat conduction could account for this pattern. Many geologists have attributed it to granite intrusion or migmatization (Brown, Reference Brown1994, Reference Brown2001a). The stabilization of M1 and M2 phases, low-temperature influx during M1, crustal loading during M2 and the tectonic framework of the study area are very much suggestive of a clockwise prograde P–T path (England & Thomson, Reference England and Thomson1984). Authors are of the opinion in the light of the above discussion that the granites and the migmatites might have been the ultimate products of high-grade metamorphism (M2 phase) rather than the cause of metamorphism as suggested by Brown (Reference Brown2001b) and, Brown & Sawyer (Reference Brown, Sawyer, Sawyer and Brown2008).
The development and evolution of the NSMB could be ideated best based on the ensialic orogenesis model (Fig. 13) (Kröner, Reference Kröner1979, Reference Kröner and Kröner1981) of mobile belts or fold belts progression. Other tectonic models accounted in the formation of mobile belts are the back-arc marginal basin (Bose & Chakraborti, Reference Bose and Chakraborti1981), intraplate subduction (Sarkar & Saha, Reference Sarkar and Saha1977) and micro-continental subduction models (Sarkar, Reference Sarkar1982). The concept of Enisialic orogeny abides by the non-uniformitarian process (Windley, Reference Windley1977) and stands eccentrically as a concept glided to Proterozoic plate tectonics. The connotation of initial rifting (initial phase of ensialic development) (Fig. 13a) and heat course from mantle upwelling sufficient for the M1 metamorphism leading to the materialization of greenschist facies at low pressure, prior to orogeny (Robinson et al. Reference Robinson, Reverdatto, Bevins, Polyansky and Sheplev1999). The development of M2 phase metamorphic facies could be envisioned by the lower crust heating and ductile shearing leading to delamination followed by gravitational instability of the subcrustal lithosphere which proffered sinking and subduction of the dense continental lithosphere (Fig. 13b). The field evidences for the required intense shearing responsible for the deformation D2 and M2 episode of metamorphism have been noticed in the form of dextrally rotated euhedral garnet porphyroblast (Fig. 4f) and transposition of planar fabric at hinge zones (Fig. 3a). In progression to this, the intracontinental orogeny entailing thrusting and nappe (Fig. 13c) tectonics, developed due to the action of differential stresses acting between the negatively buoyant inherent mantle lithosphere and less dense continental crust (Molnar & Gray, Reference Molnar and Gray1979), explains the D1 and D2 deformations and generation of M2 metamorphic facies. We hereby interpret the event of M2 metamorphism to be the main phase of metamorphism taking place post-D1 and during late to post-D2. The thermodynamic establishment of the M2 phase of metamorphism could be well understood by the presence of saturolite, kyanite and garnet porphyroblasts (amphibolite facies) in a way that post-orogenesis the increase in crustal thickness (pressure implication) led to an increase in the radioactive heating which was imbued with frictional heating, providing the vital pressure and temperature conditions for metamorphism to take place.
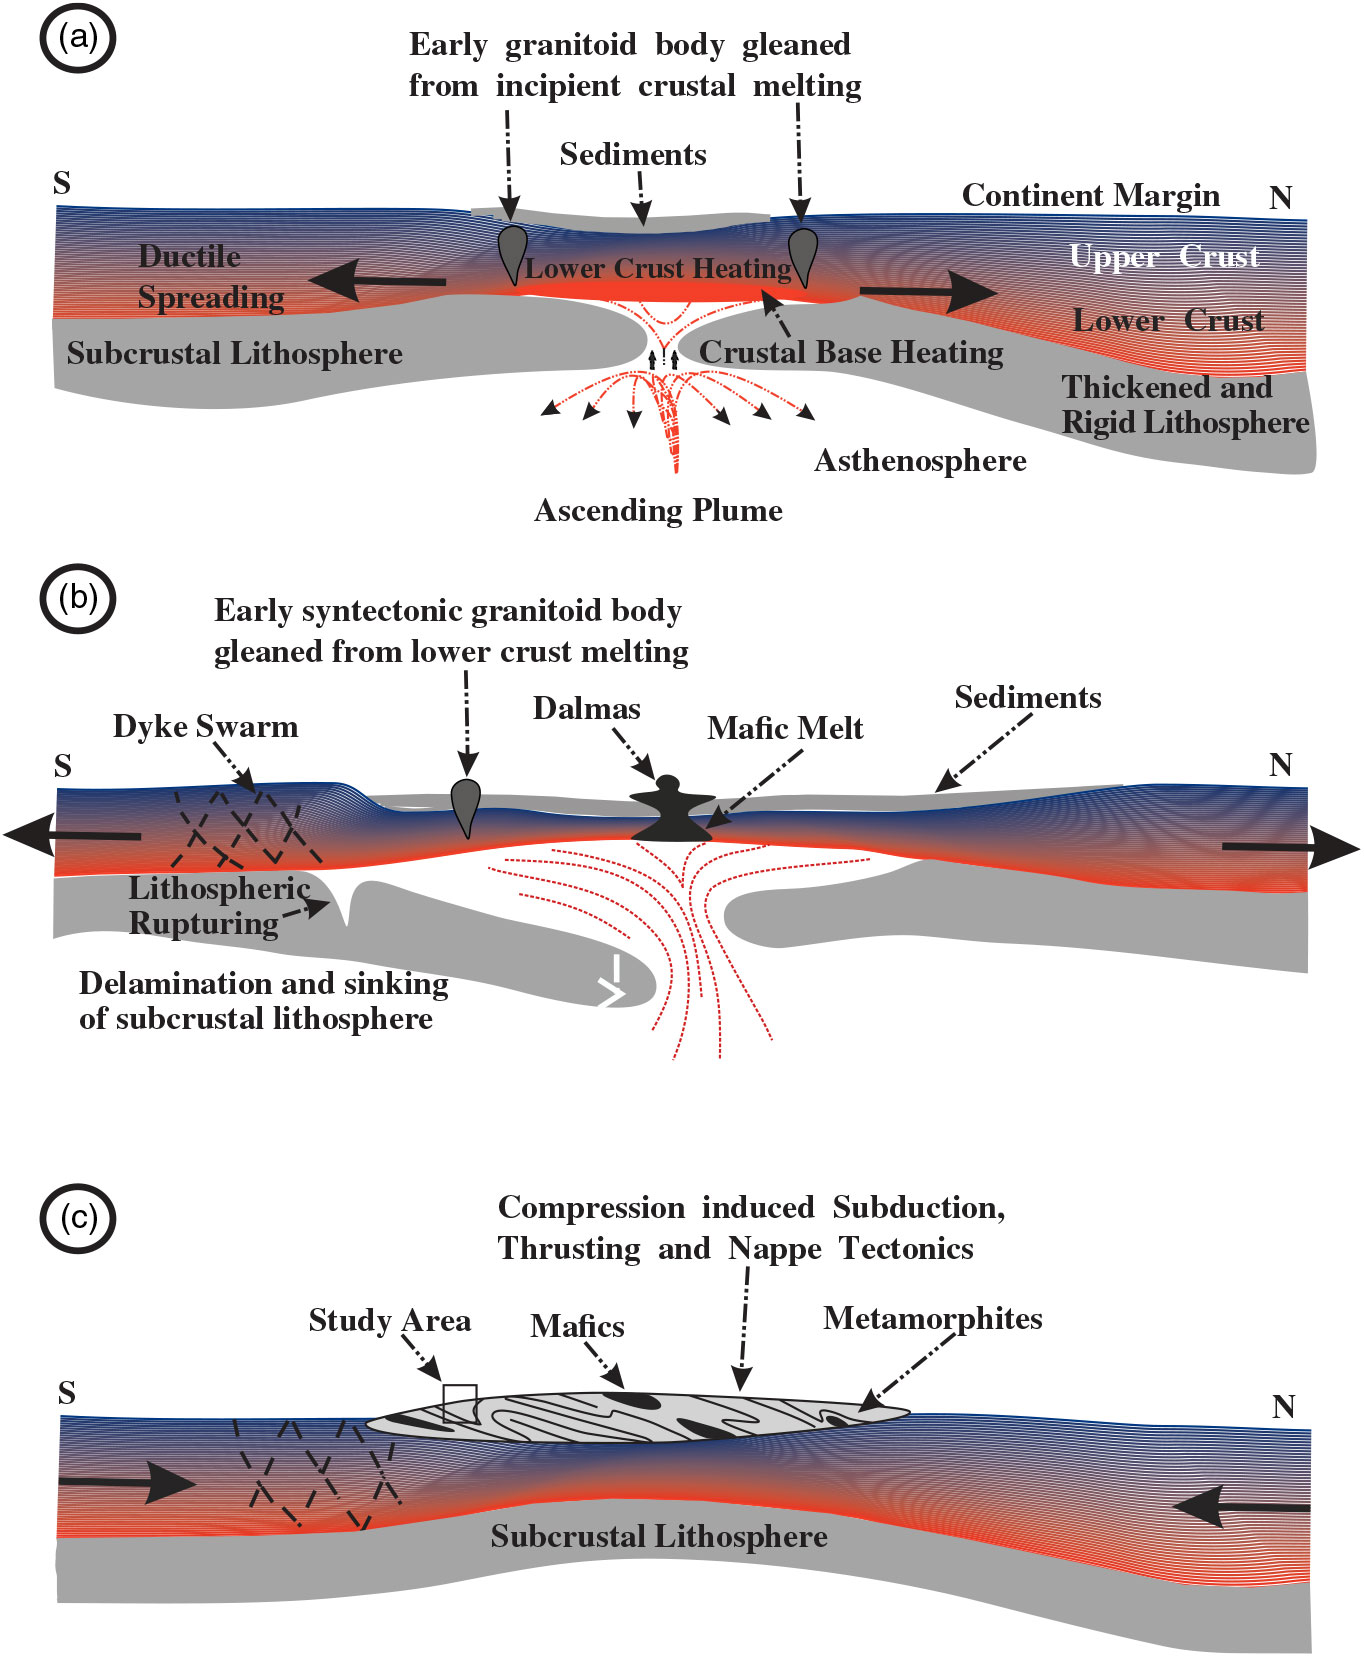
Fig. 13. Schematic representation of the tectonic evolution of the North Singhbhum Mobile Belt (NSMB) with delineation of the study area depicting ensialic origin (modified after Kröner, 1981).
8. Conclusions
The spatial distribution of the index minerals in the pelitic schists of the area shows Barrovian type of metamorphism. The different isograds delineated by the first appearance of index minerals are biotite, garnet, staurolite and sillimanite. The pressure and temperature conditions of metamorphism have been delineated by comparing the natural assemblages with the experimental data on the stability of minerals which indicate that metamorphism took place between >400 °C and 675 °C and at 4.5 to 6.5 kbar. In the study area, the gneisses are associated with biotite and garnet zones, therefore not spatially related to the high-grade sillimanite zone. Furthermore, it is considered by many petrologists that these gneisses are emplaced at a later time, during the waning phase of progressive metamorphism when the enveloping rocks were in a metamorphic condition corresponding to the lower greenschist facies, and thus no causal connection between gneisses and regional metamorphism exists since they are not synchronous in time. Thus, for the regional metamorphism in the study area, it may be necessary to assume an abnormally high rate of heat flow from the underlying basement extending to the mantle to provide heat for the metamorphism and the barrovian type of metamorphism differentiated in two phases, viz. M1 and M2, facilitated by the upwelling asthenosphere and crustal loading (post-orogeny) acting as the heat source for M1 and M2 phases respectively. Besides metamorphic events in the study area, two deformation events (D1 and D2) in association with the development of two tectonic fabrics (S2 and S3), where the M1 event dates pre-S2 and pre-D1 whereas M2 is syn-S3 and late to post-D2 could be well understood.
Acknowledgements
This work has been possible through DST-SERB research project (P-07/704) to D.P. and a JRF (CSIR) to D.K.P. We also thank Head, Department of Geology, Banaras Hindu University and the CAS programme of the UGC at BHU for providing necessary infrastructural facilities. Anonymous reviewers are thanked for constructive comments.


