


1. Introduction
Sedimentary rocks record complex processes, including tectonic activities, weathering, transportation, deposition, diagenesis and their interactions on the Earth’s surfaces (e.g. Suttner, Reference Suttner and Ross1974; Ingersoll et al. Reference Ingersoll, Bullard, Ford, Grimm, Pickle and Sares1984; Johnsson, Reference Johnsson, Johnsson and Basu1993). In order to understand these processes, the composition and textures of sedimentary rocks are widely studied. The provenance is accepted as the most determining control on the compositions of sedimentary rocks (Dickinson & Suczek, Reference Dickinson and Suczek1979; Johnsson, Reference Johnsson, Johnsson and Basu1993; Garzanti, Reference Garzanti2016), but the relationship between the provenance and textures is less discussed (Folk & Ward, Reference Folk and Ward1957; Boulton, Reference Boulton1978; Arens et al. Reference Arens, Van Boxel and Abuodha2002). Moreover, many publications have attempted to relate the textural characteristics of sedimentary rocks to their depositional settings (e.g. Passega, Reference Passega1957; Visher, Reference Visher1969; Pettijohn et al. Reference Pettijohn, Potter and Siever1972; Barndorff-Nielsen, Reference Barndorff-Nielsen1977; Folk, Reference Folk1980; Boggs & Boggs, Reference Boggs and Boggs2009). Different sandstone facies, especially the marine beach, dune and fluvial sandstones, have successfully been distinguished by their textural attributes (Folk & Ward, Reference Folk and Ward1957; Friedman, Reference Friedman1962, Reference Friedman1967). However, scepticism of textural analysis demonstrates that textural attributes should be restricted to the purpose of description (Solohub & Klovan, Reference Solohub and Klovan1970; Ehrlich & Full, Reference Ehrlich, Full and Size1987; Luplin & Hampson, Reference Luplin and Hampson2020). Moreover, one problem in the previous textural studies is that only two textural parameters are plotted together, such as grain size versus sorting (Folk & Ward, Reference Folk and Ward1957; Friedman, Reference Friedman1967), meaning that any multi-dimensional relationships cannot be interpreted. It is therefore intriguing to examine the relationship between textural features of fluvio-lacustrine sandstones and depositional environments under an n-dimensional space.
The textural analysis of upper Permian – lowermost Triassic fluvio-lacustrine Wutonggou low-order cycle (WTG-LC) sandstones in the Bogda Mountains of NW China provide a great opportunity to investigate the controlling factors on sandstone textures. High-resolution measured sections and the associated depositional environments of WTG-LC were documented (Yang et al. Reference Yang, Liu, Feng, Lin, Zhou and Wang2007, Reference Yang, Feng, Liu, Tabor, Miggins, Crowley, Lin and Thomas2010), and detailed provenance studies of WTG-LC sandstones were conducted (Zheng, Reference Zheng2019; Zheng & Yang, Reference Zheng and Yang2020). Additionally, principal component analysis (PCA) is a powerful tool in geological studies to reduce dimension and classify samples (Davis & Sampson, Reference Davis and Sampson1986). We therefore focus on the WTG-LC sandstones to document their textural characteristics, compare textural characteristics of different facies using traditional and principal component analysis, and investigate the controlling factors on sandstone textures.
2. Geological background
This study examines the upper Permian – lowermost Triassic fluvio-lacustrine sandstones of WTG-LC exposed in the northern and southern foothills of the Bogda Mountains (Fig. 1). Sandstones from four sections, including the Zhaobishan, North Tarlong, Taodonggou and Dalongkou sections, are the focus of this study (Fig. 2). The Bogda Mountains is a giant E–W-directed anticline with Devonian–Quaternary sedimentary and igneous rocks, located between the Junggar Basin to the north and Turpan-Hami Basin to the south in NW China. Before the Mesozoic uplift (Shao et al. Reference Shao, Stattegger and Garbe-Schoenberg2001; Greene et al. Reference Greene, Carroll, Wartes, Graham and Wooden2005), the Bogda Mountains was a part of the greater Turpan–Junggar basin, which was an intracontinental rift basin formed by regional dextral strike-slip (Shu et al. Reference Shu, Wang, Zhu, Guo, Charvet and Zhang2011) and included a series of grabens and half-grabens (Yang et al. Reference Yang, Feng, Liu, Tabor, Miggins, Crowley, Lin and Thomas2010). The Bogda Mountains is bordered by the Eastern North Tianshan Suture to the south, which is an amalgamated complex produced by the subduction of the North Tianshan Ocean and the collision between the Junggar Plate and the Central Tianshan Suture (Xiao et al. Reference Xiao, Zhang, Qin, Sun and Li2004; Charvet et al. Reference Charvet, Shu, Laurent-Charvet, Wang, Faure, Cluzel, Chen and De Jong2011). The felsic-intermediate volcanic and plutonic rocks of the Eastern North Tianshan Suture and sedimentary rocks of the local rift shoulders are interpreted as the main sources of the sandstones in WTG-LC (Guan, Reference Guan2011; Zheng, Reference Zheng2019; Zheng & Yang, Reference Zheng and Yang2020).

Fig. 1. Geological map of eastern Xinjiang, showing the locations of the Eastern North Tianshan Suture, Central Tianshan Suture, Bogda Mountains and measured sections. Modified from Xia et al. (Reference Xia, Xu, Xia, Li, Ma and Wang2004).
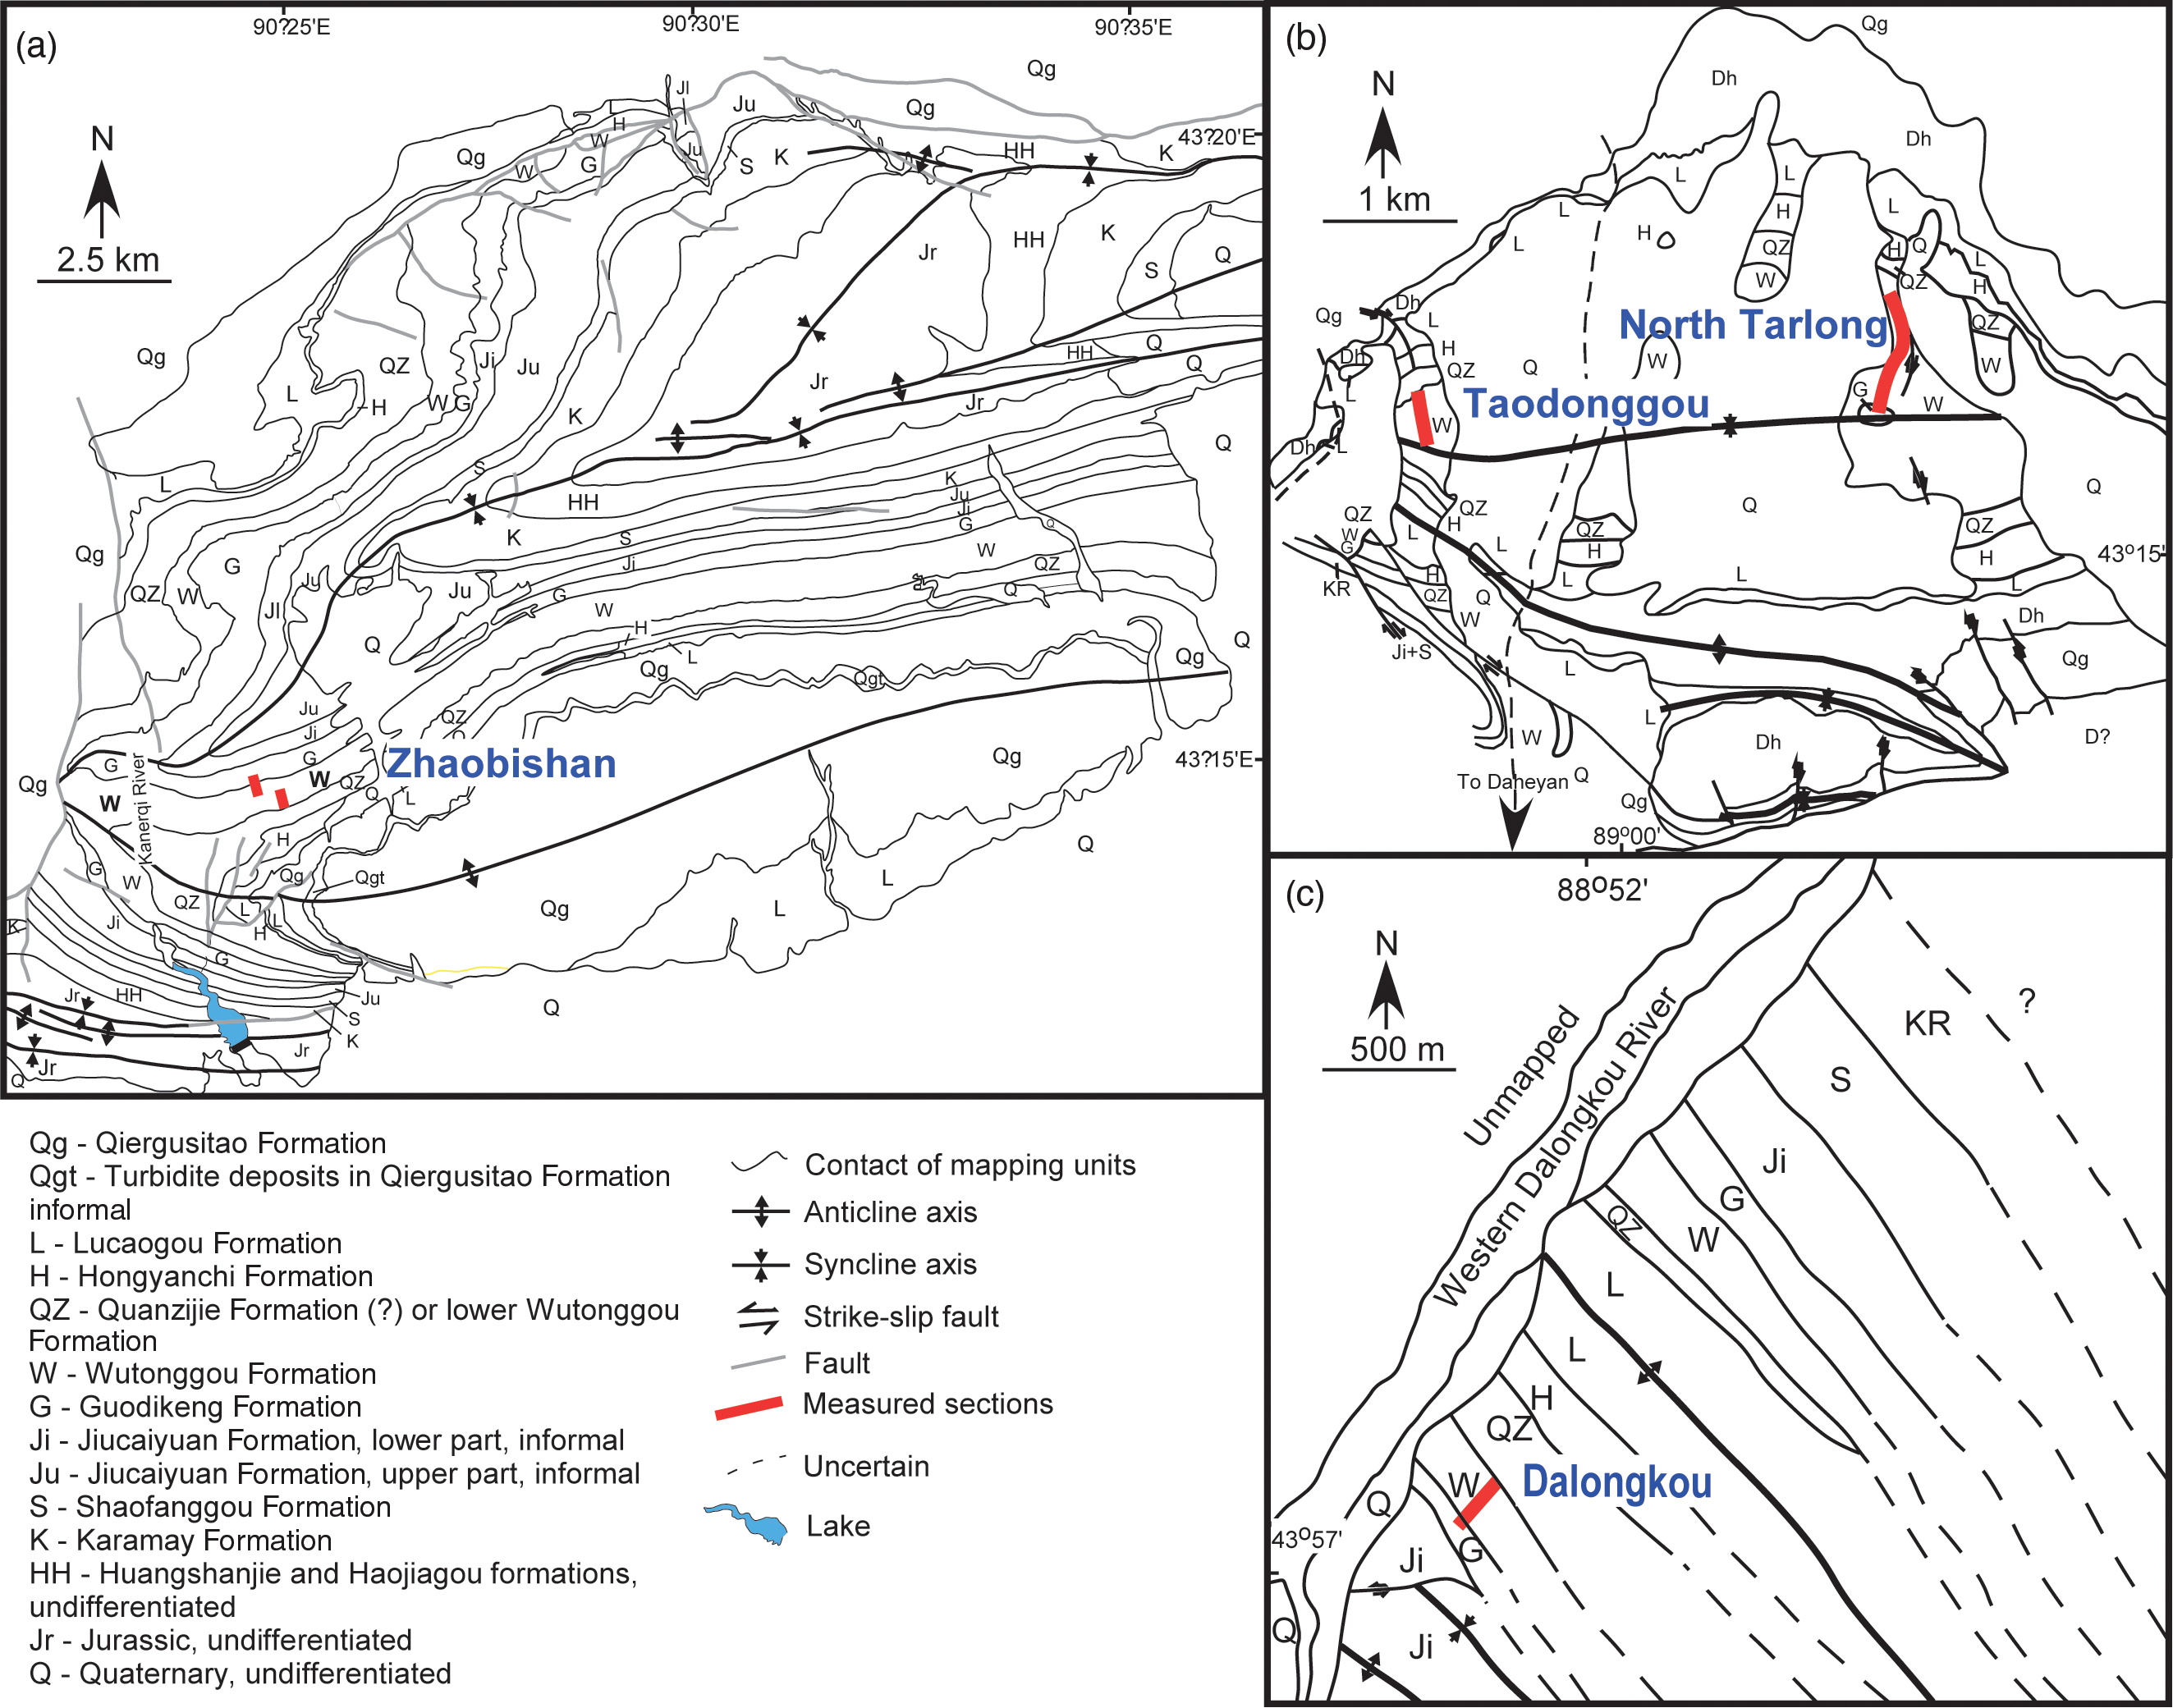
Fig. 2. Geological maps of (a) Zhaobishan, (b) North Tarlong-Taodonggou and (c) Dalongkou areas showing names and locations (red lines) of measured sections. Modified from Yang et al. (Reference Yang, Feng, Liu, Tabor, Miggins, Crowley, Lin and Thomas2010), Fredericks (Reference Fredericks2017) and Obrist-Farner & Yang (Reference Obrist-Farner and Yang2017).
The WTG-LC is an informal cyclostratigraphic unit that reflects an overall subhumid–humid climatic condition and a history of persistent uplifting of source regions (Yang et al. Reference Yang, Liu, Feng, Lin, Zhou and Wang2007, Reference Yang, Feng, Liu, Tabor, Miggins, Crowley, Lin and Thomas2010; Thomas et al. Reference Thomas, Tabor, Yang, Myers, Yang and Wang2011; Zheng & Yang, Reference Zheng and Yang2020). The WTG-LC correlates with the Wutonggou and Guodikeng formations (XBGMR, 1993; Fig. 3). This correlation is based on lithostratigraphy, biostratigraphy and cyclostratigraphy (Wartes et al. Reference Wartes, Carroll and Greene2002; Yang et al. Reference Yang, Liu, Feng, Lin, Zhou and Wang2007, Reference Yang, Feng, Liu, Tabor, Miggins, Crowley, Lin and Thomas2010). The chronostratigraphy in the Bogda Mountains is not well defined; the Permian–Triassic boundary is placed in a 90-m-thick interval in the North Tarlong Section (Yang et al. Reference Yang, Feng, Liu, Tabor, Miggins, Crowley, Lin and Thomas2010). Based on the stratigraphic and petrofacies correlation, the Dalongkou, North Tarlong-Taodonggou and Zhaobishan sections were deposited in different grabens or half-grabens with their own drainage areas and depocentres (Yang et al. Reference Yang, Feng, Liu, Tabor, Miggins, Crowley, Lin and Thomas2010; Zheng & Yang, Reference Zheng and Yang2020). During late Permian – Early Triassic time, the Dalongkou section mainly received felsic-intermediate volcanic rocks from the western Eastern North Tianshan Suture, and mudrocks and sandstones from the surrounding rift shoulders. The North Tarlong-Taodonggou sections received felsic-intermediate igneous rocks from the western Eastern North Tianshan Suture, and mudrocks and sandstones from the surrounding rift shoulders. The Zhaobishan section mainly received chert, quartzite and felsic-intermediate igneous rocks from the eastern Eastern North Tianshan Suture (Zheng & Yang, Reference Zheng and Yang2020).

Fig. 3. Chrono-, litho- and cyclostratigraphy of upper Carboniferous – Middle Triassic strata in the Bogda Mountains. Wavy lines are major unconformities, dashed lines disconformities and hatched areas missing strata. The studied Wutonggou low-order cycle is shown in the shaded box. Modified from Yang et al. (Reference Yang, Feng, Liu, Tabor, Miggins, Crowley, Lin and Thomas2010) and Obrist-Farner & Yang (Reference Obrist-Farner and Yang2015).
Fluvial, deltaic and littoral-lakeplain facies are categorized in the WTG-LC, which are interpreted based on the lithology, sedimentary texture and structures, palaeontological information, stratal geometry and boundary relationships (Fig. 4). The fluvial facies include braided stream and meandering stream subfacies. The braided stream facies is categorized by an upwards-fining succession of low-relief erosional base, channel-fill conglomerate and/or conglomeratic sandstones, and bar sandstones. The meandering stream environment is recognized by a high-relief erosional base, an upwards-fining succession of channel-fill conglomerate and/or conglomeratic sandstones, point bar sandstone and overbank mudrocks. The deltaic facies consist of the upwards-coarsening and thickening succession from prodeltaic shale and siltstone to delta front sandstone and/or conglomerate in the lower part, and distributary channel-fill and interdistributary deltaplain mudrock, sandstone, conglomerate and palaeosol in the upper part. The littoral-lakeplain facies is composed of the upwards-coarsening succession of sublittoral shale, littoral well-washed and laterally persistent sandstone and conglomerate in the lower part, and muddy to sandy palaeosol in the upper part.

Fig. 4. Lithological columns and field photographs showing the lithology, sedimentary structure and stratal successions of major environmental facies: (a) littoral-lakeplain facies showing a high-angle beach accretionary set; (b) deltaic facies showing coarsening-upwards successions from shale to sandstone; and (c) fluvial facies showing a fining-upwards succession from channel-fill conglomerate to cross-bedded bar sandstone. See text and Yang et al. (Reference Yang, Liu, Feng, Lin, Zhou and Wang2007, Reference Yang, Feng, Liu, Tabor, Miggins, Crowley, Lin and Thomas2010) for detailed descriptions.
3. Data and methodology
A total of 52 upper Permian – lowermost Triassic sandstones were collected from four sections in the northern and southern foothills of the Bogda Mountains that received sources from the Eastern North Tianshan Suture and rift shoulder sediments (Fig. 5; Zheng & Yang, Reference Zheng and Yang2020). The studied samples include four meandering stream point bar sandstones, seven braided stream bar sandstones, one braided stream channel sandstone, 15 delta front sandstones, and 25 littoral sandstones (Fig. 4). Sandstone samples were made into thin-sections to record their composition and textures by point counting. As matrix and cements are less than 1% of the total counting points in these sandstones, they were excluded from the following discussion. Additionally, 300 grains in each thin-section were counted with their grain type, size and roundness.

Fig. 5. Simplified lithological columns, showing section spatial relationships, sample numbers and locations.
3.a. Sandstone grain composition
Point counting via Gazzi-Dickinson’s method (Dickinson, Reference Dickinson1970) counts sand-sized mineral crystals (grain size > 0.063 mm; Φ < 4) within large lithic fragments as individual mineral grains to avoid the errors caused by grain-size effects (Ingersoll et al. Reference Ingersoll, Bullard, Ford, Grimm, Pickle and Sares1984). Quartz (Q), feldspar (F) and lithic grains (L) were identified. Quartz includes monocrystalline crystals, polycrystalline and microcrystalline quartz aggregates. Feldspar consists of plagioclase (P) and potassium feldspar (K). Lithic grains are subdivided as volcanic (Lv) and sedimentary lithic grains (Ls). The Lv grains include felsic, microlitic and lathwork subtypes based on their textures. Felsic grains are interpreted as being derived from felsic igneous rocks; microlitic grains are interpreted as being derived from intermediate igneous rocks; and lathwork grains are interpreted as being derived from mafic igneous rocks (Dickinson, Reference Dickinson1970; Marsaglia & Ingersoll, Reference Marsaglia and Ingersoll1992). The Ls grains consist of mudrock, and scarce siltstone and sandstone fragments (Fig. 6). Based on this classification, the percentages of quartz, feldspar and lithic grains were calculated, and 22 feldspathic sandstones and 30 lithic sandstones were classified according to Dott’s classification (Dott, Reference Dott1964; Fig. 7; recalculated percentages in Table 1 and raw data in online Supplementary Table S1, available at http://journals.cambridge.org/geo; more details in Zheng & Yang, Reference Zheng and Yang2020). Additionally, feldspathic sandstones consist of six fluvial feldspathic, four deltaic feldspathic and 12 littoral feldspathic sandstones; lithic sandstones include six fluvial lithic, 11 deltaic lithic and 13 littoral lithic sandstones (Fig. 7; Table 1).

Fig. 6. Photomicrographs of Wutonggou low-order cycle sandstones. (a) Medium-sized, well sorted sandstones. The red arrow indicates a sub-rounded, medium-sand-sized monocrystalline quartz grain, and the yellow arrow indicates a sub-angular polycrystalline quartz. S15-40, deltaic lithic sandstones, lower Zhaobishan section. (b) Angular, coarse-sand-sized feldspar grains with visible parallel cleavages. (c) Rounded, coarse-sand-sized volcanic lithic grain with lathwork textures. (d) The red arrow indicates a rounded, coarse-sand-sized volcanic lithic grain with felsic to microlitic texture; the yellow arrow indicates a sub-rounded, coarse-sand-sized volcanic lithic grain with microlitic texture. (e) The red arrow indicates a coarse-sand-sized sandstone lithic grain. (f) Granule-sized rounded mudstone lithic grain. Micrographs were acquired are under cross-polarized light. Scale bar is 1 mm.

Fig. 7. Ternary diagrams showing composition of quartz, feldspar and lithic fragments and classification of Wutonggou low-order cycle sandstones. Feldspathic sandstones have the feldspar/lithic ratio > 1; lithic sandstones have the feldspar/lithic ratio < 1. The ternary template is modified from Dott (Reference Dott1964). See text for abbreviations.
Table 1. Composition and textures of Wutonggou low-order cycle sandstones
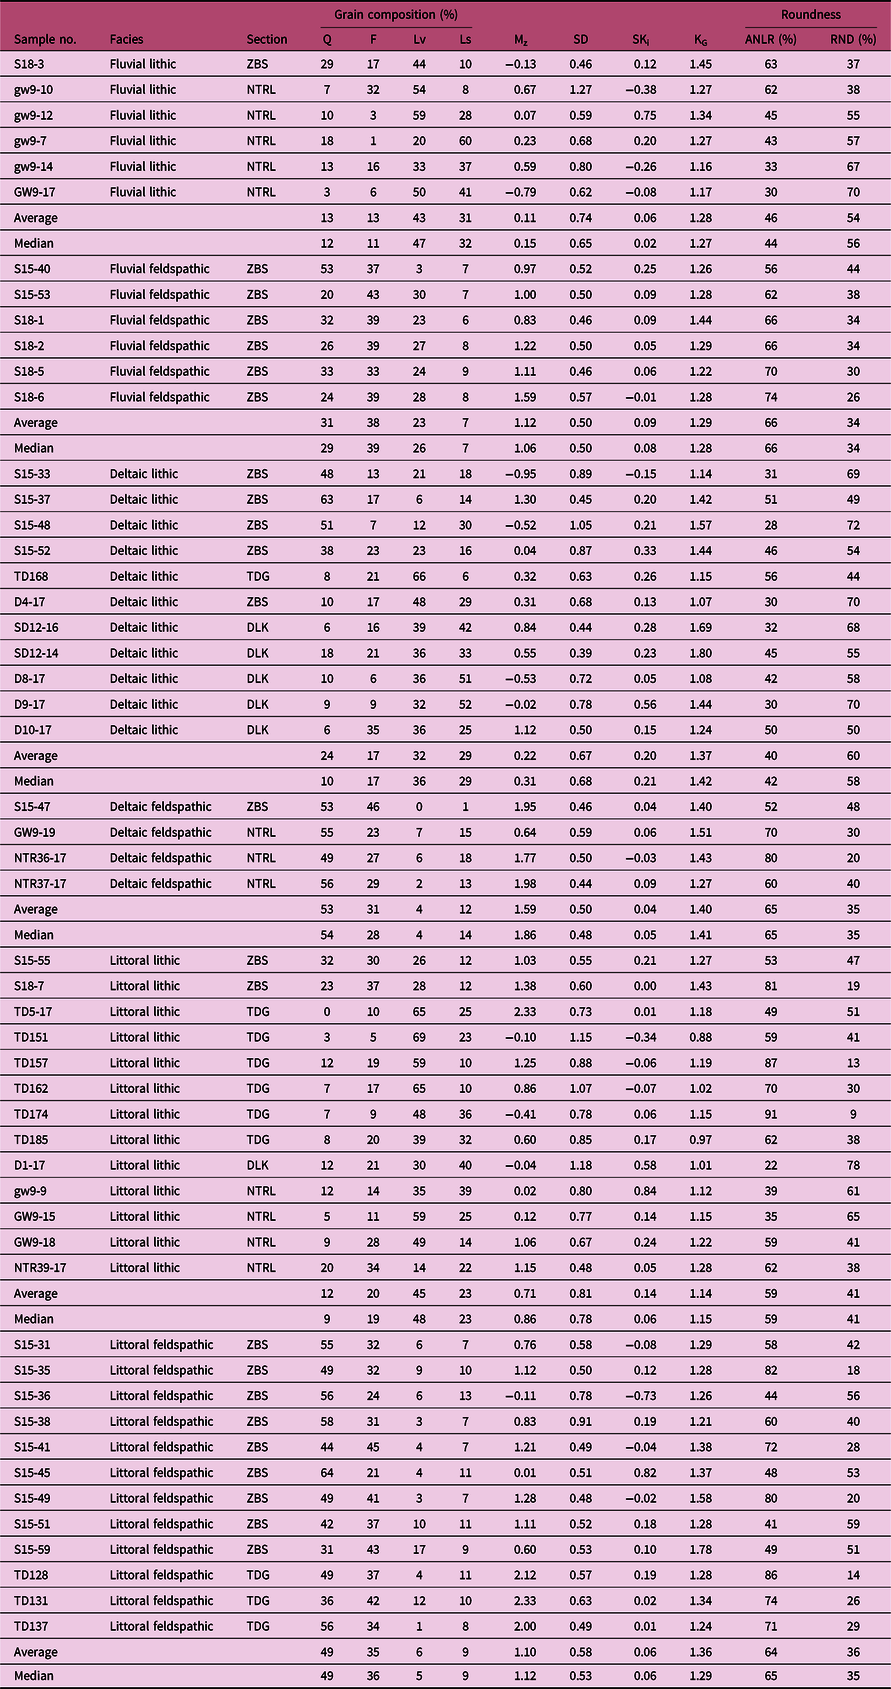
Q – quartz; F – feldspar; Lv – volcanic lithic; Ls – sedimentary lithic; Mz – graphic mean; SD – graphic standard deviation; SKi – graphic skewness; KG – graphic kurtosis; ANLR – angular grain; RND – rounded grain.
3.b. Sandstone grain texture
For each thin-section, 300 grains have been investigated with their textural features. To better record the textural characteristics of the studied sandstones, in point counting of sandstone textures we followed Suttner’s method (Suttner, Reference Suttner and Ross1974). Gazzi-Dickinson’s method counts sand-sized individual grains, whereas Suttner’s method counts phenocrysts as lithic fragments. We therefore investigate texture features of lithic fragments, excluding mineral crystals within the fragments. The grain-size statistical parameters, including the graphic mean (Mz), graphic standard deviation (SD), graphic skewness (SKi) and graphic kurtosis (KG), are calculated following formulae from Folk & Ward (Reference Folk and Ward1957). Verbal terms of the grain sizes, sorting, skewness and kurtosis are adapted from the Udden-Wentworth grain-size scale (Udden-Wentworth, Reference Wentworth1922) and verbal limits in Folk & Ward (Reference Folk and Ward1957; Table 2). The grain roundness is estimated using the visual chart of roundness in Krumbein & Sloss (Reference Krumbein and Sloss1951). In order to represent the degree of sandstone roundness, the percentages of angular (ANLR%) and rounded grains (RND%) have been calculated. Angular grains in this study include sub-angular and angular grains, and rounded grains consist of sub-rounded, rounded and well-rounded grains.
Table 2. Verbal limits of graphic mean, graphic standard deviation, skewness and kurtosis
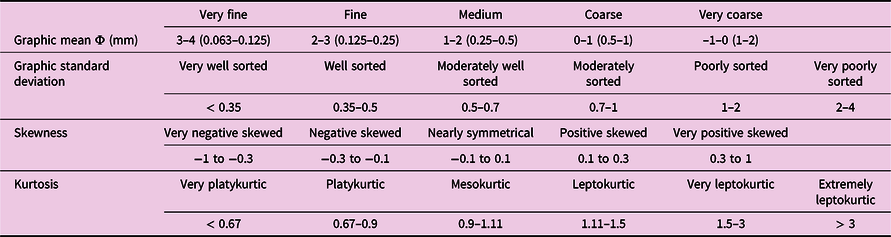
The verbal limit of grain size follows the Udden–Wentworth grain size scale (Udden–Wentworth, 1992); the verbal limits of sorting, skewness and kurtosis follow Folk & Ward (Reference Folk and Ward1957).
3.c. Principal component analysis
PCA is a multivariate analysis technique to investigate the hidden relationships among variables in a large dataset by dimension reduction and extraction of maximal information (Mardia et al. Reference Mardia, Kent and Bibly1979). PCA transforms the multiple related variables into a small number of unrelated variables, which can explain the maximum amount of variance of the dataset. These unrelated variables are called principal components (PCs) and are sorted in the descending order of their explainable variance.
Let a sandstone contain m types of textural and compositional features. If there are n sandstones in the study, these data can be recorded in an m × n matrix, X, expressed as:
 $$X = \left[ {\matrix{ {{x_{1,1}}} \;\cdots \;{{x_{1,n}}} \cr \!\!\vdots \quad\ddots \quad\vdots \cr {{x_{m,1}}} \;\cdots \;{{x_{m,n}}} \cr } } \right].$$
By multiplying matrix X with its transposition XT, the variance–covariance matrix can be obtained, which is expressed:
 $${\rm{X}}{{\rm{X}}^{\rm{T}}} = \left[ {\matrix{ {\sigma _{1,1}^2} \;{\sigma _{1,2}^2} \;\cdots \;{\sigma _{1,n}^2} \cr {\sigma _{2,1}^2} \;{\sigma _{2,2}^2} \;\cdots \;{\sigma _{2,n}^2} \cr \!\!\!\!\vdots \;\quad\vdots \quad\ddots \quad\vdots \cr {\sigma _{m,1}^2} \;{\sigma _{m,2}^2} \;\cdots \;{\sigma _{m,n}^2} \cr } } \right].$$
In the variance–covariance matrix, the numbers on the left diagonal (i.e. from top-left to bottom-right) are variances, and the other numbers are the covariances between two variables. PCA can be defined as finding a matrix Y that can make XXTY a diagonal matrix. The diagonal matrix is a matrix in which the entries outside of the left diagonal are all zero. By sorting the matrix Y in descending order of explainable variance, PCs are identified. These PCs can be expressed:
 $${\rm{P}}{{\rm{C}}_n} = {a_{1,n}}{x_1} + \;{a_{2,n}}{x_2} + \ldots + {a_{m,n}}{x_m}$$
where n is the component number, a the component loading, x the measured variable and m the total number of variables.
Before performing PCA, the data are standardized to remove the influences of fundamental units and to centre the dataset. Moreover, as PCA involves the variance–covariance matrix, the correlation coefficient, which is the division of the covariance by the roof of variance, can be calculated. The relationship between two variables can therefore be investigated.
4. Results
4.a. Textural characteristics of WTG-LC sandstones
A total of 52 WTG-LC sandstones are classified as fluvial, deltaic and littoral sandstone facies. Moreover, facies are further divided as lithic and feldspathic subfacies in terms of their composition (Tables 1, 3; online Supplementary Table S1). Accordingly, fluvial lithic sandstone, fluvial feldspathic sandstone, deltaic lithic sandstone, deltaic feldspathic sandstone, littoral lithic sandstone and littoral feldspathic sandstone are recognized. Textural characteristics, including graphic mean, graphic standard deviation, graphic skewness, kurtosis and degree of roundness are investigated for each subfacies (Figs 8, 9; Tables 1, 3). Comparisons are made following the order that the two subfacies from the same facies are compared first to investigate the influences of composition, then different facies but with similar composition are compared to explore the influences of depositional environments (Figs 8, 9; Tables 1, 3).
Table 3. Compositional and textural characteristics of the various sandstone facies

FL – fluival lithic; FF – fluvial feldspathic; DL – deltaic lithic; DF – deltaic feldspathic; LL – littoral lithic; LF – littoral feldspathic. See Table 1 or text for the rest of abbreviations.

Fig. 8. Group box plots of textural and compositional data of Wutonggou low-order cycle sandstones. (a) Group box plots of graphic mean (Mz), graphic standard deviation (SD), skewness (SKi) and kurtosis (KG). The three columns are fluvial, deltaic and littoral sandstone facies, where the left columns in each facies are the lithic subfacies and the right columns are the feldspathic subfacies. (b) Group box plots of angular grain content (ANLR%), rounded grain content (RND%), quartz content (Q%), feldspar content (F%), volcanic lithic content (Lv%) and sedimentary lithic content (Ls%). White squares are median values, and the white dashed lines are the average. See text for abbreviations.

Fig. 9. Ternary diagrams of sandstones, showing the differences in textures between the lithic and feldspathic sandstones, and the differences among the fluvial, deltaic and littoral sandstones. The three ends in the ternary diagrams are quartz, feldspar and lithic fragments (the end-members in Fig. 7); the borders divided the quartz arenite, feldspathic sandstone and lithic sandstones as the divisions in Figure 7. See text for abbreviations.
4.a.1. Fluvial lithic sandstones
Six fluvial lithic sandstones with quartz, feldspar, volcanic lithic and sedimentary lithic grains of 13%, 13%, 43% and 31%, respectively, are recognized. Overall, these sandstones are coarse-sized, moderately well to moderately sorted, nearly symmetrical skewed, leptokurtic and slightly rounded-grain dominant. The graphic mean ranges from 0.67Φ (0.63 mm) to −0.79Φ (1.73 mm), with an average of 0.11Φ (0.93 mm) and a median of 0.15Φ (0.90 mm). The graphic standard deviation varies from 0.46Φ to 1.27Φ, with an average of 0.74Φ and a median of 0.65Φ; the skewness varies from −0.38 to 0.75 with an average of 0.06 and a median of 0.02. The kurtosis ranges from 1.16 to 1.45 with an average of 1.28 and a median of 1.27. The sandstones contain 30–63% angular grains with an average of 45% and a median of 44%, and 37–70% rounded grains with an average of 54% and a median of 56% accordingly (Figs 8, 9; Table 3).
4.a.2. Fluvial feldspathic sandstones
Six fluvial feldspathic sandstones with quartz, feldspar, volcanic lithic and sedimentary lithic grains of 31%, 38%, 24% and 7%, respectively, have been recognized. These sandstones are overall coarse-sized, well sorted, nearly symmetrical skewed, leptokurtic and angular grain dominant. The graphic mean ranges from 1.59Φ (0.33 mm) to 0.83Φ (0.56 mm), with an average of 1.12Φ (0.46 mm) and a median of 1.06Φ (0.48 mm). The graphic standard deviation ranges from 0.46Φ to 0.57Φ, with an average of 0.50Φ and a median of 0.50Φ. The skewness varies from −0.01 to 0.25, with an average of 0.09 and a median of 0.08. The kurtosis ranges from 1.22 to 1.44, with an average of 1.29 and a median of 1.28. The sandstones contain 56–74% angular grains with an average of 66% and a median of 66%, and 26–44% rounded grains with an average of 34% and the median of 34%, accordingly (Figs 8, 9; Table 3).
4.a.3. Deltaic lithic sandstones
Eleven deltaic lithic sandstones with quartz, feldspar, volcanic lithic and sedimentary lithic grains of 23%, 17%, 32% and 28%, respectively, have been investigated. These sandstones are overall coarse-sized, moderately well sorted, positively skewed and leptokurtic, with dominant rounded grains. The graphic mean ranges from 1.30Φ (0.41 mm) to −0.95Φ (1.93 mm), with an average of 0.22Φ (0.86 mm) and a median of 0.31Φ (0.80 mm). The graphic standard deviation varies from 0.39Φ to 1.05Φ, with an average of 0.67Φ and a median of 0.68Φ. The skewness ranges from −0.15 to 0.56, with an average of 0.20 and a median of 0.21. The kurtosis ranges from 1.07 to 1.80, with an average of 1.37 and a median of 1.42. The sandstones contain 28–56% angular grains with an average of 40% and a median of 42%, and 44–72% rounded grains with an average of 60% and a median of 58% (Figs 8, 9; Table 3).
4.a.4. Deltaic feldspathic sandstones
Four deltaic feldspathic sandstones that consist of 53% quartz grains, 31% feldspar grains, 4% volcanic lithic grains and 12% sedimentary lithic grains have been examined. These sandstones are dominantly medium-sized, well sorted, nearly symmetrical skewed, leptokurtic, and angular-grained. The graphic mean varies from 1.98Φ (0.25 mm) to 0.64Φ (0.64 mm), with an average of 1.59Φ (0.33 mm) and a median of 1.86Φ (0.28 mm). The graphic standard deviation changes from 0.44Φ to 0.59Φ, with an average of 0.50Φ and a median of 0.48Φ. The skewness varies from −0.03 to 0.09 with an average of 0.04 and a median of 0.05; the kurtosis ranges from 1.27 to 1.51 with an average of 1.40 and a median of 1.41. The total grains consist of 52–80% angular grains with an average of 65% and a median of 65%, and 20–48% rounded grains with an average of 35% and a median of 35% (Figs 8, 9; Table 3).
4.a.5. Littoral lithic sandstones
A total of 13 littoral lithic sandstones that have 11% quartz grains, 18% feldspar grains, 48% volcanic lithic grains and 23% sedimentary lithic grains have been studied. These sandstones are overall coarse-sized, moderately sorted, nearly symmetrical to positively skewed, leptokurtic and angular grain dominant. The graphic mean varies from 2.33Φ (0.20 mm) to −0.41Φ (1.32 mm), with an average of 0.71Φ (0.61 mm) and a median of 0.86Φ (0.55 mm). The graphic standard deviation changes from 0.48Φ to 1.18Φ, with an average of 0.81Φ and a median of 0.78Φ. The skewness varies from −0.34 to 0.84, with an average of 0.14 and a median of 0.06. The kurtosis ranges from 0.88 to 1.43, with an average of 1.14 and a median of 1.15. The total grains consist of 22–91% angular grains with an average of 59% and a median of 59%, and 9–78% rounded grains with an average of 41% and a median of 41% (Figs 8, 9; Table 3).
4.a.6. Littoral feldspathic sandstones
A total of 12 littoral feldspathic sandstones that consist of 49% quartz grains, 35% feldspar grains, 6% volcanic lithic grains and 9% sedimentary lithic grains have been investigated. These sandstones are overall medium-sized, moderately well sorted, nearly symmetrical skewed, leptokurtic and angular grain dominant. The graphic mean varies from 2.33Φ (0.20 mm) to −0.11Φ (1.08 mm), with an average of 1.10 Φ (0.46 mm) and a median of 1.12Φ (0.46 mm). The graphic standard deviation changes from 0.48Φ to 0.91Φ, with an average of 0.58 and a median of 0.53. The skewness varies from −0.73 to 0.82, with an average of 0.06 and a median of 0.06. The kurtosis ranges from 1.21 to 1.78, with an average of 1.36 and a median of 1.29. The total grains consist of 44–86% angular grains with an average of 64% and a median of 65%, and 14–56% rounded grains with an average of 36% and a median of 35% (Figs 8, 9; Table 3).
4.b. Comparisons among fluvial, deltaic and littoral facies
Textural characteristics are compared between the lithic and feldspathic sandstones of fluvial, deltaic and littoral facies (Figs 8, 9; Table 3). In this comparison, the textural differences reflect the influences of grain compositions. Moreover, different sandstone facies with similar composition are compared to investigate the influences of depositional environments (Figs 8, 9; Table 3).
4.b.1. Lithic and feldspathic sandstones
In addition to the large differences in composition between the lithic and feldspathic sandstones, the textural characteristics, including the graphic mean, graphic standard deviation and roundness, show significant differences.
The fluvial lithic sandstones are mainly coarse-sized, moderately sorted and have less angular grains than rounded grains; in contrast, the fluvial feldspathic sandstones are mostly medium-sized, well sorted and consist of more angular grains than rounded grains. Similarly, the deltaic lithic and deltaic feldspathic sandstones are also significantly different in grain size, sorting degree and roundness. The deltaic lithic sandstones are coarse-sized, moderately sorted and have less angular grains than rounded grains; in contrast, the deltaic feldspathic sandstones are medium- to coarse-sized, well sorted and have more angular grains than rounded grains. Regarding the littoral sandstones, the littoral lithic sandstones are coarse-sized and moderately sorted; on the contrary, the littoral feldspathic sandstones are medium-sized and well sorted.
4.b.2. Fluvial, deltaic and littoral sandstones
In contrast to the large differences in textural characteristics between lithic and feldspathic sandstones, sandstones of similar composition but derived from different depositional environments display null or negligible differences.
The fluvial lithic, deltaic lithic and littoral lithic sandstones show slight differences in roundness, and negligible differences in grain size and sorting degree. The only difference among these sandstones is that both fluvial and deltaic lithic sandstones contain less angular grains than rounded grains, but the littoral lithic sandstones have more angular grains. For the other textural characteristics, such as grain size and sorting degree, these sandstones have no major differences and are coarse-grained and moderately to moderately well sorted. Similarly, the fluvial feldspathic, deltaic feldspathic and littoral feldspathic sandstones also have limited variations in textures; these sandstones are mainly medium-sized, well sorted and contain more angular grains than rounded grains.
4.c. PCA results
PCA is performed with the standardized textural and compositional dataset (online Supplementary Table S2, available at http://journals.cambridge.org/geo). The first three components are the PCs that can explain 75% of the total variance of the whole dataset (Table 4).
Table 4. Loadings of textural and compositional variables on PCs, explainable and cumulative explainable variance of PCs

The first principal component (PC1) accounts for 44% of the total variance. PC1 has a strong positive relationship with feldspar content, and moderate positive relationships with graphic mean and angular grain percentage (Table 4). Moreover, PC1 has moderate negative relationships with sedimentary lithic content, and rounded grain percentage. The second principal component (PC2) explains 20% of the total variance. PC2 has a strong positive relationship with kurtosis, a moderate positive relationship with rounded grain percentage, a strong negative relationship with volcanic lithic percentage, and a moderate negative relationship with angular grain percentage (Table 4). The third principal component (PC3) accounts for 11% of the total variance and has a relatively strong positive relation with skewness, and relatively strong negative relationships with graphic standard deviation and quartz content (Table 4).
In order to visualize the dataset on the new PCs coordinates, the dataset is plotted in two bivariate diagrams of PCs (Fig. 10). Fluvial lithic, fluvial feldspathic, deltaic lithic, deltaic feldspathic, littoral lithic and littoral feldspathic sandstones are labelled with different symbols in the bivariate plot. In these bivariate plots of PCs, sandstones are mainly divided into two groups along the horizontal axis. The fluvial, deltaic and littoral lithic sandstones are mainly placed in the left part of the plots, whereas the fluvial, deltaic and littoral feldspathic sandstones are mainly placed in the right part the plots. As the horizontal axis, namely PC1, is strongly related to feldspar and sedimentary lithic content, these two characteristics of sandstones are the best for grouping studied sandstones. On the contrary, fluvial, deltaic and littoral facies are not classified in these plots where different facies overlap without any clear divisions.

Fig. 10. Bivariate plots of (a) PC1 and PC2; and (b) PC1 and PC3. The projections of green lines along the axes of PCs indicate the relationship between this variable and the relevant PCs. The longer the projection, the stronger the relationship. The blue values are the correlation coefficients, and the black values are the data transformed under the new coordinates. See text for abbreviations.
Moreover, the textural and compositional characteristics of these sandstones are correlative, which is indicated by the matrix of correlation coefficients (Fig. 11). The feldspar content has strong positive relationships with graphic mean and angular grain content, and strong negative relationships with lithic content, rounded grain content and graphic standard deviation. These correlations indicate that sandstone with a high content of feldspar grains is likely fine-grained and well sorted, and with scarce rounded, sedimentary and volcanic lithic grains. Moreover, the sedimentary lithic content has a strong positive relationship with rounded grain content, and strong negative relationships with angular grains, quartz content and graphic mean. These relationships indicate a sedimentary lithic-enriched sandstone, which usually contains many rounded and coarse grains. In addition to the correlation between composition and textures, textural features are also intercorrelated. Graphic mean has a strong positive relationship with angular grain content, and strong negative relationships with rounded grain content and graphic standard deviation. These relationships suggest that fine-grained sandstone contains more angular grains than rounded grains, and is usually well sorted.
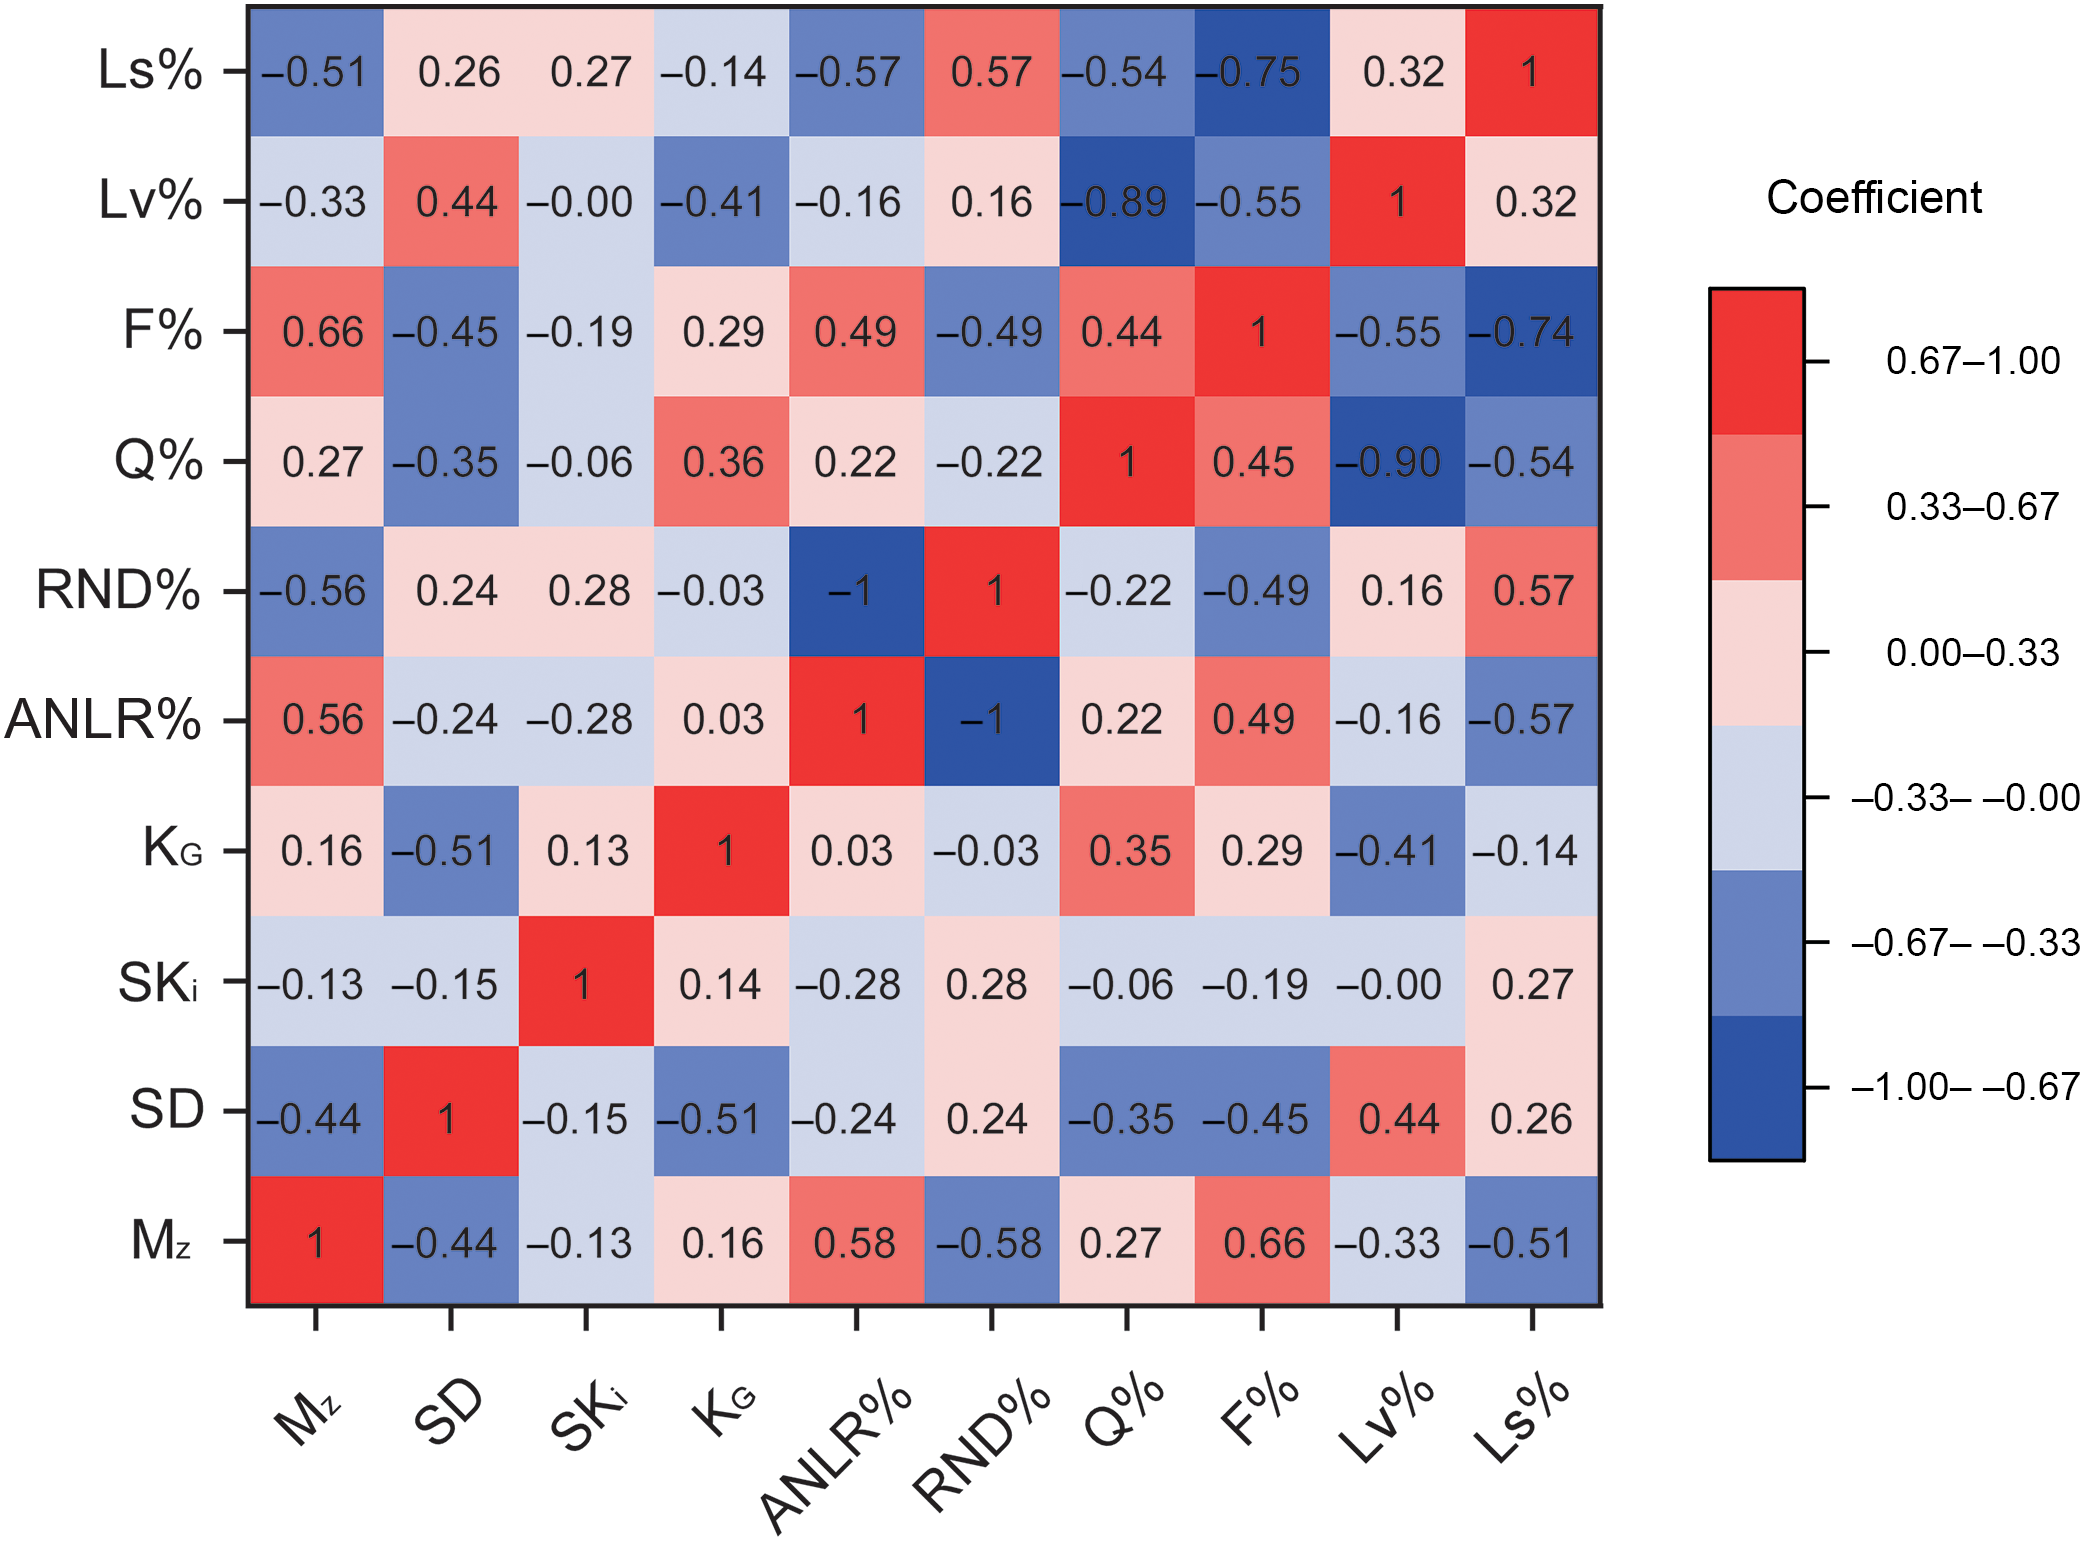
Fig. 11. Heat map of correlation coefficient of textural and compositional variables. The values on each grid are the coefficient between the two variables. Colour indicates the relationships; red represents a positive relationship and blue represents a negative relationship. Grids with darker colours indicate stronger relationships than the grids with lighter colours. See text for abbreviations.
5. Discussion
5.a. Provenance is the dominant control on sandstone textures
The large differences between the lithic and feldspathic sandstones suggest that provenance is the dominant controlling factor on texture. Sources of WTG-LC sandstones are interpreted from two major source regions with diverse source lithology. One source region is the Eastern North Tianshan Suture, which was covered with felsic-intermediate volcanic and plutonic rocks during late Permian – earliest Triassic time (Zheng, Reference Zheng2019; Zheng & Yang, Reference Zheng and Yang2020) and mainly supplied quartz, feldspar and volcanic lithic grains. The other source region is the local rift shoulders where old sedimentary rocks were exposed (Obrist-Farner & Yang, Reference Obrist-Farner and Yang2017; Zheng, Reference Zheng2019; Zheng & Yang, Reference Zheng and Yang2020) and provided a sedimentary lithic source. Feldspathic sandstones consist of large amounts of quartz and feldspar grains, of which the sources are mainly fine-sized euhedral or subhedral quartz and feldspar phenocrysts in volcanic and plutonic rocks. In addition to their original fine size and high angularity, feldspar grains tend to be broken along their cleavages to form new grains during transportation (Odom, Reference Odom1975; Morrone et al. Reference Morrone, Le Pera, De Rosa and Marsaglia2018). As a result, feldspathic sandstones are overall medium-sized and contain abundant angular grains. In contrast to the source of quartz and feldspar phenocrysts, lithic grains, either from volcanic rocks in the suture zone or from the reworking sedimentary rocks, are much coarser in grain size (Morrone et al. Reference Morrone, Le Pera, Marsaglia and De Rosa2020). Lithic sandstones are therefore coarser than feldspathic sandstones. Moreover, sedimentary rocks are labile and easily modified during transportation (Smith, Reference Smith1972; Czerewko & Cripps, Reference Czerewko and Cripps2001). The angles on these grains are eroded to form the rounded sedimentary lithic grains. As well as grain size and degree of roundness, provenance also controls the sorting degree of sandstones. Sorting degrees are related to the overall grain sizes; finer-grained rocks, such as shale, have a better sorting degree than coarser-grained rocks, such as conglomerate (Folk & Ward, Reference Folk and Ward1957). This relationship is also recognized in lithic and feldspathic WTG-LC sandstones. Feldspathic sandstones, which are finer-grained than lithic sandstones, are better sorted. Because provenance directly determines the grain sizes, the sorting degrees of sandstones are therefore indirectly controlled by provenance.
In contrast to provenance, the influence of depositional environments on sandstone textures is limited. Sandstones from different depositional settings show no distinct differences in textural characteristics. Moreover, the overlap of these sandstones in the PCA diagrams suggests that textural characteristics are incapable of classifying sandstones from different depositional settings. Although the oceanic beach sandstones are well differentiated from fluvial sandstones based on their good sorting degrees in published studies (e.g. Friedman, Reference Friedman1967), the good sorting degree is not unique for beach deposits; they are therefore not always well sorted (e.g. Solohub & Klovan, Reference Solohub and Klovan1970; Alsharhan & El-Sammak, Reference Alsharhan and El-Sammak2004; Anthony & Héquette, Reference Anthony and Héquette2007). Similarly, littoral lithic sandstones of WTG-LC are not well sorted, and are not even better sorted than fluvial and deltaic sandstones. As discussed above, provenance greatly determines sandstone textures. Consequently, littoral lithic sandstones are better sorted than littoral feldspathic sandstones, despite being collected from the same depositional environments. Moreover, compared with marine environments, the lacustrine littoral zones are greatly influenced by river inflow, wave and current actions, and barely influenced by tides (Rust, Reference Rust1982). Even the same lake in different localities or during various periods may receive different river flows with different intensities of waves. Moreover, as hummocky cross-stratifications are common in WTG-LC deposits (Yang et al. Reference Yang, Feng, Liu, Tabor, Miggins, Crowley, Lin and Thomas2010), storm waves might redistribute the sediments by the removal and acquisition of clastics. Considering the influences of provenance, and the great heterogeneity in lakes, sandstone textures are good descriptive features but can be rather unreliable when classifying depositional environments.
5.b. The advantage of PCA in sandstone studies
Although Folk & Ward (Reference Folk and Ward1957) mentioned the problem that only one or two variables of sandstone texture can be investigated simultaneously, the most common methods of analysing sandstone textures currently still use either multiple independent diagrams to describe the characteristics or bivariate plots of two textural features to make comparisons. Obviously, a sandstone bears information that is incapable of being described in any single univariate or bivariate diagram. A good alternative to these traditional methods is the dimension reduction method, such as PCA. This method is an unsupervised machine-learning technique that has been applied in geological studies for decades (e.g. Hughes & Chapman, Reference Hughes and Chapman1995; Pe-Piper et al. Reference Pe-Piper, Triantafyllidis and Piper2008). By transforming the coordinates of the raw dataset to find out the PCs that explain the highest variance, the important features can be extracted and the unnecessary information can be discarded. In this study, it is necessary to draw multiple ternary diagrams and box plots to distinguish these sandstones. However, only two PCA diagrams are required to group these sandstones: one group is quartz-, feldspar-, angular grain-enriched and well sorted; the other group is lithic grain- and rounded grain-enriched, and moderately to moderately well sorted. PCA might therefore be an excellent method for geologists to describe the rocks with limited efforts. Admittedly, PCA may also be incapable of correctly classifying samples in the case that the first few PCs cannot explain the majority of the variances of the dataset. This situation suggests that the samples either have no distinguishable pattern or require a more sensitive technique to classify them.
6. Conclusions
This study focuses on the textural characteristics of fluvio-lacustrine sandstones in the Bogda Mountains of NW China. Fluvial lithic, fluvial feldspathic, deltaic lithic, deltaic feldspathic, littoral lithic and littoral feldspathic sandstones are classified based on compositions and depositional environments.
The lithic and feldspathic sandstones from fluvial, deltaic and littoral environments are compared. It was found that the textural characteristics of lithic and feldspathic sandstones deriving from the same environment mainly differ in graphic mean, graphic standard deviation and roundness. On the contrary, sandstones from different depositional environments but with similar compositions have limited differences in textural characteristics. Moreover, three principal components (PCs) are recognized to explain 75% of the total variance of the dataset. PC1 can explain 44% of the total variance and is strongly related to the feldspar content. In the bivariate plots of PCs, WTG-LC sandstones can be classified based on their composition; that is, lithic and feldspathic sandstones are placed in different fields of the plots along the axis of PC1. However, sandstones from different depositional settings overlap and show no clear division. Moreover, textural and compositional characteristics are inter-correlated according to their correlation coefficients. Feldspar content is strongly related to graphic mean and angular grain content, and sedimentary lithic content is strongly related to rounded grain content.
The results of this study indicate that provenance, including the source lithology, original source size and mineralogy, is the most significant controlling factor for sandstone texture; in contrast, the influence of depositional environment on sandstone textures is limited. As well as highlighting the advantage of using PCA in sandstone studies, our study provides a detailed textural analysis of fluvio-lacustrine sandstones with complex provenance, and improves our understanding of the influences of provenance and depositional environment on sandstone textures.
Acknowledgements
We thank Dr Wan Yang of Missouri University of Science and Technology for his field assistance and discussions of the early draft, and Dr Obrist-Farner for his assistance with the petrographic study. We thank Dr Mingli Wan and Mr Shengwu Mei of Nanjing Institute of Geology and Paleontology of Chinese Academy of Sciences for their field assistance. We thank the associate editor Dr Stephen Hubbard, Dr Consuele Morrone and an anonymous reviewer for their constructive comments that greatly improved this manuscript. This research was partially supported by a contribution from the Alfred Spreng Graduate Research Grant from Geology and Geophysics Program of Missouri University of Science and Technology, National Science Foundation (grant no. IES-1714749) and National Natural Science Foundation of China (grant no. 42050104).
Declaration of interest
None.
Supplementary material
To view supplementary material for this article, please visit https://doi.org/10.1017/S0016756821000418


