1. Introduction
The aim of this paper is to introduce a new method for increasing the utility of spatially diverse, but incomplete, well data in investigating subsidence and its spatial variability on rifted continental margins. We use the much-studied Iberia–Newfoundland conjugate margins of the Atlantic to illustrate our approach.
Subsidence in sedimentary basins, recorded by the stratigraphy of the basin fill, is primary evidence for deducing the tectonic processes by which continents rift. This has been quantified using well data since pioneering studies at continental margins (e.g. Steckler & Watts, Reference Steckler and Watts1978) and in intracontinental settings (Barton & Wood, Reference Barton and Wood1984). However, many studies that use boreholes to calculate subsidence histories focus on those few wells that have the appropriate combination of stratigraphic thicknesses, compaction criteria, depositional ages, palaeobathymetry, known eustatic sea-level signals and denudation histories across unconformities, or instead rely upon the creation of synthetic wells.
Building subsidence records from only a few wells risks the introduction of significant sample bias if the studied wells are not representative of the variability in depositional/subsidence history of the study area. This type of bias can sometimes be mitigated by backstripping two-dimensional (2D) geological interpretations on cross-sections (e.g. Steckler et al. Reference Steckler, Mountain, Miller and Christie-Blick1999) or even 3D volumes using well-calibrated seismic data (e.g. Hansen et al. Reference Hansen, Scheck-Wenderoth, Hübscher, Lykke-Andersen, Dehghani, Hell and Gajewski2007). However, 1D well data and the subsidence they record are still commonly used in frontier areas where seismic data are of insufficient quality for 2D or 3D analysis. Recent studies have focused on those wells that conform to the high standards of high-quality stratigraphic data, or on a few ‘pseudo-wells’ built from sparse seismic profiles (e.g. Alves & Cunha, Reference Alves and Cunha2018). Those wells that do not conform to these standards are neglected. The effect is to restrict spatial resolution for subsidence studies, which risks obscuring lateral variations in subsidence rate and timing along rifted continental margins.
Restricting analysis of a problem to a specific type or quality of data while ignoring those data types that do not meet these restrictions is a documented form of interpretation bias, termed MacNamara’s Fallacy (e.g. O’Mahony, 2017). Interpreting the tectonic history of rifted margins using only a small part of the available well records risks the introduction of quantification bias. Our aim is therefore to develop an approach for using non-ideal well data, along with those of higher quality, to increase spatial resolution and to avoid MacNamara’s Fallacy.
An interpretation of the history of the Iberia–Newfoundland conjugate margin using a much broader array of available real well data to minimize the effects of qualitative bias has not previously been undertaken. Prior studies have examined the tectonic subsidence histories of isolated basins within the proximal domain (e.g. Maldonado et al. Reference Maldonado, Somoza and Pallarés1999), forward-modelled the effects of tectonic subsidence on the margin from conjugate deep seismic profiles (Mohn et al. Reference Mohn, Karner, Manatschal, Johnson, Gibson, Roure and Manatschal2015), and looked at tectonic subsidence across the margin as a whole using idealized, stratigraphic columns for the calculation of subsidence (Hiscott & Wilson, Reference Hiscott and Wilson1990) or through the use of synthetic pseudo-wells (e.g. Alves & Cunha, Reference Alves and Cunha2018).
Key features of the development of the Iberia–Newfoundland margin, such as the role of crustal thinning or ‘necking’ (Keen & de Voogt, Reference Keen and de Voogd1988; Lavier & Manatschal, Reference Lavier and Manatschal2006; Doré & Lundin, Reference Doré and Lundin2015), remain contentious (as they do with other continental margins). Although much work has been done on addressing issues such as these through forward-modelling techniques, for example, to estimate the nature of crustal thinning during pre-break-up rifting (e.g. Brune et al. Reference Brune, Williams, Butterworth and Müller2016), less attention has been paid to the constraints of these models, especially regarding variability along and across the margin conjugates.
Furthermore, while passive continental margins are composed of a number of different domains, including proximal, necking, distal and others (Peron-Pinvidic et al. Reference Peron-Pinvidic, Manatschal and Osmundsen2013; Sutra et al. Reference Sutra, Manatschal, Mohn and Unternehr2013), known to deform in different styles at different times during the development of the margin (Mohn et al. Reference Mohn, Karner, Manatschal, Johnson, Gibson, Roure and Manatschal2015), the date at which rifting occurred across the margin as a whole is still a contested point. In the case of the Iberia–Newfoundland conjugate margin, published work suggests that rifting across all domains of the margin occurred in four distinct episodes (Alves et al. Reference Alves, Gawthorpe, Hunt and Monteiro2002; Matias et al. Reference Matias, Kress, Terrinha, Mohriak, Menezes, Matias, Santos and Sandnes2011; R Sousa Lemos Pereira, PhD thesis, University of Cardiff, 2013; D Soares, PhD thesis, University of Cardiff, 2014). However, there is no consensus on when these four periods occur, with different authors providing different interpretations and active rifting periods that significantly overlap each other. Published modelling studies (Manatschal et al. Reference Manatschal, Müntener, Lavier, Minshull, Péron-Pinvidic, Karner, Manatschal and Pinheiro2007; Biari et al. Reference Biari, Klingelhoefer, Sahabi, Funck, Benabdellouahed, Schnabel, Reichert, Gutscher, Bronner and Austin2017; Brune et al. Reference Brune, Heine, Clift and Pérez-Gussinyé2017) generally adopt two active rifting phases: the first during Late Triassic – Early Jurassic time, typified by slow rates of thinning and depth-independent, symmetrical rifting; and a second during Late Jurassic – Early Cretaceous time, where stretching speeds up dramatically with rifting becoming depth-dependent and asymmetric. Regarding continental break-up, Pinheiro et al. (Reference Pinheiro, Wilson, Reis, Whitmarsh, Ribeiro, Whitmarsh, Sawyer, Klaus and Masson1996) and Alves et al. (Reference Alves, Moita, Sandnes, Cunha, Monteiro and Pinheiro2006, Reference Alves, Moita, Cunha, Ullnaess, Myklebust, Monteiro and Manuppella2009) show that break-up in the central North Atlantic margin occurs diachronously from south to north. However, the timing of continental break-up is also contested, ranging from c. 132.9 Ma (early Hauterivian) to c. 113 Ma (early Albian) (Bronner et al. Reference Bronner, Sauter, Manatschal, Péron-Pinvidic and Munschy2011; Vissers & Meijer, Reference Vissers and Meijer2012; Eddy et al. Reference Eddy, Jagoutz and Ibañez-Mejia2017; Nirrengarten et al. Reference Nirrengarten, Manatschal, Tugend, Kusznir and Sauter2018).
In view of these discrepancies, we consider that additional methods of constraining the style, timing and magnitude of subsidence within individual domains may lead to a better model of overall margin development. The presence of hydrocarbon systems within the proximal domain of both sides of the Iberia–Newfoundland margin has resulted in numerous exploration wells being drilled. This provides the possibility of comparing the tectonic subsidence trends both spatially and temporally in the proximal domain. Accordingly, we pool sediment accumulation records from 56 wells across the entire proximal domain of the Iberia–Newfoundland conjugate margin; we produce bulk-averaged subsidence curves that describe the nature of rifting within the domain as a whole and infer the nature of rifting across all domains of the margin, that is, break-up age or rifting symmetry. This allows a generalized interpretation of subsidence patterns related to continental break-up at the Iberia–Newfoundland margin, derived from real wellbore data, for the first time.
2. Method
Input data for the present study were derived from publicly accessible sources (borehole data; Canada-Newfoundland Offshore Petroleum Board, 2017) and from published literature on the Newfoundland (Driscoll & Hogg, Reference Driscoll, Hogg and Lambiase1995; Fensome et al. Reference Fensome, Crux, Gard, MacRae, Williams, Thomas, Fiorini and Wach2008) and Iberian margins (Maldonado et al. Reference Maldonado, Somoza and Pallarés1999; J Kullberg, PhD thesis, University of Lisbon, 2000; Alves et al. Reference Alves, Gawthorpe, Hunt and Monteiro2002, Reference Alves, Gawthorpe, Hunt and Monteiro2003, Reference Alves, Moita, Sandnes, Cunha, Monteiro and Pinheiro2006; Lopez & Proença Cunha, Reference Lopez and Proença Cunha2004; Matias et al. Reference Matias, Kress, Terrinha, Mohriak, Menezes, Matias, Santos and Sandnes2011; R Sousa Lemos Pereira, PhD thesis, University of Cardiff, 2013; D Soares, PhD thesis, University of Cardiff, 2014; J Casacão, unpub. MSc thesis, University of Lisbon, 2015). All wells available in the Iberian margin literature were utilized (22); only a subset of the available wells from the Newfoundland side of the margin were utilized (33), selected to give as even a data spread as possible across the margin. Locations of all the wells used are shown in Figure 1.

Fig. 1. Plate reconstruction of Iberia–Newfoundland at chron M0 (125 Ma, early Aptian) from Sibuet & Tucholke (Reference Sibuet, Tucholke, Mohriak, Danforth, Post, Brown, Tari, Nemčok and Sinha2012) and Srivastava et al. (Reference Srivastava, Sibuet, Cande, Roest and Reid2000). Locations of all wells used in the study are shown as black dots. The green lines display the arbitrary blocks used in this work for curve averaging. The grey box indicates the Newfoundland–Gibraltar Fracture Zone.
The use of wells drilled for hydrocarbon exploration presents the difficulty that they are often in suboptimal locations for calculation of tectonic subsidence, such as on high standing blocks or next to salt diapers. Although every single chronostratigraphic unit was not present in every well, a complete picture of the sedimentary deposition across a block was calculated by utilizing the averaging process as described in Section 2.c to account for missing stratigraphy. Around ten wells were used per block, with at least one well per block penetrating to basement. This gave a good average of unit thicknesses across the varying structures present in the block. Figures 2 and 3 show cross-sections of stratigraphy from each block grouped by geological period; detailed stratigraphic columns of the lithologies encountered during these periods on either side of the margin can be found in Alves & Cunha (Reference Alves and Cunha2018). Two wells are highlighted for each block (three for southern Iberia) that show different thicknesses of units from each geological period. No wells were utilized in this work that were located above or adjacent to diapirs.

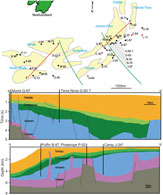
Fig. 2. Map of present-day Newfoundland with present-day depocentres displayed and labelled, and with all wells used in the study shown (wells penetrating to basement are shown in red). The green lines display the blocks used in this work for curve averaging. Section a–a’ is adapted from DeSilva (Reference DeSilva, Fleet and Boldy1999) and Section b–b’ is adapted from A Fagan, unpub. MSc thesis, University of Newfoundland (2010). For key to units in cross–sections, see Figure 3. Well Carey J-34 is offset from the cross-section, but sits in an equivalent structural location.

Fig. 3. Map of present-day Iberia with present-day depocentres displayed and labelled, and with all wells used in the study shown (wells penetrating to basement are shown in red). The green lines display the arbitrary blocks used in this work for curve averaging. Section c–c’ is adapted from Alves et al. (Reference Alves, Moita, Sandnes, Cunha, Monteiro and Pinheiro2006), Section d–d’ is adapted from Pimentel & Pena dos Reis (Reference Pimentel and Pena dos Reis2016) and Section e–e’ is adapted from Rasmussen et al. (Reference Rasmussen, Lomholt, Andersen and Vejbæk1998).
2.a. Curve generation
The software used for modelling tectonic subsidence was Backstrip v4.3, a free-to-use application for Mac OSX created by Nestor Cardozo (Cardozo, Reference Cardozo2016). The program uses Airy isostasy with exponential porosity reduction in either a water- or air-loaded setting to calculate tectonic subsidence by backstripping input layers sequentially. Due to the depositional environment of the continental margin, the water-loaded functionality was adopted. The program supports backstripping of only one sedimentary column at a time, so was run individually per well with parameters specific to each.
Variable input parameters necessary to run the model include top and base depths and ages, grain densities, porosity coefficients and surface porosities for each of the units. Lithologies used were either derived from stratigraphic columns of the individual wells, or from a stratigraphic column of the basin if only unit names were available from the well data. Parameters used for each lithology can be found in Figure 4a–c; the values used are not specific to the study area but are standard values for the lithologies present (e.g. McWhorter & Sunada, Reference McWhorter and Sunada1977; Carmichael, Reference Carmichael1982; Hantschel & Kauerauf, Reference Hantschel and Kauerauf2009; Allen & Allen, Reference Allen and Allen2013). The same lithology parameters were applied to units on either side of the margin. In the case of a unit that was composed of multiple lithologies, for example, interbedded shales and sands, fractions of each lithology present were used and summed together. Densities of 1000 kg m–3 for water and 3300 kg m–3 for the mantle were used consistently for modelling subsidence at all locations.

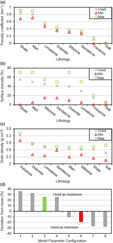
Fig. 4. Input parameters of each lithology used (the lithology labelled ‘salt’ represents all evaporites) in the model, along with maximum and minimum values that have been used to calculate the error of the model: (a) porosity coefficient (C); (b) surface porosity (Φ); (c) grain density (ρ); and (d) output variations of running the model under all possible input parameter configurations and the configurations used. 1, minimum ρ, minimum C and maximum Φ; 2, minimum ρ, maximum C and maximum Φ; 3, minimum ρ, minimum C and minimum Φ; 4, minimum ρ, maximum C and minimum Φ; 5, maximum ρ, minimum C and maximum Φ; 6, maximum ρ, maximum C and maximum Φ; 7, maximum ρ, minimum C and minimum Φ; 8, maximum ρ, maximum C and minimum Φ.
While data for the exact ages of each unit of an individual well were present for some Iberian wells, most unit ages were derived from chronostratigraphic data from each basin being compared with the International Commission on Stratigraphy chart (Cohen et al. Reference Cohen, Finney, Gibbard and Fan2013). If unit ages are given as a geological stage from the chronostratigraphic chart, it was assumed that the unit basal age is the beginning of that stage and the unit top age is the end of the stage, unless: (1) another unit is also present during the same time period; (2) the unit was either bound or split by an unconformity; or (3) only part of a lithologically differentiated unit was present. In any of these three cases, assumptions on age were made that would best represent the well data present. Where data from an individual well contradicted that of the basin-wide stratigraphic column, an interpretation was used that would respect the well data.
The backstripping method has the capability of taking sea-level fluctuations into account for calculations of tectonic subsidence, although this was not used due to insufficient or inaccurate data relating to depositional depths of many of the units across the margin. Furthermore, no attempt was made to correct for eroded strata, potentially indicated by unconformities. Accordingly, the computed subsidence curves do not display any periods of basement uplift. However, quantifying uplift or calculating exact numerical values of subsidence was not within the main objectives of the work, which is focused on a comparison of subsidence trends throughout the proximal domain of the conjugate margin.
2.b. Errors
There are two main sources of error present in computing the bulk-averaged subsidence curves: errors in the ages used for the tops and bottoms of units; and errors in the overall magnitude of subsidence calculated using the modelling software. Using chronostratigraphic columns of each basin, maximum and minimum possible ages for deposition of the top and base of each unit were assigned, and then their percentage deviations from the values used for computing the tectonic subsidence curves were calculated. For maximum ages, the base age is assumed to be the oldest possible from the chronostratigraphic column, with the top age assigned to an age halfway through the overall length of unit deposition. For minimum ages, the base age is assigned to an age halfway through the overall length of unit deposition, with the top age assumed to be the youngest possible from the chronostratigraphic column. Percentage deviations of unit ages were then collated and averaged for the Triassic, Jurassic and Cretaceous periods.
There are two sources of variability in how the backstripping software was used that affects the magnitude of subsidence calculated for each well. The first is the value of the input parameters used, and the second is the combination of maximum or minimum values used for each input parameter. Maximum and minimum values for the input parameters, derived from the literature, are shown in Figure 4a–c. Figure 4d shows the results of all possible combinations of maximum and minimum input parameters when running the modelling software. It is worth noting that the combinations of these input parameters had a much larger effect on the calculated magnitude of subsidence than the values of input parameters used. The combinations that were used to represent maximum and minimum subsidence conditions were therefore selected to be representative of real-world conditions, and those that produced more extreme maximum and minimum values were considered to be less likely to occur in nature.
2.c. Curve averaging
To allow the dataset of subsidence curves to be compared, they have been grouped into six geographic blocks. These blocks, although arbitrary, were selected to be roughly the same size while keeping wells from the same basin within the same block as much as possible. Wells on the Newfoundland margin were selected to keep the number of wells in each block even. The locations of the blocks and wells are depicted in Figure 1.
Individual subsidence curves were then grouped with others from within the same block and a mean subsidence curve was calculated to represent each block, as shown in Figures 5–10. Curves of wells that did not penetrate the full depth of stratigraphy had the origin of their subsidence axis offset to the depth of mean subsidence in the block at the age of the oldest point in the well. This was to account for the subsidence of the sediments below them that were undrilled, and required that at least one well per block penetrated to basement.

Fig. 5. (a) Tectonic subsidence (water loaded) of individual wells of the north Newfoundland block and their numerical mean. (b) Maximum and minimum errors for both subsidence and age on the north Newfoundland block mean curve.

Fig. 6. (a) Tectonic subsidence (water loaded) of individual wells of the north Iberia block and their numerical mean. (b) Maximum and minimum errors for both subsidence and age on the north Iberian block mean curve.

Fig. 7. (a) Tectonic subsidence (water loaded) of individual wells of the centre Newfoundland block and their numerical mean. (b) Maximum and minimum errors for both subsidence and age on the centre Newfoundland block mean curve.

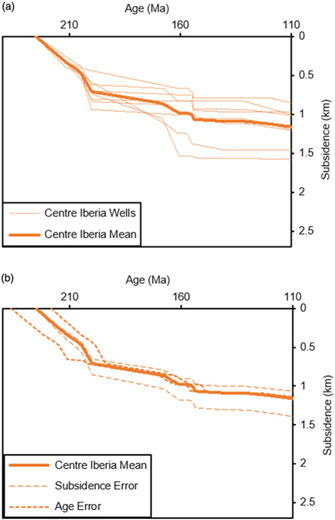
Fig. 8. (a) Tectonic subsidence (water loaded) of individual wells of the centre Iberia block and their numerical mean. (b) Maximum and minimum errors for both subsidence and age on the centre Iberian block mean curve.

Fig. 9. (a) Tectonic subsidence (water loaded) of individual wells of the south Newfoundland block and their numerical mean. (b) Maximum and minimum errors for both subsidence and age on the south Newfoundland block mean curve.

Fig. 10. (a) Tectonic subsidence (water loaded) of individual wells of the south Iberia block and their numerical mean. (b) Maximum and minimum errors for both subsidence and age on the south Iberian block mean curve.
Subsidence at unconformities was set to a value of 0 for the duration of the hiatus, affecting the overall averaging process. Thus, if all wells in a block present an unconformity at the same time, so also would the average curve. However, in the case of an absence of observations (i.e. redacted portion of publically available well data due to industry activity), the subsidence was set to a null value and therefore excluded from the averaging for that margin segment in the period of time it affects. For the dataset under consideration, this was encountered infrequently and its consequences were negligible.
The mean curves for each block were then grouped (Fig. 11a) with their respective curves from the opposite side of the margin and a mean subsidence curve was calculated to represent each of the north, centre or south segments of the margin so that trends laterally along the proximal domain of either margin could be compared (Fig. 11b). Curves from the same side of the margin were also grouped together, and a mean subsidence curve was calculated to represent either the proximal domain of Iberia or Newfoundland so that overall trends could be compared (Fig. 11c). The values of error envelopes were also grouped and averaged together in this way to give illustrative error estimates for the three blocks.
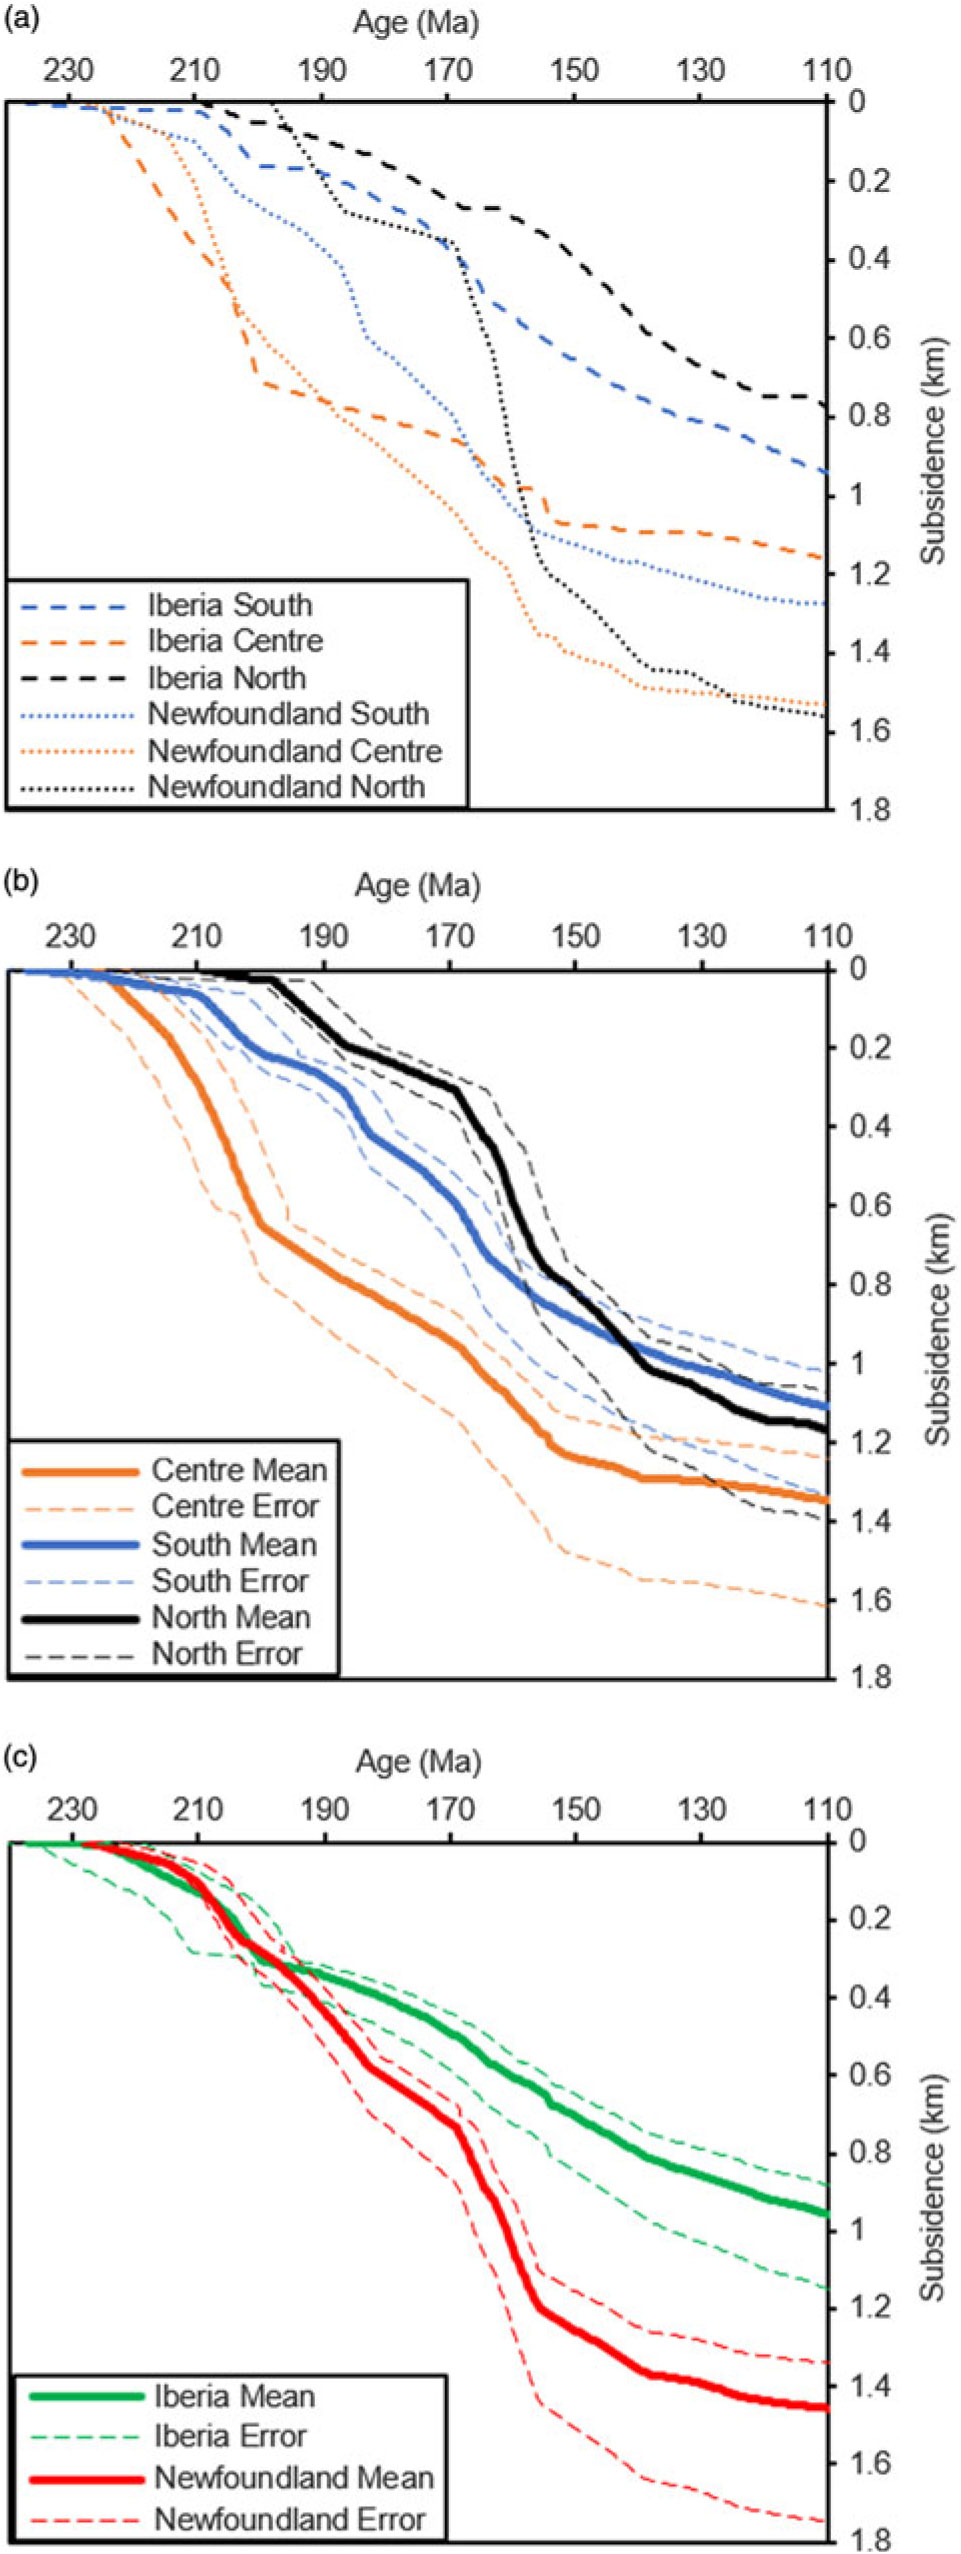
Fig. 11. (a) Mean tectonic subsidence curves (water loaded) for each block on either side of the margin. (b) Mean tectonic subsidence curve (water loaded) for each segment of the margin and their associated error as an envelope. (c) Mean tectonic subsidence curve (water loaded) for each side of the margin as a whole and their associated error as an envelope.
3. Results and discussion
3.a. Tectonic subsidence trends
Individual tectonic subsidence curves generated for each well were compared with existing databases of subsidence curves from the same area (e.g. Stapel et al. Reference Stapel, Cloetingh and Pronk1996) and found to be comparable with one another, indicating that the input parameters used in the work, as well as the curve generation, are reliable.
The tectonic subsidence curve-averaging methodology provides tectonic signatures for segments of the continental margin that are of a scale appropriate for illuminating the large-scale tectonic processes forming the continental margin as a whole, filtering out more local effects (e.g. related to basement structures and sediment transport systems). The conjugate segment averaged curves seen in Figure 11b therefore tend to define singular periods of synrift subsidence (lasting continuously from Late Triassic to Early Cretaceous time) rather than characterizing a series of separate periods of active, synrift subsidence as suggested by the more detailed studies mentioned in the Introduction.
All three segments under consideration (north, centre and south) display this amalgamated ‘synrift’ period of continuous subsidence at a high rate, in each case accommodating the bulk of tectonic subsidence that occurs prior to break-up. However, there are differences observed in the timing at which this period occurs: in the centre segment it occurs from c. 227 Ma (early Norian) to c. 152.1 Ma (early Tithonian); in the south segment it occurs from c. 208.5 Ma (early Rhaetian) to c. 152.1 Ma (early Tithonian); and in the north segment it occurs from c. 201.3 Ma (early Hettangian) to c. 132.9 Ma (early Hauterivian). The onset age is based on the observed break over to high tectonic subsidence rates such as those typically associated with active, synrift extension (e.g. Allen & Allen, Reference Allen and Allen2013). The termination age is based on the transition to exponentially decaying (concave upwards) tectonic subsidence rates, which are more typical of post-rift, passive subsidence. The choice of the termination dates is somewhat arbitrary, being only qualitatively determined, and by recalling that this apparent transition marks only the cessation of rifting in the proximal domain; break-up of the continental margin, and therefore the end of active rifting, occurred later.
The quantified age error estimates for each segment subsidence curve do not overlap, suggesting that the contrast in rift onset timing is robust when considering segments as a whole. Moreover, the observed centre to south to north migration of rifting in the proximal domain can be seen in the subsidence curves from each block on either side of the margin in Figure 11a, also indicating that the trends are not an artefact of the averaging process.
Although the mean curve of each segment displays a pseudo-synrift phase, the overall trend of these curves differs, indicating fundamental differences in the nature of rifting in the segment (Xie & Heller, Reference Xie and Heller2006). From Figure 11b it can be seen that the rates of subsidence during the amalgamated synrift period vary between segments; in the centre, south and north it occurs at a rate of c. 17 m Ma–1, c. 14 m Ma–1 and c. 17 m Ma–1, respectively. The centre segment curve exhibits its greatest rate of subsidence almost immediately after synrift subsidence begins, giving a trend of almost continuous rapid subsidence that lacks any significant punctuation. The north and south segments instead both display a period of low-rate tectonic subsidence that precedes the initiation of the amalgamated synrift phase, and thereafter display a much more stepped trend indicating a more irregular rifting history with multiple observable episodes. The rate of subsidence in the north and south differ, however this is due to only one well being present in the northern Newfoundland block penetrating deeper than 170 Ma. If the assumption is made that a higher-than-average amount of subsidence occurred in the well at this time, then the south and north segment mean curves would display almost an identical subsidence rate and trend.
Figure 11c shows all three blocks from either side of the margin averaged together to look at cross-margin trends. It can be seen that – overall, despite the diachroneity revealed by considering individual segments – one side of the margin does not rift prior to the other. There are three periods of similarity, both in rate and magnitude of subsidence, across the margin: (1) c. 227 Ma (early Norian) to c. 199.3 Ma (early Sinemurian); (2) c. 182.7 Ma (early Toarcian) to c. 170.3 Ma (early Bajocian); and (3) c. 152.1 Ma (early Tithonian) to c. 113 Ma (early Albian). It is only outwith these three periods that the subsidence curves of the conjugate margins can be seen to diverge from each other, with more rapid tectonic subsidence occurring in the Newfoundland conjugate compared with the Iberian conjugate during c. 199.3 Ma (early Sinemurian) to c. 182.7 Ma (early Toarcian) and during c. 170.3 Ma (early Bajocian) to c. 152.1 Ma (early Tithonian).
It is of course well-known that basins on the Newfoundland side of the margin are much thicker, with greater accommodation space provided by tectonically driven subsidence, than on the Iberian side, and that this is intrinsically linked to the asymmetrical nature of this particular conjugate margin of the Atlantic Ocean (Manatschal et al. Reference Manatschal, Müntener, Lavier, Minshull, Péron-Pinvidic, Karner, Manatschal and Pinheiro2007). However, the bulk-averaged tectonic subsidence curves computed here demonstrate that there are two possibly distinct periods during which asymmetrical stretching occurred in the proximal domain, both of them during the Jurassic Period, at least at a whole-basin regional scale.
The potential impact of sediment supply on these trends was examined and found to be unlikely. During the period of high subsidence (Jurassic), where trends in the subsidence curves laterally and across the margin are observed, formations are found to be very similar between blocks on the same side of the margin with the dominant depositional environment being marine; this suggests that trends laterally along the margin are tectonic in origin. During this period lithologies deposited in Iberia include marine carbonates with some shaly interbeds (Maldonado et al. Reference Maldonado, Somoza and Pallarés1999; J Kullberg, PhD thesis, University of Lisbon, 2000; Alves et al. Reference Alves, Gawthorpe, Hunt and Monteiro2002, Reference Alves, Gawthorpe, Hunt and Monteiro2003, Reference Alves, Moita, Sandnes, Cunha, Monteiro and Pinheiro2006; Lopez & Proença Cunha, Reference Lopez and Proença Cunha2004; Matias et al. Reference Matias, Kress, Terrinha, Mohriak, Menezes, Matias, Santos and Sandnes2011; R Sousa Lemos Pereira, PhD thesis, University of Cardiff, 2013; D Soares, PhD thesis, University of Cardiff, 2014; J Casacão, unpub. MSc thesis, University of Lisbon, 2015), and in Newfoundland include open-marine successions of shales and sands with some carbonate interbeds (Driscoll & Hogg, Reference Driscoll, Hogg and Lambiase1995; Fensome et al. Reference Fensome, Crux, Gard, MacRae, Williams, Thomas, Fiorini and Wach2008; Canada-Newfoundland Offshore Petroleum Board, 2017). Deltaic sequences, which are the most likely to indicate a sedimentary supply influence on subsidence curves, are not present on either side of the margin from earliest Jurassic to latest Early Cretaceous time. Due to the slightly different depositional environments between the Iberian and Newfoundland sides of the margin during Jurassic time, a sedimentary supply effect on the disparity between overall magnitude of subsidence on either side of the margin at break-up cannot be entirely ruled out. However, the depositional environments are similar enough that rates of deposition would be comparable, indicating a different cause for this disparity.
3.b. Possible implications
The objectives of the present study were to compute bulk-averaged tectonic subsidence curves for appropriate conjugate blocks in the proximal domain of the Iberia–Newfoundland conjugate continental margin, and to describe how these results may usefully contribute to increased understanding of the nature of stretching across margins as a whole and how the results may provide necessary constraints for future modelling studies. A thorough investigation of these results in terms of a new interpretation of the tectonic evolution of the entire Iberia–Newfoundland margin was not intended. Nevertheless, our results offer additional insights into the development of the margin.
Numerous papers describe a migration of continental break-up from south to north along the Iberia–Newfoundland margin (e.g. Mohn et al. Reference Mohn, Karner, Manatschal, Johnson, Gibson, Roure and Manatschal2015; Brune et al. Reference Brune, Williams, Butterworth and Müller2016). Although timing of break-up cannot be derived from this work, rifting leading to break-up can be seen to cease in the proximal domain, inferred to migrate to distal and hyperextended domains, at c. 152.1 Ma (early Tithonian) in the south and centre and c. 132.9 Ma (early Hauterivian) in the north. These results are fitting with the observed south–north rift propagation in the hyperextended domain that led to break-up. It is notable that stretching in the proximal domain instead propagates from the centre to the south to the north, a trend that does not mirror that of eventual break-up.
Another feature that has been noted in previous work is the depth-independent symmetrical nature of initial rifting (Mohn et al. Reference Mohn, Karner, Manatschal, Johnson, Gibson, Roure and Manatschal2015; Brune et al. Reference Brune, Williams, Butterworth and Müller2016), by which an evenly distributed strain of similar timing and magnitude on both margin conjugates is meant. Here, it was found that conjugate block average curves do appear symmetrical during the first period of rifting (Fig. 11c), suggesting that there is no large-scale cross-margin propagation of rifting occurring in the early stages of margin formation via a crustal-scale simple shear/fault zone (e.g. Wernicke, Reference Wernicke1985; Lister et al. Reference Lister, Etheridge and Symonds1991). Rifting in the stretching phase of the proximal domain was found to be generally symmetrical, but with notable exceptions of contrasting subsidence rates on either side of the margin during two isolated periods of tectonic subsidence during Jurassic time. This suggests the possibility that whatever process caused asymmetry on this conjugate margin as a whole, it began during the rifting stage.
Manatschal et al. (Reference Manatschal, Müntener, Lavier, Minshull, Péron-Pinvidic, Karner, Manatschal and Pinheiro2007) suggested that inherent crustal heterogeneities are an important constraint on how rifting manifests itself and propagates. One important source of heterogeneity in the study area is pre-rift magmatic underplating below Iberia. Although emplaced during the Permian Period, prior to the onset of rifting leading to continental break-up in this area, Mohn et al. (Reference Mohn, Karner, Manatschal, Johnson, Gibson, Roure and Manatschal2015) argued that the cooling of this underplate resulted in the development of the first sedimentary depocentres during the Triassic Period. This could provide an explanation of the trends seen in the bulk-averaged tectonic subsidence curves, with the north and south segments displaying a period of low-rate subsidence during Triassic time prior to the initiation of active rifting. As this period is not evident in the curve of the centre segment, and the rate and trend overall differs from the north and south segments, this may imply a lesser degree or absence of underplating beneath the centre segment. Further, as the effects of sediment supply on observed trends has been examined and found unlikely to be a factor, it is possible that pre-rift underplating may also offer an explanation of the timing of rifting initiating in each segment of the margin, and may also be a factor contributing to the magnitude of subsidence in Newfoundland being c. 50% higher than in Iberia at break-up.
3.c. Methodological limitations
That potentially important implications for the evolution of the Iberia–Newfoundland conjugate margin have been identified demonstrates the strength of processing a large dataset of subsidence curves in the way described in this work, allowing a 3D view of basin subsidence trends across the margin in a very simple manner. Previous work modelled in 2D along deep seismic lines, which limited the insight gained laterally along the margin, or utilized idealized stratigraphic columns from basins across the margin. While the use of generalized stratigraphy addresses the issue of 3D data spread, it adds another stage of interpretation, increasing the risks of making assumptions that may not be applicable to all areas of the basin. By using real-world stratigraphic columns encountered in wellbores and backstripping the results, therefore removing as much interpretation bias as possible, a clearer insight into the nature of rifting along the Iberia–Newfoundland margin has been achieved.
It is important to note, however, that the mean curves produced in this work do not represent subsidence at any real-world location. They have been created in a way to show average subsidence of designated blocks so that relative trends along and across the margin as a whole can be identified; as such, they do not represent any tangible real-world location.
4. Conclusion
By creating average subsidence curves for the Iberia–Newfoundland margins of the northern Central Atlantic Ocean from a large dataset of wells from the conjugate proximal margins themselves, we provide additional insights into the development of the conjugate margin. The findings suggest that the main rifting phase and associated tectonic subsidence began earlier in the central part of the proximal margin (c. 227 Ma, early Norian) than in the southern (c. 208.5 Ma, early Rhaetian) and northern segment (c. 201.3 Ma, early Hettangian).
The rifting trend identified in this work contrasts with the overall south–north trend of break-up along the Atlantic that has been recorded in previous studies, showing that rifting in the proximal domain prior to continental break-up does not necessarily mirror the trend of rifting in the hyperextended domain. The timing of initial subsidence as is expressed in each block of the studied margin segment could be linked to the differential distribution of pre-rift, magmatic underplating below Iberia. Other observations, such as the Newfoundland side of the margin subsiding by 50% more than the Iberian side prior to continental break-up, which occurs during two isolated Jurassic periods, could also be explained by the presence of magmatic underplating below Iberia.
The results of this analysis of the Iberia–Newfoundland margin demonstrates the usefulness of our proposed workflow for identifying subsidence trends in large datasets of wellbore data along conjugate margins, and supplements, rather than only complements, results based on deep seismic lines that other studies have relied upon. The potential for introducing bias to studies by focusing on a limited number of wells has been recognized from the earliest attempts to backstrip stratigraphic records in basins. The approach applied here to the Iberia–Newfoundland margin offers opportunities to limit these biases. Simply ignoring wells that do not have the full data record necessary for accurate backstopping is an example of Macnamara’s Fallacy, and risks the introduction of significant quantification bias in a study. However, wells still need screening to avoid incorporating those sites where the stratigraphic record has responded to non-tectonic motions such as those caused by salt mobility. The results obtained in this work may be used to provide insights into the geodynamic-scale processes driving lithosphere rifting prior to continental break-up, and may provide more relevant constraints for future forward modelling studies on the Iberia–Newfoundland margin and on conjugate margins in general.
Author ORCIDs
Cameron Spooner 0000-0002-0690-8816