


1. Introduction
The assessment of the mineral chemistry of constituent phases plays an important role as a petrogenetic indicator for mafic–ultramafic rock suites (Friend et al. Reference Friend, Bennett and Nutman2002; Malviya et al. Reference Malviya, Arima, Pati and Kaneko2006; Pettigrew & Hattori, Reference Pettigrew and Hattori2006; Guice et al. Reference Guice, McDonald, Hughes, MacDonald, Blenkinsop, Goodenough, Faithfull and Gooday2018; Ali et al. Reference Ali, Ntaflos and Sami2021; Abdelfadil et al. Reference Abdelfadil, Saleh, Putiš and Sami2022). Palaeoarchaean mafic–ultramafic assemblages were subjected to multiple deformation and metamorphic episodes and, in most instances, the primary mineralogy is beyond recognition (Polat & Hofmann, Reference Polat and Hofmann2003; Byerly & Lowe, Reference Byerly and Lowe2014). Although data are scant for such Palaeoarchaean rocks, some crucial sets of information have been recorded from several parts of the world where mineral chemistry could play an important role in evaluating the petrogenesis of mafic–ultramafic rock suites. The Palaeoarchaean abyssal peridotites from the Itsaq Gneiss Complex (>3800 Ma) of Southern West Greenland (Friend et al. Reference Friend, Bennett and Nutman2002) record massive dunites and harzburgites, with those rocks bearing both spinel-bearing and garnet-free assemblages that indicate an equilibration pressure below ∼20 kbar and a temperature above ∼800 °C (O’Neill, Reference O’Neill1981; Schmädicke, Reference Schmädicke2000; Friend et al. Reference Friend, Bennett and Nutman2002). For Archaean mafic–ultramafic rocks from the Mauranipur supracrustal rocks of the Bundelkhand Craton, India, and the Ben Strome Complex of Scotland, the spinel chemistry has been successfully used to discern the distinct petrogenesis and tectonic setting (Malviya et al. Reference Malviya, Arima, Pati and Kaneko2006; Guice et al. Reference Guice, McDonald, Hughes, MacDonald, Blenkinsop, Goodenough, Faithfull and Gooday2018). The Ben Strome Complex has been ascribed to have a ‘layered intrusion affinity’ based on spinel chemistry (Guice et al. Reference Guice, McDonald, Hughes, MacDonald, Blenkinsop, Goodenough, Faithfull and Gooday2018). Spinel chemistry has been found to be effective for evaluating the petrotectonic setting of the host rocks (Barnes & Roeder, Reference Barnes and Roeder2001; Malviya et al. Reference Malviya, Arima, Pati and Kaneko2006). Clinopyroxene compositions mostly involving SiO2, Al2O3, TiO2 and Alz in atoms per formula unit (apfu) (where Alz = 100 × IVAl/2) were successfully employed to discriminate the arc signature for the Quetico Intrusions of the Western Superior Province and were attributable to the Neoarchaean Alaskan/Ural-type zoned mafic–ultramafic intrusions (Pettigrew & Hattori, Reference Pettigrew and Hattori2006). In the global scenario for Palaeoarchaean mafic–ultramafic rock suites, the attempt to elucidate petrogenetic aspects using mineral chemistry is rather rare. In order to decipher the style of early crustal growth in the eastern Indian shield, we have investigated Palaeoarchaean mafic–ultramafic rocks (∼3392 to ∼3507 Ma; Basu et al. Reference Basu, Bandyopadhyay, Chakraborti and Zou2008; Mukhopadhyay et al. Reference Mukhopadhyay, Beukes, Armstrong, Zimmermann, Ghosh and Medda2008) of the western Iron Ore Group of the Singhbhum Craton based on mineral chemistry. The availability of such deduced petrogenetic data would give us an idea of the nature of magma evolution during the formation of proto-crust globally.
2. Geological background
The Precambrian geological history of Peninsular India covers nearly three billion years of time, and it involves a complex geological evolutionary history (Meert et al. Reference Meert, Pandit, Pradhan, Banks, Sirianni, Stroud, Newstead and Gifford2010). In this situation, some important geological documentation (related to the complex evolutionary history of the Indian Plate and the Singhbhum Craton in particular) has been described in a brief manner. The stable configuration of the Indian Plate was completed by 2.5 Ga (Radhakrishna & Naqvi, Reference Radhakrishna and Naqvi1986), where the role of the Indian Plate in various supercontinental cycles has been highlighted by several workers (Rogers & Santosh, Reference Rogers and Santosh2002; Veevers, Reference Veevers2004; Li et al. Reference Li, Bogdanova, Collins, Davidson, De Waele, Ernst, Fitzsimons, Fuck, Gladkochub, Jacobs, Karlstrom, Lu, Natapov, Pease, Pisarevsky, Thrane and Vernikovsky2008). The general consensus of opinion is that the Indian cratonic nuclei are constituted by tonalite–trondhjemite–granodiorite gneisses (TTGs), greenstone enclaves and Archaean supracrustal rocks, which were invaded later by potassic granites (Misra et al. Reference Misra, Deomurari, Wiedenbeck, Goswami, Ray and Saha1999; Jayananda et al. Reference Jayananda, Kano, Peucat and Channabasappa2008; Ramakrishnan & Vaidyanadhan, Reference Ramakrishnan and Vaidyanadhan2008). For the Singhbhum Craton of Peninsular India, the following important points are to be noted: (i) the Singhbhum Craton covers an area of ∼39 000 km2 and forms a N–S elongate ovoid block lying between 84.5 °E to 86.5 °E and 21 °N to 22.75 °N in eastern India. This craton also embraces different rock units ranging in age from 3.5 to 2.5 Ga (Mukhopadhyay, Reference Mukhopadhyay2001; Matin et al. Reference Matin, Banerjee, Gupta and Banerjee2012; Sarkar & Gupta, Reference Sarkar and Gupta2012; Mukhopadhyay & Matin, Reference Mukhopadhyay and Matin2020); (ii) The North Singhbhum Mobile Belt is thrust over the Singhbhum Craton along the arcuate Singhbhum Shear Zone, where the Singhbhum Shear Zone has a history of reactivation multiple times; (iii) The stratigraphic succession of the Singhbhum–Orissa Craton has been reported by Saha et al. (Reference Saha, Ray, Sarkar and Mukhopadhyay1988) and Misra (Reference Misra2006) (Table 1); (iv) This stratigraphic succession has scope for further modification considering the availability of geochronological data (Mukhopadhyay & Matin, Reference Mukhopadhyay and Matin2020 and recent studies by other workers; see Table 1); (v) The Iron Ore Group (IOG) basin as a whole comprises three principal sub-parts which are: the western IOG belt (Noamundi–Jamda–Koira basin), eastern IOG belt (Gorumahisani–Badampahar basin) and southern IOG belt (Tomka–Daitari basin) (Fig. 1); (vi) Some important geochronological data for the western IOG include an age of 3392 ± 29 Ma (Basu et al. Reference Basu, Bandyopadhyay, Chakraborti and Zou2008). For the southern IOG, geochronological data reveals ages of 3507 ± 2 Ma (Mukhopadhyay et al. Reference Mukhopadhyay, Beukes, Armstrong, Zimmermann, Ghosh and Medda2008) and 3505 ± 5 Ma (Sreenivas et al. Reference Sreenivas, Dey, Bhaskar Rao, Vijaya Kumar, Babu and Williams2019). For the eastern IOG, an indirect age of 3.1 Ga has been inferred by Saha (Reference Saha1994), though some recent geochronological input is available in the literature and those have been cited in Table 1 (Nelson et al. Reference Nelson, Bhattacharya, Thern and Altermann2014; Olierook et al. Reference Olierook, Clark, Reddy, Mazumder, Jourdan and Evans2019; Hofmann et al. Reference Hofmann, Jodder, Xie, Bolhar, Whitehouse and Elburg2022). The present study area (belonging to the western IOG), therefore, in all probability corresponds to a Palaeoarchaean age (Sarkar & Gupta, Reference Sarkar and Gupta2012; Paul et al. Reference Paul, Ray, Manikyamba, Ganguly, Singh, Pachal and Sarkar2021; Mahapatra et al. Reference Mahapatra, Mukherjee, Paul, Chakraborti, Ray, Ganguly, Koeberl, Manikyamba and Sarkar2022).
Table 1. Stratigraphy of the Singhbhum–Orissa Craton, eastern India. After Saha et al. (Reference Saha, Ray, Sarkar and Mukhopadhyay1988) and Misra (Reference Misra2006)

BHJ – banded haematite jasper; BHQ – banded haematite quartzite; EIOG – eastern Iron Ore Group; IOG – Iron Ore Group; MBG – Mayurbhanj granite and gabbro; OMG – Older Metamorphic Group; OMTG – Older Metamorphic Tonalite Gneiss; SBG-I, -II, -III – Singhbhum Granite I, II and III; SIOG – southern Iron Ore Group; WIOG – western Iron Ore Group.

Fig. 1. Regional map showing disposition of several rock units in the Singhbhum North Orissa region, eastern India (after Saha, Reference Saha1994; Misra, Reference Misra2006; Singh et al. Reference Singh, Manikyamba, Ray, Ganguly, Santosh, Saha, Rambabu and Sawant2016); marked areas represent investigated sectors: a – Koira sector, b – Gua–Manoharpur sector and c – Sahedba–Santara sector. Inset map shows distribution of different cratons in the Peninsular India (Sharma, Reference Sharma2009); DhC – Dharwar Craton; BaC – Bastar Craton; SiC – Singhbhum Craton; BuC – Bundelkhand Craton; ArC – Aravalli Craton.
3. Field geology
The study area was divided (and systematically studied) into the following sectors: (a) the Koira sector, (b) the Gua–Manoharpur sector and (c) the Sahedba–Santara sector (Fig. 1). The rock units (encompassing all three sectors) are divisible into the following types: (i) highly schistose phyllite and ferruginous shale (more dominant) with a local presence of primary compositional layers; (ii) banded iron formation (BIF) comprising banded haematite quartzite and banded haematite jasper; and (iii) basaltic rocks and mafic (gabbro) – ultramafic (peridotite) intrusive rocks (Fig. 2a–c). A comprehensive litholog showing the height-wise distribution of different lithologies has been carefully prepared based on the present study, and its geological implications have been shown in Figure 2d. Figure 3a–h shows representative field photographs of different lithologies of the investigated area, which depict the field characteristics and spatial interrelationships of the different lithounits.

Fig. 2. Geological map (prepared by the present authors) of the study areas corresponding to the different sectors: (a) Koira sector, (b) Gua–Manoharpur sector and (c) Sahedba–Santara sector (see Fig. 1). The geological map corresponding to sector (c) has been shown in terms of (i) and (ii) for easy understanding of the different lithological units. (d) Litholog (prepared by the present authors) showing the distribution of different lithologies of the study area.

Fig. 3. Field photograph showing (a) exposure of basemental older metamorphic migmatitic gneiss traversed by a granitic intrusion; (b) a sectional view of phyllite showing prominent schistosity; (c) ferruginous shale with a nearly vertical attitude of schistosity plane; (d) an exposure of banded haematite jasper (BHJ) showing open folding with a nearly sub-horizontal axis; (e) well-developed columnar jointing pattern in basaltic rock; (f) a peridotite lensoidal intrusion into phyllite; (g) exposure of a gabbro dyke invading the adjacent phyllitic rock; (h) a local patch of conglomerate spatially associated with banded haematite quartzite (BHQ).
4. Petrography of basalts and intrusive rocks
In hand specimen, the basaltic rocks are mesocratic, merocrystalline and inequigranular. The gabbroic rocks, on the other hand are meso-melanocratic, coarse grained and inequigranular. The ultramafic intrusive rocks (peridotite) in hand specimen show a dominantly serpentinized nature. Microscopic study of these rocks (basalts–gabbro–ultramafic) reveals that their essential mineralogies show a change-over to secondary minerals. For instance, in samples of both basalts and gabbro, primary clinopyroxene has often been altered to uralite, and initial plagioclase shows the effects of saussuritization (where granular aggregates of albite, chlorite, epidote and K-feldspar have been noted). In both cases (for basalt–gabbro), however, relict primary mineralogy and relict textures (namely ophitic, sub-ophitic and intergranular) have been recorded. The ultramafic intrusive rocks, under the microscope, have a mesh-like appearance defined by the constituent minerals. In the ultramafic type, euhedral/subhedral opaque crystals and minute dolomite grains (pseudomorphs after olivine) have been observed. Representative photomicrographs of these rock types have been presented in Figure 4a–h.
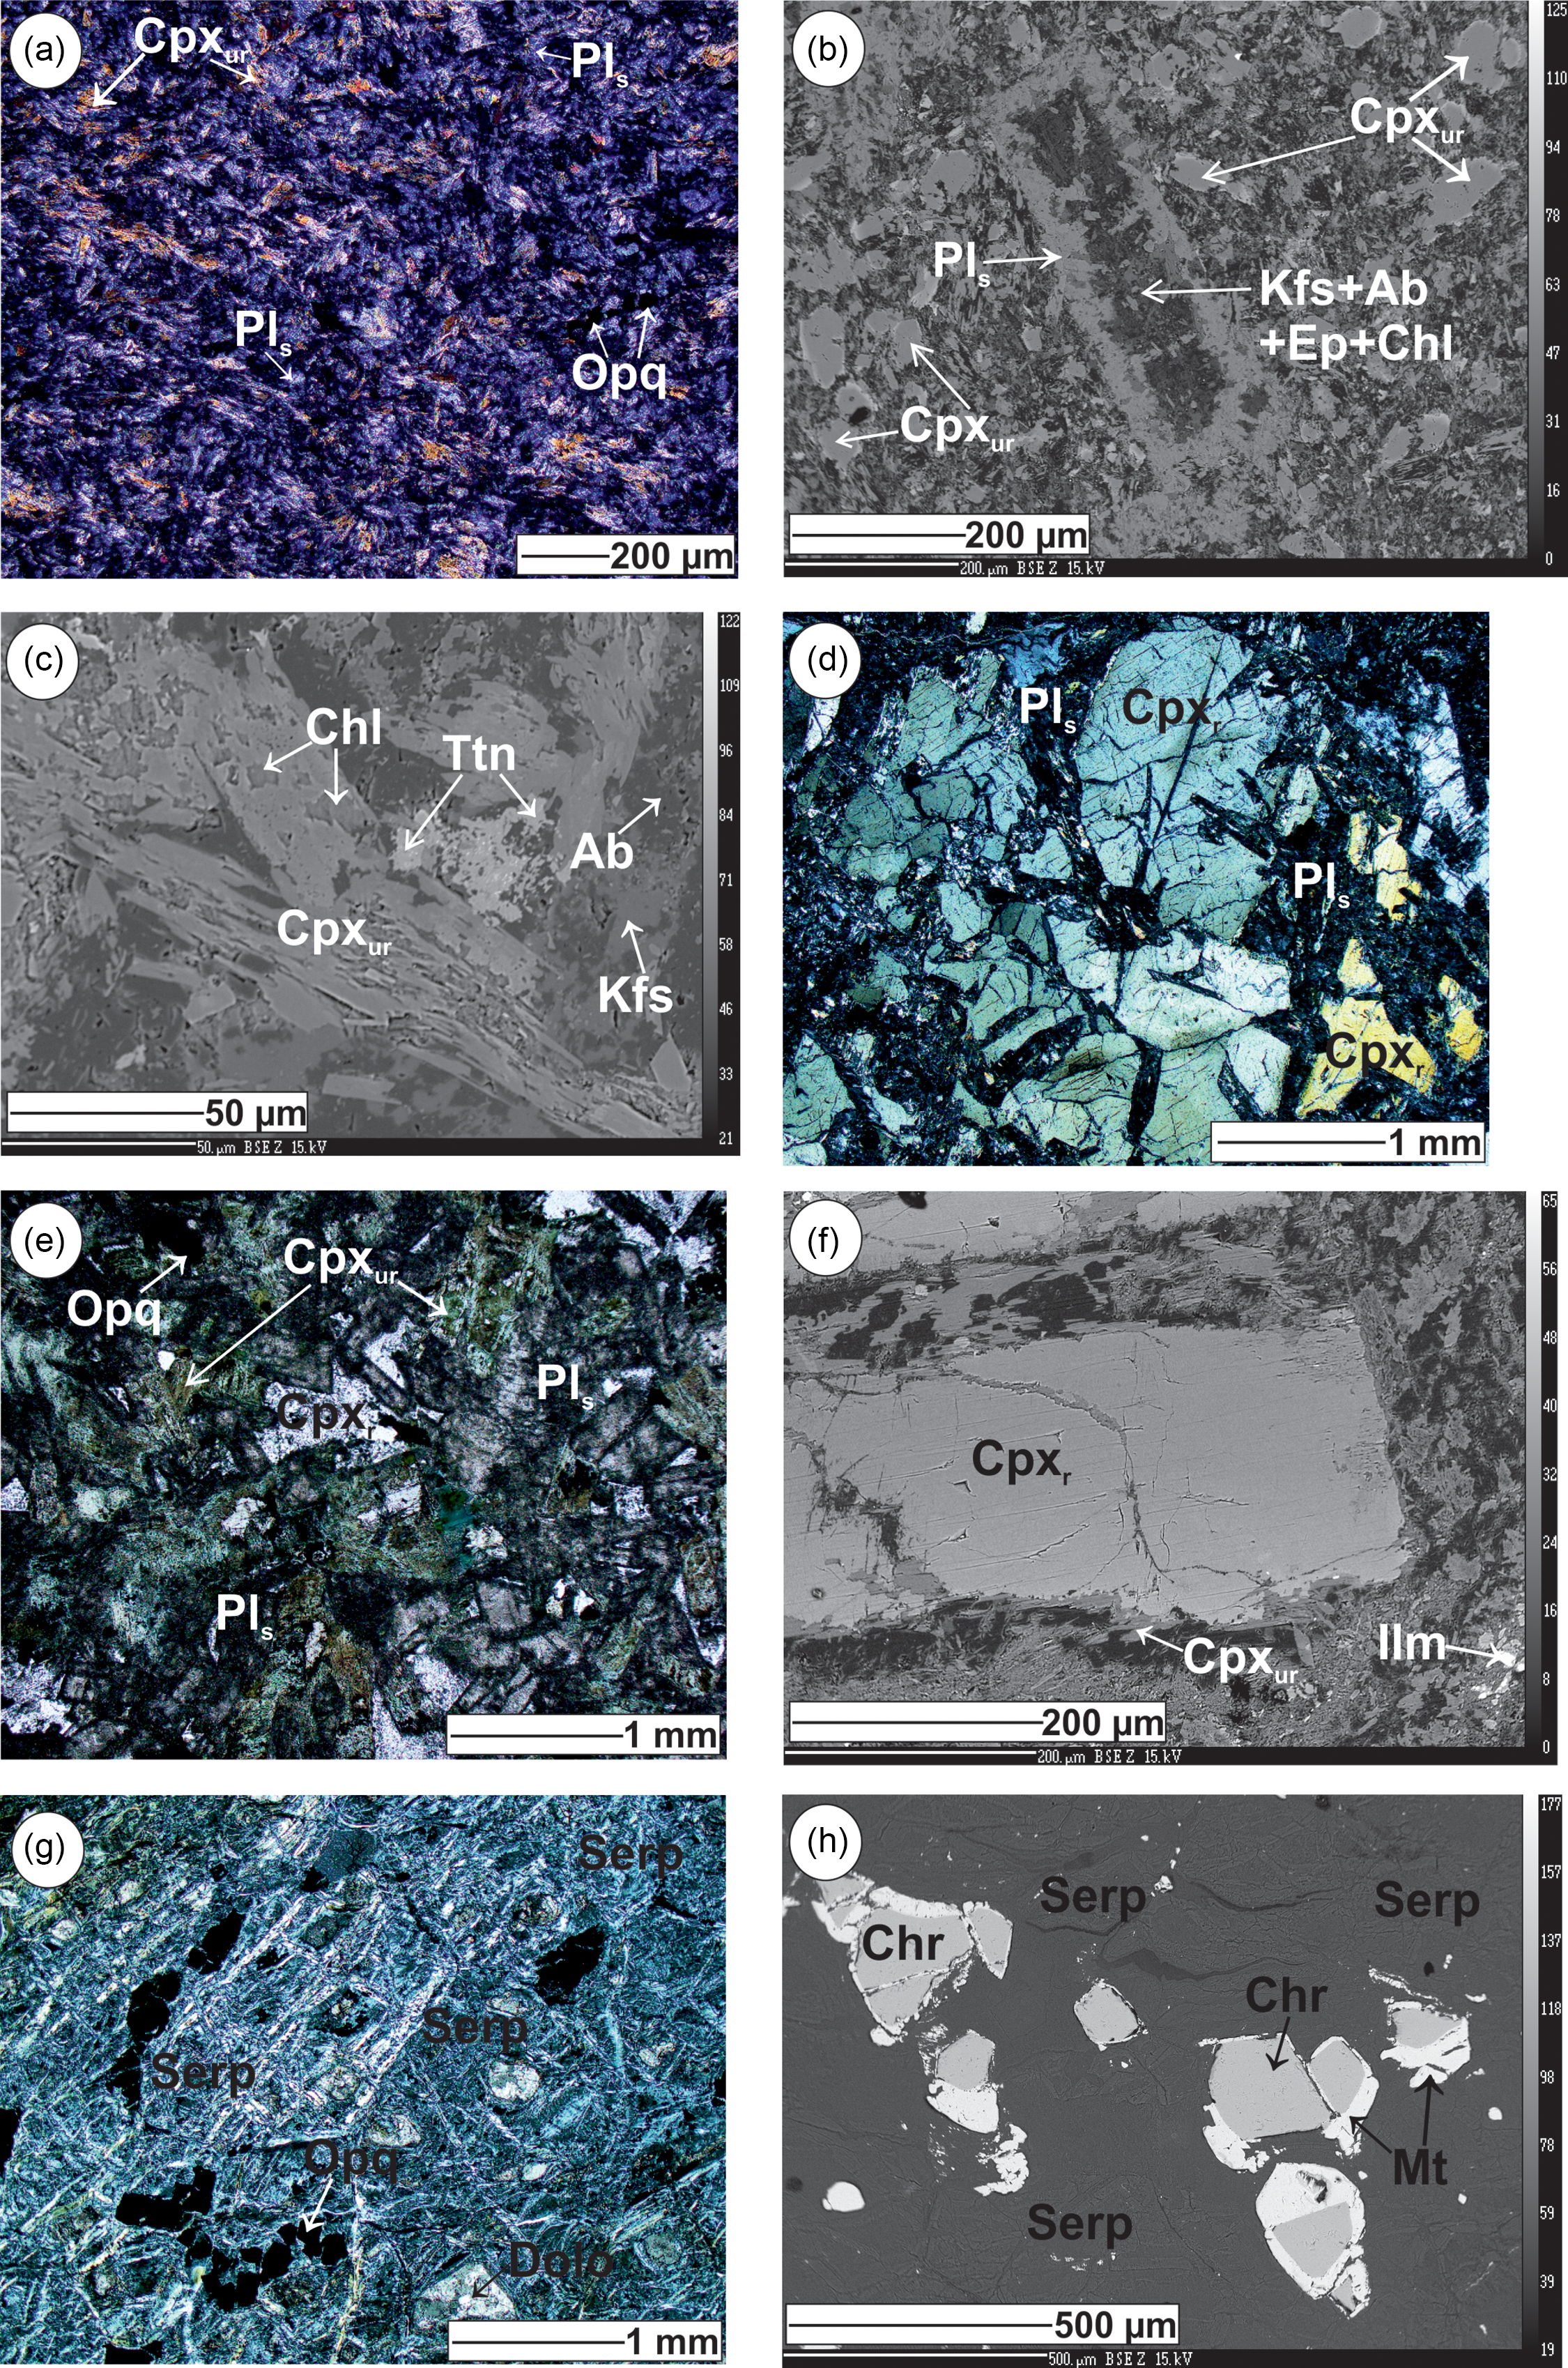
Fig. 4. (a) Photomicrograph of basalt from the Koira sector showing the dominant presence of uralitized clinopyroxene (Cpxur) and saussuritized plagioclase (Pls). Small euhedral opaque grains (Opq) are also present. (b) Back-scattered electron (BSE) image of basaltic rocks of the Koira sector showing the presence of a large saussuritized plagioclase (Pls) phenocryst. The plagioclase phenocryst is charged with numerous secondarily formed minerals such as albite (Ab), epidote (Ep), chlorite (Chl) and K-feldspar (Kfs). Prismatic uralitized clinopyroxene grains (Cpxur) have also been noticed. (c) BSE image of basaltic rocks of the Koira sector showing the presence of a prismatic uralitized clinopyroxene grain (Cpxur) which is often broken down to chlorite (Chl). The margin of the image shows an elongated plagioclase grain with albite (Ab) and K-feldspar (Kfs) change-over. Some titanite (Ttn) is also present. (d) Photomicrograph of a gabbroic intrusive from the Gua–Manoharpur area showing a characteristic relict prismatic grain of clinopyroxene (Cpxr) which encloses saussuritized plagioclase (Pls) ophitically and sub-ophitically. (e) Photomicrograph of gabbroic rock from the Sahedba–Santara sector showing relict clinopyroxene (Cpxr), saussuritized plagioclase (Pls) and euhedral opaque grains (Opq). Some of the clinopyroxene grains have been uralitized (Cpxur). Overall, the rock shows a hypidiomorphic granular texture. (f) BSE image of a gabbroic rock from the Gua–Manoharpur area showing a large phenocryst of relict clinopyroxene (Cpxr) which shows both marginal and fracture controlled uralitization (Cpxur). Small ilmenite grain (Ilm) is present as an accessory. (g) Photomicrograph of a representative peridotite intrusive from the Sahedba–Santara sector showing the overwhelming presence of serpentine (Serp) giving rise to a mesh-like pattern. Euhedral to subhedral opaque grains (Opq) and dolomite (Dolo) are also present. (h) BSE image of a peridotite intrusive from the Sahedba–Santara area showing the characteristic presence of overwhelming serpentine (Serp) and chromite–magnetite (Chr–Mt) intergrowth.
5. Mineral chemistry
The electron probe microanalysis (EPMA) data for different constituent minerals of the basalt–gabbro–ultramafic association were determined using a CAMECA SX-5 electron probe micro analyser at the Department of Earth Sciences, Indian Institute of Technology (IIT) Bombay, India. The analytical conditions for the instrument involved an acceleration voltage of 15 kV, a beam current of 20 nA and a nominal beam diameter of 3 μm. Both natural and synthetic standards were used for calibration of the elements and data correction was done using the X-PHI method.
Pyroxene. EPMA data for the pyroxenes are available in online Supplementary Material Table S1. Species level classification indicates that the pyroxene belongs to augite (Morimoto, Reference Morimoto1989; Fig. 5a).

Fig. 5. Plots of investigated minerals from different lithologies of the present study: (a) Classification diagrams for pyroxene (Morimoto et al. Reference Morimoto, Fabries, Ferguson, Ginzburg, Ross, Seifert, Zussman, Aoki and Gottardi1988; Morimoto, Reference Morimoto1989). (b) Classification diagram for plagioclase. (c, d) Classification diagrams for amphibole (Leake et al. Reference Leake, Woolley, Arps, Birch, Gilbert, Grice, Hawthorne, Kato, Kisch, Krivovichev, Linthout, Laird, Mandarino, Maresch, Nickel, Rock, Schumacher, Smith, Stephenson, Ungaretti, Whittaker and Youzhi1997; Hawthorne et al. Reference Hawthorne, Oberti, Harlow, Maresch, Martin, Schumacher and Welch2012). Note: In the majority of the cases, the plagioclase composition of the gabbros/basalts have been re-equilibrated to albite/oligoclase (only the relict plagioclase composition corresponding to the bytownite field has been recorded); for details see text.
Plagioclase. EPMA data for the plagioclase compositions are given in online Supplementary Material Table S2. Plagioclase grains in the basalt and gabbro are hydrothermally altered and changed to albite or oligoclase. Relict plagioclase grains are mostly bytownite (Fig. 5b).
Amphibole. The amphibole may be divided into two distinct types, namely, (i) uralite occurring peripherally to clinopyroxene and (ii) completely changed-over amphibole with no traces of initial pyroxene. EPMA data for these two types of amphiboles are given in online Supplementary Material Table S3. The amphibole compositions in the classification scheme of Leake (Reference Leake1978) and Leake et al. (Reference Leake, Woolley, Arps, Birch, Gilbert, Grice, Hawthorne, Kato, Kisch, Krivovichev, Linthout, Laird, Mandarino, Maresch, Nickel, Rock, Schumacher, Smith, Stephenson, Ungaretti, Whittaker and Youzhi1997) are found to be ‘calcic’ (Fig. 5c), and the species level classification diagram (Mg/(Mg + Fe2) versus TSi) further shows a compositional spectrum from actinolite–magnesiohornblende–ferrohornblende and ferroactinolite (Hawthorne et al. Reference Hawthorne, Oberti, Harlow, Maresch, Martin, Schumacher and Welch2012; Fig. 5d).
Opaque minerals and serpentine. Opaque minerals in this study are of three types, which include magnetite, chromite and ilmenite. The EPMA data for these opaque phases are available in online Supplementary Material Tables S4–S6. The Fe3+–Cr–Al diagram (Stevens, Reference Stevens1944; Fig. 6a) suggests that the magnetite belongs to both the Cr-magnetite and Al-magnetite variants, while the chromite composition belongs to the Al-chromite field. Serpentine occurs in the peridotite, and its EPMA data are available in online Supplementary Material Table S7. The Si–Mg + Fe–Ni diagram (after Villanova-de-Benavent et al. Reference Villanova-de-Benavent, Proenza, Gali, Casco, Tauler, Lewis and Longo2014; Fig. 6b) shows that the serpentine corresponds to the lizardite variety.

Fig. 6. Plots of investigated minerals for classification: (a) spinel (Stevens, Reference Stevens1944); (b) serpentine (Villanova-de-Benavent et al. Reference Villanova-de-Benavent, Proenza, Gali, Casco, Tauler, Lewis and Longo2014); (c) chlorite (Hey, Reference Hey1954). Note: Opaque minerals are classified as Al-chromite, and Cr-magnetite and Al-magnetite.
Other phases. Other phases include chlorite, epidote, K-feldspar and titanite. The EPMA data for chlorite are available in online Supplementary Material Table S8. The classification diagram based on Fe2 + Fe3 versus Si (Hey, Reference Hey1954) suggests that the chlorite species belong to pycnochlorite and brunsvigite; rare spillovers to diabantite and ripidolite have also been observed (Fig. 6c). The EPMA data for epidote, K-feldspar and titanite are given in online Supplementary Material Tables S9, S10 and S11, respectively.
6. Geothermobarometry
Thermobarometric evaluation of mafic rocks (with low-grade reconstitution) using suitable mineral chemical data was attempted by Putirka (Reference Putirka2008) and Ridolfi et al. (Reference Ridolfi, Renzulli and Puerini2010). With this background, in the present study, the chemistry of the constituent minerals such as clinopyroxene and amphibole has been used to decipher the nature of temperature and pressure equilibration.
6.a. Geothermometry
Thermometric data for clinopyroxene and glass (∼parent melt) were evaluated using the method of Putirka (Reference Putirka2008), and their corresponding temperatures are presented in Table 2. From this table, it is clear that the equilibration temperatures (after Putirka, Reference Putirka2008) reveal an overall range from ∼1100 °C to ∼1400 °C. For the different rock specimens, the glass and pyroxene thermometry reveal almost similar values; this may suggest pyroxene corresponds to an early part of the crystallization history.
Table 2. Thermobarometry data using pyroxene* and glass compositions (after Putirka, Reference Putirka2008)

* During calculation, pyroxene grains lying in close proximity to epidote were not considered.
† Calculations involved unpublished whole-rock major element data of M. Paul (first author of this paper).
We noted earlier (see Section 4) that most of the constituent clinopyroxene grains have been altered to amphibole (uralite) under hydrothermal conditions. Even so, the determination of pressure–temperature conditions of the mafic rocks with the help of those amphibole data (Table 3) is quite encouraging (Ridolfi et al. Reference Ridolfi, Renzulli and Puerini2010; Ridolfi & Renzulli, Reference Ridolfi and Renzulli2012; Zhang et al. Reference Zhang, Humphreys, Cooper, Davidson and Macpherson2017). Plots for amphibole compositions when referred to the pressure–temperature variational grid pattern (Fig. 7a) (Ridolfi et al. Reference Ridolfi, Renzulli and Puerini2010) suggest a temperature equilibration range of ∼750 °C to ∼850 °C with an almost near-surficial pressure (∼0.5 kbar). Figure 7b suggests a variation of log fO2 versus T °C, which indicates an oxygen fugacity range from −11 to −14 units. This suggests that oxygen fugacity varied within the magma chamber during crystallization and subsequent hydration (Ridolfi et al. Reference Ridolfi, Renzulli and Puerini2010). The presence of H2O (wt %) in the ambient melt (during hydration) and the relevant temperature can be bracketed using a T °C versus H2Omelt (wt %) diagram (Fig. 7c). All the data plots for this study characteristically occupy the amphibole stability field.
Table 3. Thermobarometry data of amphibole after Ridolfi et al. (Reference Ridolfi, Renzulli and Puerini2010)


Fig. 7. (a) Amphibole compositional data in the thermobarometric field proposed by Ridolfi et al. (Reference Ridolfi, Renzulli and Puerini2010); (b) Amphibole composition for determination of oxygen fugacity; (c) Estimated H2O melt compositions in a binary plot involving T (°C) and H2O in the melt. For details see text and Ridolfi et al. (Reference Ridolfi, Renzulli and Puerini2010) (while plotting, only relevant compositions of amphibole were considered that qualify under the criteria).
6.b. Geobarometry
Geobarometry can be assessed using the compositions of clinopyroxene (Table 2; Putirka, Reference Putirka2008). From the table, the following observations can be made: (i) one gabbro sample (sample no. 1004) reveals two equilibration pressure levels at ∼16 to ∼18 kbar and ∼3 to ∼6 kbar, whereas another gabbro sample (sample no. 994a) reveals a ∼15 to ∼21 kbar equilibration pressure, and (ii) the basaltic rock (sample no. 840) indicates an equilibration pressure range corresponding to ∼15 to ∼21 kbar. It is possible that the mafic magma experienced equilibration under a range of pressures, i.e. ∼21 to ∼3 kbar, which corresponds to magma storage (and crystallization) at an upper mantle depth followed by relatively near-surface crystallization (∼3 to ∼6 kbar) due to ascent.
Since pyroxene altering to amphibole is common in mafic rocks (Stakes & Vanko, Reference Stakes and Vanko1986; Gillis, Reference Gillis1995) corresponding to hydrothermal events, Ridolfi et al. (Reference Ridolfi, Renzulli and Puerini2010) presented a unique method of pressure calculation. In the investigated cases (where clinopyroxene is dominantly converted to amphibole), the pressure evaluated through Ridolfi’s method has been furnished in Table 3. From this table, it is apparent that the pressure (corresponding to hydration environments) ranges from 0.26 to 0.35 kbar. It is, therefore, evident that the hydration event is a near-surficial condition that was imposed upon the original magma crystallization episode.
7. Discussion
7.a. Melt composition and hydration event
Clinopyroxene compositions have often been used to constrain the parental composition of mafic igneous rocks (Leterrier et al. Reference Leterrier, Maury, Thonon, Girard and Marchal1982; Loucks, Reference Loucks1990; Das et al. Reference Das, Goswami and Bhattacharyya2020). Therefore, in the present research, (relict) clinopyroxene chemistry has been used as a potential assessor to understand the nature of the parental magma. The tholeiitic/sub-alkaline character of the parent-melt composition has also been depicted in Figure 8a (Leterrier et al. Reference Leterrier, Maury, Thonon, Girard and Marchal1982), which involves a variation pattern of Ti (pfu) versus Ca + Na (pfu). Figure 8b depicts the interrelationship between Alz versus TiO2 (wt %) in Cpx where a broad arc-related affinity (Loucks, Reference Loucks1990) for the parent melt has been suggested.

Fig. 8. Variation diagrams involving pyroxene compositions to constrain parental magma composition: (a) Ti (pfu) versus Ca + Na (pfu) (Leterrier et al. Reference Leterrier, Maury, Thonon, Girard and Marchal1982); (b) Alz versus TiO2 wt % (Loucks, Reference Loucks1990). Note: From (a) it is evident that the parent magma possesses a subalkaline/tholeiitic character whereas for (b), the data plots for the pyroxene stippled field defined a compositional array that is broadly following the arc cumulate trend (Loucks, Reference Loucks1990).
The nature of the ambient conditions of amphibole formation and its stability has been established by several workers in recent years (Ridolfi et al. Reference Ridolfi, Renzulli and Puerini2010; Ridolfi & Renzulli, Reference Ridolfi and Renzulli2012; Zhang et al. Reference Zhang, Humphreys, Cooper, Davidson and Macpherson2017). It has been earlier deduced that for the present rocks, hydration events represent a near-surface (secondary) phenomenon, with progressive ingress of water into the magma chamber. As a result, the original magmatic temperature has been substantially reduced, and in the presence of water, such temperatures have been recalibrated to the range of ∼750 °C to ∼850 °C (deduced using the method of Ridolfi et al. Reference Ridolfi, Renzulli and Puerini2010) (Table 3). In this context, it would be worthwhile to assess the changed magma composition after hydration. The calibrated melt composition (corresponding to a hydration event) can be critically calculated based on equations proposed by Zhang et al. (Reference Zhang, Humphreys, Cooper, Davidson and Macpherson2017). The effects of hydration on several oxides such as SiO2, Al2O3, TiO2, MgO, CaO and K2O have been depicted in Figure 9. This figure suggests that SiO2, Al2O3 and K2O increase after hydration whereas TiO2, MgO and CaO decrease with hydration. These elevating and declining major oxide patterns (as stated above) can mainly be ascribed to the alteration of pyroxene to amphibole (Deer et al. Reference Deer, Howie and Zussman1992).

Fig. 9. Variation plots of several oxides before and after hydration of the magma. Oxide percentages before hydration were taken from M. Paul’s (first author of this paper) unpublished data, whereas data after hydration were calculated using equations provided by Zhang et al. (Reference Zhang, Humphreys, Cooper, Davidson and Macpherson2017). Left-hand panel for specimen no. 1004 (gabbro) and right-hand panel for specimen no. 840 (basalt). This diagram has been constructed to compare the compositional variation before and after hydration.
The plagioclase compositions of the mafic rocks fall mainly in the sodic plagioclase field (albite–oligoclase) of the Or–Ab–An classification (Fig. 5b). However, the plagioclase composition from the gabbroic rock occasionally retains its relict character where the composition corresponds to bytownite (Fig. 5b). It is, therefore, evident that the majority of the initially formed calcic plagioclase has been re-equilibrated to albite and oligoclase, corresponding to a shallower depth (2–3 kbar) (online Supplementary Material Table S2). It appears, therefore, that the latter hydration event has also affected the initial plagioclase chemistry. According to Hövelmann et al. (Reference Hövelmann, Putnis, Geisler, Schmidt and Golla-Schindler2010), a pressure–temperature domain in the range of 600 °C and 2 kbar in an aqueous sodium silicate environment can substantially modify calcic plagioclase (labradorite) to albite–oligoclase. This further indicates an interface-coupled dissolution–reprecipitation mechanism. Such a mineralogical transformation from calcic plagioclase to sodic plagioclase also involves the development of actinolite, chlorite and epidote assemblages (Humphris & Thompson, Reference Humphris and Thompson1978). Thus, the recorded mineralogical assemblages in the present study (relict pyroxene – actinolitic hornblende – albitic plagioclase – chlorite – epidote) clearly correspond to relatively low-temperature hydration events aided by sodium in the aqueous solution (Stünitz & Tullis, Reference Stünitz and Tullis2001; Marti et al. Reference Marti, Stünitz, Heilbronner, Plümper and Kilian2018).
The ultramafic intrusive rocks in the study area are very serpentinized. The process of serpentinization is very dominant and, therefore, recognition of any relict minerals is very difficult (except for magnetite and chromite). It is possible that the supposed initial olivine was reacted upon and destabilized in a CO2-rich environment (Olsson et al. Reference Olsson, Bovet, Makovicky, Bechgaard, Balogh and Stipp2012) and subsequently serpentinized to a great extent by the hydration event as discussed earlier (Berndt et al. Reference Berndt, Allen and Seyfried1996; D’Antonio & Kristensen, Reference D’Antonio and Kristensen2004; Lamadrid et al. Reference Lamadrid, Rimstidt, Schwarzenbach, Klein, Ulrich, Dolocan and Bodnar2017).
7.b. Quantitative evaluation of crystallization
Quantitative modelling of the crystallization history of the parent basic magma was undertaken using Petrolog3 software that involves algorithm calculations (Danyushevsky & Plechov, Reference Danyushevsky and Plechov2011). Using this software, an attempt has been made to understand mineral–melt equilibrium milieu (liquidus temperature) and the quantification of physical parameters such as density, viscosity and oxygen fugacity. The output data obtained from the Petrolog3 software are given in Table 4 and the evaluated liquidus temperatures are presented in Figure 10. It is evident from this figure that olivine ubiquitously represents the highest liquidus temperature. In the present case, the appearance of olivine in peridotite is quite expected (though overwhelmingly serpentinized), while both gabbro and basalt are devoid of olivine. It is possible that subsequent to olivine crystallization, it started reacting with the ambient liquid, leading to its complete disappearance. As a result of the olivine and liquid reaction during equilibrium crystallization, augitic clinopyroxene became the stable mineral phase. In addition to equilibrium crystallization, fractional crystallization also played an important role, which has been supported by textural evidence. Back-scattered electron images (Fig. 4b, c) clearly indicate the presence of clinopyroxene and zoned plagioclase phenocrysts set in a fine-grained groundmass in some basaltic samples, favouring fractional crystallization. Therefore, the parent magma represents a combination of both equilibrium and fractional crystallization, which is an expected behaviour in a realistic situation for crystallization of the basaltic magma (Morse, Reference Morse1980). Furthermore, the Petrolog3 software suggests an almost constant magma density (∼2.6 gm/cc) with the onset of crystallization (Table 4). The oxygen fugacity (during the magma ascent) changes from −7.7 to −6.6. The reason for such a variation needs clarification. The progressive reduction of oxygen fugacity from the bottom to the top of the magma chamber may be ascribed to heating and reduction during magma ascent. Anderson & Wright (Reference Anderson and Wright1972) suggested controversially that during the onset of magma eruption, it effervesces and suffers a reducing environment because of (i) loss of H2O, (ii) loss of SO2 and (iii) probable magma mixing. Magma effervescence during ascent is found to be a definite cause of accelerated crystallization of micro-phenocrysts, a rise in temperature and a decrease in oxidation state. The Petrolog3 software also yields liquidus temperatures (in respect of several minerals) for the investigated basaltic–mafic–ultramafic rock suites (Fig. 10). This figure suggests the possible presence of initial pigeonite for both the basalt and gabbro, but in the investigated samples, pigeonite has not been noted. Interestingly, for the ultramafic, gabbro and basaltic samples, oxide phases (such as spinel, magnetite and ilmenite) have similar liquidus temperatures (1091–876 °C) (Fig. 10; Table 4), which indicates that the oxide phases have a uniform late-phase appearance. Therefore, we conclude that the parent magma evolved through a complex history involving the interplay of repeated pulses of magma ascent, fluctuation of the crystallization condition, effervescence and possibly localized scale magma mixing.
Table 4. Various parameters related to the crystallization history of the investigated plutonic and volcanic lithologies using Petrolog3 software


Fig. 10. Output of Petrolog3 data showing calculated liquidus temperatures (in °C) for different constituent minerals for the mafic–ultramafic rock suites.
7.c. Evaluation of the tectonic setting
The evaluation of the tectonic setting for these rocks can be achieved using mineral chemistry. Given the mineralogical assemblages, clinopyroxene and spinel were considered to be the most appropriate. The petrogenesis and tectonic lineage of basaltic rocks have been derived from EPMA of augitic clinopyroxene (Beccaluva et al. Reference Beccaluva, Macciotta, Piccardo and Zeda1989). This approach has been subsequently taken up by other workers to evaluate the status of the Manipur Ophiolite suite of rocks (Ovung et al. Reference Ovung, Ray, Ghosh, Koeberl, Topa and Paul2018). EPMA data for the clinopyroxene compositions (online Supplementary Material Table S1) when plotted on an Al (pfu) versus Ti (pfu) diagram (Fig. 11a) typically suggest an island arc tholeiitic (IAT) affinity. Similar IAT parentage is indicated by the Na (pfu) versus Ti (pfu) diagram (Fig. 11b). Figure 11c represents a triangular diagram involving TiO2–SiO2/100–Na2O, which also suggests an IAT affinity for the basaltic rocks.

Fig. 11. Tectonic discrimination diagrams using pyroxene composition: (a) Al (pfu) versus Ti (pfu) diagram; (b) Na (pfu) versus Ti (pfu) diagram; (c) TiO2–SiO2/100–Na2O diagram (Beccaluva et al. Reference Beccaluva, Macciotta, Piccardo and Zeda1989; Ovung et al. Reference Ovung, Ray, Ghosh, Koeberl, Topa and Paul2018). All these diagrams suggest an overall island arc tectonic setting. WOPB – within oceanic plate basalts; MORB – mid-ocean ridge basalts; IAT – island arc tholeiites; BA-A – back-arc andesites; BON – boninites; EM – enriched mid-ocean ridge basalts; NM – normal mid-ocean ridge basalts; OIB – ocean island basalts; BABB – back-arc basin basalts.
Spinel chemistry can be used to discriminate the tectonic setting of various types of rocks (Dick & Bullen, Reference Dick and Bullen1984; Jan & Windley, Reference Jan and Windley1990; Arai, Reference Arai1992; Hirose & Kawamoto, Reference Hirose and Kawamoto1995; Kamenetsky et al. Reference Kamenetsky, Crawford and Meffre2001; Ovung et al. Reference Ovung, Ray, Teng, Ghosh, Paul, Ganguly, Sengupta and Das2017; Ishwar-Kumar et al. Reference Ishwar-Kumar, Rajesh, Windley, Razakamanana, Itaya, Babu and Sajeev2018; Sahu et al. Reference Sahu, Vishwakarma, Singh and Verma2020). In the present case, the available spinel compositions of the ultramafic rocks (online Supplementary Material Table S5), using the TiO2 (wt %) versus Al2O3 (wt %) diagram (Fig. 12a), typically indicate an arc affinity for the parent magma. A similar (island) arc affinity can also be derived from the TiO2 (wt %) versus Cr/(Cr + Al) diagram (Fig. 12b). Figure 12c involving Cr no. in spinel versus Mg no. in spinel further corroborates the tectonic setting to be akin to fore-arc peridotite. A boninitic magma chemistry (related to an arc setting) can further be derived from the Cr no. in (Spl) versus TiO2 (wt %) (Spl) diagram (Fig. 12d).

Fig. 12. Tectonic discrimination diagrams using Cr-spinel composition: (a) TiO2 wt % versus Al2O3 wt %; (b) TiO2 wt % versus Cr/(Cr + Al); (c) Cr no. versus Mg no.; (d) Cr no. versus TiO2 wt %. All these diagrams clearly suggest an island arc/boninite/fore-arc peridotite affinity relevant to the supra-subduction zone setting. For details see text and Dick & Bullen (Reference Dick and Bullen1984), Jan & Windley (Reference Jan and Windley1990), Arai (Reference Arai1992), Ishii et al. (Reference Ishii, Robinson, Maekawa, Fiske, Fryer, Pearce, Stokking, Ali, Arculus, Ballotti, Burke, Ciampo, Haggerty, Haston, Heling, Hobart, Ishii, Johnson, Lagabrielle, McCoy, Maekawa, Marlow, Milner, Mottl, Murton, Phipps, Rigsby, Saboda, Stabell, van der Lann and Xu1992), Hirose & Kawamoto (Reference Hirose and Kawamoto1995), Kamenetsky et al. (Reference Kamenetsky, Crawford and Meffre2001), Ovung et al. (Reference Ovung, Ray, Teng, Ghosh, Paul, Ganguly, Sengupta and Das2017) and Sahu et al. (Reference Sahu, Vishwakarma, Singh and Verma2020). ARC – island arc; LIP – large igneous province; OIB – ocean island basalt; MORB – mid-ocean ridge basalt; SSZ – supra-subduction zone.
8. Conclusions
The following conclusions can be drawn regarding the petrogenesis of the studied rock units:
-
(1) The Palaeoarchaean mafic–ultramafic rock suite shows a varied temperature–pressure equilibration, ranging from ∼750 °C to ∼1400 °C at ∼0.26 kbar to ∼21 kbar, which corresponds to an ascending magma that underwent a hydration event at a shallow level (Fig. 13).
-
(2) The clinopyroxene and spinel compositions indicate an arc setting for the parent magma.
-
(3) Both equilibrium and fractional crystallization prevailed during the magmatic evolution.

Fig. 13. Schematic diagram showing summary of evolution of mafic–ultramafic rock suites in the investigated areas in the light of the regional framework.
Supplementary material
To view supplementary material for this article, please visit https://doi.org/10.1017/S0016756822001170
Acknowledgements
Field work in connection with the present study was supported by a Department of Science and Technology research grant (SR/S4/ES-510/2010). The authors are thankful to the authorities of the University of Calcutta and NGRI, Hyderabad, for granting the necessary permission to carry out the research work. The authors are grateful to IIT, Bombay, for access to the EPMA facility. CM thanks Dr V. M. Tiwari, Director, CSIR-NGRI, for necessary support and co-operation. The authors are thankful to anonymous journal reviewers for their incisive comments to improve the quality of the paper.
Conflict of interest
None.


