


1. Introduction
NE China, previously tectonically referred to as the Xing-Meng Orogenic Belt (XMOB), comprises the main part of the eastern segment of the Central Asian Orogenic Belt (CAOB) and is one of the most important polymetallic metallogenic regions in China (Zeng et al. Reference Zeng, Liu, Chu, Wang, Sun, Duan and Zhou2012, Reference Zeng, Qin, Liu, Li, Zhai, Chu and Guo2015 a; Ouyang et al. Reference Ouyang, Mao, Zhou and Su2015; Wang et al. Reference Wang, Zeng, Zhang, Zhou and Qin2021) (Fig. 1). Numerous W deposits have been discovered in NE China, demonstrating the significant W metallogenic potential of this region (Ouyang et al. Reference Ouyang, Mao, Zhou and Su2015; Zeng et al. Reference Zeng, Sun, Chu, Duan and Liu2015 b; Liu et al. Reference Liu, Jiang and Bagas2016; Wang et al. Reference Wang, Bagas, Jiang and Liu2017; Zhang, X. B. et al. Reference Zhang, Yang, Chen, Wang and Xiang2017; Gao et al. Reference Gao, Zhou, Breiter, Ouyang and Liu2019; Wang, R. L. et al. Reference Wang, Zeng, Zhang, Guo and Lu2020; Xie et al. Reference Xie, Zeng, Wang, Wu, Zhang, Li and Zhang2021). At present, NE China is known to host 4 large, 18 medium and 17 small W deposits (Fig. 1c). Three W belts can be distinguished according to the distribution of the W deposits: the northern and central Great Xing’an Range W belt (NCGB), southern Great Xing’an Range W belt (SGB) and Lesser Xing’an–Zhangguangcai Range W belt (LXZB) (Xie et al. Reference Xie, Zeng, Wang, Wu, Zhang, Li and Zhang2021) (Fig. 1c).

Fig. 1. (a) simplified tectonic map of the Central Asian Orogenic Belt (modified from Liu, Y. J. et al. Reference Liu, Zhou, Tang, Wu, Li, Zhu, Jiang, Liu and Ye2017; Feng et al. Reference Feng, Liu, Li, Jin, Jiang, Li, Wen and Zhao2019). (b) schematic tectonic map of NE China (modified from Wu et al. Reference Wu, Sun, Ge, Zhang, Grant, Wilde and Jahn2011). (c) distribution of major tungsten deposits in NE China (modified from Zeng et al. Reference Zeng, Liu, Chu, Wang, Sun, Duan and Zhou2012). The black solid circles mark the sampling locations of the previously published geochronological data for W-related granitoids in NE China, which are in online Supplementary Material Table S1. Deposit locations: 1 – Narenwula; 2 – Baishitouwa; 3 – Shazigou; 4 – Tianbaogou; 5 – Shalahada; 6 – Sansheng; 7 – Halihaitu; 8 – Chamuhan; 9 – Xiaolaogualinzi; 10 – Baiyinhan; 11 – Weilasituo; 12 – Wulegeerjidaban; 13 – Dongshanwan; 14 – Daolundaba; 15 – Xiaohaiqing; 16 – Huanggang; 17 – Xiaodonggou; 18 – Wurinitu; 19 – Shamai; 20 – Dayana; 21 –Bayandulan; 22 – Weilianhe; 23 – Honghuaerji; 24 – Zishi; 25 – Guanniaohe; 26 – Weijiang; 27 – Cuihongshan; 28 – Gongpengzi; 29 – Yangbishan; 30 – Xin’antun; 31 – Baishilizi; 32 – Yangjingou; 33 – Wudaogou; 34 – Liudaogou; 35 – Xinglong; 36 – Sanjiazi. Abbreviations: NCGB – northern and central Great Xing’an Range W belt; SGB – southern Great Xing’an Range W belt; LXZB – Lesser Xing’an–Zhangguangcai Range W belt.
The SGB, situated in the southwestern part of NE China, hosts voluminous Mesozoic W deposits (Fig. 1c). All of these W deposits are spatially and genetically related to granitic intrusions (Xie et al. Reference Xie, Zeng, Wang, Wu, Zhang, Li and Zhang2021). Although some studies have been conducted on the petrogenesis of these W-related granitic plutons, the petrogenesis of the these granitoids remains controversial (Mei et al. Reference Mei, Lu, Liu, Tang, Ai, Wang and Cisse2015; Zeng et al. Reference Zeng, Sun, Chu, Duan and Liu2015 b; Wang et al. Reference Wang, Bagas, Jiang and Liu2017; Gao et al. Reference Gao, Zhou, Breiter, Ouyang and Liu2019; Yang et al. Reference Yang, Sun, Wang, Fu, Na, Fan and Hu2019). In addition, the distribution of W-related and W-barren granitoids commonly overlaps. However, because of the paucity of detailed comparative studies, the geochemical difference between the W-related and W-barren granitoids is not clear, which limits our understanding of the genetic mechanism between granitic magmatism and W mineralization. Moreover, the tectonic evolution of the SGB was essential for the spatial and temporal distribution of W-related granitoids and related deposits. Romer & Kroner (Reference Romer and Kroner2016) highlighted that different tectonic settings may have led to the input of mantle melt or the emplacement of ultrahigh-temperature metamorphic rocks, which were crucial for metal extraction from the source rocks, thus playing a critical role in controlling the discontinuous distribution of W mineralization within the belt. However, the overprinting of the Palaeo-Asian Ocean (PAO), Mongol–Okhotsk Ocean (MOO) and Palaeo-Pacific Ocean (PPO) tectonic regimes had significant influence on the SGB during late Mesozoic time, which has led to disagreements on the interpretation of the deep geodynamic processes and limited our understanding of regional W-related granitic magmatism and W mineralization. Several models have been proposed for the SGB tectonic setting during late Mesozoic time, including (a) upwelling of a mantle plume (Wang, T. et al. Reference Wang, Ge, Yang, Zhang, Bi, Tian and Xu2015), (b) post-orogenic gravitational collapse and/or subduction-induced back-arc extension related to the closure of the MOO (Wang, Z. H. et al. Reference Wang, Ge, Yang, Zhang, Bi, Tian and Xu2015; Fritzell et al. Reference Fritzell, Bull and Shephard2016; Guan et al. Reference Guan, Liu, Wang, Wang, Wang, Shi and Chen2018; Ji et al. Reference Ji, Ge, Yang, Wang, Zhang, Wang and Bi2018, Reference Ji, Liu and Li2020; Han et al. Reference Han, Wang, Wang, Wang and Zhang2021; Shi et al. Reference Shi, Wang, Ma, Li, Li and Wang2020; Wei et al. Reference Wei, Lv and Wang2021), (c) arc/back-arc extension and asthenosphere upwelling induced by subduction of the PPO (Ji et al. Reference Ji, Meng, Wan, Zhu, Ge, Zhang, Yang and Dong2019; Li, S. Z. et al. Reference Li, Suo, Li, Zhou, Santosh, Wang, Wang, Guo, Yu, Lan, Dai, Zhou, Cao, Zhu, Liu, Jiang, Wang and Zhang2019; Suo et al. Reference Suo, Li, Jin, Zhang, Zhou, Li, Wang, Liu, Wang and Somerville2019; He et al. Reference He, Tan, Liu, Bai, Wang, Wang and Zhong2020; Sun et al. Reference Sun, Li, Sun, Ding, Wang, Li and Wang2020; Wang, L et al. Reference Wang, Tang, Zhang, Santosh, Pei, Cao and Liu2020; Wei et al. Reference Wei, Zou, Huang, Jiang, Zhu and Wu2020; Jing et al. Reference Jing, Yang, Ge, Dong, Ji, Jing, Bi and Zhou2021), and (d) compositional effects resulting from the closure of the MOO and subduction of the PPO (Ouyang et al. Reference Ouyang, Mao, Zhou and Su2015; Liu, C. F. et al. Reference Liu, Zhou, Tang, Wu, Li, Zhu, Jiang, Liu and Ye2017; Liu et al. Reference Liu, Jiang, Bagas, Chen, Han and Wan2020; Pang et al. Reference Pang, Guo, Zhang, Zhu, Hou, Wen and Han2020; Zhang, C. et al. Reference Zhang, Quan, Zhang, Liu, Li, Wang, Qian, Zhang and Ge2020; Mi et al. Reference Mi, Lü, Zhao, Yan, Yu and Dong2021). Additionally, although researchers generally agree that the disappearance of the PAO occurred along the Solonker–Xar Moron–Changchun Fault (SXCF), the closure time of the PAO remains ambiguous (Liu, Y. J. et al. Reference Liu, Zhou, Tang, Wu, Li, Zhu, Jiang, Liu and Ye2017). There are two different models: one popular model suggests that the closure occurred during late Permian to Early Triassic times (Chen et al. Reference Chen, Jahn, Wilde and Xu2000; Zhai & Santosh, Reference Zhai and Santosh2013; Ju & Hou, Reference Ju and Hou2014; Xiao & Santosh, Reference Xiao and Santosh2014; Han et al. Reference Han, Zhou, Wang and Cao2015; Liu & Nie, Reference Liu and Nie2015; Wilde, Reference Wilde2015), while another model dates the closure to the pre-Permian period (Zhang, X. H. et al. Reference Zhang, Ge, Wu, Wilde, Yang and Liu2008; Shi et al. Reference Shi, Liu, Miao, Zhang, Jian, Zhang, Hou and Xu2010; Xu, B. et al. Reference Xu, Charvet, Chen, Zhao and Shi2013, Reference Xu, Zhao, Wang, Liao, Luo, Bao and Zhou2015; Xu, W. L. et al. Reference Xu, Pei, Wang, Meng, Ji, Yang and Wang2013; Li, Y. L. et al. Reference Li, Zhou, Brouwer, Xiao, Wijbrans, Zhao, Zhong and Liu2014).
The Narenwula complex is situated in the southwestern section of the SGB and is adjacent to the boundary between the XMOB and the North China Craton (NCC) (Fig. 1c), comprising granodiorite, monzogranite and granite porphyry. The monzogranite and granite porphyry are W-bearing granitoids, while the granodiorites are W-barren granitoids. Therefore, the Narenwula complex provides an excellent opportunity to understand the genesis and geochemical differences between W-related and W-barren granitoids, and more importantly, the link between granitic magmatism and W mineralization. It also provides an avenue to investigate the tectonic evolution and geodynamic setting for the formation of the W-related granitoids and associated deposits in the SGB, which have great significance for the further exploration of W deposits in this region. In this paper, we report field and petrographic observations, zircon U–Pb dating, whole-rock geochemistry and zircon Hf isotopic data for the mafic microgranular enclaves (MMEs), their host granodiorites and W-bearing granitoids from the Narenwula complex. We use these data to constrain the petrogenesis and geochemical differences of the granodiorites and W-bearing granitoids, as well as their relationship to W mineralization. The findings provide insights into the tectonic evolution of the SGB during late Permian and Late Jurassic times and advance our understanding of the regional W-related tectonic–magmatic–metallogenic mechanism.
2. Geological background and sampling
Tectonic components of the XMOB include the Erguna Block (EB), Xing’an Block (XB), Songliao–Xilinhot Block (SXB), Khanka–Jiamusi Block (KJB) (from NW to SE) and Liaoyuan Terrane (LT) in the south (Wu et al. Reference Wu, Sun, Ge, Zhang, Grant, Wilde and Jahn2011; Liu, Y. J. et al. Reference Liu, Li, Feng, Wen, Neubauer and Liang2017) (Fig. 1b). The Xinlin–Xiguitu Fault (XXF) represents the boundary between the EB and XB, the Hegenshan–Heihe Fault (HHF) separates the XB and SXB, the Mudanjiang Fault (MF) represents the boundary between the SXB and KJB, and the SXCF is the boundary between the SXB and LT (Wu et al. Reference Wu, Sun, Ge, Zhang, Grant, Wilde and Jahn2011; Liu, Y. J. et al. Reference Liu, Li, Feng, Wen, Neubauer and Liang2017) (Fig. 1c). Throughout the Phanerozoic Eon, the XMOB underwent a complex tectonomagmatic evolution involving multiple stages of accretion and collision (Sengör et al. Reference Sengör, Natal’in and Burtman1993). During the Palaeozoic Era, the XMOB was controlled by the PAO tectonic regime, which led to the amalgamation of several micro-continental blocks, multi-arc systems and accretionary complexes (Wu et al. Reference Wu, Sun, Ge, Zhang, Grant, Wilde and Jahn2011; Xiao & Santosh, Reference Xiao and Santosh2014). Since the Mesozoic Era, the XMOB has been affected mainly by the closure of the MOO and subduction of the PPO, leading to the widespread occurrence of Mesozoic volcanic rocks and coeval granitic intrusions (Wu et al. Reference Wu, Sun, Ge, Zhang, Grant, Wilde and Jahn2011).
The SGB, located in the southwestern part of NE China, extends north to Heilongjiang and Jilin provinces, and east to the Songliao Basin. This area is tectonically bordered by the HHF to the north, the Chifeng–Kangbao Fault (CKF) to the south and the Nenjiang–Balihan Fault (NBF) to the east (Xie et al. Reference Xie, Zeng, Wang, Wu, Zhang, Li and Zhang2021) (Fig. 1c). The oldest formation in this region is a Palaeozoic medium- to high-grade metamorphic complex, dominantly composed of amphibolite gneiss, granite gneiss and mica schist. Several Ordovician–Silurian, Devonian and Carboniferous detrital metasedimentary units, carbonate rocks and volcanic formations occur in this region. Permian volcano-sedimentary formations, consisting of carbonaceous clastic rocks, carbonate rocks and mafic to intermediate–acidic volcanic rocks, are also abundant and act as the host rocks for many of the mineral deposits (Ouyang et al. Reference Ouyang, Mao, Zhou and Su2015). Voluminous late Palaeozoic to Mesozoic granitic plutons intrude the Palaeozoic strata, which are overlain by Mesozoic volcano-sedimentary sequences. Recent geochronological data suggest that granitic magmatic events within the SGB can be subdivided into two stages: during the first stage, late Palaeozoic intrusions comprising diorite, tonalite and granodiorite were mainly distributed throughout the western part of the region and emplaced from 321 to 250 Ma based on the zircon U–Pb ages (Fig. 1c); during the second stage, Mesozoic granites, composed of granodiorite, monzonitic granite, granite porphyry and syenogranite, were emplaced from 150 to 131 Ma based on zircon U–Pb ages (Wu et al. Reference Wu, Sun, Ge, Zhang, Grant, Wilde and Jahn2011; Wan et al. Reference Wan, Lu, Zeng, Mohammed, Liu, Dai and Chen2019).
The Narenwula region in the southwestern SGB features large-scale W polymetallic mineralization (Fig. 2). This region has local exposures of Proterozoic–early Palaeozoic leptite, granulite, metasandstone, slate, phyllite, schist and crystalline limestone. The widely exposed lower Permian and Jurassic strata consist of intermediate–acid volcanic rocks, volcaniclastic rocks and sedimentary clastic rocks (IMBGMR, 1991). The intrusive rocks mainly include late Permian, Triassic, Early–Middle Jurassic and Late Jurassic granitic intrusions (Fig. 2). The widespread late Permian felsic intrusive rocks intrude into the Proterozoic–lower Palaeozoic strata. The rock types mainly include granodiorite and quartz diorite. A Triassic granitic pluton is locally exposed in the southwestern part of this region, related to the W mineralization in the Tantoushan deposit (unpub. data). Early–Middle Jurassic granitoids mainly occur in the western part of the region, with minor occurrences in the eastern part, comprising fine-grained and minor biotite granite. Late Jurassic granitoids are common in the central and western parts of this region, mainly composed of monzogranite and granite porphyry (IMBGMR, 1991) (Fig. 2).

Fig. 2. Simplified geological map of the Narenwula region (after IMBGMR, 1991).
The Narenwula quartz-vein type W polymetallic deposit (42° 25′ N, 114° 31′ E) is situated in the southwestern part of the SGB (Fig. 2). This deposit has estimated reserves of 89 950 t WO3 with a grade of 0.776 %. The strata exposed in the mining area are mainly the lower Permian Sanmianjing and Erlitu formations and Quaternary sediments (Fig. 3). The Sanmianjing Formation contains tuff, silt-slate, sandstone and conglomerate. The Erlitu Formation consists of andesite, tuff and sedimentary tuff (IMBGMED, 2016). These rocks are intruded by the Narenwula complex (Fig. 3). The orebodies mainly occur as veins in the monzogranite and granite porphyry (Fig. 3b, c).
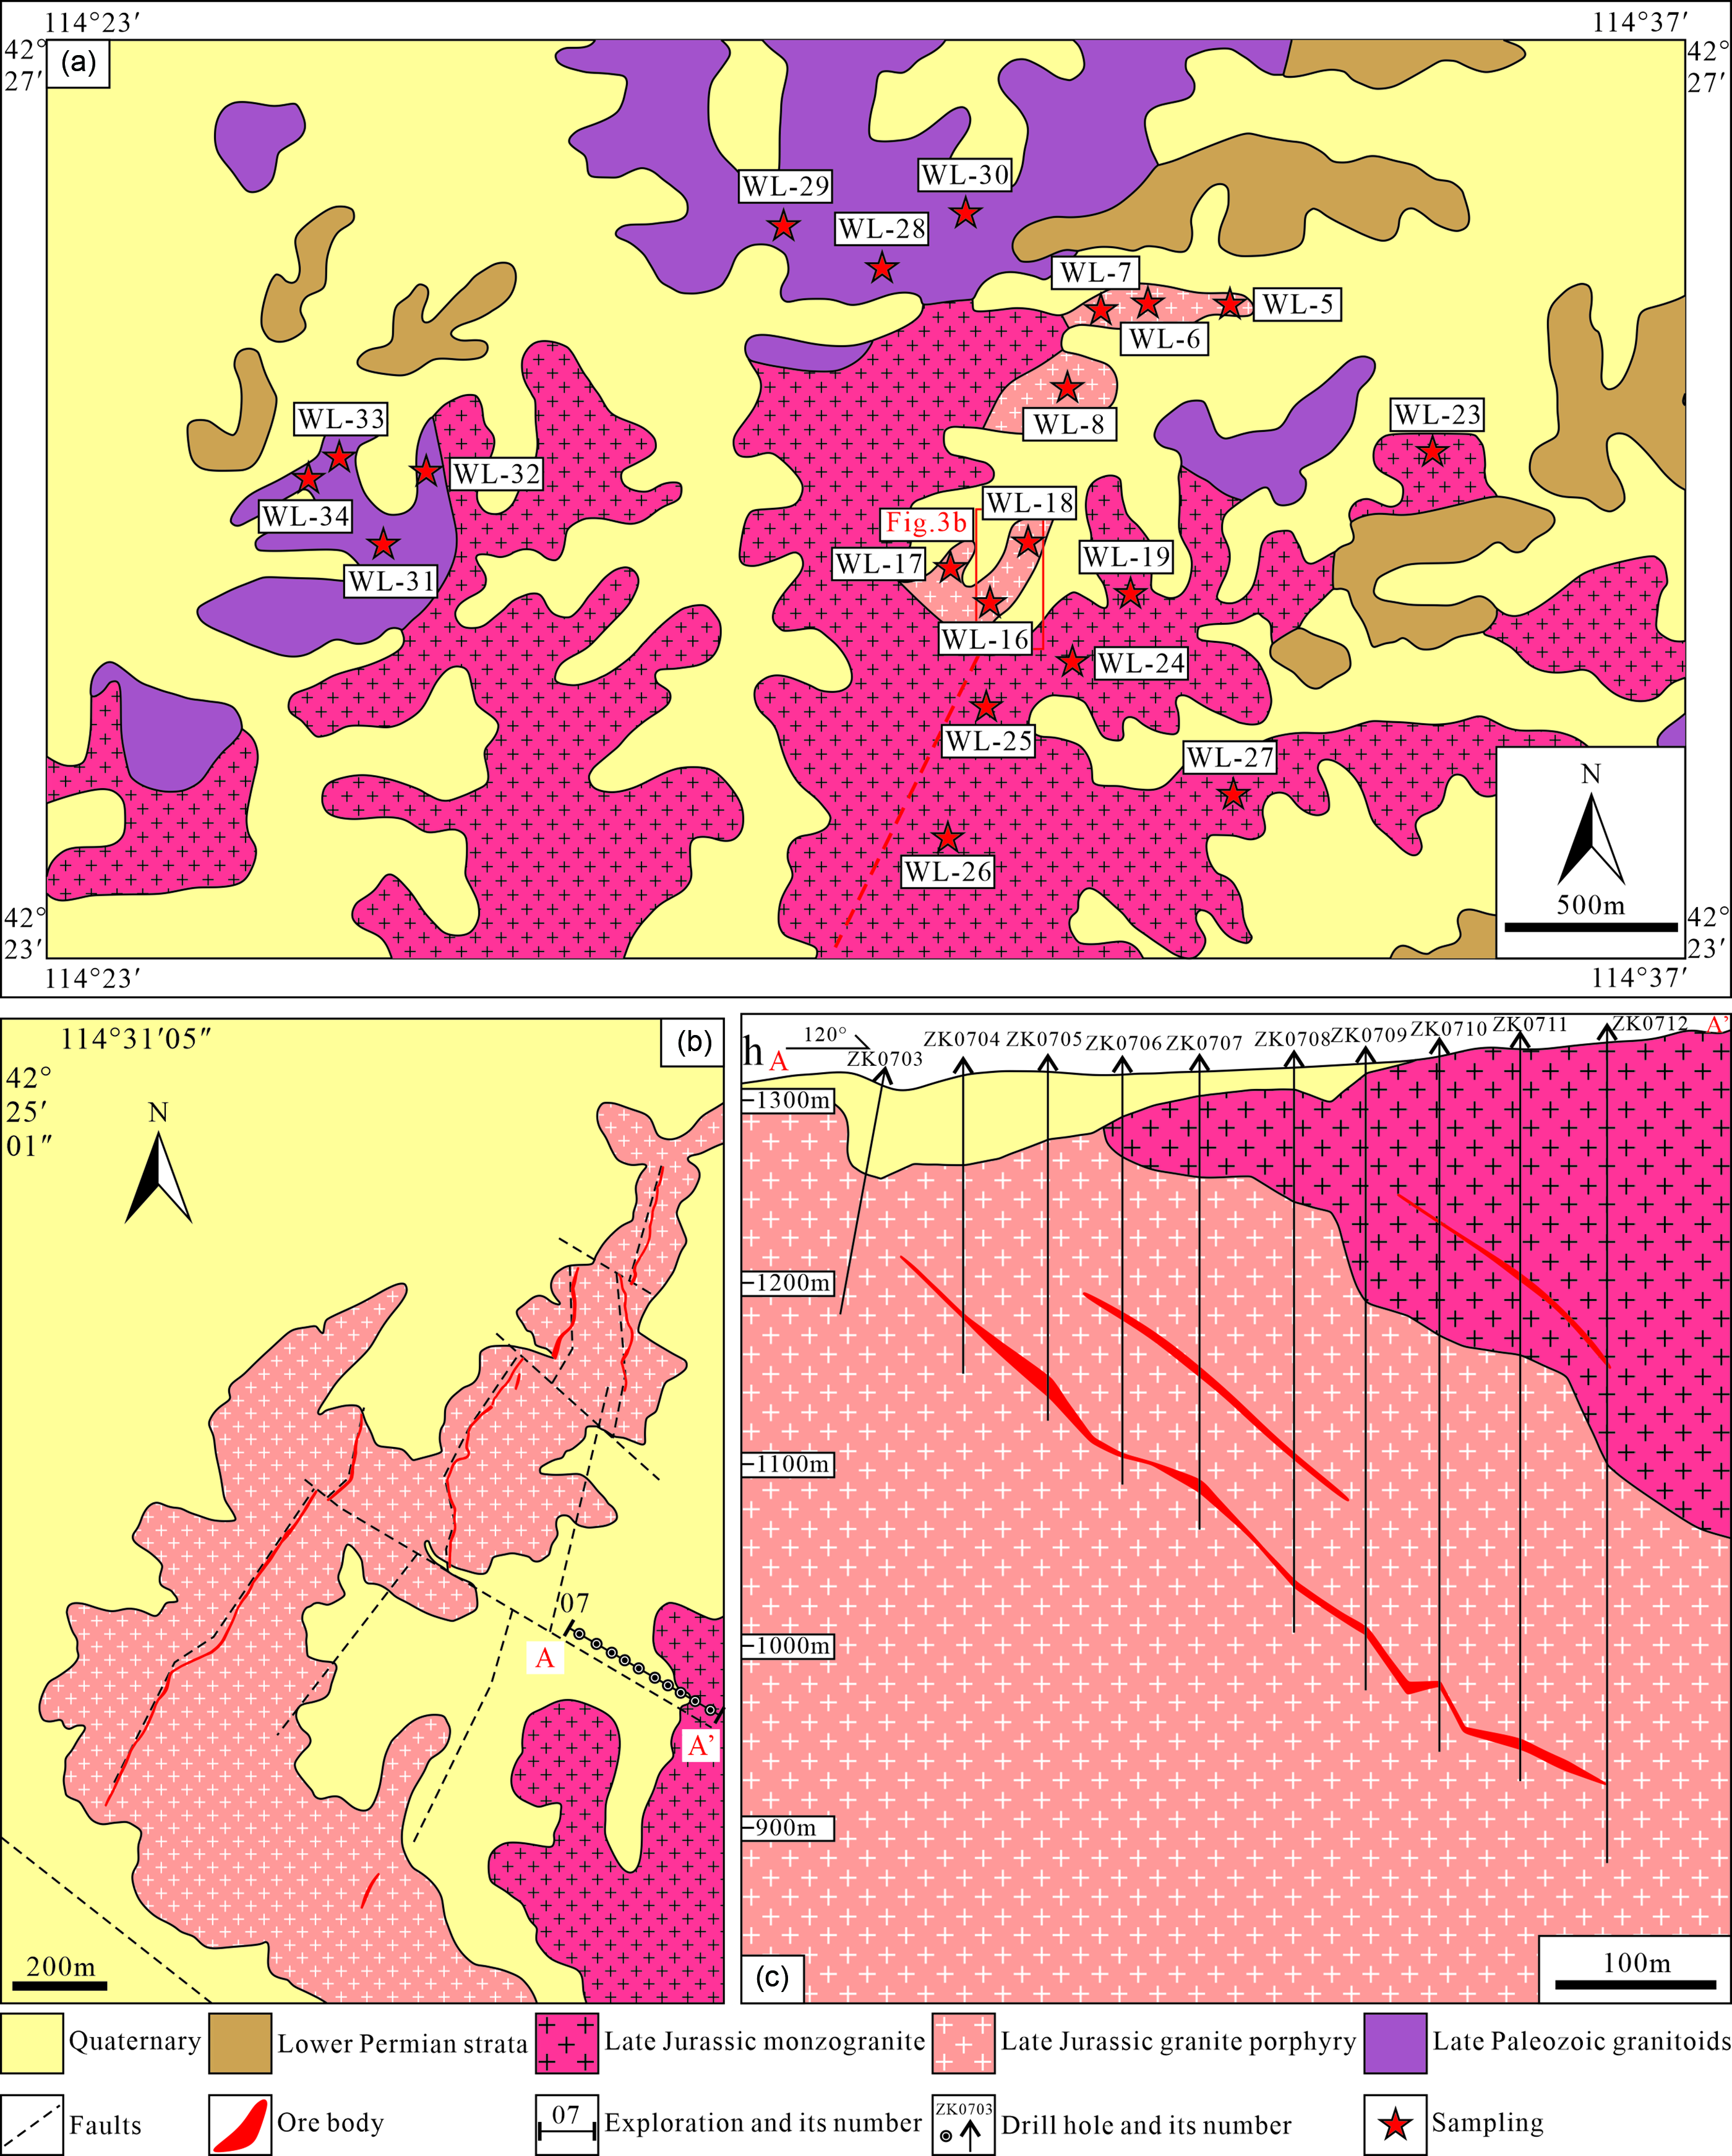
Fig. 3. (a, b) Geological map of the Narenwula deposit showing the sampling locations. (c) Schematic geological cross-section of no. 07 exploration line (after IMBGMED, 2016).
The granodiorite unit (samples WL-28, WL-29, WL-30, WL-31, WL-32-2 and WL-32-3) is grey-white to pale red in colour and shows a hypidiomorphic granular texture, with a massive structure (Fig. 4a–c). It contains plagioclase (0.5–2 mm; 60–65 %), quartz (0.5–1 mm; ∼20–25 %), hornblende (0.4–1 mm; ∼10 %), biotite (0.8–1.5 mm; 5–10 %) and alkali feldspar (∼0.5 mm; < 5 %). MMEs are common in the granodiorites from the complex. The MME samples (samples WL-33-2, WL-34 and WL-34-2) are dark grey in colour and exhibit a porphyritic or hypidiomorphic granular texture (Fig. 4d, e). The phenocrysts (15–25 % rock mass) comprise plagioclase (0.5–3 mm; ∼25–45 %), biotite (0.5–3.5 mm; ∼25–35 %) and a low proportion of hornblende (0.5–1.5 mm; ∼20 %). The matrix is mainly composed of hornblende, plagioclase, biotite, minor pyroxene, aphanitic minerals and magnetite.

Fig. 4. Lithologic characteristics and representative photographs (crossed-polarized light) of granitoids and MMEs from the Narenwula complex. (a–c) Granodiorite. (d, e) Mafic microgranular enclaves in granodiorite. (f–i) Monzogranite. (j–l) Granite porphyry. Abbreviations: Pl – plagioclase; Kfs – potassium feldspar; Hbl – hornblende; Qtz – quartz; Bt – biotite. Length of hammer for scale is ∼330 mm.
The monzogranite and granite porphyry are the ore-bearing rocks (Fig. 3b, c). The monzogranite unit (samples WL-5, WL-19, WL-23, WL-24, WL-25, WL-26-1 and WL-27) is red in colour and displays a hypidiomorphic granular texture, with a massive structure (Fig. 4f–i). It consists of quartz (1–2.5 mm; 30–40 %), alkali feldspar (1.5–2.5 mm; 25–35 %), plagioclase (0.8–1.5 mm; 15–20 %) and biotite (1–1.5 mm; < 5 %), along with accessory minerals. The granite porphyry unit (samples WL-6, WL-7-2, WL-8-2, WL-16, WL-17, WL-18 and WL-26-2) is pale red in colour with a porphyritic texture (Fig. 4j–l). The phenocrysts are mainly anhedral quartz (0.5–2 mm; ∼15–20 %), subhedral to euhedral alkali feldspar (1–2.5 mm; ∼15–20 %) and plagioclase (0.5–1 mm; ∼5–10 %). The groundmass (∼50 %) consists of quartz, plagioclase, alkali feldspar and biotite.
Eighty-five orebodies have been discovered in the mining district. NE-trending faults mainly control the orebodies (Fig. 3b), which dip to the SE at an angle of 30–48°. The individual orebodies have a length of 300–1010 m, thickness of 1.00–5.35 m and slope depth of 100–636 m. The ore structures are massive, disseminated and in the form of veinlets. The ore minerals are mainly wolframite, bismuthinite, cassiterite and pyrite, with minor amounts of sphalerite, galena, chalcopyrite, argentite and pyrrhotite. The gangue minerals are predominantly quartz with varying amounts of muscovite, biotite, apatite, plagioclase, K-feldspar, sericite and carbonate. Wall-rock alteration consists of silicification, sericitization, K-feldspathization, greisenization, chloritization, epidotization and kaolinization.
3. Analytical methods
3.a. Zircon U–Pb dating
Zircons from four representative granitoid samples and one MME sample from the Narenwula complex were analysed using laser ablation inductively coupled plasma mass spectrometry (LA-ICP-MS) U–Pb dating. Figure 3a shows the sampling locations. The samples were analysed at the mineral separation laboratory at the Regional Geology Minerals Investigation Research Institute, Hebei Province, China. Zircon grains were collected using conventional density and magnetic separation techniques before handpicking under a binocular microscope. Transmitted and reflected microscopy images were then collected to examine the exterior structures while cathodoluminescence (CL) images were collected to examine the internal textures in the zircon to identify and select points on each grain suitable for U–Pb analyses.
LA-ICP-MS U–Pb dating analyses were conducted at the Institute of Geology and Geophysics, Chinese Academy of Sciences. The operating conditions for the laser ablation system and ICP-MS instrument, including the data reduction methods, are similar to those reported by Liu et al. (Reference Liu, Gao, Hu, Gao, Zong and Wang2010). Laser sampling was performed using a GeoLasPro laser coupled with an Agilent 7700e ICP-MS instrument. A laser spot size of 32 μm and a laser repetition rate of 6 Hz were used during the analyses. Quantitative calibration for the trace-element analyses and U–Pb dating was performed using the ICPMSDataCal software (Liu et al. Reference Liu, Gao, Hu, Gao, Zong and Wang2010). Zircon 91500 was used as the external U–Pb dating standard and analysed twice every five analyses. The single point analytical error for the isotopic ratios and ages is reported at the 1σ level. Concordia diagrams were constructed using the ISOPLOT software (Ludwig, Reference Ludwig2003).
3.b. In situ zircon Hf isotope analyses
In situ zircon Hf isotopic analyses were conducted at Beijing Createch Testing Technology Co., Ltd, Beijing, China, using a Thermo Scientific Neptune (Plus) multi-collector-ICP-MS (MC-ICP-MS) coupled to a New Wave 213 nm solid-state laser ablation system. The analyses were conducted on the same zircon grains that were previously analysed for U–Pb isotopes. The laser ablation beam was 35 μm in diameter, with a 10 Hz laser repetition rate and laser energy of 10–11 J cm−2. Ablated material was injected into the MC-ICP-MS with a high-purity He carrier gas. Details on the instrumental conditions and data acquisition protocols are reported by Hou et al. (Reference Hou, Li, Zou, Qu, Shi and Xie2007). The 176Hf/177Hf ratio was normalized to 179Hf/177Hf = 0.7325. Hafnium isotopic data were age-corrected using a 176Lu decay constant of 1.867 × 10⁻¹¹ a–1 (Söderlund et al. Reference Söderlund, Patchett, Vervoort and Isachsen2004). The ϵHf(t) values and Hf model ages were calculated using the methods reported by Bouvier et al. (Reference Bouvier, Vervoort and Patchett2008) and Griffin et al. (Reference Griffin, Wang, Jackson, Pearson, O’Reilly, Xu and Zhou2002), respectively.
3.c. Major- and trace-element analyses
After combining samples from the hand-picked specimens with those selected for microscopic photography, weathered surfaces were removed and the samples were ground in an agate mill to 200-mesh. Concentrations of the major (ME-XRF26d analytical package) and trace (ME-MS81 analytical package) elements were determined at ALS Chemex, Guangzhou, China. Major-element analyses were performed using X-ray fluorescence (XRF) with a PANalytical PW2424 instrument. Approximately 0.5 g of crushed whole-rock power were dissolved using LiNO3, and a glass bead was then produced after fusion. According to the measured values of the GSR-1 standard, uncertainties were less than 5 %. Trace-element concentrations were determined using a Perkin Elmer Elan 9000 ICP-MS instrument. Approximately 50 mg of crushed whole-rock powder were dissolved using a LiBO2/Li2B4O7 mixture at ∼1025 °C. The solution was then extracted after cooling and diluted with HF, HCl and HNO3 before measurement. External standards BHVO-1 and G-2 were used to monitor drift in the mass response during measurement. The precision was generally better than 10 % for most trace elements.
4. Results
4.a. Zircon U–Pb ages
The dating results for four granitic samples and one MME from the Narenwula complex are listed in Table 1. Figure 5 shows representative CL images of the zircon grains. These samples contain some fine-grained colourless-to-light yellow zircon crystals with an adamantine lustre. The grains commonly occur as short columns, with a small portion exhibiting elliptical or irregular shapes, with sizes ranging from 80 to 200 μm and length-to-width ratios of 1–3. Most of the zircon grains exhibit growth zoning without a core–rim structure, as shown in the CL images (Fig. 5). All zircons have high Th/U ratios (0.51–2.09), indicating a magmatic origin (Belousova et al. Reference Belousova, Griffin, O’Reilly and Fisher2002).
Table 1. Zircon LA-ICP-MS U–Pb dating data for the Narenwula complex and MMEs
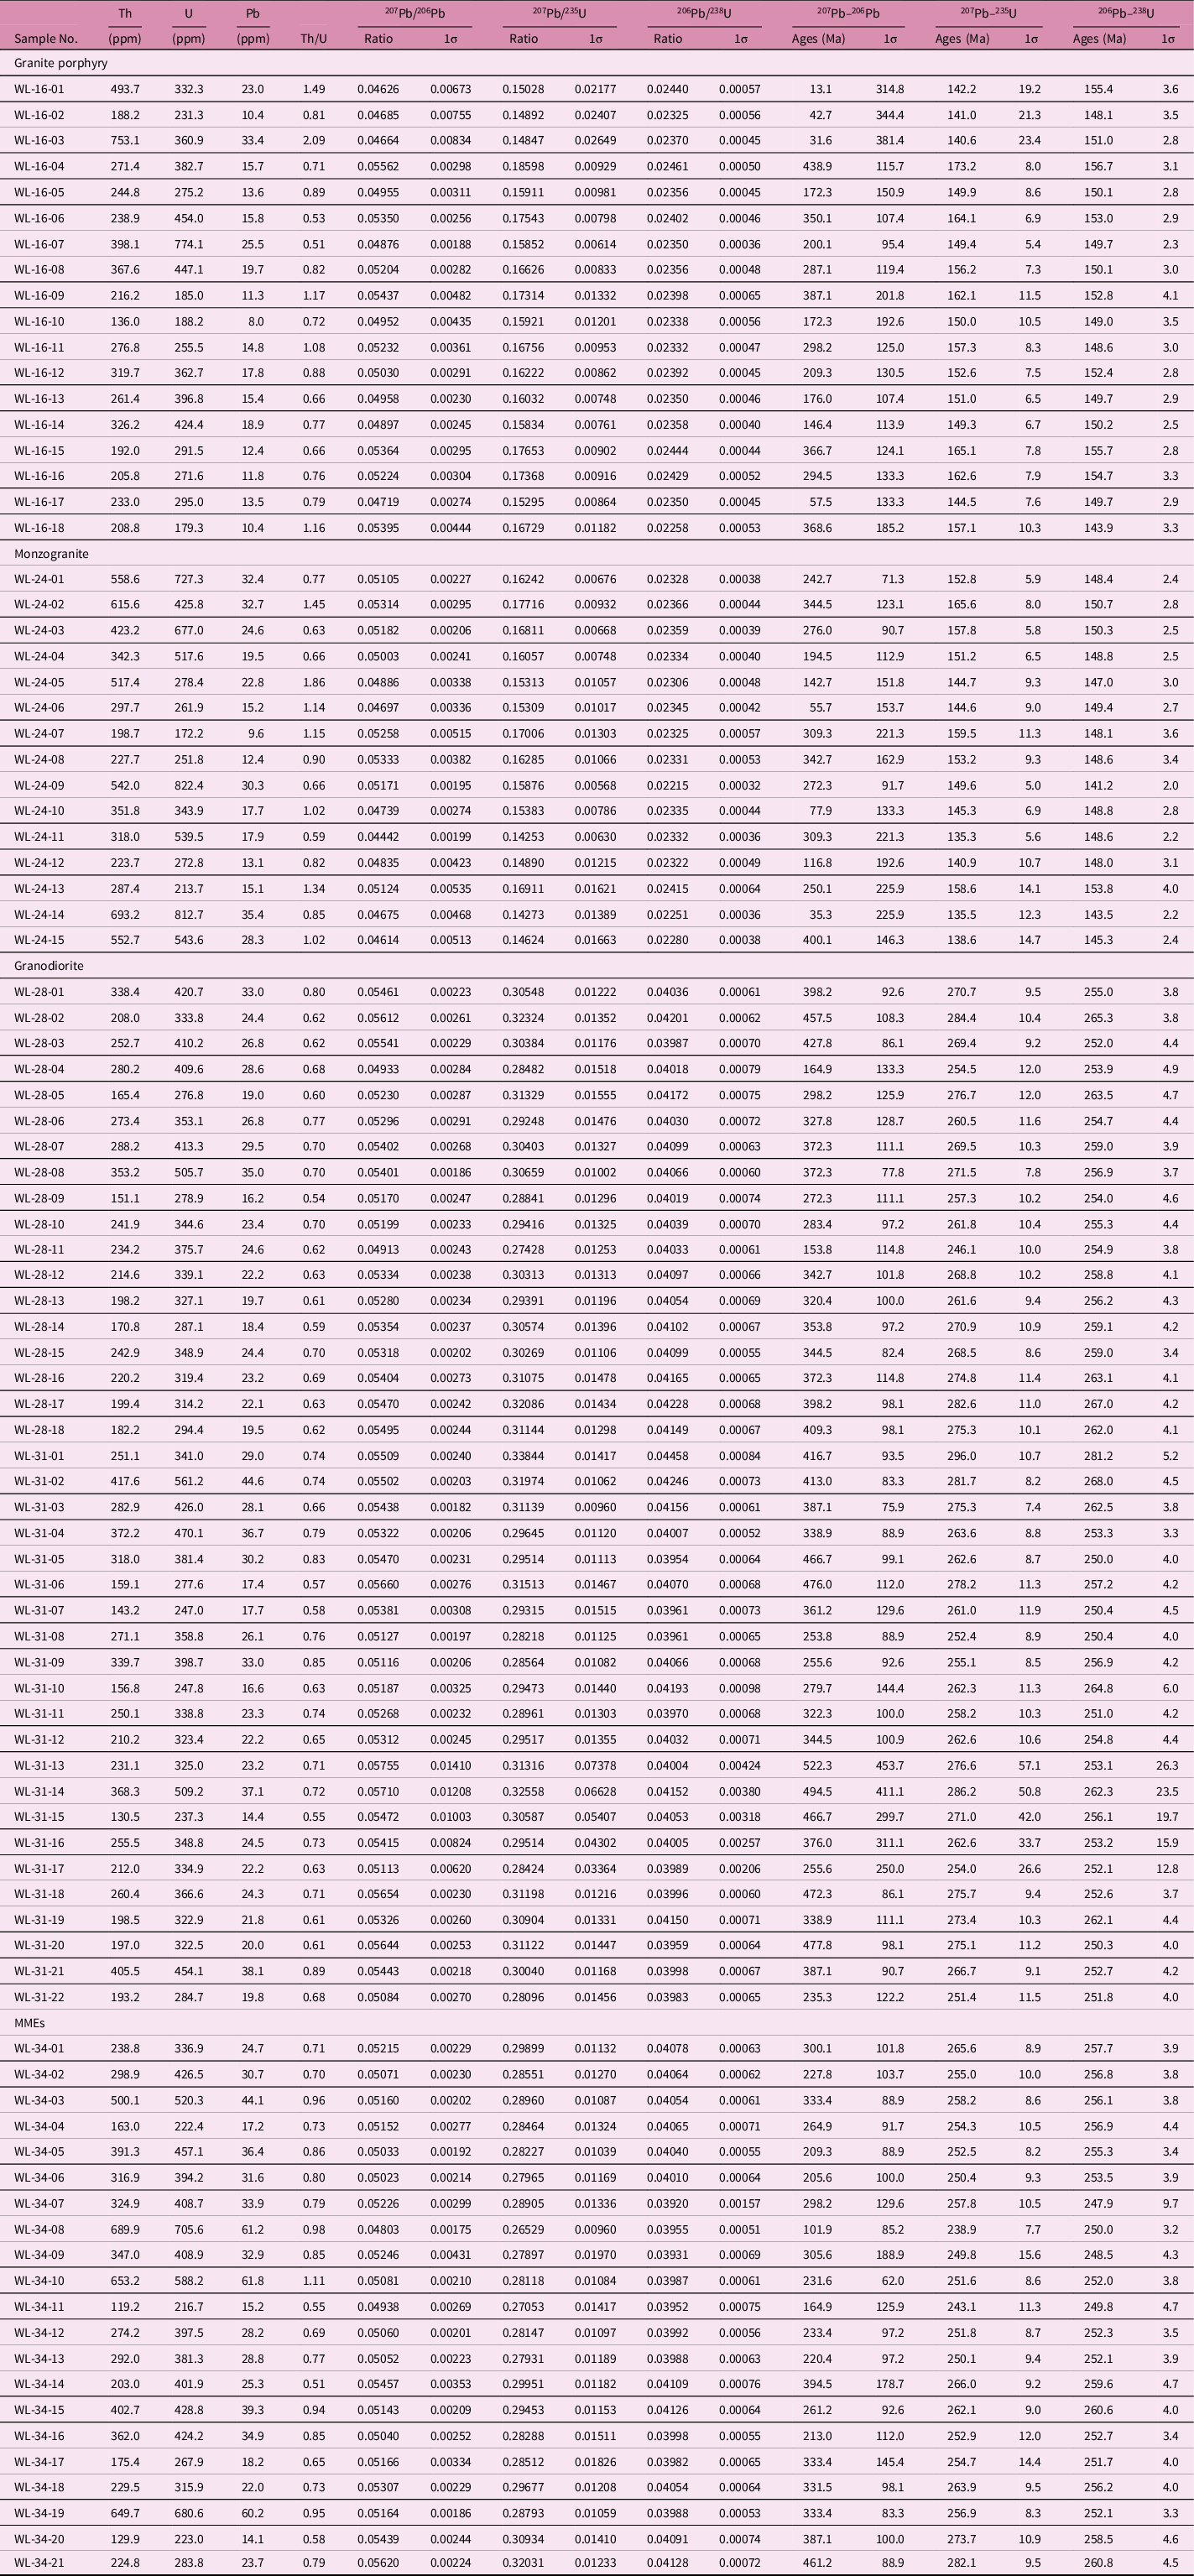

Fig. 5. CL images of selected zircons from the representative granitic intrusions and MMEs from the Narenwula complex. Red solid circles are the locations of U–Pb analyses and dashed circles are the locations of Hf analyses.
For granite porphyry sample WL-16, with three grains showing 206Pb–238U age outliers (155.4 Ma for WL-16-1, 156.7 Ma for WL-16-4 and 143.9 Ma for WL-16-18), 15 analytical spots showed a tight concordant grouping, yielding a weighted mean 206Pb–238U age of 149.8 ± 2.7 Ma (1σ, MSWD = 0.23), which is the crystallization age of the granite porphyry (Fig. 6a).

Fig. 6. (a–e) Zircon U–Pb Concordia diagrams for the granitoids and MMEs from the Narenwula complex. (f) Histogram and probability plot of the zircon U–Pb ages of W-related granitoids in NE China. Abbreviations: NCGB – northern and central Great Xing’an Range belt; SGB – southern Great Xing’an Range belt; LXZB – Lesser Xing’an–Zhangguangcai Range belt. Data sources are listed in online Supplementary Material Table S1.
One analysis result was excluded from the mean calculations owing to the discordant values for monzogranite sample WL-24. The remaining 14 points plot along a Concordia line with 206Pb–238U ages between 143.5 and 153.8 Ma, yielding a weighted mean 206Pb–238U age of 148.1 ± 2.1 Ma (1σ, MSWD = 0.35), which can be interpreted as the magmatic crystallization age of the monzogranite (Fig. 6b).
For granodiorite sample WL-28, all 18 analytical spots exhibit a tight concordant grouping with 206Pb–238U ages ranging from 252 to 267 Ma, yielding a weighted mean 206Pb–238U age of 258.5 ± 1.9 Ma (1σ, MSWD = 0.23), interpreted as the crystallization age of the granodiorite (Fig. 6c).
For granodiorite sample WL-31, with two grains showing 206Pb–238U age outliers (281.2 Ma for WL-31-1 and 264.8 Ma for WL-31-10), 20 analytical spots showed a tight concordant grouping, defining a weighted mean 206Pb–238U age of 254.7 ± 2.1 Ma (1σ, MSWD = 1.2), interpreted as the crystallization age of the granodiorite (Fig. 6d).
The result of one zircon was excluded from the age calculation owing to the discordant values for the MME sample WL-34. The remaining 20 points plot along a Concordia line with 206Pb–238U ages varying from 248.5 to 260.8 Ma, yielding a weighted mean 206Pb–238U age of 253.9 ± 2.7 Ma (1σ), which is interpreted as the MME emplacement age. This crystallization age is identical, within acceptable error, to that of the host granodiorites obtained in this study (Fig. 6e).
4.b. In situ zircon Hf isotopes
Table 2 lists the zircon Hf isotope data for the Late Jurassic W-bearing granitoids (samples WL-16 and WL-24), late Permian barren granitoids (samples WL-28 and WL-31) and MMEs (sample WL-34). The results show that zircon grains from the Late Jurassic W-bearing granitoids (WL-16 and WL-24) have relatively consistent Hf isotopic compositions, with initial 176Hf/177Hf ratios ranging from 0.282512 to 0.282618, ϵHf(t) values from –6.0 to –2.1, and two-stage model ages (TDM2) varying from 1338 to 1583 Ma. The zircon grains separated from the late Permian barren granitoids (samples WL-28 and WL-31) yielded 176Hf/177Hf values of 0.282631–0.282711, corresponding to ϵHf(t) values between +0.4 and +3.6 and TDM2 ages of 1067–1256 Ma. The initial 176Hf/177Hf ratios of zircon from the MMEs (sample WL-34) vary from 0.282623 to 0.282720. The calculated ϵHf(t) values range from +0.1 to +3.5, with corresponding TDM1 and TDM2 ages of 778–903 Ma and 1061–1272 Ma, respectively. On a ϵHf(t) versus age diagram (Fig. 7), all analysed spots from the Late Jurassic W-bearing granitoids plot below the chondritic uniform reservoir (CHUR) line. In contrast, samples from the late Permian barren granitoids all extend between the depleted mantle and CHUR line, similar to zircons from the Phanerozoic igneous rocks found in the eastern CAOB. The MME samples conformably plot between the depleted mantle and CHUR line.
Table 2. Hf isotopic compositions of zircons from the Narenwula complex and MMEs


Fig. 7. ϵHf(t) versus age (t) diagrams for granitic intrusions and MMEs from the Narenwula complex. Abbreviations: CAOB – Central Asian Orogenic Belt; YFTB – Yanshan Fold and Thrust Belt (Yang et al. Reference Yang, Wu, Shao, Wilde, Xie and Liu2006).
4.c. Whole-rock major- and trace-element compositions
Table 3 lists the whole-rock major- and trace-element data for the late Permian barren granodiorite and hosting MMEs, as well as the Late Jurassic W-bearing monzogranite and granite porphyry samples.
Table 3. Major (wt %) and trace-element (ppm) compositions of the Narenwula complex and MMEs

Note: Mg no. = 100 × Mg/(Mg + Fe2+); A/CNK = Al/(Ca + Na + K) in molar; A/NK = Al/(Na + K) in molar; δEu = EuN/(SmN × GdN)1/2
The late Permian barren granodiorites have the following major elemental concentrations: SiO2 = 67.24–70.72 wt %, Al2O3 = 14.30–15.46 wt %, total alkalis (K2O + Na2O) = 5.91–6.45 wt %, Fe2O3 T = 3.08–4.41 wt %, CaO = 2.65–3.98 wt %, P2O5 = 0.08–0.11 wt % and TiO2 = 0.29–0.38 wt %. Their MgO content is 1.06–1.60 wt %, with Mg no. values of 40.54–41.82. Comparatively, the MMEs in the granodiorite have the following major elemental concentrations: SiO2 = 55.53–58.03 wt %, Al2O3 = 16.76–17.08 wt %, total alkalis (K2O + Na2O) =5.96–6.57 wt %, Fe2O3 T = 8.21–9.16 wt %, CaO = 5.04–5.33 wt %, P2O5 = 0.23–0.25 wt % and TiO2 = 0.77–0.97 wt %. The MMEs have high MgO contents of 3.27–3.66 wt % and Mg no. values of 44.10–44.18. The Late Jurassic W-bearing monzogranite and granite porphyry have the following major elemental concentrations: SiO2 = 73.73–75.65 wt %, Al2O3 = 12.86–13.82 wt %, total alkalis (K2O + Na2O) = 8.40–9.14 wt %, Fe2O3 T = 1.08–1.46 wt %, CaO = 0.46–0.79 wt %, P2O5 = 0.02–0.05 wt % and TiO2 = 0.09–0.15 wt %. They have low MgO contents of 0.12–0.21 wt % and Mg no. values of 18.04–22.17.
On a total alkalis versus SiO2 diagram (Middlemost, Reference Middlemost1994), most monzogranite and granite porphyry samples plot in the granite field (Fig. 8a). The granodiorite samples plot in the granodiorite field, while the MMEs plot in the diorite and monzodiorite fields (Fig. 8a). On a K2O versus SiO2 diagram (Peccerillo & Taylor, Reference Peccerillo and Taylor1976), the MMEs and granodiorite plot in the calc-alkaline field while the monzogranite and granite porphyry plot in the high-K calc-alkaline to shoshonite fields (Fig. 8b). On an A/NK (molar Al2O3/(Na2O + K2O)) versus A/CNK (molar Al2O3/(CaO + Na2O + K2O)) diagram (Maniar & Piccoli, Reference Maniar and Piccoli1989), all MME samples can be classified as metaluminous rocks, with A/CNK ratios of 0.91–0.92 (Fig. 8c). Comparatively, most granodiorite sample spots plot near the weakly peraluminous field, with A/CNK ratios of 0.99–1.12 (Fig. 8c). All monzogranite and granite porphyry samples plot in the weakly peraluminous field, with A/CNK ratios of 1.03–1.11 (Fig. 8c).

Fig. 8. (a) TAS (total alkali silica) diagram (after Middlemost, Reference Middlemost1994). (b) K2O versus SiO2 diagram (after Peccerillo & Taylor, Reference Peccerillo and Taylor1976). (c) A/NK versus A/CNK diagram (after Maniar & Piccoli, Reference Maniar and Piccoli1989). (d) Rb–Ba–Sr diagram (after El Bouseily & El Sokkary, Reference El Bouseily and El Sokkary1975). (e) Sr/Y versus Y diagram (after Defant & Drummond, Reference Defant and Drummond1990). (f) (La/Yb)N versus YbN diagram (after Defant & Drummond, Reference Defant and Drummond1990). Abbreviations: HFGs – highly fractionated granites; NGs – normal granites.
On a chondrite-normalized rare earth element (REE) diagram, all MMEs, granodiorite, monzogranite and granite porphyry samples exhibit light REE (LREE) enrichment and heavy REE (HREE) depletion, with (La/Yb)N ratios of 5.59–6.19, 11.67–14.03, 6.79–16.56 and 9.65–14.99, respectively (Fig. 9a; Table 3). The granodiorites show slight negative Eu anomalies (Eu/Eu* = 0.87–0.98) while the MMEs have moderate negative Eu anomalies (Eu/Eu* = 0.66). Comparatively, the monzogranite and granite porphyry display significant negative Eu anomalies (Eu/Eu* = 0.28–0.52) (Fig. 9a; Table 3). On a primitive-mantle-normalized trace-element diagram (Sun & McDonough, Reference Sun, McDonough, Saunders and Norry1989), all granodiorite and MME samples are characterized by enrichment in large-ion lithophile elements (LILEs; e.g. Rb, Th, K and Pb), and depletion in high field strength elements (HFSEs; e.g. Nb, Ta, P and Ti) (Fig. 9b). Comparatively, most monzogranite and granite porphyry samples exhibit stronger negative Ba, Sr, P and Ti anomalies than the granodiorite and MMEs (Fig. 9b).

Fig. 9. (a) Chondrite-normalized REE patterns and (b) primitive-mantle-normalized trace-element spider diagrams for the granitic intrusions and MMEs from the Narenwula complex (normalization values are from Sun & McDonough, Reference Sun, McDonough, Saunders and Norry1989).
5. Discussion
5.a. Timing of magmatism and associated W mineralization
Constraints on the timing and duration of ore-related magmatic events are crucial for understanding ore deposit formation, from both academic and economic viewpoints (Stein, Reference Stein, Turekian, Holland and Scott2014). In the study area, the barren granodiorites, which yield emplacement ages of 258.5–254.7 Ma (late Permian), record a pre-mineralization magmatic event. The W-bearing monzogranite and granite porphyry were emplaced after the barren granodiorite, yielding zircon U–Pb ages of 148.1 ± 2.1 Ma and 149.8 ± 2.7 Ma, respectively. Considering the Mesozoic extensive and intense W mineralization event in NE China, W mineralization at Narenwula was not an isolated event. Previous geochronological studies reported a wide range of ages for the W-related granitic intrusions in NE China. The LXZB experienced widespread W-related tectonomagmatic events during Early Triassic and Early and Middle Jurassic times, with the emplacement of granitoids such as the Yangjingou scheelite deposit (249.4 Ma) (Zhao, Reference Zhao2014), Cuihongshan W–Mo–Pb–Zn–(Fe–Cu) ore district (199.8–172.3 Ma) (Liu, Reference Liu2009; Shao et al. Reference Shao, Li and Yang2011; Hu et al. Reference Hu, Ding, He, Yao, Zhu, Shen and Chen2014; Fei et al. Reference Fei, Zhang, Cheng, Santosh, Jin, Wen, Li and Xu2018), Gongpengzi Cu–Zn–W polymetallic ore district (173.28 and 173.46 Ma) (Li, Y. S. et al. Reference Li, Yu, Mi, Carranza, Liu, Jia and He2019), Xing’antun W–Mo ore district (195.4 Ma) (Wang et al. Reference Wang, Gao, Ren, Chen, Wang and Zheng2019), Sanjiazi scheelite ore district (172.4 Ma) (Ren et al. Reference Ren, Niu, Wang and Lei2009) and Baishilizi W ore district (198.3 Ma) (Zhao, Reference Zhao2014). The W-related intrusive rocks in the NCGB mainly have Early–Middle Jurassic and Late Jurassic – Early Cretaceous ages, including granitoids dominated by monzogranite, quartz monzonite and biotite granite from the Honghuaerji W polymetallic ore district (179.4–178.6 Ma) (Xiang et al. Reference Xiang, Wang, Qin, She, Han, Guan and Kang2014; Guo et al. Reference Guo, Li, Chang, Han, Dong, Yang, Tian, She, Xiang and Kang2015), biotite granite and biotite monzogranite from the Shamai W ore district (153.0–139.1 Ma) (Jiang et al. Reference Jiang, Bagas, Hu, Han, Chen, Liu and Kang2016; Li et al. Reference Li, Fu, Tang, Li, Lin, Zhang, Wang, Zhao, Dang and Zhao2016), granite from the Weilianhe region (143 Ma) (Xiang et al. Reference Xiang, Chen, She, Li and Li2018), fine-grained granite, granite porphyry and monzogranite from the Wurinitu region (139.7–131.9 Ma) (Liu et al. Reference Liu, Deng, Kong, Xu, Zhao, Luo and Li2011; Yang et al. Reference Yang, Wang, Liu, Wang, Wang, Kang, Zhang and Zhao2016; Zhang et al. Reference Zhang, Cheng, Yao, Bai and Li2016), and biotite monzogranite and quartz porphyry from the Dayana W–Mo ore district (135–130 Ma) (Xiang et al. Reference Xiang, Chen, Bagas, She, Kang, Yang and Li2016). The timing of the late Mesozoic W-related granitic magmatism in the SGB mainly indicates a Late Jurassic – Early Cretaceous age, including granitoids dominated by granite porphyry from the Dongshanwan Mo–W ore district (142.2 and 151.4 Ma) (Zeng et al. Reference Zeng, Sun, Chu, Duan and Liu2015 b; Zhang, X. B. et al. Reference Zhang, Wang, Wang, Li, Yu, Wang, Li, Wan and Huang2017), granite from the Xiaodonggou Mo–W ore district (142 Ma) (Qin et al. Reference Qin, Liu, Zeng and Luo2009; Zeng et al. Reference Zeng, Liu, Qin and Zhang2010), quartz porphyry, monzogranite and granite from the Weilasituo Sn–W–Cu–Zn ore district (140–135.7 Ma) (Liu et al. Reference Liu, Jiang and Bagas2016, Reference Liu, Wu, Li, Chen, Wu, Zhang, Zhang, Jiang and Liu2018; Zhai et al. Reference Zhai, Liu, Li, Zhang, Li, Fu, Jiang, Ma and Qi2016; Zhu et al. Reference Zhu, Zhang, Fu, Li, Wang, Jiao and Sun2016; Yang et al. Reference Yang, Sun, Wang, Fu, Na, Fan and Hu2019), and granite from the Sansheng W–Mo ore district (136 Ma) (Zhou, Reference Zhou2013) and the Daolundaba Cu–W–Sn ore district (135 Ma) (Chen et al. Reference Chen, Wu, Li, Liu, Wu, Zhang, Zhang and Chen2018).
To obtain a more comprehensive understanding of W-related granitic magmatism in NE China, we integrated the results obtained in this study with previously published zircon U–Pb ages to distinguish three periods of W-related granitic magmatism: Early Triassic, Early–Middle Jurassic and Late Jurassic – Early Cretaceous (online Supplementary Material Table S1; Fig. 6f). Early Triassic W-related granitoids, with isotopic ages of 250–245 Ma, rarely occur in the LXZB. Early–Middle Jurassic W-related granitoids are widely distributed in the LXZB and scattered throughout the NCGB, ranging in age from 200 to 170 Ma. Late Jurassic – Early Cretaceous W-related granitoids are widely exposed in the SGB, whereas there are minor occurrences in the NCGB, with ages ranging from 155 to 125 Ma (Figs 1c, 6f). The Late Jurassic granitic magmatism and W mineralization in Narenwula are consistent with the regional Late Jurassic to Early Cretaceous W-related tectonomagmatic–hydrothermal events.
5.b. Petrogenesis of the MMEs and host granodiorite
5.b.1. MMEs
MMEs are commonly observed in calc-alkaline granitic plutons, and can provide crucial insights into the petrogenesis of the host plutons (Didier, Reference Didier1973; Chappell, Reference Chappell1996; Barbarin, Reference Barbarin2005; Li, R. et al. Reference Li, Collins, Yang, Blereau and Wang2021). Four models have been proposed to interpret the genesis of MMEs in granitoids: (a) recrystallized and residual phase assemblages (Chappell et al. Reference Chappell, White and Wyborn1987; Chen et al. Reference Chen, Price and White1989; Chappell & White, Reference Chappell and White1992; White et al. Reference White, Tarney, Kerr, Saunders, Kempton, Pringle and Klaver1999); (b) xenoliths of the surrounding rock (Maas et al. Reference Maas, Nicholls and Legg1997; Bonin, Reference Bonin2004); (c) cognate mafic accumulation in the felsic host magma (Tindle & Pearce, Reference Tindle and Pearce1983; Clemens & Wall, Reference Clemens and Wall1988; Dodge & Kistler, Reference Dodge and Kistler1990; Collins et al. Reference Collins, Wiebe, Healy and Richards2006), and (d) products of magma mixing between mafic components and felsic magma (Yang et al. Reference Yang, Wu, Chung, Wilde and Chu2004; Barbarin, Reference Barbarin2005; Clemens & Stevens, Reference Clemens and Stevens2012).
The MMEs from the granodiorite display a porphyritic or hypidiomorphic granular texture without metamorphic or sedimentary textures (Fig. 4d, e). All MMEs contain the same mineral assemblages as the host granodiorites, but with increased mafic and plagioclase components relative to other felsic components (Fig. 4d, e). These textual features and identical zircon U–Pb ages between the MMEs and host granodiorites provide evidence against a residual or xenolith origin. Additionally, the lack of cumulate textures in the MMEs indicates that they are not mafic mineral cumulates (Didier, Reference Didier1973; Vernon, Reference Vernon2014). The MMEs show complex and diverse shapes: many are irregularly ellipsoidal with sharp contacts with the host granitoids, and show ductile deformation (Fig. 4a). This phenomenon can imply significant contrasts in both temperature and viscosity between the injected mafic and host melts that may have been caused by the rapid cooling of the mafic melt (Sarjoughian et al. Reference Sarjoughian, Kananian, Haschke, Ahmadian, Ling and Zong2012). Plagioclase with a sieve texture was also observed in the MMEs (Fig. 4e), which is thought to be the result of the partial melting of feldspar after it entered the mafic magma at a higher temperature (Castro et al. Reference Castro, Patiño Douce, Corretgé, De La Rosa, El-Biad and El-Hmidi1999). Hence, we suggest that the petrogenesis of the MMEs involved a magma mixing process.
Although magma mixing (as well as fractionation) processes compositionally modified the injected mafic melts, their geochemistry and zircon Hf isotope compositions can still provide constraints on their origin. The MMEs have lower SiO2 (55.53–58.03 wt %), but higher MgO (3.27–3.66 wt %) and Fe2O3 T (8.21–9.16 wt %) contents, as well as Mg no. values (44.10–44.18), than common crust-derived melts (Rapp & Watson, Reference Rapp and Watson1995; Patiño Douce, Reference Patiño Douce, Castro, Fernandez and Vigneresse1999), demonstrating that the parental mafic melts were unequivocally derived from an ultramafic mantle. The MMEs are characterized by enrichment in LREEs and LILEs (Rb, Th, K and Pb), but depletion in HREEs and HFSEs (Nb, Ta, P and Ti) (Fig. 9a, b). The MMEs have high Y (29.20–29.70 ppm) and YbN (15.76–16.29) concentrations, whereas they have low Sr/Y (10.03–10.96) and (La/Yb)N (5.59–6.19) ratios (Fig. 8e, f). Additionally, these MMEs have uniform zircon Hf isotopic compositions, with positive ϵHf(t) values from +0.1 to +3.5 (Fig. 7). These characteristics are similar to those of normal arc magmas (Defant & Drummond, Reference Defant and Drummond1990; McDonough & Sun, Reference McDonough and Sun1995), indicating an isotopically enriched lithospheric mantle source modified by fluid/melt-related metasomatism associated with subduction. Furthermore, the metasomatism was likely dominated by slab-derived fluids rather than sediments and associated melts, as indicated by the high Ba/Th (87.79–130.99) and Ba/La (32.34–35.90), and low Th/Nb (0.51–0.78) and Th/Yb (2.36–2.87) ratios (Ribeiro et al. Reference Ribeiro, Stern, Kelley, Martinez, Ishizuka, Manton and Ohara2013). In summary, we suggest that the Narenwula MMEs likely formed as the products of mixed mafic and felsic magmas. The mafic magmas may have been derived from the partial melting of an enriched lithospheric mantle metasomatized by slab-derived fluids.
5.b.2. Host granodiorites
We propose that the host granodiorites are I-type granitoids (Chappell & White, Reference Chappell and White1992) based on the following observations: (1) they contain minerals typical of I-type granitoids (e.g. hornblende and biotite) (Fig. 4b, c); (2) they are metaluminous to weakly peraluminous with A/CNK ratios of 0.99–1.12 (Fig. 8c) and have high CaO contents (2.65–3.98 wt %) (Chappell, Reference Chappell1999; Frost et al. Reference Frost, Barnes, Collins, Arculus, Ellis and Frost2001); (3) their low Rb/Sr (0.21–0.42) and Rb/Ba (0.10–0.14), but high K/Rb ratios (227.73–230.39) are similar to those of I-type granites and inconsistent with those of S-type granites (Whalen et al. Reference Whalen, Currie and Chappell1987); (4) 10 000 Ga/Al ratios (1.92–2.01; Fig. 10) are less than 2.6, and the Zr + Nb + Ce + Y contents of the samples (163.90–212.40) are less than 350 ppm (Whalen et al. Reference Whalen, Currie and Chappell1987); and (5) the TZr of the samples is estimated at 776–785 °C, much lower than that of A-type granitoids in this study (Watson & Harrison, Reference Watson and Harrison1983). According to the above evidence, we propose that the host granodiorites of the Narenwula complex are I-type granitoids.

Fig. 10. (a) (Na2O + K2O–CaO) versus SiO2 diagram (after Frost et al. Reference Frost, Barnes, Collins, Arculus, Ellis and Frost2001). (b) K2O + Na2O, (c) (K2O + Na2O)/CaO, (d) FeOT/MgO, (e) Ce and (f) Nb versus 10 000 × Ga/Al discrimination diagrams of Whalen et al. (Reference Whalen, Currie and Chappell1987).
The granodiorite samples are enriched in LREEs and LILEs (Rb, Th, K and Pb) but depleted in HREEs and HFSEs (Nb, Ta, P and Ti) (Fig. 9a, b). They have high Y (13.30–15.00 ppm) and YbN (7.41–8.12) concentrations, but low Sr/Y (20.38–24.59) and (La/Yb)N (11.67–14.03) ratios (Fig. 8e, f). These geochemical characteristics are identical to those of normal arc magmas (Defant & Drummond, Reference Defant and Drummond1990). The granodiorite samples have higher MgO (1.06–1.60 wt %) and Fe2O3 T (3.08–4.41 wt %) contents, as well as Mg no. values (40.54–41.82), compared to common crustal-derived melts (Rapp & Watson, Reference Rapp and Watson1995; Patiño Douce, Reference Patiño Douce, Castro, Fernandez and Vigneresse1999). Moreover, geochemical evidence suggests the mixing of mantle- and crustal-derived components. The Nb/Ta, Zr/Hf and Rb/Sr ratios of these granodiorite samples vary from 10.51 to 13.81, 37.10 to 40.88, and 0.21 to 0.42, respectively, which are between those of the crust (Nb/Ta = 11.4, Zr/Hf = 33.0 and Rb/Sr > 0.5) and mantle (Nb/Ta = 17.8, Zr/Hf = 37 and Rb/Sr = 0.03–0.047) (McDonough & Sun, Reference McDonough and Sun1995; Taylor & McLennan, Reference Taylor and McLennan1995; Rudnick & Gao, Reference Rudnick, Gao, Holland and Turekian2003). The geochemical data for the host granodiorites and MMEs also support a magma mixing origin (Fig. 11). The samples define hyperbolic mixing arrays in the MgO/Al2O3 versus SiO2/CaO diagram (Fig. 11a). The Fe2O3 T/SiO2 versus CaO/SiO2 diagram (Fig. 11b) also exhibits an array suggesting that the mixing of distinct magma occurred during the evolution of the samples. In the Fe2O3 T versus MgO diagram (Fig. 11c), the samples do not plot along the fractional crystallization trend but near the mixing line between mantle and crustal magmas. These trends are consistent with two-component mixing and are in accordance with field and petrographic evidence (e.g. the chilled margin and plagioclase with sieve texture). The granodiorite samples have positive and homogeneous zircon ϵHf(t) values (+0.4 to +3.6) with two-stage model ages of 1067–1256 Ma, indicating its derivation from Mesoproterozoic juvenile lower crust. However, large volumes of the c. 1.3–1.0 Ga crust have not been reported beneath the Narenwula area or the northern NCC. The identification of spinel lherzolite in the lithospheric mantle beneath the northern NCC, distinct from the cratonic lithospheric mantle, indicates that the ancient cratonic lithospheric mantle was partially modified before or at 1.3 Ga and transferred as a part of a relatively young, fertile, thin and hot lithospheric mantle (Klemme & O’Neill, Reference Klemme and O’Neill2000). Thus, the granodiorites were mostly generated by the partial melting of the Mesoproterozoic juvenile lower crust with varying contributions from mantle-derived magmas. Notably, the zircon grains from the MMEs have a similar morphology and ϵHf(t) values (+0.1 to +3.5) to those of zircon grains from the host granodiorites (ϵHf(t) from +0.4 to +3.6), indicating the isotopic equilibrium between them due to the magma mixing processes (Vernon, Reference Vernon1984; Vernon et al. Reference Vernon, Etheridge and Wall1988; Elburg, Reference Elburg1996; Barbarin, Reference Barbarin2005) (Figs 5, 7). On a Rb–Ba–Sr diagram (El Bouseily & El Sokkary, Reference El Bouseily and El Sokkary1975), most granodiorite samples plot in the normal granite field (Fig. 8d), indicating that limited fractional crystallization occurred during the formation of the granodiorites. Moreover, in the primitive mantle-normalized trace-element diagrams (Fig. 9b), the negative Nb, Ta, P and Ti values may reflect the separation of Ti-bearing minerals and apatite. In summary, the host granodiorites and MMEs formed by the mixing of felsic (derived from the partial melting of the juvenile lower crust) and mafic melts (derived from the partial melting of the mantle that had been metasomatized by slab-derived fluids), while these hybrid magmas subsequently underwent limited fractional crystallization.

Fig. 11. Element correlation diagrams of mafic microgranular enclaves and host granodiorites from the Narenwula complex (after Zorpi et al. Reference Zorpi, Coulon, Orsini and Cocirta1989; Berzina et al. Reference Berzina, Berzina and Gimon2014; Yang et al. Reference Yang, Ge, Zhao, Dong, Xu, Ji and Yu2015).
5.c. Petrogenesis of the W-bearing monzogranite and granite porphyry
We propose that the W-bearing monzogranite and granite porphyry are A-type granitoids based on the following observations: (1) the lower P2O5 concentration (0.02–0.05 wt %) and absence of phosphate minerals (King et al. Reference King, White, Chappell and Allen1997; Bonin, Reference Bonin2007); (2) the high K2O + Na2O contents (8.40–9.14 wt %), Ga concentrations (18.70–21.80 ppm) (Fig. 10a; Table 3), ∑REE and Ga/Al ratios (2.61–3.01), and low Eu, Ba, Sr, P and Ti contents (Fig. 9a, b); (3) the plotting of most samples in the A-type granite field (Fig. 10b–f) on the discrimination diagrams (Whalen et al. Reference Whalen, Currie and Chappell1987); (4) their moderate Al2O3 contents, while their A/CNK values mainly range from 1.03 to 1.11, showing a weakly peraluminous nature (Fig. 8c); and (5) the TZr of the samples is 812–822 °C, much higher than that of I-type granitoids (TZr = 764–781 °C) but similar to that of A-type granitoids (TZr = 839 °C) (Watson & Harrison, Reference Watson and Harrison1983).
Although A-type granites are commonly associated with extensional tectonic settings, their origin remains controversial. Several models have been proposed to decipher the origin of A-type granites: (a) direct fractionation of mantle-derived alkaline basalts (Turner et al. Reference Turner, Foden and Morrison1992, Reference Turner, Arnaud, Liu, Rogers, Hawkesworth, Harris, Kelley, Van Calsteren and Deng1996; Mushkin et al. Reference Mushkin, Navon, Halicz, Hartmann and Stein2003), (b) mixing between crust-derived granitic magmas and mantle-derived mafic magmas (Bedard, Reference Bedard1990; Kerr & Fryer, Reference Kerr and Fryer1993; Mingram et al. Reference Mingram, Trumbull, Littman and Gerstenberger2000), and (c) partial melting of crust-sourced rocks (Collins et al. Reference Collins, Beams, White and Chappell1982; Clemens et al. Reference Clemens, Holloway and White1986; Skjerlie & Johnston, Reference Skjerlie and Johnston1993; King et al. Reference King, White, Chappell and Allen1997).
Experimental studies indicate that mantle melting cannot directly produce silica-rich magmas; that is, only small quantities of silica-rich rocks can be generated by the differentiation of mafic mantle-derived magmas (Hirose, Reference Hirose1997). Current researchers have come to a consensus that if a granitic magma is generated by direct fractional crystallization of a mantle-derived magma, it should be possible to observe a complete evolutionary sequence from mafic to felsic rocks (e.g. Turner et al. Reference Turner, Foden and Morrison1992; Mushkin et al. Reference Mushkin, Navon, Halicz, Hartmann and Stein2003; Litvinovsky et al. Reference Litvinovsky, Jahn and Eyal2015). However, intermediate–felsic and felsic rocks are more widespread than mafic rocks in the Narenwula region (Fig. 2). Therefore, we can exclude the scenario where W-bearing granitoids originated from the direct fractionation of mantle-derived alkaline basalts. Furthermore, the absence of MMEs and mafic compositions precludes the magma mixing scenario between crust- and mantle-derived magmas, which indicates a crustal source genesis for A-type granites.
The W-bearing granitoids are enriched in LREEs and LILEs (Rb, Th, U, K and Pb), depleted in HREEs, Ba, Sr and HFSEs (Nb, Ta, P and Ti), and show significantly negative Eu anomalies (0.28–0.52). All these characteristics are likely derived from the continental crust (Harris et al. Reference Harris, Pearce, Tindle, Coward and Reis1986; Sun & McDonough, Reference Sun, McDonough, Saunders and Norry1989). They have high Y (13.20–33.40 ppm) and YbN (6.59–20.94) concentrations, but low Sr/Y (2.21–7.31) and (La/Yb)N (6.79–16.56) ratios, consistent with arc rocks (Fig. 8e, f). They contain a SiO2 content of 73.73–75.65 wt %, with lower Mg no. values (18.04–22.17) than those of mantle-generated magma (Mg no. > 70) (Rudnick & Gao, Reference Rudnick, Gao, Holland and Turekian2003); however, these values are consistent with those of crust-derived melts (Mg no. < 40) (Rapp & Watson, Reference Rapp and Watson1995). Additionally, the Ti/Zr and Ti/Y ratios are 3.48–7.19 and 16.15–55.22, respectively, consistent with those of crust-derived rocks (Ti/Zr < 20 and Ti/Y < 200) (Wedepohl, Reference Wedepohl1995). The Th/Ce, Th/La, Lu/Yb and Rb/Sr ratios are 0.42–0.72, 0.82–1.50, 0.16–0.19 and 2.76–4.60, respectively, which are significantly higher than the values of primitive mantle (Th/Ce = 0.02–0.05, Th/La = 0.12, Lu/Yb = 0.14–0.15 and Rb/Sr = 0.03–0.047) (Sun & McDonough, Reference Sun, McDonough, Saunders and Norry1989), but similar to those of crustal rocks (Th/Ce > 0.15, Th/La > 0.30, Lu/Yb = 0.16–0.18 and Rb/Sr > 0.5) (Sun & McDonough, Reference Sun, McDonough, Saunders and Norry1989; Rudnick & Gao, Reference Rudnick, Gao, Holland and Turekian2003; Plank, Reference Plank2005). Moreover, the Nb/Ta, Zr/Hf and Ta/U ratios are 6.13–12.39, 26.81–31.74 and 0.07–0.95, respectively, which are closer to the values of the crust (Nb/Ta = 11.4, Zr/Hf = 33.0 and Ta/U = ∼1.1) (Sun & McDonough, Reference Sun, McDonough, Saunders and Norry1989; Taylor & McLennan, Reference Taylor and McLennan1995) than those of primitive mantle (Nb/Ta = 17.8, Zr/Hf = 37.0 and Ta/U = ∼2.7) (McDonough & Sun, Reference McDonough and Sun1995), indicating a crustal component in the magma source. The negative ϵHf(t) values (–6.0 to –2.1), with old two-stage model ages (1338–1583 Ma), indicate that the partial melting of the ancient lower crust predominantly generated these rocks, supported by the findings of Zhao et al. (Reference Zhao, Sun, Wilde and Li2005) and Zhang et al. (Reference Zhang, Zhao, Ye, Hou and Li2012). Zhao et al. (Reference Zhao, Sun, Wilde and Li2005) argued that the Archaean continental crust in the northern NCC was rejuvenated by the underplating of mafic magmas at c. 1.8–1.6 Ga. The highly depleted zircon ϵHf(t) values of the c. 1.3 Ga diabase in northern NCC indicate that depleted lithospheric mantle sources were involved (Zhang et al. Reference Zhang, Zhao, Ye, Hou and Li2012). Yang et al. (Reference Yang, Niu, Hollings, Zurevinski and Li2017) recognized that the O–Hf isotopic variations of zircons from late Mesozoic alkaline A-type granites in NE China can be explained by the melting of a hybrid source consisting of different proportions of altered oceanic crust and enriched mantle components. Thus, Yang et al. (Reference Yang, Niu, Hollings, Zurevinski and Li2017) concluded that the recycling of subducted oceanic crust represents a novel exotic source for the origin of alkaline A-type granites in intraplate extensional settings. More evidence is needed to affirm the incorporation of subducted oceanic crust in the source of the late Mesozoic A-type granitoids; for example, obtaining the oxygen isotopic ratio would be beneficial (Yang et al. Reference Yang, Niu, Hollings, Zurevinski and Li2017). However, certain geochemical characteristics of the Late Jurassic A-type granitoids in the present study are inconsistent with those of alkaline A-type granitoids reported by Yang et al. (Reference Yang, Niu, Hollings, Zurevinski and Li2017), including (1) the Ti and Ni contents of the Jurassic A-type granitoids are lower (0.09–0.15 wt % and 0.70–4.2 ppm, respectively) than those reported by Yang et al. (Reference Yang, Niu, Hollings, Zurevinski and Li2017) (0.13–0.7 wt % and 3.4–8.9 ppm, respectively); (2) the Nb/Ta ratios of these A-type granitoids are 6.1–12.4, while those reported by Yang et al. (Reference Yang, Niu, Hollings, Zurevinski and Li2017) range from 9.8 to 16.4 (mostly > 13), which demonstrates the continental source nature of our samples compared to the mantle affinity of the samples described by Yang et al. (Reference Yang, Niu, Hollings, Zurevinski and Li2017); and (3) the negative ϵHf(t) values. The combination of these features led us to conclude that a significant contribution of a hybrid source (altered oceanic crust and enriched mantle-derived mafic rocks) in the granite genesis can be excluded.
Advanced fractional crystallization occurred during the formation of the Late Jurassic W-bearing granitic intrusions, where the monzogranite and granite porphyry samples plot in the highly fractionated granite field based on their Rb, Sr, and Ba concentrations (Fig. 8d). In the chondrite-normalized REE patterns, significantly negative Eu anomalies (Eu/Eu* = 0.28–0.52) reflect the fractional crystallization of plagioclase and/or K-feldspar (Fig. 9a). In the primitive mantle-normalized trace-element diagrams (Fig. 9b), pronounced depletions in Ba, Sr, P and Ti may reflect the separation of plagioclase, K-feldspar, Ti-bearing minerals and apatite. This evidence indicates that the parent magmas of W-bearing granitoids underwent extensive fractional crystallization. In summary, we propose that the W-bearing granitoids from the Narenwula complex are highly fractionated A-type granitoids, which were derived from the partial melting of ancient lower crust and subsequently underwent a high degree of fractional crystallization.
5.d. Genetic link between the Narenwula complex and W mineralization
Generally, W mineralization is associated with highly fractionated granites, as demonstrated by numerous cases worldwide (Singh & Singh, Reference Singh and Singh2001; Fogliata et al. Reference Fogliata, Baez, Hagemann, Santos and Sardi2012; Mao et al. Reference Mao, Cheng, Chen and Franco2013; Huang & Jiang, Reference Huang and Jiang2014; Zhang, Y. et al. Reference Zhang, Yang, Chen, Wang and Xiang2017; Cao et al. Reference Cao, Yang, Du, Wu, Kong, Li, Wan, Xi, Gong and Zhao2018, Reference Cao, Wu, Yang, Deng, Li, Kong and Xi2020; Jiang et al. Reference Jiang, Jiang, Li, Zhao and Peng2018; Yuan et al. Reference Yuan, Williams-Jones, Mao, Zhao, Yan and Zhang2018; Steiner, Reference Steiner2019; Li, J. et al. Reference Li, Huang, Fu and Li2021; Xie et al. Reference Xie, Zeng, Wang, Wu, Zhang, Li and Zhang2021). It has been proposed that ore-forming elements may be concentrated during multiple stages of magmatic activity and then extracted by magmatic fluids (Che et al. Reference Che, Linnen, Wang, Aseri and Thibault2013; Harlaux et al. Reference Harlaux, Mercadier, Marignac, Peiffert, Cloquet and Cuney2018) or leached from granitoids and/or metamorphic rocks and transported by external (metamorphic or meteoric) fluids (Linnen & Williams-Jones, Reference Linnen and Williams-Jones1995; Vindel et al. Reference Vindel, Lopez, Boiron, Cathelineau and Prieto1995; Vallance et al. Reference Vallance, Cathelineau, Marignac, Boiron, Fourcade, Martineau and Fabre2001). Xie et al. (Reference Xie, Zeng, Wang, Wu, Zhang, Li and Zhang2021) systematically collected the published geochemical data of W-barren and W-mineralized granitoids in NE China, and concluded that the late Mesozoic W-mineralized granitoids have higher Rb/Sr and U/Th, but lower (La/Yb)N, LREE/HREE, Eu/Eu*, K/Rb, Zr/Hf, Nb/Ta and Y/Ho ratios than contemporary W-barren granitoids. The K/Rb, Zr/Hf and Nb/Ta ratios are considered to be ‘geochemical twin’ elemental ratios because they have the same charge and ionic radius. They have similar geochemical properties and are not expected to fractionate during most geological processes (Green, Reference Green1995). Previous studies have suggested that these ‘geochemical twin’ elemental ratios in granites decrease because of fractional crystallization (Bau, Reference Bau1996; Linnen & Keppler, Reference Linnen and Keppler1997, Reference Linnen and Keppler2002; Dostal & Chatterjee, Reference Dostal and Chatterjee2000; Claiborne et al. Reference Claiborne, Miller, Walker, Wooden, Mazdab and Bea2006; Deering & Bachmann, Reference Deering and Bachmann2010; Dostal et al. Reference Dostal, Kontak, Gerel, Gregory and Fayek2015; Ballouard et al. Reference Ballouard, Poujol, Boulvais, Branquet, Tartese and Vigneresse2016). In present study, the W-bearing granitoids had higher Rb/Sr, and lower Nb/Ta, Zr/Hf and K/Rb ratios than the W-barren granodiorites (Fig. 12a–d). Moreover, the W-bearing granitoids all plot in the field of W-mineralized granitoids proposed by Xie et al. (Reference Xie, Zeng, Wang, Wu, Zhang, Li and Zhang2021) (Fig. 12a–d). In contrast, the W-barren granodiorites from the Narenwula complex plot in the field of W-barren granitoids (Fig. 12a–d). In addition, the W-bearing granitoids have higher W concentrations than the W-barren granodiorites and the average continental crust (Fig. 12e, f). Combined with the published geochemical data for late Mesozoic W-mineralized granitoids, we noted that the W concentrations of W-mineralized granitoids increased with an increasing Rb/Sr ratio (Fig. 12e) and decreased with an increasing K/Rb ratio (Fig. 12f), suggesting that fractional crystallization of the W-mineralized granitic magma was beneficial for the concentration of W. Using Rb/Sr as a parameter for the extent of fractionation, Lehmann (Reference Lehmann1987) and Lehmann et al. (Reference Lehmann, Ishihara, Michel, Miller, Rapela, Sanchez, Tistl and Winkelmann1990) demonstrated that extreme fractional crystallization may result in both very high Rb/Sr ratios and enhanced W concentrations, necessary for W mineralization. Additionally, many studies have confirmed that the enrichment in W and related incompatible elements during magmatic fractionation is an essential requirement for W mineralization (Webster et al. Reference Webster, Thomas, Förster, Seltmann and Tappen2004; Breiter et al. Reference Breiter, Müller, Leichmann and Gabašová2005; Thomas et al. Reference Thomas, Förster, Rickers and Webster2005; Zhang, Y. et al. Reference Zhang, Wang, Wang, Li, Yu, Wang, Li, Wan and Huang2017; Cao et al. Reference Cao, Yang, Du, Wu, Kong, Li, Wan, Xi, Gong and Zhao2018; Yuan et al. Reference Yuan, Williams-Jones, Mao, Zhao, Yan and Zhang2018; Li, J. et al. Reference Li, Huang, Fu and Li2021). Relatively low ratios of ‘geochemical twin’ elements suggest that the W-bearing granitoids are more fractionated than the W-barren granodiorites, and that the extreme fractional crystallization process is favourable for W enrichment.

Fig. 12. Discrimination diagrams of W-mineralized and W-barren granitoids. Field for average continental crust (ACC) is from Rudnick & Gao (Reference Rudnick, Gao, Holland and Turekian2003), and fields for W-mineralized and W-barren granitoids are from Xie et al. (Reference Xie, Zeng, Wang, Wu, Zhang, Li and Zhang2021).
Based on the geological, geochronological and geochemical features of the Narenwula complex in NE China, an integrated model of granitic magmatism and W mineralization in the Narenwula ore district can be proposed as follows. First, during late Permian time, mantle-derived mafic magmas successively underplated beneath the juvenile lower crust and induced extensive crustal melting, which produced a deep hot zone and generated felsic magmas. The mantle-derived mafic magmas halted as a result of obstruction by the deep hot zone and rarely passed through the zone (Annen et al. Reference Annen, Blundy and Sparks2006), which may explain why contemporaneous mafic rocks are rarely exposed in this area. However, when small amounts of mantle-derived mafic magmas passed through the zone and mixed with felsic magmas in deeper magma chambers, hybrid magmas were generated. The hybrid magmas subsequently underwent limited fractional crystallization and formed the MMEs and host granodiorite. Second, during Late Jurassic time, the parental magmas for the W-bearing granitoids were mainly derived from the partial melting of ancient lower crustal rocks. W is a lithophile element, so it is generally enriched in the crust, but depleted in the mantle (Rudnick & Gao, Reference Rudnick, Gao, Holland and Turekian2003; Arevalo & McDonough, Reference Arevalo and McDonough2008). Therefore, the ancient lower crust beneath the Narenwula area may show significant potential for W mineralization. Continual fractional crystallization appears to have been the dominant process that further enriched W in the granitic magmas. Previous studies have demonstrated the importance of magmatic differentiation in the formation of W deposits, where ore metals (W) and volatiles (F and Li) become enriched in highly evolved magma, followed by their accumulation in the residual liquid (Thomas et al. Reference Thomas, Förster, Rickers and Webster2005; Romer et al. Reference Romer, Meixner and Förster2014; Li, J. et al. Reference Li, Huang, Fu and Li2021). Therefore, the highly fractionated A-type granitoids in the Narenwula area contributed to the W enrichment. Third, in the late stages of magma evolution, the volatile-rich fluids exsolved and segregated from the melt. Their subsequent liquid–vapour phase separation could have changed the physical and chemical conditions of the magmatic–hydrothermal system (Li, J. et al. Reference Li, Huang, Fu and Li2021). The post-magmatic fluids became enriched in F and Cl, significantly enhancing the solubility of W (Webster & Holloway, Reference Webster and Holloway1988; Keppler & Wyllie, Reference Keppler and Wyllie1991; Schaller et al. Reference Schaller, Dingwell, Keppler, Knöller, Merwin and Sebald1992; Signorelli & Carroll, Reference Signorelli and Carroll2000; Zajacz et al. Reference Zajacz, Halter, Pettke and Guillong2008; Yuan et al. Reference Yuan, Williams-Jones, Romer, Zhao and Mao2019). Previous studies have shown that W can be strongly partitioned from the melt to the fluid (Gibert et al. Reference Gibert, Moine, Schott and Dandurand1992; Wood & Samson, Reference Wood and Samson2000). Under the effect of temperature and pressure gradients, the ore-bearing hydrothermal fluid would have risen along a series of NE-trending faults. Infiltration and metasomatism occurred continuously between the W-bearing hydrothermal fluids and wall-rock, finally leading to the precipitation of W due to the variation in physical and chemical conditions.
5.e. Tectonic implications
During late Permian and Late Jurassic – Early Cretaceous times, NE China experienced the overprinting of the PAO, MOO and PPO tectonic regimes; the tectonomagmatic evolution of NE China is therefore complicated, with substantial long-term debates (Wu et al. Reference Wu, Sun, Ge, Zhang, Grant, Wilde and Jahn2011; Liu, Y. J. et al. Reference Liu, Li, Feng, Wen, Neubauer and Liang2017; Guo et al. Reference Guo, Huang and Zhao2019). Our interpretations and previous studies provide some evidence that can elucidate the tectonic evolution of the SGB during late Permian and Late Jurassic – Early Cretaceous times.
5.e.1. Late Permian (260–250 Ma)
Although the disappearance of the PAO occurred along the SXCF, the closure time of the PAO remains ambiguous (Eizenhöfer et al. Reference Eizenhöfer, Zhao, Zhang and Sun2014; Liu, Y. J. et al. Reference Liu, Li, Feng, Wen, Neubauer and Liang2017). Liu, Y. J. et al. (Reference Liu, Zhou, Tang, Wu, Li, Zhu, Jiang, Liu and Ye2017) systematically summarized the available reported data and different models for the Palaeozoic tectonic evolution of the easternmost CAOB, concluding that the final closure of the PAO occurred along the SXCF with a scissor-style closure from late Permian – Early Triassic times in the west to late Permian – Middle Triassic times in the east (Fig. 13a). The presence of collision-related granites (Chen et al. Reference Chen, Jahn and Tian2009), the Xilingol Complex and terrestrial Linxi Formation deposition provide evidence for these conclusions (Li, Y. L. et al. Reference Li, Zhou, Brouwer, Xiao, Wijbrans, Zhao, Zhong and Liu2014). In addition, middle Permian – Early Triassic syncollisional granitoids in the eastern Jilin belt (Cao et al. Reference Cao, Xu, Pei, Wang, Wang and Wang2013) and Triassic mafic volcanic rocks and lacustrine molasses in the SGB (Zhang, J. H. et al. Reference Zhang, Ge, Wu, Wilde, Yang and Liu2008) have been discovered. These findings, combined with the late Permian I-type granitoids along the SXCF, granodiorites in the Baiyinnuoer area (SGB; 245 Ma) (Jiang et al. Reference Jiang, Chen, Bagas, Liu, Han, Kang and Wang2017), Early–Middle Triassic syncollisional S-type granitoids in Linxi (SGB) and Horqin Right-Wing Middle Banner (CGB), and synchronous adakitic plutons in the Yanbian fold belt (251−240 Ma) (Ma et al. Reference Ma, Zhu, Zhou and Qiao2017) suggest that the parental magmas of the granitoids in this area formed via the melting of a thickened lower crust as a result of the amalgamation of the NE China block and NCC during the subduction of the PAO (Fig. 13a). The late Permian I-type granodiorites from the Narenwula complex show normal arc magma characteristics, derived from the mixing of mantle-derived mafic melts and crust-derived felsic melts, and may have formed under a volcanic arc setting triggered by the subduction of the PAO plate (Fig. 13a). Shang (Reference Shang2004) reported radiolarians found in the argillite bed of the Zhesi Formation from the middle Permian in the Zhesi and Xilinhot areas. This indicates that deep marine sedimentary facies persisted during middle Permian time and suggests that the ocean between the NCC and Siberian Craton (SC), probably extending along the Linxi ophiolite belt, was not closed until late Guadalupian time (∼270–250 Ma). Han et al. (Reference Han, Zhou, Wang and Cao2015) reported a youngest detrital zircon U–Pb age of 238 Ma from the Linxi Formation in the Linxi area (Fig. 1c), indicating that the final closure of the PAO occurred in Early Triassic time. Detrital zircon U–Pb dating of the Xingfuzhilu Formation in southern Inner Mongolia suggested that a closing remnant ocean basin or narrow seaway possibly existed in middle Permian time immediately prior to the final collision of the CAOB and closure of the PAO (Li, S. et al. Reference Li, Wilde, He, Jiang, Liu and Zhao2014). The Wudaoshimen ophiolite in Keshenketengqi (SGB) composed of pillow basalt yielded a concordant age of 277 Ma (Wang et al. Reference Wang, Xu, Cheng, Liao, Shao and Wang2014), indicating that an open ocean still existed in the north of the NCC. Reported palaeomagnetic data provide further constraints on the final closure of the PAO. According to the palaeomagnetic data, Li et al. (Reference Li, Gao, Guan and Li2006) concluded that the SC began to drift southwards rapidly in early Permian time and collided with the NCC at the end of the Permian period (c. 250 Ma). Rock magnetic and palaeomagnetic studies of the Permian sandstone from the Taohaiyingzi area in Inner Mongolia indicated that the area amalgamated with the NCC in late Permian time (Qin et al. Reference Qin, Li, Huang, Cai and Ren2013).

Fig. 13. Simplified cartoon showing tectonic evolution of NE China during late Permian and Late Jurassic – Early Cretaceous times, and the genetic model of the Narenwula complex (after Han et al. Reference Han, Wang, Wang, Wang and Zhang2021). Abbreviations: SC – Siberian Craton; EB – Erguna Block; XB – Xing’an Block; SXB – Songliao–Xilinhot Block; LT – Liaoyuan Terrane; NCC – North China Craton; LXZR – Lesser Xing’an–Zhangguangcai Range; PAO – Palaeo-Asian Ocean; MOO – Mongol–Okhotsk Ocean; PPO – Palaeo-Pacific Ocean; MOF – Mongolia–Okhotsk Fault; XXF – Xinlin–Xiguitu Fault; HHF – Heganshan–Heihe Fault; NBF – Nenjiang–Balihan Fault; CKF – Chifeng–Kangbao Fault.
The studies above clearly indicate that the PAO closure had a long history throughout Palaeozoic time until early Mesozoic time, which involved subduction/accretion processes on the northern margin of the NCC and the southern margin of the SGB during Palaeozoic time and a final collision along the SXCF during late Permian – Early Triassic times in the west.
5.e.2. Late Jurassic – Early Cretaceous (155–125 Ma)
Romer & Kroner (Reference Romer and Kroner2016) concluded that the occurrence of Sn and/or W mineralization is the result of a sequence of processes, i.e. source enrichment, source accumulation and metal extraction. In the process of metal extraction, different tectonic settings may have led to the input of mantle melt or the emplacement of ultrahigh-temperature metamorphic rocks, which were essential for metal extraction from the source rocks. These factors played an important role in controlling the discontinuous distribution of W mineralization within the belt. Therefore, understanding the tectonic setting and deep geodynamic processes is crucial for deciphering the W mineralization mechanisms in the Narenwula area and the SGB.
It is generally accepted that the SGB and all of NE China was under an extensional setting during Late Jurassic – Early Cretaceous times (Wu et al. Reference Wu, Sun, Ge, Zhang, Grant, Wilde and Jahn2011; Ouyang et al. Reference Ouyang, Mao, Zhou and Su2015; Mao et al. Reference Mao, Sun, Yang, Tang, Zheng and Liu2020; Wei et al. Reference Wei, Lv and Wang2021; Zhang, G. L. et al. Reference Zhang, Xie, Wen, Gong, Guo and Tang2020; Jing et al. Reference Jing, Yang, Ge, Dong, Ji, Jing, Bi and Zhou2021). The widespread metamorphic core complexes (Wang et al. Reference Wang, Zheng, Zhang, Zeng, Donskaya, Guo and Li2011, Reference Wang, Guo, Zheng, Donskaya, Gladkochub, Zeng, Li, Wang and Mazukabzov2012) combined with the occurrence of bimodal rock suites, A-type granites (Gou et al. Reference Gou, Sun and Qin2019; Han et al. Reference Han, Wang, Wang, Wang and Zhang2021; Zhang, C. et al. Reference Zhang, Quan, Zhang, Liu, Li, Wang, Qian, Zhang and Ge2020), alkaline rhyolites, extensional basins and some Au–Mo–REE mineralization in the SGB (Wu et al. Reference Wu, Lin, Wilde, Zhang and Yang2005; Guo et al. Reference Guo, Yang, Zyabrev and Hou2017; Li et al. Reference Li, Chung, Wang, Wilde, Chu and Guo2017) also indicate a Late Jurassic – Early Cretaceous extensional setting. Some geophysical data also provide constraints for the extensional setting. Shao et al. (Reference Shao, Zhang, Xiao and Li2005) reported electromagnetic anomalies in the SGB and revealed two low-resistivity layers in the crust, at depths of ∼10 and 30 km. Seismic tomography studies indicated the existence of an ∼100–500 km thick low-velocity block at a depth of ∼50–100 km beneath the SGB, broadly coincident with the electromagnetic data (Huang & Zhao, Reference Huang and Zhao2006), which can be interpreted as upwelling asthenosphere. Several high-velocity blocks have been found beneath a depth of 400 km (one as deep as 1000 km), and a low-velocity atypical plume-like block was identified rising from below 800–1000 km (Shao et al. Reference Shao, Zhang, Xiao and Li2005). These findings provided evidence of the occurrence of lithospheric delamination and asthenospheric upwelling beneath the SGB (Wan et al. Reference Wan, Lu, Zeng, Mohammed, Liu, Dai and Chen2019). However, the deep geodynamic processes that led to the widespread extension and abundant W-related granitic magmatism remain contentious.
A mantle plume model was initially proposed to explain the extensive late Mesozoic magmatism (Ge et al. Reference Ge, Lin, Sun, Wu, Yuan, Li, Chen and Yin1999). However, this model was later abandoned because late Mesozoic magmatism in the Great Xing’an Range (GXR) lasted for a relatively long period of time (40 Ma), distinguishing it from the short-lived intense period of magmatic eruption expected to result from a mantle plume (Wu et al. Reference Wu, Sun, Ge, Zhang, Grant, Wilde and Jahn2011). More recent studies have suggested a genetic relationship between the late Mesozoic magmatism in NE China and the subduction of the PPO (Ji et al. Reference Ji, Meng, Wan, Zhu, Ge, Zhang, Yang and Dong2019; Li, S. Z. et al. Reference Li, Suo, Li, Zhou, Santosh, Wang, Wang, Guo, Yu, Lan, Dai, Zhou, Cao, Zhu, Liu, Jiang, Wang and Zhang2019; Suo et al. Reference Suo, Li, Jin, Zhang, Zhou, Li, Wang, Liu, Wang and Somerville2019; He et al. Reference He, Tan, Liu, Bai, Wang, Wang and Zhong2020; Sun et al. Reference Sun, Li, Sun, Ding, Wang, Li and Wang2020; Wang, L. et al. Reference Wang, Zeng, Zhang, Guo and Lu2020; Wei et al. Reference Wei, Zou, Huang, Jiang, Zhu and Wu2020; Jing et al. Reference Jing, Yang, Ge, Dong, Ji, Jing, Bi and Zhou2021). However, this scenario can be precluded because (1) late Mesozoic SGB magmatism likely occurred far from (> 2000 km) the PPO subduction front, whereas the maximum extent of the PPO plate subduction is evaluated as 1300 km (Wan et al. Reference Wan, Lu, Zeng, Mohammed, Liu, Dai and Chen2019); (2) seismological studies suggest that back-arc extension led by the PPO subduction did not reach the late Mesozoic SGB (Li et al. Reference Li, Chung, Wang, Wilde, Chu and Guo2017); and (3) during Late Jurassic time, igneous rocks were mainly distributed in the GXR and absent in other regions of NE China, indicating that the PPO plate was rotating and undergoing oblique subduction beneath the Eurasian continent during this time (Maruyama et al. Reference Maruyama, Isozaki, Kimura and Terabayashi1997; Xu, W. L. et al. Reference Xu, Pei, Wang, Meng, Ji, Yang and Wang2013).
In this study, we favour the pattern that the SGB was affected by the combined effects resulting from the closure of the MOO and subduction of the PPO during late Mesozoic time (Ouyang et al. Reference Ouyang, Mao, Zhou and Su2015; Liu, C. F. et al. Reference Liu, Zhou, Tang, Wu, Li, Zhu, Jiang, Liu and Ye2017; Liu et al. Reference Liu, Jiang, Bagas, Chen, Han and Wan2020; Pang et al. Reference Pang, Guo, Zhang, Zhu, Hou, Wen and Han2020; Zhang, C. et al. Reference Zhang, Quan, Zhang, Liu, Li, Wang, Qian, Zhang and Ge2020; Mi et al. Reference Mi, Lü, Zhao, Yan, Yu and Dong2021). A series of strike-slip faults developed along the Eurasian plate boundaries during Late Jurassic and Early Cretaceous times (Khanchuk, Reference Khanchuk2001). A simultaneous quiescence in volcanism at 160−140 Ma in the KJB (Xu, W. L. et al. Reference Xu, Pei, Wang, Meng, Ji, Yang and Wang2013; Ma et al. Reference Ma, Zhu, Zhou and Qiao2017) implies N-dipping subduction of the PPO plate (Fig. 13b) (Abrajevitch et al. Reference Abrajevitch, Zyabrev, Didenko and Kodama2012). In addition, the southeastward younging trend of volcanic rocks in NE China, from Late Jurassic time (160 Ma) to Late Cretaceous time (80 Ma), indicates that Early Cretaceous rocks are related to the rollback of the subducted PPO plate (Wang et al. Reference Wang, Zhou, Zhang, Ying, Zhang, Wu and Zhu2006). Furthermore, a change in the PPO plate subduction direction towards the NNW occurred at 140 Ma (Fig. 13b) (Maruyama et al. Reference Maruyama, Isozaki, Kimura and Terabayashi1997; Ma et al. Reference Ma, Zhu, Zhou and Qiao2017), together with the rollback of the subducting plate (Ji et al. Reference Ji, Liu and Li2020). Tang et al. (Reference Tang, Sun, Mao, Yang, Deng and Liu2019) suggested that the force resulting from the southward subduction of the MOO plate and subsequent asthenosphere upwelling could be the dynamic mechanisms that initiated the rollback of the PPO plate. The rollback likely caused large-scale lithosphere delamination and asthenosphere upwelling (Fig. 13b), which consequently caused large-scale magmatic activity, ore mineralization and lithospheric thinning in NE China (Ouyang et al. Reference Ouyang, Mao, Zhou and Su2015).
The MOO formed between the SC and NCC in late Palaeozoic time (Tomurtogoo et al. Reference Tomurtogoo, Windley, Kroner, Badarch and Liu2005). At that time, the SC rotated clockwise relative to Mongolia, which resulted in the closure of the MOO and the formation of the MO suture belt (Zorin, Reference Zorin1999). The western part of the ocean was closed during Triassic time, and the central part closed during Early–Middle Jurassic time (Li et al. Reference Li, Ding, Xu, Wang, Tang, Zhao and Wang2015). However, the exact closure time of the eastern part of the ocean remains controversial, with suggestions including Early–Middle Jurassic (Zorin, Reference Zorin1999; Tomurtogoo et al. Reference Tomurtogoo, Windley, Kroner, Badarch and Liu2005), Late Jurassic – Early Cretaceous (Kravchinsky et al. Reference Kravchinsky, Cogné, Harbert and Kuzmin2002) and Early Cretaceous (Ren et al. Reference Ren, Zhang, Wu, Liang, Miao, Zhao, Li, Yang, Pei and Davis2016). Regardless of the timing of closure, a substantial number of studies have indicated that the late Mesozoic extensional setting in the SGB is related to post-orogenic gravitational collapse and/or subduction-induced back-arc extension related to the closure of the MOO (Wang, Z. H. et al. Reference Wang, Ge, Yang, Zhang, Bi, Tian and Xu2015; Fritzell et al. Reference Fritzell, Bull and Shephard2016; Guan et al. Reference Guan, Liu, Wang, Wang, Wang, Shi and Chen2018; Ji et al. Reference Ji, Ge, Yang, Wang, Zhang, Wang and Bi2018, Reference Ji, Liu and Li2020; Han et al. Reference Han, Wang, Wang, Wang and Zhang2021; Shi et al. Reference Shi, Wang, Ma, Li, Li and Wang2020; Wei et al. Reference Wei, Lv and Wang2021). On Rb versus (Y + Nb) and (Yb + Ta) diagrams, most Late Jurassic W-bearing granitoids in this study and late Mesozoic W-related granitoids from previous studies plot in the post-collision granite field (Fig. 14a, b). On an R2 versus R1 diagram (Fig. 14c) as well as on the Rb/30–Hf–3Ta diagram (Fig. 14d), most samples plot in the post-collisional A-type granite field. Similarly, on Nb–Y–3Ga/Ce diagrams (Eby, Reference Eby1992), most samples plot in the A2-type granite field, representing post-collisional A-type granites (Fig. 14e, f). Collectively, we suggest that the Late Jurassic W-bearing granitoids from the Narenwula complex and late Mesozoic W-related granitoids in the SGB were emplaced under a post-collisional setting instead of a subduction-dominated setting. Furthermore, this evidence indicates that the MOO tectonic regime played a critical role in the formation of the late Mesozoic W-related granitoids in the SGB.

Fig. 14. (a) Rb versus (Y + Nb) diagram (after Pearce et al. Reference Pearce, Harris and Tindle1984). (b) Rb versus (Yb + Ta) diagram (after Pearce et al. Reference Pearce, Harris and Tindle1984). (c) R2 versus R1 diagram (after Batchelor & Bowden, Reference Batchelor and Bowden1985). (d) Rb/30–Hf–3Ta discrimination diagram (after Harris et al. Reference Harris, Pearce, Tindle, Coward and Reis1986). (e) Nb–Y–3Ga discrimination diagram (after Eby, Reference Eby1992). (f) Nb–Y–Ce discrimination diagram (after Eby, Reference Eby1992). Abbreviations: VAG – volcanic arc granite; ORG – ocean ridge granite; WPG – within-plate granite; Syn-COLG – syncollision granite; Post-COLG – post-collision granite; A1 – anorogenic A-type granites; A2 – post-collisional A-type granites. Data for the late Mesozoic W-related granitoids in the southern Great Xing’an Range belt from other studies are listed in online Supplementary Material Table S2.
During late Mesozoic time, a plate tear developed because the MOO plate could not subduct owing to its older age, as predicted by the petrological and geochemical constraints (Ouyang et al. Reference Ouyang, Mao, Zhou and Su2015). In contrast, when the young PPO plate subducted, a long segment of the plate was temporarily stagnant in the transition zone between the upper and lower mantle (Liu & Stegman, Reference Liu and Stegman2012). The juxtaposition of the cold PPO plate against the hot mantle generated small-scale thermal upwelling along the edges of the plate (Liu & Stegman, Reference Liu and Stegman2012). Owing to the forces generated by the MOO plate break-off and subsequent asthenospheric upwelling, the PPO plate began to roll back, rather than continuing to subduct (Ouyang et al. Reference Ouyang, Mao, Zhou and Su2015). Consequently, the MOO plate tear in Late Jurassic time resulted in rapid asthenospheric upwelling and lithospheric thinning. The continuous rollback of the PPO plate, induced by the MOO plate tear, also triggered large-scale upwelling of the asthenosphere, lithospheric thinning and delamination, and back-arc spreading (Fig. 13b). These resulted in the generation of large-scale post-orogenic W-related granitic magmas and associated W deposits in the SGB during this period.
In summary, we suggest that the late Mesozoic W-related granitoids and associated W deposits in the SGB formed in a post-orogenic extensional setting induced by the closure of the MOO and rollback of the PPO plate.
6. Conclusions
-
(1) Our new LA-ICP-MS zircon U–Pb ages indicate that the MMEs and host granodiorites are coeval, with similar late Permian crystallization ages of 258.5–253.9 Ma, while W-bearing monzogranite and granite porphyry formed during Late Jurassic time, dated at 149.8–148.1 Ma.
-
(2) The late Permian granodiorites exhibit the characteristics of I-type granite. The MMEs and host granodiorites formed by the magma mixing of mafic and felsic magmas. The felsic magma was derived from the partial melting of juvenile lower crust, while the mafic magma was derived from the partial melting of an enriched lithospheric mantle metasomatized by slab-derived fluids.
-
(3) The Late Jurassic W-bearing granitoids are highly fractionated A-type granites, mainly derived from the partial melting of an ancient lower crust that subsequently underwent extreme fractional crystallization processes.
-
(4) In contrast to the W-barren granodiorite, the W-bearing granitoids are characterized by high W concentrations and Rb/Sr ratios, and low Nb/Ta, Zr/Hf and K/Rb ratios. Extreme fractional crystallization is critical for W enrichment in the granitic magma. The granodiorites did not induce W mineralization, likely attributable to their low fractionated signatures.
-
(5) The late Permian granodiorites formed in a volcanic arc setting related to the southward subduction of the PAO, whereas the Late Jurassic W-bearing granitoids and related W deposits formed in a post-orogenic extensional setting related to the MOO closure and rollback of the PPO plate.
Supplementary material
To view supplementary material for this article, please visit https://doi.org/10.1017/S0016756821001175
Acknowledgements
We are grateful to the editors and two anonymous reviewers for their constructive comments which greatly help in improving our paper. We would like to thank Drs Hao Wang, Yue-Heng Yang, Lei Xu, Shi-Tou Wu and Bao-Quan Zhou for helping with zircon U–Pb dating. We would like to thank Feng-Yong Xia and Jian-Mei Tang from the Beijing Createch Testing Technology Co., Ltd. for advice and assistance with Hf isotope analyses. We also thank ALS Chemex (Guangzhou) for helping with whole-rock major- and trace-element analyses. This study was financially supported by the National Natural Science Foundation of China (Grant No. 91962104).


