1. Introduction
Major problems in understanding the cause of volcanism remain unresolved, and a number of questions in connection with the genesis of basaltic magmas in general have not yet been fully answered. The chemical signatures of alkali basalts that are related to various tectonic settings such as oceanic or continental rifting, transtensional regimes or hot spots of plume or non-plume origin, and the nature of the mantle source material, whether it is dominated by recycled oceanic or continental crust, or by recycled sedimentary components, of a primitive, depleted, then later metasomatized origin, whether related to lithospheric or sub-lithospheric depths, and the processes associated with melting and migration of melt, are among the more hotly debated topics on the subject. Some of these issues will be discussed through this case study on the mafic–ultramafic Tigris lavas of northeastern Syria, which provides insight into the magmatic processes associated with the youngest phases of Cenozoic volcanism in the Middle East.
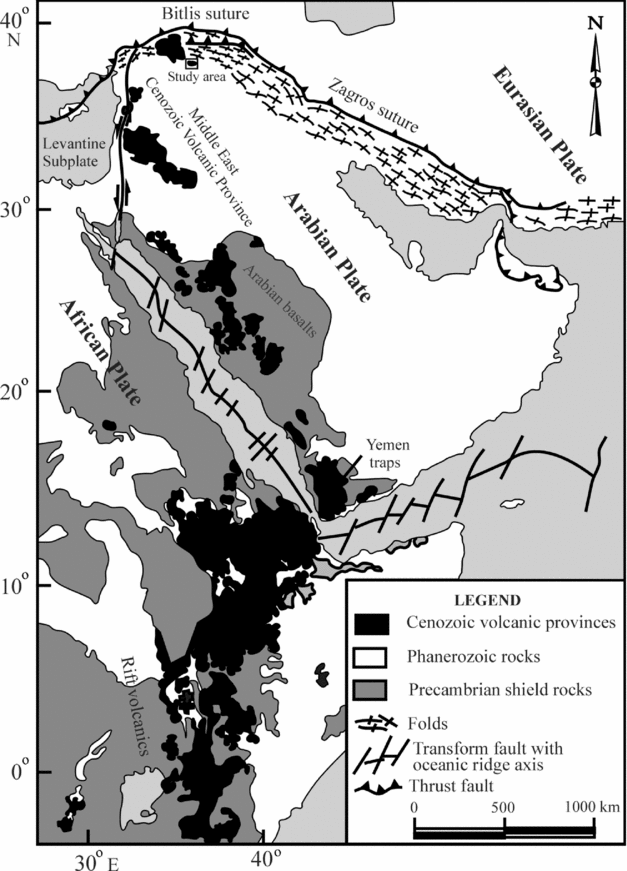
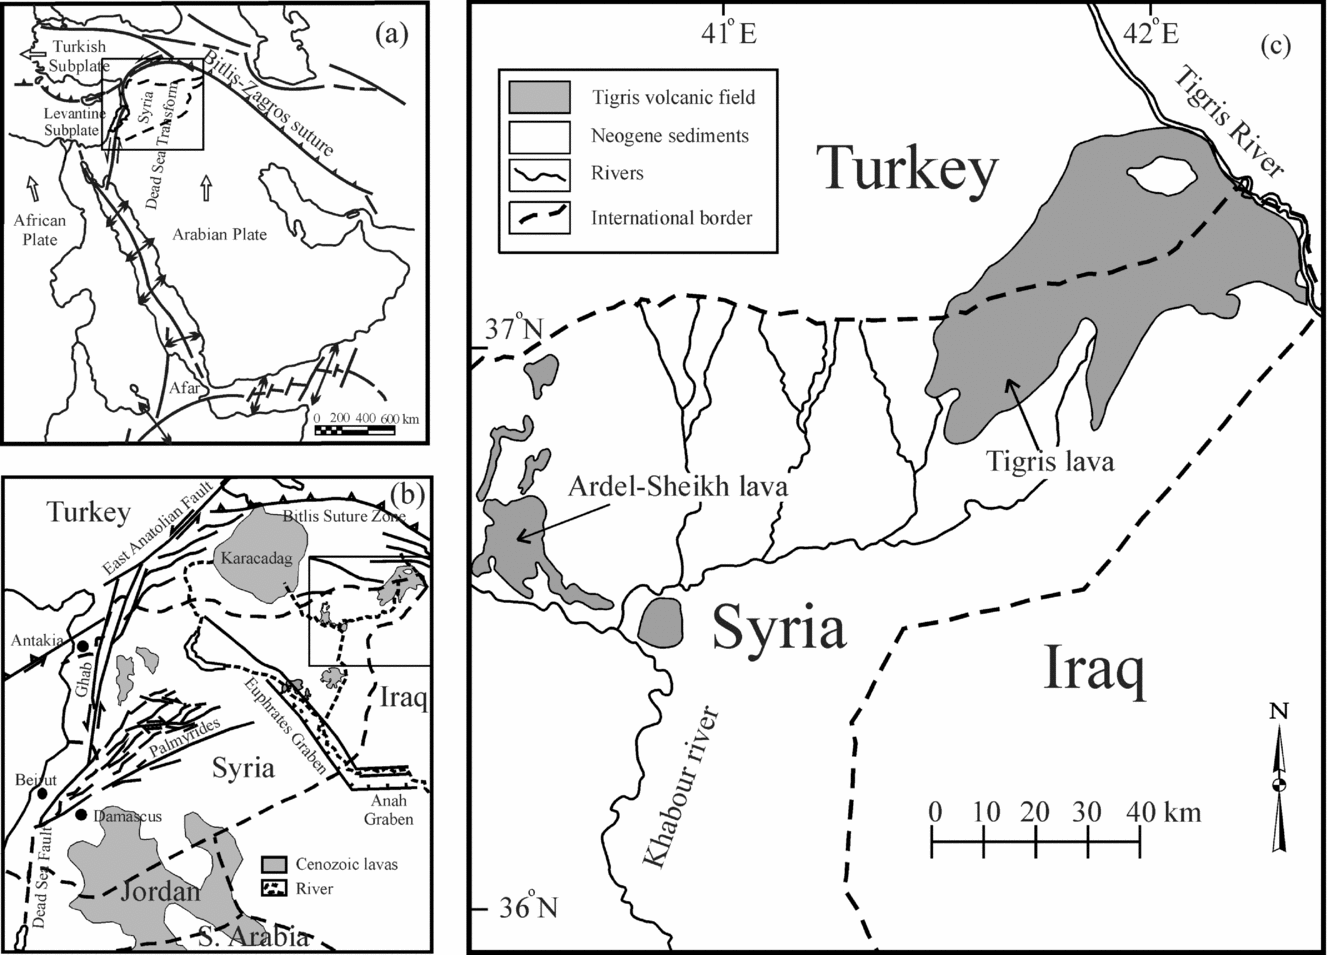
Volcanism occurring at the northeasternmost tip of Syria near its borders with Iraq and Turkey (Figs 1, 2) is represented by the Tigris volcanic field, which extends further north across the border into Turkey. This volcanic field occurs within a tectonically active region and represents an example of mafic rocks that form a prime constituent of the crustal segment of the Middle East. As the petrology and geochemistry of the Tigris volcanic field have not been previously investigated, we aim to provide petrological, chemical and isotopic data on this volcanic field, provide constraints on its mantle source and propose a petrogenetic model for its lavas. The data will also be used to shed light on the tectonic regime of magma emplacement in the context of the regional geodynamic framework.

Figure 1. Regional geological map showing the distribution of the various Cenozoic volcanic provinces in east Africa, Arabia and the Middle East. The area of study is located to the south of the Bitlis–Zagros suture.
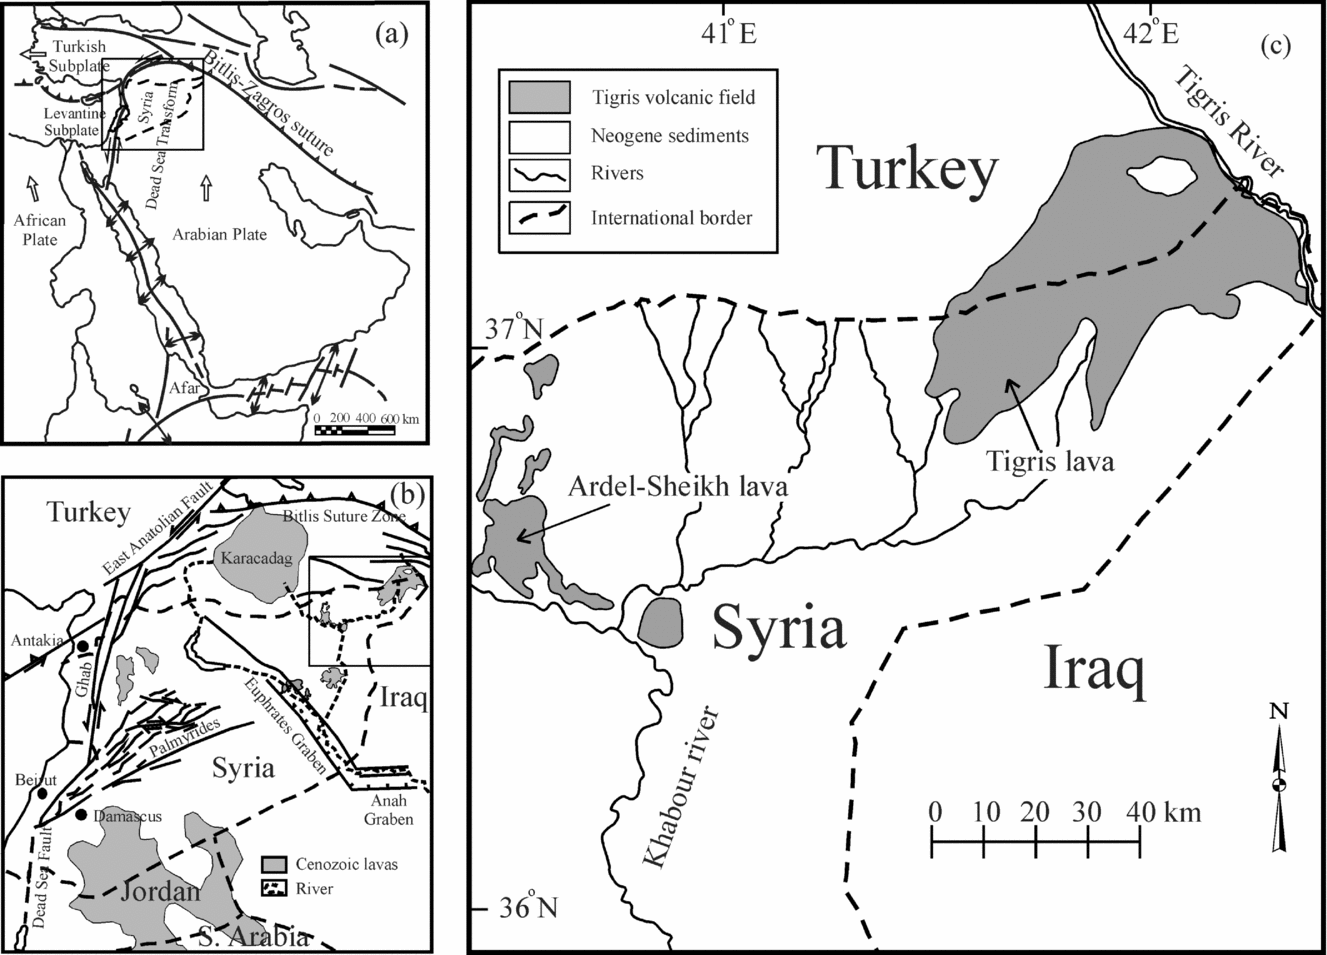
Figure 2. Geological and tectonic maps showing (a) the main tectonic elements in the Middle East (square outlines map 2b), (b) the area of study and some of the structural elements (square outlines map 2c), and (c) simplified geological map of northeastern Syria at its borders with Turkey and Iraq showing locations of the various exposures within the Tigris volcanic field (after Ponikarov, Reference Ponikarov1967).
2. Overview of the regional tectonic framework
The Tigris volcanic field occurs between the Bitlis–Zagros collisional suture to the north and east, and a tensional-related fracture system (the Euphrates graben) to the south (Fig. 2a, b). This volcanic field represents the northern segment of the Middle East Cenozoic volcanic province (Fig. 1). The latter consists of large, discontinuous volcanic exposures extending from Sinai, Jordan and Israel, to Lebanon, Syria and Turkey (Dubertret, Reference Dubertret1955; Mouty et al. Reference Mouty, Delaloye, Fontignie, Piskin and Wagner1992; Shaw et al. Reference Shaw, Baker, Menzies, Thirlwall and Ibrahim2003; Abdel-Rahman & Nassar, Reference Abdel-Rahman and Nassar2004; Weinstein et al. Reference Weinstein, Navon, Altherr and Stein2006; Lustrino & Sharkov, Reference Lustrino and Sharkov2006; Lease & Abdel-Rahman, Reference Lease and Abdel-Rahman2008). As a result of such a major phase of Cenozoic volcanism, some other extensive volcanic provinces were developed further south in east Africa (mostly Ethiopia and Kenya), in Yemen and in Arabia (Mohr, Reference Mohr1983; White & McKenzie, Reference White and McKenzie1989; Camp & Roobol, Reference Camp and Roobol1992; Camp, Roobol & Hooper, Reference Camp, Roobol and Hooper1992; Baker, Thirlwall & Menzies, Reference Baker, Thirlwall and Menzies1996; Bertrand et al. Reference Bertrand, Chazot, Blichert-Toft and Thoral2003; Furman et al. Reference Furman, Kaleta, Bryce and Hanan2006). The study of Furman et al. (Reference Furman, Bryce, Karson and Iotti2004) showed that the Quaternary mafic lavas of northern Kenya were derived from mixtures of plume and ambient mantle sources. The Tertiary mafic lavas of Kenya were interpreted to reflect isotopically distinct plume heads beneath Tanzania and Afar that are derived from the chemically heterogeneous South African superplume (Furman et al. Reference Furman, Kaleta, Bryce and Hanan2006). The Cenozoic lava flows in Ethiopia that are thought to be clearly related to the East African rift system were interpreted to have been developed in association with the Afar plume (Barberi et al. Reference Barberi, Ferrara, Santacroce, Treuil and Varet1975; Mohr, Reference Mohr1983; Hart et al. Reference Hart, Wolde, Walter and Mertzman1989; Stewart & Rogers, Reference Stewart and Rogers1996; Barrat et al. Reference Barrat, Fourcade, Jahn, Cheminèe and Capdevila1998; Pik et al. Reference Pik, Deniel, Coulon, Yirgu and Marty1999; George & Rogers, Reference George and Rogers2002). In fact, Ebinger & Sleep (Reference Ebinger and Sleep1998) indicated that Cenozoic magmatism throughout east Africa resulted from the impact of a single plume. Baker et al. (Reference Baker, Menzies, Thirlwall and Macpherson1997, Reference Baker, Chazot, Menzies and Thirlwall1998) demonstrated that the mafic lavas of western Yemen were produced in response to small amounts of lithospheric extension that were metasomatized and hydrated by the Afar plume.
The Cenozoic continental flood basalts of Saudi Arabia were interpreted to have occurred in two distinct phases (Camp & Roobol, Reference Camp and Roobol1989, Reference Camp and Roobol1992; Camp, Roobol & Hooper, Reference Camp, Roobol and Hooper1992): phase one (30 to 20 Ma) of tholeiitic to transitional lavas was related to passive mantle upwelling during extension of the Red Sea basin, and phase two (12 Ma to Recent) that produced transitional to strongly alkalic lavas, was related to active mantle upwelling facilitated by minor continental extension. White & McKenzie (Reference White and McKenzie1989) and Camp & Roobol (Reference Camp and Roobol1992) concluded that the source of upwelling is either a mantle plume centrally located beneath the West Arabian Swell, or an elongated and extended lobe of hot asthenosphere emanating from the Ethiopian mantle plume. In sharp contrast, the Afar plume of Ethiopia is thought not to have been channelled northwestwards beneath the Arabian plate, and has played no role in producing the Cenozoic volcanic field of Jordan (Shaw et al. Reference Shaw, Baker, Menzies, Thirlwall and Ibrahim2003). These Jordanian alkali basalts and basanites were formed in response to a phase of lithospheric extension.
According to Baldridge et al. (Reference Baldridge, Eyal, Bartov, Steinitz and Eyal1991), Miocene basaltic magmatism in Sinai was developed in association with the opening of the Red Sea. Garfunkel (Reference Garfunkel1989) described the ‘Cover’ Cenozoic basalts, which are located in southeastern Galilee and in the southern Golan Heights, as mostly alkaline basalts of intraplate character and ocean island basalt (OIB) affinities, and proposed that the Jordan Valley depression could have acted as a route for magma ascent. Weinstein et al. (Reference Weinstein, Navon, Altherr and Stein2006) proposed that basanites and basalts of the southern Golan–Galilee region have two mantle sources (a dehydrated garnet-bearing amphibole peridotite and amphibole–garnet-bearing pyroxenite veins) occurring at lithospheric depths and that they were formed by dehydration and partial melting of an originally isotopically uniform reservoir.
The Pliocene alkali basalts of northern Lebanon, according to Abdel-Rahman & Nassar (Reference Abdel-Rahman and Nassar2004), were thought to have erupted during an episode of localized extension, which occurred particularly at the junction between the Dead Sea–Ghab transform and the Yammouneh restraining bend (i.e. in a transtensional tectonic regime). Mouty et al. (Reference Mouty, Delaloye, Fontignie, Piskin and Wagner1992) presented preliminary geochronological data on Cenozoic volcanism in Syria, in which they produced whole-rock K–Ar ages ranging from 23.5 to 1.5 Ma. They demonstrated that there was a large gap (between 16 and 8 Ma) in Cenozoic volcanic activity, and interpreted this to correspond with the interval between the two stages of spreading of the Red Sea–Dead Sea rift system, with magmatism being associated with left-lateral movements along the Dead Sea rift. Lustrino & Sharkov (Reference Lustrino and Sharkov2006) indicated that much of the Neogene volcanic activity in western Syria was concentrated near the Dead Sea transform fault system: they concluded that the origin of the lavas in that region reflects a strong lithospheric control on the loci of partial melting, which developed as a result of mantle decompression formed as a consequence of the transition from strongly compressive to transtensional stresses. They found no evidence to relate volcanic activity there to any mantle plume. Lease & Abdel-Rahman (Reference Lease and Abdel-Rahman2008) proposed that the Plio-Quaternary Euphrates mafic lavas of eastern Syria are of within-plate alkaline nature, exhibit strong OIB affinities, and were erupted along reactivated deep-seated fractures that were developed beneath the Euphrates basin. The Karacadag volcanic plateau of southern Turkey is covered largely by Late Cenozoic lavas, with K–Ar ages ranging from Late Pliocene to Recent, as reported in Pearce et al. (Reference Pearce, Bender, De Long, Kidd, Low, Güner, Saroglu, Yilmaz, Moorbath and Mitchell1990) and Notsu et al. (Reference Notsu, Fujitani, Ui, Matsuda and Ercan1995). Pearce et al. (Reference Pearce, Bender, De Long, Kidd, Low, Güner, Saroglu, Yilmaz, Moorbath and Mitchell1990) concluded that these transitional to alkaline mafic lavas were derived from the mantle lithosphere of the Arabian continent, which had been enriched by small volumes of asthenospheric melts.
3. The geological context
Volcanism of the Arabian foreland, directly south of the Bitlis suture zone, includes lavas of northeastern Syria (the Tigris volcanic field) and the Karacadag lavas in Turkey. The Tigris field consists of several exposures in the Ardel-Sheikh and Tigris regions (Fig. 2), within which the volcanic rocks in the Syrian part cover an area of about 1750 km2. These volcanic exposures contain lava flows ranging in age from Plio-Quaternary to Recent. The manifestations of volcanism are in the form of fissure eruptions and small shield volcanoes. The Tigris volcanic field is located between latitudes 36° 30′ and 37° 30′ N and longitudes 40° 20′ and 42° 20′ E, within northeastern Syria (Fig. 2c). The Tigris lava flows were erupted onto undeformed Neogene and Quaternary sediments. Regional mapping of Dubertret (Reference Dubertret1955) showed the Neogene and Quaternary volcanic rocks of Syria and Lebanon to be fissure-type eruptions. He stated that lava ascended along re-activated, as well as Recent fault planes, forming voluminous flows.
The Tigris volcanic field is made up of basaltic lava flows, with minor pyroclastic flows. The lavas are mainly composed of phyric varieties (olivine basalts), forming fine-grained, massive rocks with variable degrees of vesicularity. The flows form plateaus typical of shield-type volcanoes, and the lower unit in some of the volcanic piles is topped by craters with lava flows and associated pyroclastic materials, reflecting mixed effusive and explosive activity. Lava flows in the Ardel-Sheikh area occur either at the extension of a zone of NE-trending faults, or in volcanic exposures controlled by the intersection between localized N–S-trending fissures and the extension of NE-trending regional faults. The thickness of lava flow exposures in the Ardel-Sheikh area ranges from 5 m to a maximum of 20 m. Columnar jointed flows, as well as sub-vertical injections of basaltic dykes into Neogene sedimentary host rocks have been observed. These dykes are made up of highly vesicular basalt, with some large vesicles that range from 5 to 15 cm across. Within the Tigris region, lava flow exposures range typically from 10 to 20 m thick, but reaching over 100 m thick at the axial zone of the plateau; the Tigris River forms the eastern boundary of this volcanic plateau. Massive to vesicular porphyritic basalt, containing olivine and clinopyroxene phenocrysts, is the most common lithological variety. Blocky basalt in this region exhibits large blocks in the order of one cubic metre. More recent volcanic activity is indicated by the superposition of lava and scoria cones on the earlier Plio-Quaternary flows (e.g. Ponikarov, Reference Ponikarov1967).
The Tigris volcanic field that occurs on the northern flank of the Arabian plate is situated near major tectonic features: the Bitlis–Zagros suture zone to the north and east, the Euphrates graben (a tensional-related fracture system) in the south, and the left-lateral East Anatolian fault as well as the left-lateral Dead Sea–Ghab transform fault system occurring further to the west (Fig. 2a, b). Sawaf et al. (Reference Sawaf, Al-Saad, Gebran, Barazangi, Best and Chaimov1993) indicated that the Euphrates graben/fault system was developed by extension/transtension following a period of extensive uplift and erosion during Jurassic and Early Cretaceous time. According to Giannerini et al. (Reference Giannérini, Campredon, Féraud and Abou Zakhem1988), a change in plate motion occurred during the Plio-Quaternary, when the Arabian plate rotated to the northeast. The left-lateral Dead Sea–Ghab transform fault system has been active since the end of the Miocene (Lyberis et al. Reference Lyberis, Yurur, Chorowicz, Kasapoglu and Gundogdu1992), and permits the northward movement of the Arabian plate and its collision with Eurasia along the Bitlis–Zagros suture (Fig. 2a, b).
4. Analytical procedures
4.a. Major and trace element analyses
Twenty representative whole-rock samples from the Tigris volcanic field have been analysed for major- and trace elements at the Activation Laboratories (ACTLABS) in Ancaster, Canada. The samples were mixed with a mixture of lithium metaborate/lithium tetraborate and fused. The molten mixture was poured into a 5% nitric acid solution and shaken for approximately 30 minutes until dissolved. The samples were run for major oxides on a combination simultaneous and sequential Thermo Jarrell-Ash Enviro II ICP. Calibration was achieved using a combination of CANMET and USGS reference materials. Loss on ignition (LOI) was determined by heating powdered samples for 50 minutes. The analytical precision, as calculated from 20 replicate analyses of one sample, is better than 1% for most major elements and better than 5% for most trace elements.
4.b. Rare earths, hafnium and tantalum
Analyses for the rare earth elements (REEs), hafnium and tantalum were also conducted at the Activation Laboratories. Solutions of the fused samples, prepared as above, were spiked with three internal standards to cover the entire mass range. These were further diluted and introduced into a Perkin Elmer-SCIEX Elan 6000 ICP-MS using a proprietary sample introduction methodology. The fusion process ensures measurement of total metals (particularly for elements like REEs in resistate phases; this may not be the case for acid digestions, particularly for heavy rare earth elements (HREEs) and other elements contained in refractory minerals like zircon, sphene or monazite). Detection limits and reagent blanks are generally about 10% of chondrite values. The primitive mantle values used for normalization are those of Sun & McDonough (Reference Sun, McDonough, Saunders and Norry1989).
4.c. Isotopes
The Sr and Nd isotopic analyses were conducted at McMaster University, Ontario, Canada. Before commencing the chemical procedures, sample powders were leached in 6M HCl for several hours in order to remove any traces of secondary strontium. Nd and Sr were separated in cation exchange columns; the separation was followed by purification in a second separation column according to the method of Richard, Shimizu & Allègre (Reference Richard, Shimizu and Allègre1976). The solution of Nd was mounted on double filaments and measured on a VG Isolab-54 mass spectrometer with multiple collectors in dynamic mode. During the course of the study, the La Jolla Nd standard gave 143Nd/144Nd = 0.51185. The average precision of repetitions was ± 0.000015 (2σ). The solution of Sr was mounted on a single filament and measured by a VG Isomass-354 with multiple collectors. The Sr isotopes were normalized for fractionation to 86Sr/88Sr = 0.1194, related to a value of 0.710241 for the NBS-987 standard. The average precision of repetitions was ± 0.00002 (2σ).
5. Petrography of the Tigris volcanic rocks
The various lithologies are largely phyric, consisting mainly of olivine and clinopyroxene ± minor plagioclase phenocrysts, occurring within microcrystalline to cryptocrystalline groundmass materials. The latter is made up mainly of plagioclase laths, minute crystals of clinopyroxene and olivine, as well as opaque phases. Textures in these volcanic rocks vary from porphyritic, glomeroporphyritic and rarely aphyric, to ophitic, sub-ophitic, vesicular, intersertal and pilotaxitic.
Labradorite (50 to 55 vol.% of the rock) forms crystals that range in size from tiny microlites to large prisms, occurring mostly as groundmass material in the form of microlaths, and rarely as rectangular microphenocrysts or phenocrysts. Micro-inclusions of apatite needles are occasionally present in some plagioclase crystals. Clinopyroxene forms about 35 vol.% of the rock, occurring both as a phenocryst and as a groundmass phase. Clinopyroxene is rarely twinned and occurs as anhedral to subhedral crystals, sometimes showing complex and sector zoning. Complex zonation observed may be due to simultaneous crystallization of some clinopyroxene with labradorite. Olivine (10 to 15 vol.%) occurs both as subhedral to euhedral, large, equant, occasionally skeletal phenocrysts, and as minute anhedral groundmass crystals. The olivine phenocrysts are generally fresh, but in some rocks olivine is partially altered to iddingsite. Corroded and embayed olivine phenocrysts are observed in many samples. Inclusions of Cr-rich spinel are occasionally present in some olivine crystals. Titan-magnetite, ilmenite and magnetite, occurring as small cubes or acicular needles within the groundmass, represent the main opaque phases present in the Tigris volcanic rocks.
6. Geochemistry
6.a. Major and trace element geochemistry
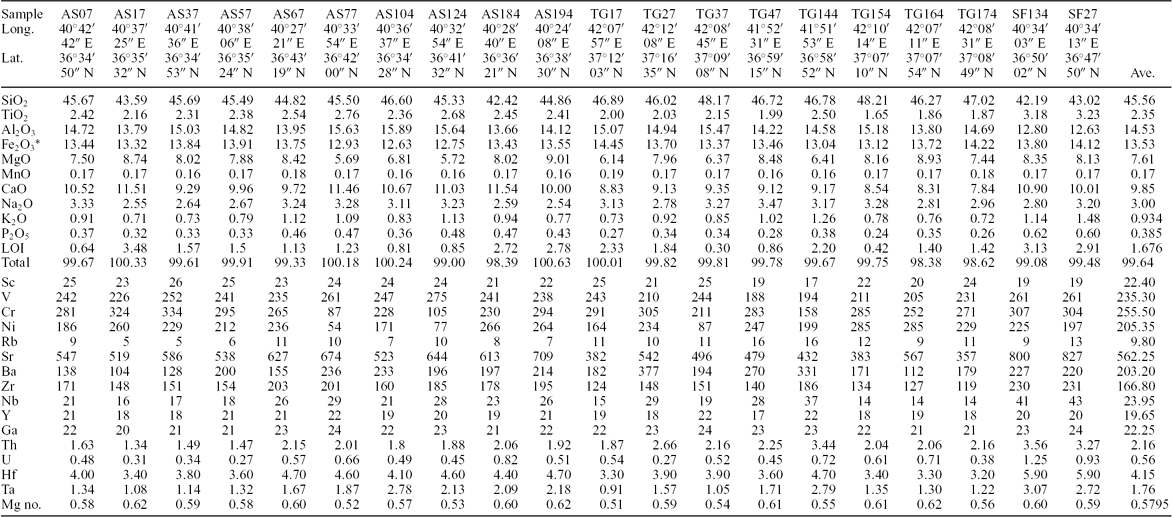
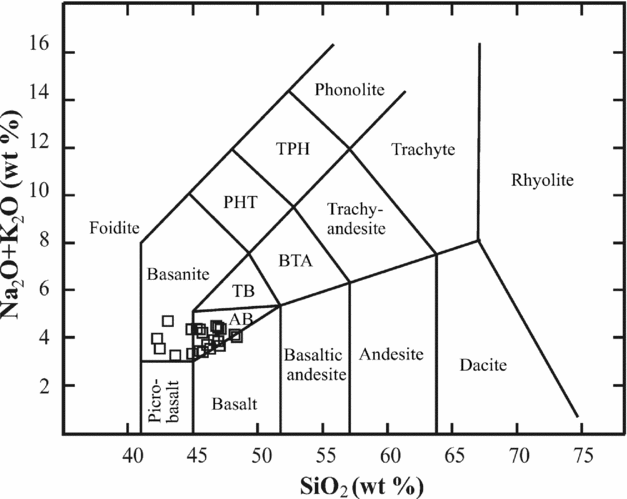
Data on whole-rock major and trace elements for 20 representative samples from the Tigris volcanic field are given in Table 1. Based on their silica contents, the investigated rocks are ultrabasic to basic, as they have low silica values (42.2 to 48.2 wt% SiO2). In general, these rocks exhibit narrow major element compositional ranges: 12.6–15.9 wt% Al2O3, 5.7–9.0 wt% MgO, 12.6–14.5 wt% Fe2O3 (as total iron), 7.8–11.5 wt% CaO and 1.7–3.2 wt% TiO2 (Table 1). The Mg numbers ( = molar Mg/(Mg + Fe2+), assuming an Fe3+/Fe2+ ratio of 0.2) range from 0.51 to 0.62, with an average of 0.58, thus suggesting that the magma may have undergone a degree of olivine and clinopyroxene fractionation. Using the diagram of Le Bas & Streckeisen (Reference Le Bas and Streckeisen1991), the investigated rocks are classified as basanites and alkali basalts (Fig. 3). Rocks of the Tigris volcanic field have a relatively narrow trace element compositional range: Cr = 87–334 ppm, V = 188–275 ppm, Sr = 357–827 ppm, Ba = 104–377 ppm and Rb = 5–16 ppm (Table 1), and are generally enriched in the high-field-strength (HFS) elements such as Zr (119–231 ppm), Y (17–22 ppm) and Nb (14–43 ppm). Averages of some elemental ratios in the Tigris lavas, such as La/Nb (1.11), Zr/Nb (6.96) and Rb/Nb (0.41), along with trace element concentrations are somewhat similar to those in some OIB lavas (Sun & McDonough, Reference Sun, McDonough, Saunders and Norry1989; Weaver, Reference Weaver1991).
Table 1. Major and trace element composition (in wt% and ppm, respectively) of representative samples of the Tigris volcanic field, northeastern Syria
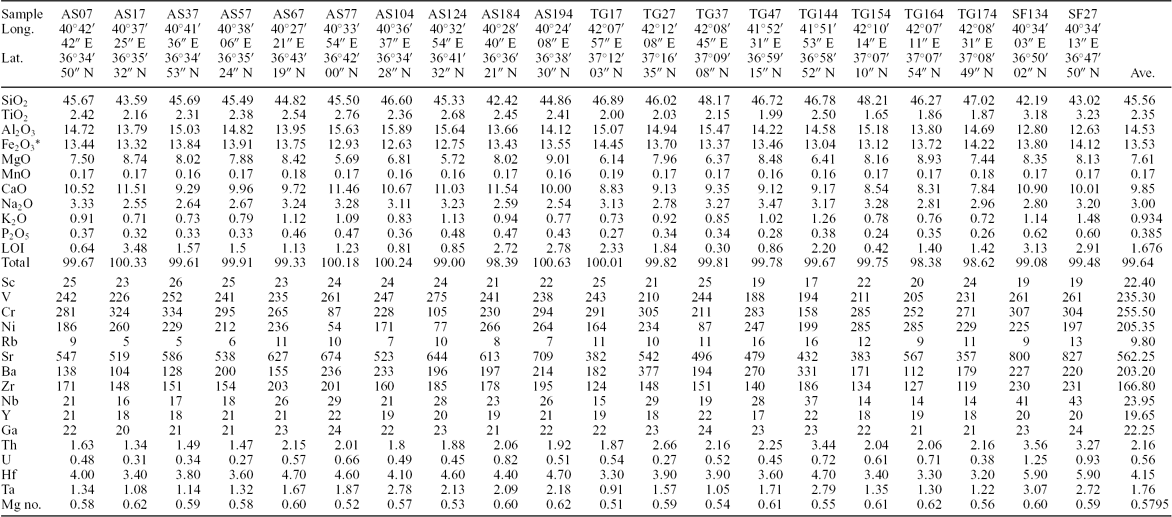
Fe2O3* is total iron presented as Fe2O3, and Mg no. = molar Mg/(Mg+Fe2+) assuming Fe3+/Fe2+ = 0.20.
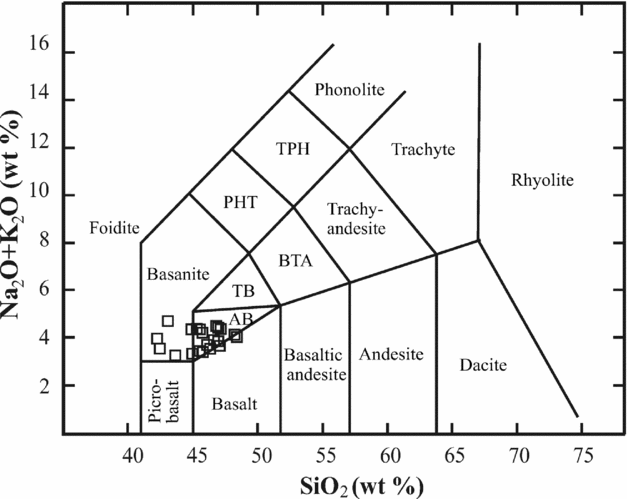
Figure 3. Total alkali–silica (TAS) diagram (after Le Bas & Streckeisen, Reference Le Bas and Streckeisen1991); data points occupy the fields of basanite and alkali basalt (AB). TPH – tephriphonolite; PHT – phonotephrite; TB – trachybasalt; BTA – basaltic trachyandesite.
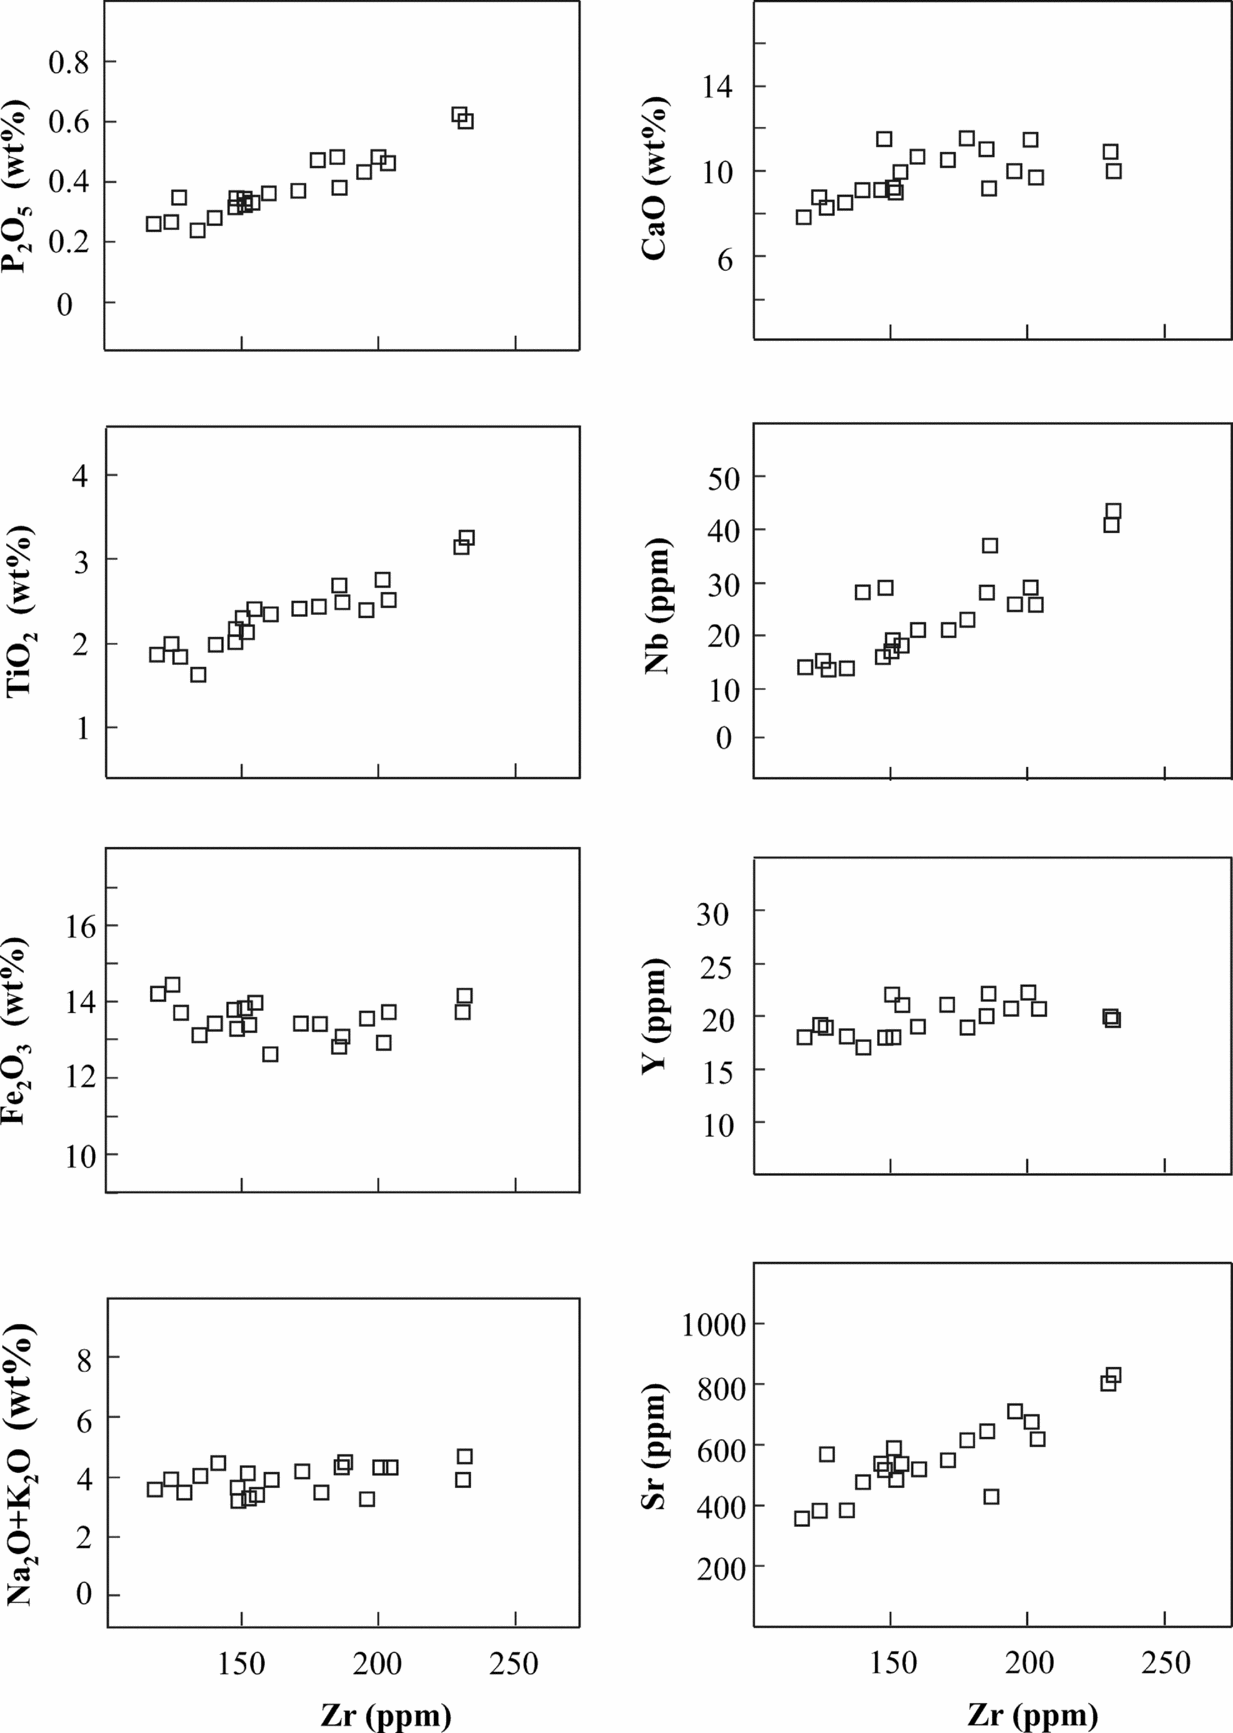
Data points of the Tigris volcanic field, as plotted on variation diagrams of selected major elements versus Zr (Fig. 4), indicate that P2O5, TiO2 and CaO increase gradually with increasing Zr, whereas alkalis and total iron (as Fe2O3) remain somewhat constant. Variations of selected trace elements versus Zr indicate that most trace elements, such as Sr, Y and Nb, show a gradual increase with increasing Zr (Fig. 4). Since Zr and Y are incompatible in the main fractionating phases of basaltic magmas (olivine, pyroxene and plagioclase), the Zr/Y ratio is not normally affected by moderate amounts of fractional crystallization. The variation of Zr/Y with Zr or with FeO could be used to illustrate petrogenetic processes such as fractional crystallization or partial melting. As Zr is more incompatible in mantle phases than Y (Nicholson & Latin, Reference Nicholson and Latin1992), the Zr/Y ratio tends to be higher when the degree of melting is small. Thus, basalts produced by small degrees of partial melting at high pressures have high Zr/Y ratios (and high concentrations of FeO): the Zr/Y ratios in the Tigris rocks are quite high, varying from 6.5 to 11.6. Also, the linear positive variations of Zr/Y, which decrease gradually with decreasing Zr, suggest that partial melting processes have played a significant role in producing the range of magma compositions observed (see Section 7). Trace element data suggest that the Tigris rocks display the geochemical characteristics of within-plate lavas (e.g. Pearce & Norry, Reference Pearce and Norry1979; Meschede, Reference Meschede1986).
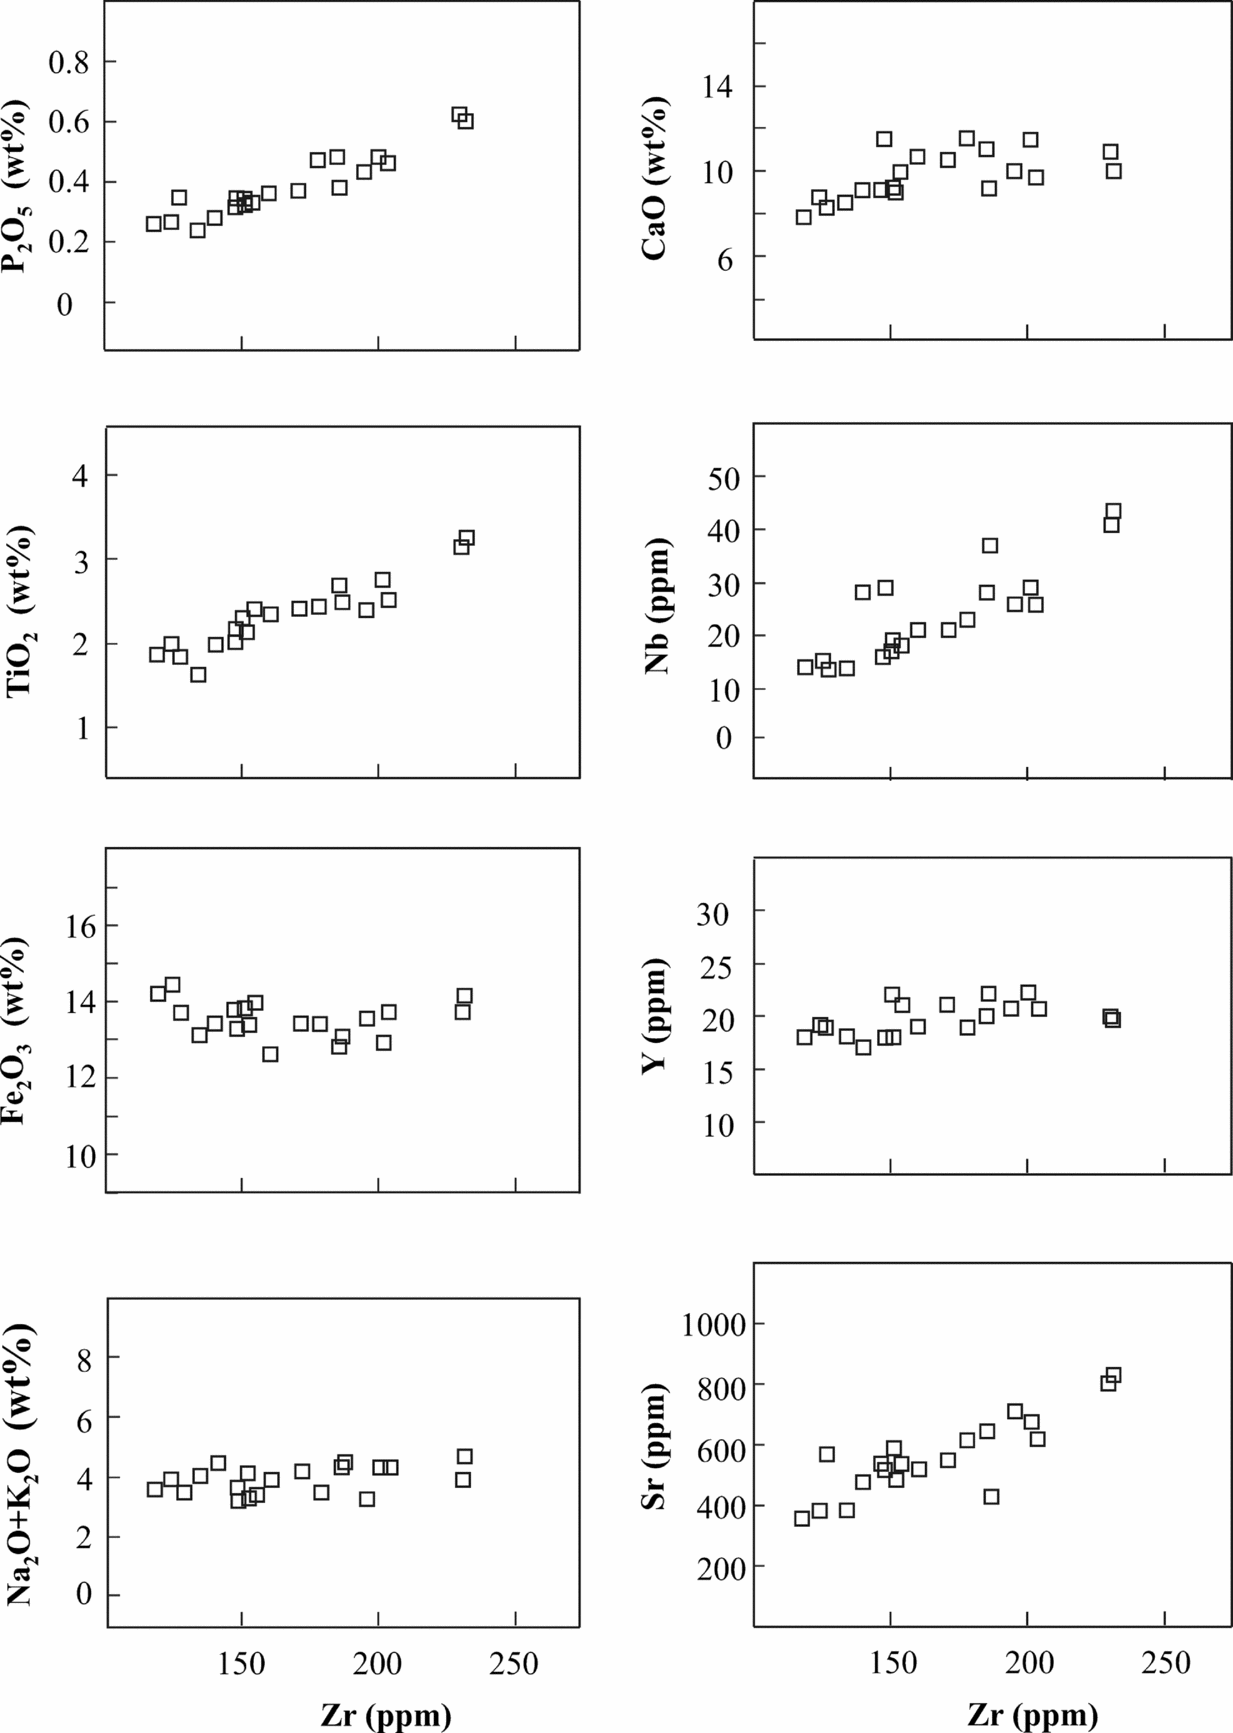
Figure 4. Variations of selected major and trace elements versus Zr within the Tigris volcanic field of northeastern Syria.
6.b. The rare earth elements
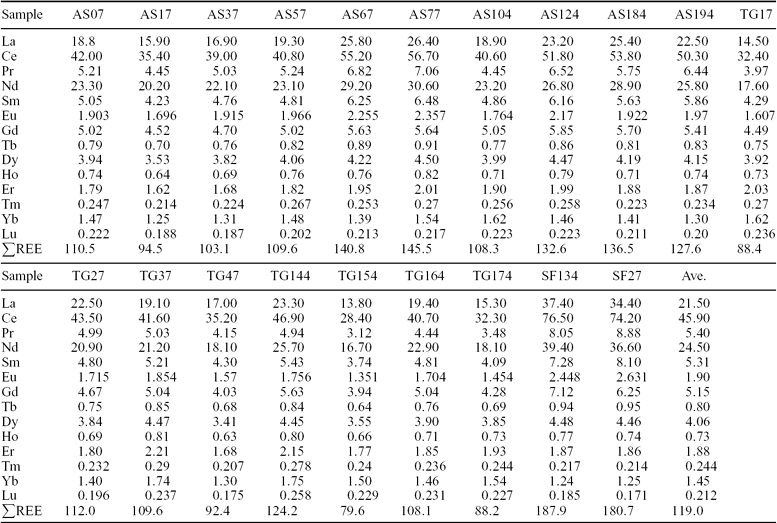
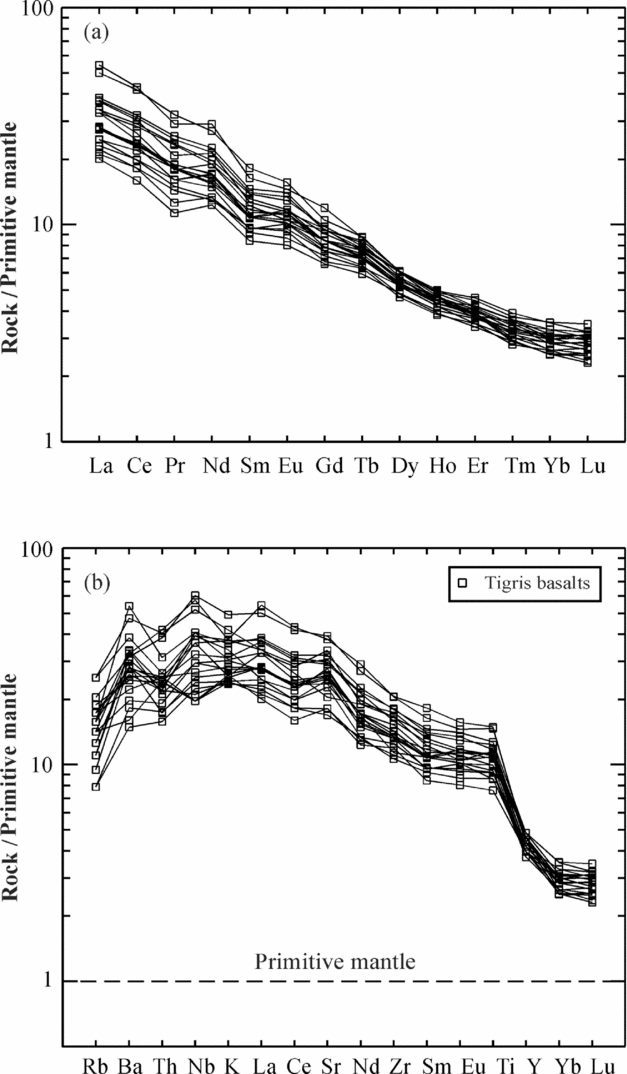
The concentration of the rare earth elements (REEs) for 20 representative samples of the Tigris volcanic field are given in Table 2, and their primitive mantle-normalized REE patterns are presented in Figure 5a. In general, the investigated lavas are enriched in the REEs, with the sum of REEs ranging from 80 to 188 ppm. The REE patterns are uniform, parallel to subparallel and show that the REEs are strongly fractionated ((La/Yb)N = 10.6), as the light rare earth elements (LREEs) are significantly enriched compared to the HREEs (Fig. 5a). Two of the basanite samples (numbers SF-134 and SF-27) that possess some of the lowest SiO2 contents (42.2 and 43.0 wt% SiO2) exhibit the highest LREE concentrations. This feature is most likely the result of differences in the degrees of partial melting of the mantle source rock; it is not due to contamination (see Section 7). Enrichment in the LREEs is a characteristic feature of OIB-type alkali basalts (e.g. Sun & McDonough, Reference Sun, McDonough, Saunders and Norry1989; Wittke & Mack, Reference Wittke and Mack1993; Abdel-Rahman, Reference Abdel-Rahman2002): the REE profiles of the Tigris lavas are very similar to those of the St Helena alkali basalts (of Chaffey, Cliff & Wilson (Reference Chaffey, Cliff, Wilson, Saunders and Norry1989) which are typical of high μ (HIMU)-OIB).
Table 2. Rare earth element (REE) composition (in ppm) of the Tigris volcanic field, northeastern Syria
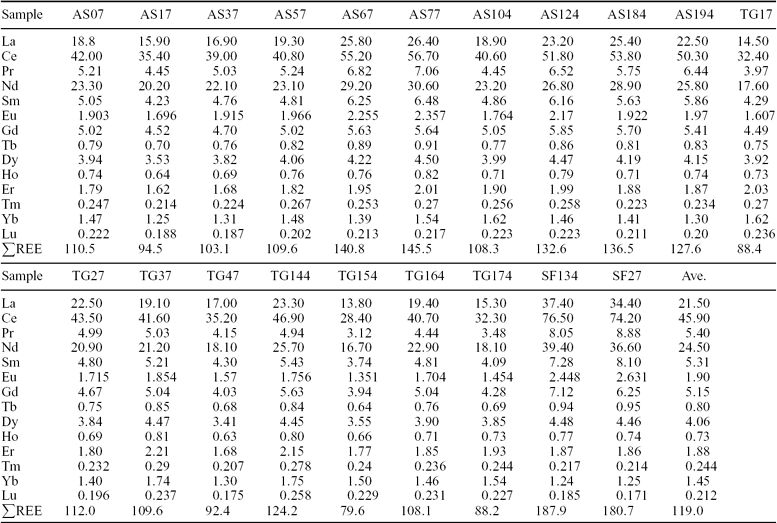
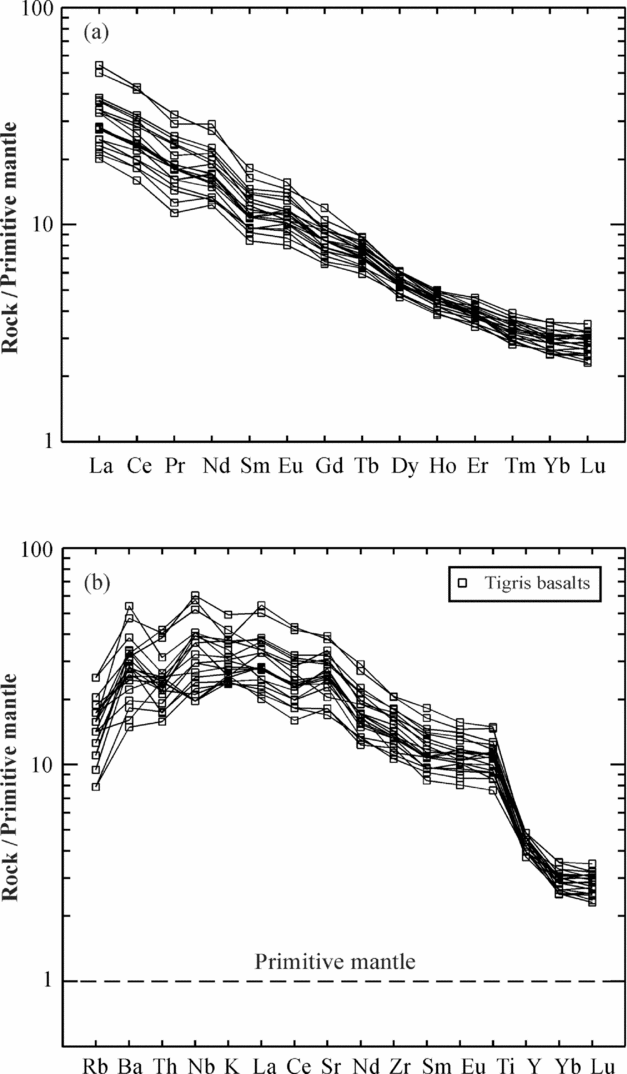
Figure 5. (a) Primitive mantle-normalized rare earth element (REE) patterns of the Tigris volcanic field. (b) Primitive mantle-normalized incompatible element patterns for the Tigris lavas. Normalization values used are from Sun & McDonough (Reference Sun, McDonough, Saunders and Norry1989).
Figure 5b, which shows the primitive mantle-normalized incompatible element patterns of the Tigris lavas, indicates that the lavas are enriched in the large ion lithophile elements (LILE: K, Rb, Ba, Th and the LREEs) and the incompatible HFS elements Nb, Zr, and Ti relative to primitive mantle normalizing abundances. The marked depletion of Y and the HREEs in the Tigris lavas reflects that garnet was a residual phase during the partial melting event. According to Pearce et al. (Reference Pearce, Bender, De Long, Kidd, Low, Güner, Saroglu, Yilmaz, Moorbath and Mitchell1990), melting of ‘plume’ asthenosphere or lithosphere enriched by small volume melts from the asthenosphere produces ‘humped’ patterns with Ba, Th and Nb the most enriched elements and the degree of enrichment directly relating to the degree of incompatibility. The Tigris lavas can be interpreted in terms of a mantle source with significant enrichment of asthenospheric melt (see Section 7).
6.c. Rb–Sr and Sm–Nd isotopes
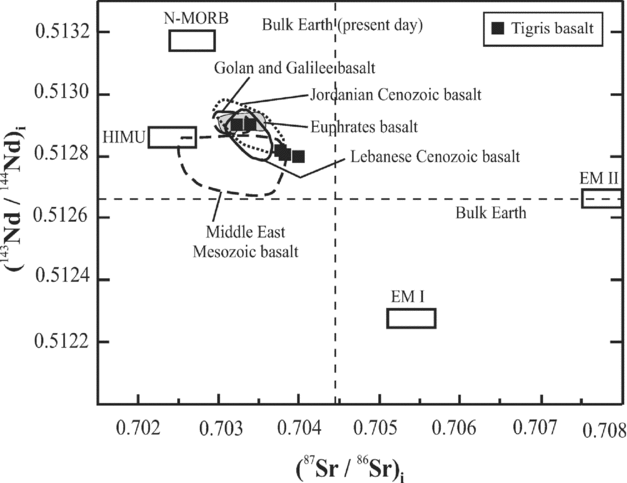
As shown in Table 3, the 143Nd/144Nd isotopic compositions of representative samples of the Tigris volcanic field range from 0.512803 ± 1 to 0.512908 ± 1 (ε Nd = 3.2 to 5.3), whereas the 87Sr/86Sr ratios range from 0.70327 ± 2 to 0.70403 ± 2. These isotopic compositions are plotted in Figure 6, along with data from other alkali basaltic suites from Jordan, Israel, Lebanon and Syria. Also plotted in this diagram (Fig. 6) are the compositions of various mantle reservoirs (EMI, EMII, HIMU and N-MORB), taken from Hart (Reference Hart1988). It should be noted that EMI (‘enriched mantle 1’) and EMII (‘enriched mantle 2’) types of OIB may represent the addition of small amounts of subducted sediments: pelagic in the case of EMI and terrigenous in the case of EMII (Weaver, Reference Weaver1991; Hofmann, Reference Hofmann1997). HIMU (‘high μ’) refers to a high 238U/204Pb (μ) mantle end-member, and has the lowest 87Sr/86Sr of any OIB (Hofmann, Reference Hofmann1997), which is thought to be derived from subducted basaltic oceanic crust.
Table 3. Sr and Nd isotopic composition of representative samples from the Tigris volcanic field, northeastern Syria

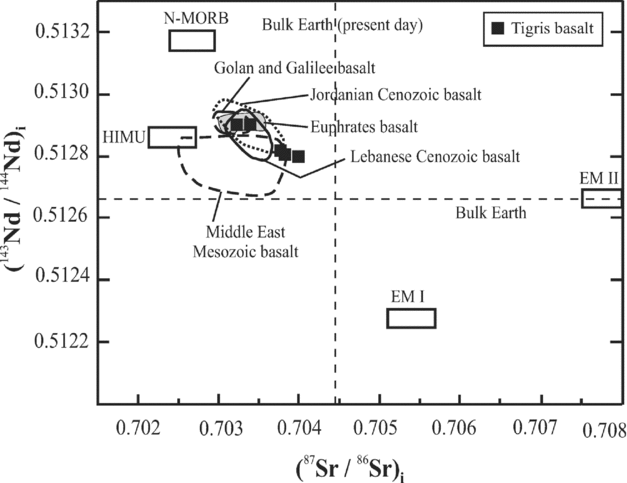
Figure 6. Initial ratios of 143Nd/144Nd versus 87Sr/86Sr diagram for the Tigris volcanic field of northeastern Syria (squares). Compositions of EMI (enriched mantle 1), EMII (enriched mantle 2), HIMU (high μ) and N-MORB (normal-MORB) are from Hart (Reference Hart1988). Fields for Middle East Mesozoic basalts from Laws & Wilson (Reference Laws and Wilson1997) and Abdel-Rahman (Reference Abdel-Rahman2002), Jordanian alkali basalts from Shaw et al. (Reference Shaw, Baker, Menzies, Thirlwall and Ibrahim2003), Golan–Galilee alkali basalts from Weinstein et al. (Reference Weinstein, Navon, Altherr and Stein2006), Lebanese Cenozoic alkali basalts from Abdel-Rahman & Nassar (Reference Abdel-Rahman and Nassar2004) and Euphrates alkali basalts from Lease & Abdel-Rahman (Reference Lease and Abdel-Rahman2008). See text for details.
As shown in Figure 6, the Tigris lavas are isotopically similar to the Mesozoic alkali basalts of the Middle East (Laws & Wilson, Reference Laws and Wilson1997; Abdel-Rahman, Reference Abdel-Rahman2002), the Jordanian alkali basalts (Shaw et al. Reference Shaw, Baker, Menzies, Thirlwall and Ibrahim2003), the Lebanese Cenozoic alkali basalts (Abdel-Rahman & Nassar, Reference Abdel-Rahman and Nassar2004), the Golan–Galilee alkali basalts (Weinstein et al. Reference Weinstein, Navon, Altherr and Stein2006) and the Euphrates alkali basalts (Lease & Abdel-Rahman, Reference Lease and Abdel-Rahman2008). The investigated lavas also show isotopic compositions similar to OIB-type alkali basalts (e.g. Staudigel et al. Reference Staudigel, Zindler, Hart, Leslie and Clague1984; Hofmann, Reference Hofmann1997), as they exhibit relatively high initial 143Nd/144Nd and low initial 87Sr/86Sr isotopic ratios, and are thus distinct from EMI-OIB and EMII-OIB (e.g. Weaver, Reference Weaver1991; Wilson, Reference Wilson1993). It should be noted that the Lebanese and the Euphrates lavas were interpreted to represent small-degree partial melts of upper mantle material (Abdel-Rahman & Nassar Reference Abdel-Rahman and Nassar2004; Lease & Abdel-Rahman, Reference Lease and Abdel-Rahman2008).
7. Discussion
7.a. Constraints on source region of the Tigris lavas
The presence of garnet as a residual phase in the source region of the Tigris lavas can be inferred from (i) fractionation of the HREEs (McKenzie & O'Nions, Reference McKenzie and O'Nions1991) and (ii) the greater than chondritic Dy/Yb ratio (1.57): the Tigris lavas have an average Dy/Yb ratio of 2.8. Variations in some HFS elemental ratios such as Zr/Y versus Zr/Nb (Fig. 7a) indicate that data points of the investigated volcanic rocks plot within or near the fields of plume-related mid-ocean ridge basalt (P-MORB), and HIMU-OIB, as they exhibit relatively lower concentrations of Y, but with higher concentrations of Zr and Nb than transitional-, or normal-MORB (T-MORB or N-MORB; Menzies & Kyle, Reference Menzies, Kyle and Menzies1990; Melluso et al. Reference Melluso, Beccaluva, Brotzu, Gregnanin, Gupta, Morbidelli and Traversa1995). The examined rocks overlap with the Cenozoic alkali basalts of Jordan (after Shaw et al. Reference Shaw, Baker, Menzies, Thirlwall and Ibrahim2003), the Golan–Galilee (Weinstein et al. Reference Weinstein, Navon, Altherr and Stein2006) and the Euphrates region (Lease & Abdel-Rahman, Reference Lease and Abdel-Rahman2008), but exhibit higher Zr/Y ratios than the Lebanese basalts of Abdel-Rahman & Nassar (Reference Abdel-Rahman and Nassar2004). The Tigris lavas also exhibit elemental ratios (Zr/Nb = 6.96, La/Nb = 1.11, Ba/Th = 94 and Rb/Nb = 0.41, on average) similar to those characteristic of OIB (Weaver, Reference Weaver1991).
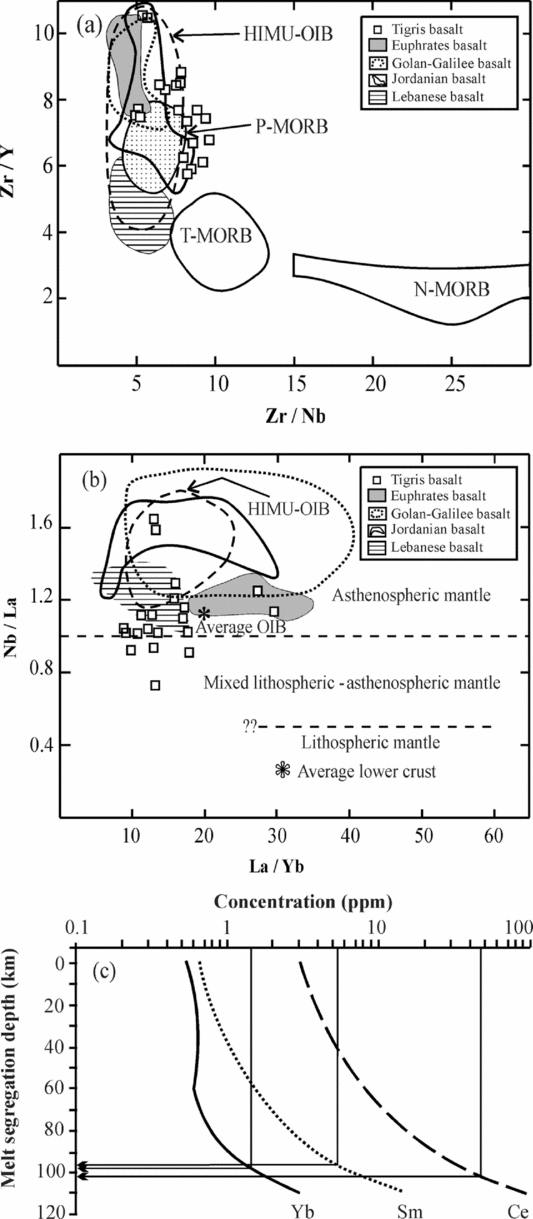
Figure 7. (a) Zr/Y versus Zr/Nb diagram showing that the Tigris volcanic field of northeastern Syria plots near the fields of OIB and HIMU-OIB (taken from Abdel-Rahman, Reference Abdel-Rahman2002), and near the field of fertile, plume-related MORB (P-MORB). The other fields are transitional-MORB (T-MORB) and normal-MORB (N-MORB) and are taken from Menzies & Kyle (Reference Menzies, Kyle and Menzies1990). (b) Nb/La versus La/Yb variation diagram. The composition of the Tigris lavas (relatively low La/Yb and high Nb/La) suggests an OIB-like asthenospheric mantle source. Average OIB is after Fitton, James & Leeman (Reference Fitton, James and Leeman1991), and average lower crust (representing average of six lower crustal granulite xenoliths) is after Chen & Arculus (Reference Chen and Arculus1995). The field of HIMU-OIB and the dashed lines separating fields of the asthenospheric, lithospheric and mixed mantle are taken from Abdel-Rahman (Reference Abdel-Rahman2002). Fields of Jordanian alkali basalts from Shaw et al. (Reference Shaw, Baker, Menzies, Thirlwall and Ibrahim2003); Golan–Galilee alkali basalts from Weinstein et al. (Reference Weinstein, Navon, Altherr and Stein2006); Lebanese Cenozoic alkali basalts from Abdel-Rahman & Nassar (Reference Abdel-Rahman and Nassar2004); Euphrates alkali basalts from Lease & Abdel-Rahman (Reference Lease and Abdel-Rahman2008). (c) Model Ce, Sm and Yb concentrations in melts generated by partial melting and ranges of final melt segregation depths (model curves are after Ellam, Reference Ellam1992). The compositions of the Tigris lavas (marked by vertical lines) indicate final melt segregation at depths of 96 to 103 km.
Bradshaw & Smith (Reference Bradshaw and Smith1994) and Smith et al. (Reference Smith, Sánchez, Walker and Wang1999) have suggested that, since HFS elements (such as Nb) are depleted in the lithospheric mantle relative to the LREEs (e.g. La), high Nb/La ratios (approximately > 1) indicate an OIB-like asthenospheric mantle source for basaltic magmas, and lower ratios (approximately < 0.5) indicate a lithospheric mantle source. The Tigris rocks exhibit Nb/La and La/Yb ratios (1.1 and 16, on average) that are consistent mostly with an asthenospheric mantle (OIB-like) source: data points plot mainly in the field of asthenospheric mantle and near average OIB, but with a few (only 4 out of 20 samples) spilling over into the mixed lithosphere–asthenosphere field (Fig. 7b). This is also consistent with data from the Cenozoic alkali basalts of Jordan, Lebanon, Golan–Galilee and the Euphrates region (after Shaw et al. Reference Shaw, Baker, Menzies, Thirlwall and Ibrahim2003; Abdel-Rahman & Nassar, Reference Abdel-Rahman and Nassar2004; Weinstein et al. Reference Weinstein, Navon, Altherr and Stein2006; Lease & Abdel-Rahman, Reference Lease and Abdel-Rahman2008, respectively), as all plot in the field of asthenospheric mantle (Fig. 7b). Thus, trace element and isotopic data (cf. Figs 5–7) suggest that the Tigris lavas have chemical characteristics similar to OIB, and were likely derived from a source within the asthenospheric mantle, near the lithospheric mantle boundary. The relatively uniform 143Nd/144Nd ratios (ε Nd = 3.2 to 5.3) within the Tigris volcanic field suggest that its magma was developed by partial melting of an isotopically uniform mantle source.
7.b. Possible depth of melt segregation and role of crustal contamination
McKenzie & O'Nions (Reference McKenzie and O'Nions1991) and Lassiter, DePaolo & Mahoney (Reference Lassiter, DePaolo and Mahoney1995) have established that the transition from garnet to spinel peridotite takes place between a depth of about 60 to 80 km for normal mantle and about 80 to 100 km within hot mantle plumes. Based on the study of McKenzie and O'Nions (Reference McKenzie and O'Nions1991), Ellam (Reference Ellam1992) investigated the relationship between the trace element compositions of basalts, variations in thickness of the lithosphere and final depths of melt segregation. Using his method, curves corresponding to the Ce, Sm and Yb concentrations of the Tigris volcanic field (Fig. 7c) indicate a melt segregation depth ranging from about 96 to 103 km (i.e. well within the garnet lherzolite stability field), consistent with an asthenospheric mantle source as indicated above (cf. Fig. 7b).
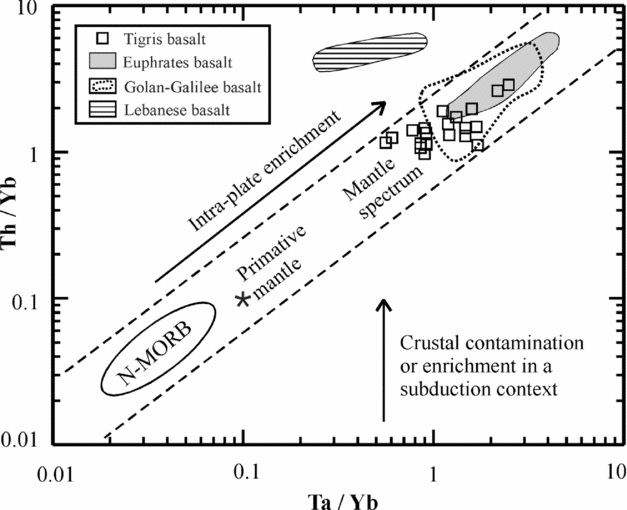
A number of chemical parameters have been used to assess the degree of contamination that silicate melts may have experienced. For example, basaltic lavas affected by crustal contamination exhibit K/P ratios > 7, La/Ta > 22 and La/Nb > 1.5 (Hart et al. Reference Hart, Wolde, Walter and Mertzman1989). The low values of such elemental ratios in rocks of the Tigris volcanic field (K/P = 4.6; La/Ta = 12; La/Nb = 0.90, on average), along with low ratios of Nb/Y (1.22) and Th/Nb (0.09) suggest that the lavas were not significantly affected by crustal contamination. On the Th/Yb versus Ta/Yb variation diagram of Pearce (Reference Pearce, Hawkesworth and Norry1983), the Tigris volcanic rocks plot along the diagonal trend of the mantle spectrum, and away from the trend of crustal contamination (Fig. 8). It should be noted that this alone does not necessarily confirm that no contamination has taken place. However, the relatively low 87Sr/86Sr ratios of the Tigris lavas (0.70327 to 0.70403), which could represent mantle source values, along with their low silica values (45.6 wt% SiO2, on average), further suggest that the magma was subjected to no, or minimal, crustal contamination. As pointed out by Smith et al. (Reference Smith, Sánchez, Walker and Wang1999), the Nd content of most lower crustal xenoliths is too low (usually < 10 ppm) to significantly change Nd-isotopic values without adding 70% to 85% lower crustal material. Such large amounts of contamination by crustal material is thermodynamically difficult because a considerable amount of heat is required to assimilate crustal rocks, and the magma would then cool quickly and perhaps ‘freeze’ in place. Moreover, this would have resulted in the presence of some lower crustal xenoliths within the lava flows, but the Tigris lava flows contain no such crustal xenoliths. Contamination modelling on these rocks produced ambiguous rather than clear results, but the geochemical and field characteristics suggest that the role of crustal contamination during magma evolution has been minimal.
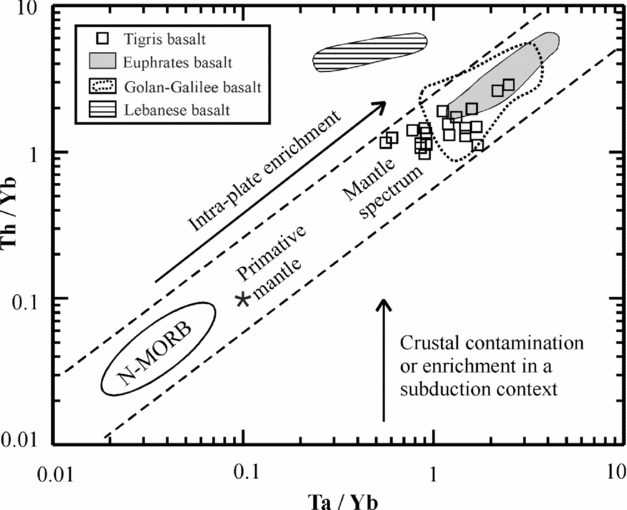
Figure 8. Th/Yb versus Ta/Yb diagram (after Pearce, Reference Pearce, Hawkesworth and Norry1983) showing that the data points of the Tigris volcanic field plot along the diagonal trend of the mantle spectrum, being distinct from the crustal contamination trend. Fields of Golan–Galilee alkali basalts from Weinstein et al. (Reference Weinstein, Navon, Altherr and Stein2006); Lebanese Cenozoic alkali basalts from Abdel-Rahman & Nassar (Reference Abdel-Rahman and Nassar2004); and Euphrates alkali basalts from Lease & Abdel-Rahman (Reference Lease and Abdel-Rahman2008).
7.c. Petrogenetic considerations: fractional versus batch melting
Various partial melting processes of a multiphase solid assemblage generate magmas. In order to select the proper equations for the petrogenetic modelling of the Tigris lavas, the appropriate process of melting of the mantle source material must first be identified. In fractional melting, the liquid is directly isolated from the system as soon as it is formed and is thereby prevented from further reaction with the crystalline residue. It can be thought of as an infinite number of infinitely small equilibrium fusion events, and large volumes of compositionally distinct magmas can be produced (i.e. liquids of different compositions are formed). Thus, fractional melting is the process by which each infinitesimally small amount of liquid that forms is immediately removed from the source rock.
Kelemen et al. (Reference Kelemen, Hirth, Shimizu, Spiegelman and Dick1997) reviewed melting processes beneath ocean spreading ridges; they demonstrated that reactive flow plays an important role, but somewhere in the upwelling, mantle melting must be ‘near-fractional’, with intergranular porosities less than 1% and most melt extraction must be in isolated conduits. Kelemen et al. (Reference Kelemen, Hirth, Shimizu, Spiegelman and Dick1997) also indicated that not all melting is necessarily near-fractional. Kelemen et al. (Reference Kelemen, Hirth, Shimizu, Spiegelman and Dick1997) tested a model in which melting is fractional until 7 wt% melt is extracted, after which an additional 13% batch melting occurs, thus demonstrating that this model also provides a good fit to the peridotite data they have used. By this, they indicated that there are a rich variety of melt extraction mechanisms (if the amount of reactive porous flow is variable) that produce residues similar to abyssal peridotites. Kelemen et al. (Reference Kelemen, Hirth, Shimizu, Spiegelman and Dick1997) stated that ≥ 3% near-fractional melting is apparently required to account for the abyssal peridotite data.
In sharp contrast to the fractional melting process, equilibrium fusion occurs when the liquid produced on heating continually reacts and re-equilibrates with the crystalline residue (Presnall, Reference Presnall1969). Therefore, when the thermodynamic equilibrium is attained between the melt and the solid, the partitioning of trace elements between melt and solid can be described by equilibrium partition coefficients. This process is often named ‘batch partial melting’ (Allègre & Minister, Reference Allègre and Minster1978). In this process, blobs of magma develop and are then separated from the parent rock. Thus, batch melting refers to the formation of a partial melt in which the liquid remains in equilibrium with the solid residue until it leaves the area as a ‘batch’ of primary magma.
On the conditions of partial melting (fractional versus batch melting), Gast (Reference Gast1968) demonstrated the difficulty of segregating a small amount or small fractions of liquid from a large volume of residual solid, especially for a small degree of melting (like the case of the Tigris lavas). Some of the physical parameters relevant to this problem are differential buoyancy and surface tension forces. It was also demonstrated that in such a case of a great depth of melting (around 100 km deep), equilibrium between melt and residual solid is normally obtained. Allègre & Minister (Reference Allègre and Minster1978) indicated that equilibrium partial melting (i.e. batch melting) seems probable for the generation of basaltic magma.
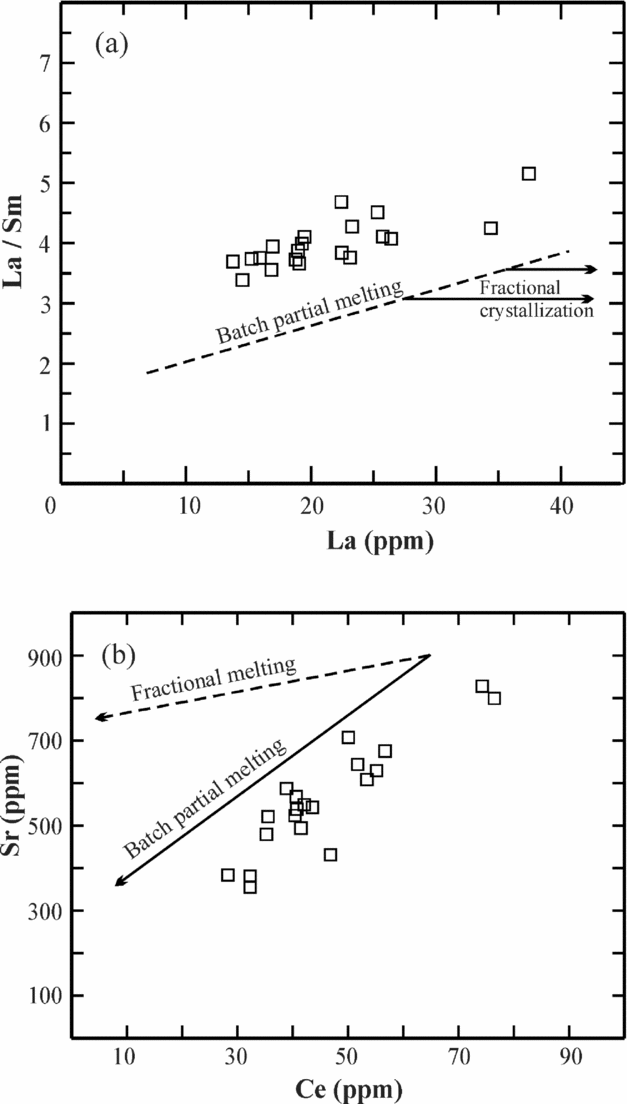
In their study to distinguish between the processes of fractional crystallization, equilibrium (or batch) partial melting and disequilibrium (or fractional) melting, Treuil & Joron (Reference Treuil and Joron1975) developed the approach of ‘magmatophile’ elements (such as HREEs, Zr, Hf) and ‘hypermagmatophile’ elements (such as Ta, Th, La, Ce). They used the diagram La/Sm versus La to demonstrate that during fractional crystallization, data points representing a series of mafic lavas plot along a horizontal line, whereas those produced by batch partial melting plot along a positive trend reflecting gradual increase in La with increasing La/Sm ratios (Fig. 9a). In his study, Loubet (Reference Loubet1976), who correlated elements which have similar behaviours and are related by the same mineral phases (see trends shown in the Sr versus Ce diagram, Fig. 9b), ruled out the process of disequilibrium partial melting. Thus, data representing the Tigris volcanic field plot along the batch partial melting trend (Fig. 9). This diagram reflects also that the process of fractional crystallization did not play any significant role during the evolution of the Tigris lavas. In developing their quantitative models for trace elements, a number of authors including Schilling & Winchester (Reference Schilling, Winchester and Runcorn1967), Gast (Reference Gast1968) and Shaw (Reference Shaw1970) have used the process of batch partial melting. We have also used the batch partial melting equations in the petrogenetic modelling of the Tigris lavas as given in the next Section.
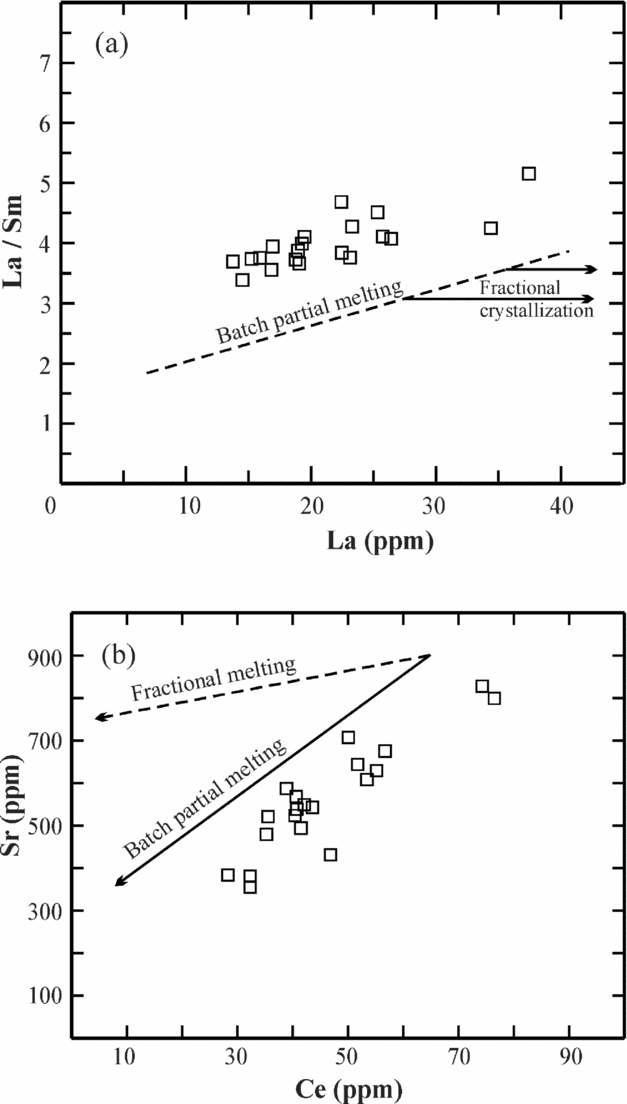
Figure 9. (a) La/Sm versus La diagram (after Truil & Joron, Reference Treuil and Joron1975) showing that the data points of the Tigris volcanic field follow a batch partial melting trend. (b) Schematic plot of Sr versus Ce (after Loubet, Reference Loubet1976) showing that the data points of the Tigris volcanic field follow a batch partial melting trend.
7.d. Origin of the Tigris lavas
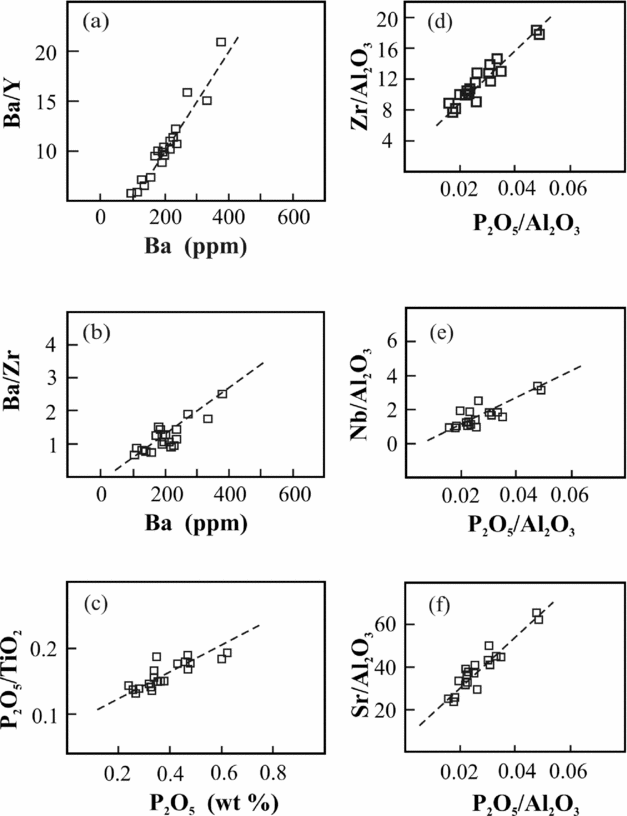
Several investigations including those of White (Reference White1985), Allègre et al. (Reference Allègre, Hamelin, Provost and Dupré1987), Hart (Reference Hart1988), Weaver (Reference Weaver1991), Ellam (Reference Ellam1992), Haase (Reference Haase1996), Haase, Stoffers & Garbe-Schönberg (Reference Haase, Stoffers and Garbe-Schönberg1997), Gibson et al. (Reference Gibson, Thompson, Weska, Dickin and Leonardos1997), Abdel-Rahman & Kumarapeli (Reference Abdel-Rahman and Kumarapeli1999), Frey et al. (Reference Frey, Clague, Mahoney and Sinton2000), Gibb & Henderson (Reference Gibb and Henderson2006) and Weinstein et al. (Reference Weinstein, Navon, Altherr and Stein2006) show that mafic alkaline lavas are diverse geochemically and form by partial melting of a range of mantle sources. A number of geochemical parameters have been used to assess the role of petrogenetic processes such as fractional crystallization and partial melting in the evolution of mafic lavas. For example, Pankhurst (Reference Pankhurst1977) indicated that during partial melting processes, the highly/moderately incompatible element ratios (such as Ba/Y, Ba/Zr and P2O5/TiO2) are known to decrease with increasing degrees of partial melting, and that partial melting is still by far the most efficient process for fractionating these elements. The linear positive trends between these elemental ratios and the concentrations of the highly incompatible elements (Fig. 10a–c) suggest that partial melting may explain variations in the Tigris lavas. The ratio of an element (X) incompatible during melting to Al2O3 (which is usually buffered by residual garnet) typically decreases systematically with increasing degrees of partial melting (Hoernle & Schmincke, Reference Hoernle and Schmincke1993). The variations of Zr/Al2O3, Nb/Al2O3 and Sr/Al2O3 versus P2O5/Al2O3 (Fig. 10d–f) produced linear trends, mostly passing through or near the origin, which is indicative of the significant role of partial melting processes in producing the range of magma chemistry observed in the Tigris volcanic rocks. The available data suggest that the source of these rocks was a fertile, garnet-bearing, asthenospheric mantle.
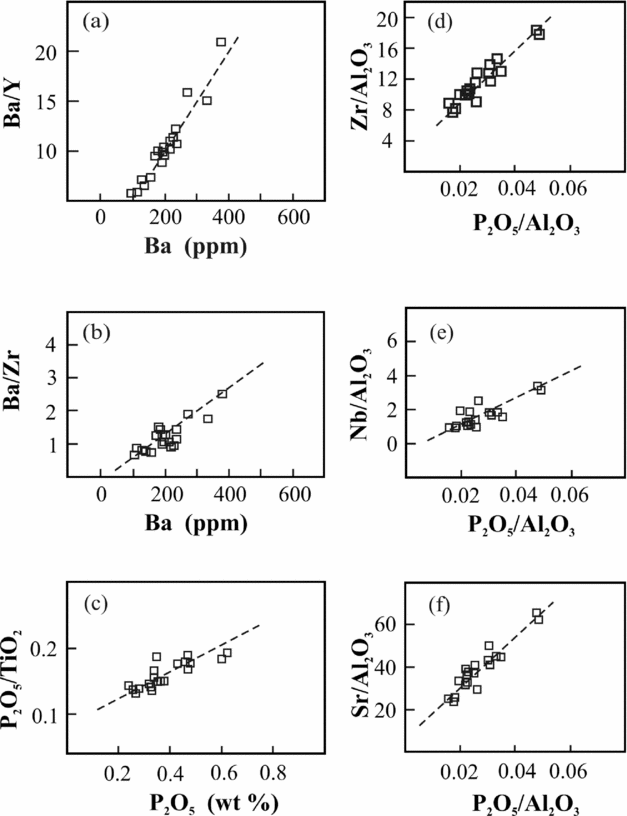
Figure 10. (a, b, c). Plots showing highly/moderately incompatible element ratios versus highly incompatible element concentrations for the Tigris lavas. Zr/Al2O3, Nb/Al2O3 and Sr/Al2O3 versus P2O5/Al2O3 diagrams (d, e, f, respectively) for the Tigris lavas. See text for details.
In order to quantify and assess partial melting as a petrogenetic process, modelling was performed using the batch melting equations of Shaw (Reference Shaw1970) and Allègre & Minister (Reference Allègre and Minster1978), and the calculations were done using two model source compositions. These are a primitive mantle taken from Sun & McDonough (Reference Sun, McDonough, Saunders and Norry1989) and a mixed (50% primitive–50% depleted) mantle source of McKenzie & O'Nions (Reference McKenzie and O'Nions1991). Spinel, garnet and clinopyroxene were assumed to decrease in abundance linearly with increasing degrees of partial melting, as they are typically consumed at less than 25% partial melting (McKenzie & O'Nions, Reference McKenzie and O'Nions1991; Lassiter, DePaolo & Mahoney, Reference Lassiter, DePaolo and Mahoney1995).
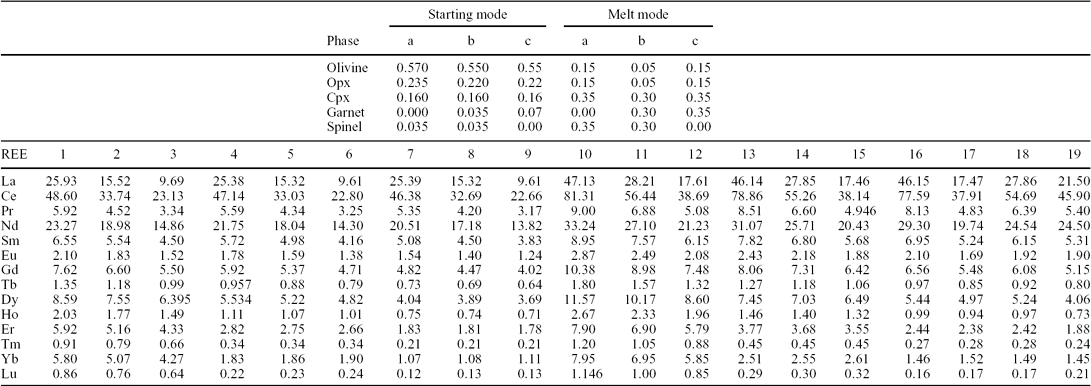
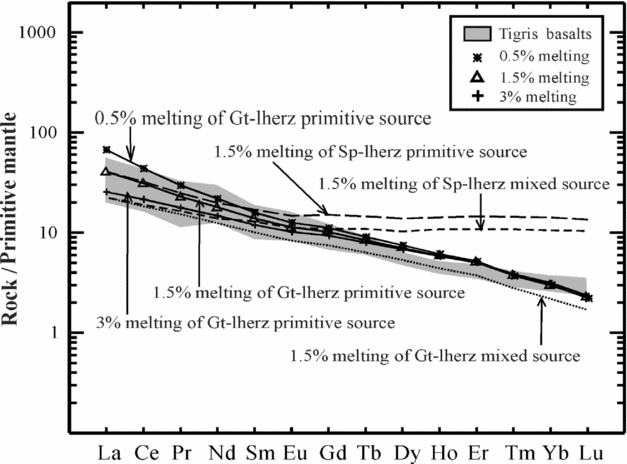
Model and melting proportions are given in Table 4, and are in line with those used in other partial melting calculations (e.g. Hanson, Reference Hanson1980; McKenzie & O'Nions, Reference McKenzie and O'Nions1991; Witt-Eickschen & Kramm, Reference Witt-Eickschen and Kramm1997). Modelling was performed using three different mantle mineral assemblages (spinel lherzolite, garnet lherzolite and spinel–garnet lherzolite) for both a primitive and a mixed source composition. Distribution coefficients (Kds) used are taken from McKenzie & O'Nions (Reference McKenzie and O'Nions1991). Partial melting calculations were performed for 0.5%, 1.5% and 3% batch partial melting. The results of the modelling (Table 4; Fig. 11) show that melting of a spinel-bearing source overestimates the HREEs, and melting of a mixed source yields much lower LREE concentrations. Thus, neither depleted nor mixed primitive/depleted mantle material represent the mantle source for the Tigris lavas and garnet is a required phase, but possibly with some minor spinel. The REE pattern of the calculated liquid produced by 1.5% batch partial melting of a fertile, garnet lherzolite (of a primitive mantle composition) produces a reasonable fit, as it closely matches that of the average Tigris lavas (Table 4), and falls well within the envelope containing the REE profiles of these lavas (Fig. 11). Although data for the calculated model liquid and that of the observed melt match closely, Frey, Green & Roy (Reference Frey, Green and Roy1978) considered that up to a 15% difference between calculated and observed melts represented excellent agreement.
Table 4. Model parameters and results of batch partial melting calculations using various mineralogical and chemical compositions of primitive and mixed mantle sources
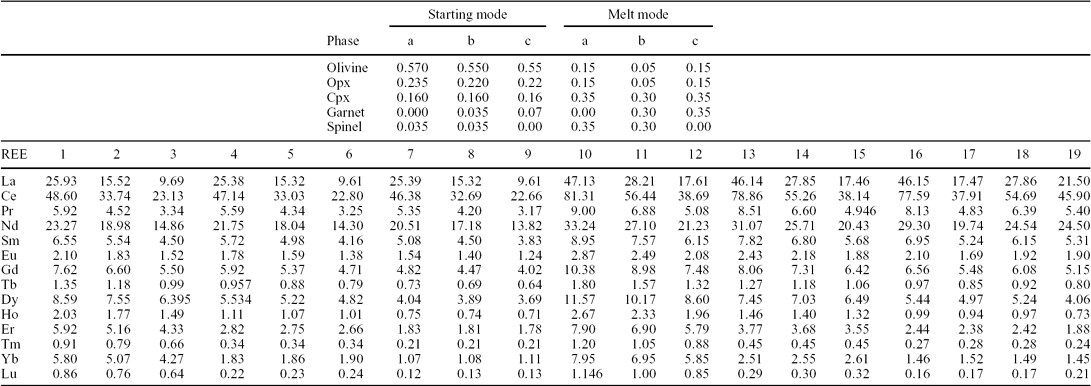
Calculated melts produced by 0.5%, 1.5% and 3% batch partial melting are no. 1 to no. 18; no. 19 is the measured average REE concentration of the Tigris lavas. The starting mode, melt mode and mantle source type used to produce each of the calculated melts are as follows:
Melt nos. 1–3: starting mode a, melt mode a, mixed source, for 0.5, 1.5 and 3.0% melting, respectively;
nos. 4–6: starting mode b, melt mode b, mixed source, for 0.5, 1.5 and 3.0% melting, respectively;
nos. 7–9: starting mode c, melt mode c, mixed source, for 0.5, 1.5 and 3.0% melting, respectively;
Melt nos. 10–12: starting mode a, melt mode a, primitive source, for 0.5, 1.5, and 3.0% melting, respectively;
nos. 13–15; starting mode b, melt mode b, primitive source, for 0.5, 1.5 and 3.0% melting, respectively;
nos. 16–18: starting mode c, melt mode c, primitive source, for 0.5, 3 and 1.5% melting, respectively.
The composition of the calculated melt no. 18 (produced by 1.5% melting of garnet lherzolite of a primitive mantle source) closely matches that of the measured average composition of the Tigris lavas (no. 19). See text for details.
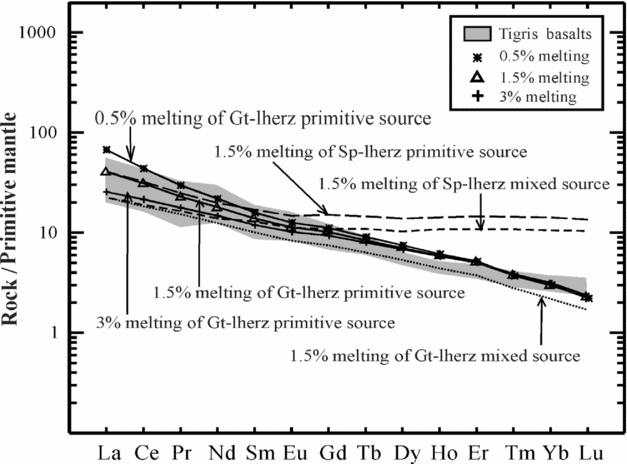
Figure 11. Calculated REE patterns for melts derived by batch partial melting of a primitive mantle composition with REE concentrations from Sun & McDonough (Reference Sun, McDonough, Saunders and Norry1989) and of a mixed source (50% primitive/50% depleted mantle) with REE concentrations from McKenzie & O'Nions (Reference McKenzie and O'Nions1991). The mantle mineral assemblages and melting proportions used are listed in Table 4. The calculations were made using the Kds of McKenzie & O'Nions (Reference McKenzie and O'Nions1991), for degrees of partial melting (F) = 0.5%, 1.5% and 3%. Normalization values used are taken from Sun & McDonough (Reference Sun, McDonough, Saunders and Norry1989). The calculated REE pattern produced by 1.5% batch melting of a primitive garnet-lherzolite source shows a reasonable fit with that of the average Tigris lavas (Table 4), and falls well within the envelope containing the REE profiles of this volcanic field (shaded grey).
7.e. Possible mechanisms of melt generation
Within the various standard tectonic environments of melt generation such as oceanic and continental rifting, leaky transform fault settings and subduction zones, as well as hot spots, several melting mechanisms were introduced. These include (i) shear heating at the base of the lithospheric mantle, (ii) delamination of a thermal boundary layer that may allow decompression of the underlying asthenosphere, and (iii) adiabatic decompression and melting as a result of extension, including transtensional settings.
A number of authors have emphasized the role of shear heating in generating silicate melts. In this mechanism, when the rocks fail (break) as a result of movement of a plate of lithosphere, shear heating is generated and shear melting occurs at the base of the moving lithospheric plate. Using gravitational and bathymetric data, as well as heat flow patterns and anomalous seismic velocities for wave paths through the deep mantle, Shaw & Jackson (Reference Shaw and Jackson1973) demonstrated that the mafic volcanic activity at the ends of the Hawaiian, Tuamoto and Austral linear island chains is not a result of the fortuitous location of thermal plumes, but rather is a consequence of shear melting caused by plate motion. Shaw & Jackson (Reference Shaw and Jackson1973) indicated that as shear melting occurs, a ‘thermal feedback’ produces more melting, and the residue of unmelted material sinks, creating a ‘gravitational anchor’ which causes further flow and melting. Several studies have also shown that other magma types such as felsic magmas and alkaline magmas can be generated as a result of shear heating caused by change in plate motion (e.g. de Gruyter & Vogel, Reference de Gruyter and Vogel1981; Brown, Reference Brown1994). According to Giannerini et al. (Reference Giannérini, Campredon, Féraud and Abou Zakhem1988), crustal evolution in northeastern Syria during the Plio-Quaternary is marked by a change in the orientation of the regional stress field to a N160°–170°E vertical plane containing σ1, which induced N80°E-oriented folds along the Palmyra line together with conjugate N40°E sinistral and N100°–110°E dextral strike-slip faults. The sinistral N40°E strike-slip faults controlled the NE movement of the Arabian plate. This tectonic evolution may be related to a slowing of the Arabian plate motion caused by increasing collision in the Zagros–Taurus area (Giannerini et al. Reference Giannérini, Campredon, Féraud and Abou Zakhem1988). The lithospheric mantle of the northern border of the Arabian plate was deformed during and after the collision, leading to the formation of these tectonic features. This could have also provoked the development of shear zones: the equivalent at great depth of detached or transform faults observed in the underlying continental base. Thus, shear heating at the base of the lithospheric mantle of the northern boundary of the Arabian plate, developed as a result of a change in plate motion as the Arabian plate moved in a more easterly direction during the Plio-Quaternary (as reflected by the sinistral motion in the Palmyrian area; Giannerini et al. Reference Giannérini, Campredon, Féraud and Abou Zakhem1988) could represent a viable mechanism providing heat necessary for partial fusion and magma generation.
In their study of volcanism in East Anatolia, Pearce et al. (Reference Pearce, Bender, De Long, Kidd, Low, Güner, Saroglu, Yilmaz, Moorbath and Mitchell1990) indicated that perturbation of the thickened lithosphere by delamination of the thermal boundary layer, perhaps coupled with local stretching associated with pull-apart basins on strike-slip fault systems, is sufficient to generate melt. Unlike the case of East Anatolia, Lustrino & Sharkov (Reference Lustrino and Sharkov2006) in their study of the Neogene volcanic activity of western Syria proposed that the transition from strongly compressive to transtensional stresses may have allowed for partial melting as a consequence of mantle decompression.
Although geochemical data cannot differentiate between the various processes of magma generation in this region, the most generally applicable one is the adiabatic decompression of an ascending solid diapir. The diapir rises because it experiences a positive buoyancy force deriving from either compositional or thermal effects. As demonstrated by Spera (Reference Spera and Hargraves1980), when the temperature–depth trajectory of the adiabatically ascending crystalline diapir intersects the peridotite solidus, partial fusion begins. The energy necessary for fusion comes from the heat content of the diapir. After partial fusion has begun, there will be a tendency for melt to segregate. A large blob of magma may be imagined to rise through the relatively cool lithosphere by softening a thin rind of wall rock, causing it to flow past the magma (Spera, Reference Spera and Hargraves1980). The effective viscosity of the wall rock is significantly lowered in response to transient heating and partial melting. Thus, the process of adiabatic decompression and melting has been known to be very efficient in magma generation, and it represents a more likely process in providing heat necessary for the production of the Tigris magma. Sawaf et al. (Reference Sawaf, Al-Saad, Gebran, Barazangi, Best and Chaimov1993) used seismic reflection data to show that Quaternary volcanism in northeastern Syria occurred above some of the deeper penetrating faults.
8. Conclusions
Large exposures of Quaternary mafic–ultramafic lavas (covering 1750 km2), forming the Tigris volcanic field of northeastern Syria, represent the northernmost tip of the Cenozoic volcanic province of the Middle East. This volcanic field occurs between the Euphrates graben and the Bitlis–Zagros collision suture that forms the Arabian/Eurasian plate boundary. The rocks are mostly phyric, consisting of about 50–55 vol.% labradorite, 35% clinopyroxene, 10–15% olivine and opaque phases. The Tigris lavas are compositionally restricted to basanites and alkali basalts, having a narrow range of major element compositions (SiO2, 42.2–48.2 wt%; MgO, 5.7–9.0 wt%), are alkaline in nature, and are enriched in Ti (1.7–3.2 wt% TiO2), Zr (119–231 ppm), Nb (14–43 ppm) and Y (17–22 ppm). These features reflect strong affinities to OIB. The primitive mantle-normalized patterns are strongly fractionated ((La/Yb)N = 10.6) indicative of a garnet-bearing source. The 143Nd/144Nd isotopic composition of the Tigris lavas ranges from 0.512803 to 0.512908, and 87Sr/86Sr from 0.70327 to 0.70403 (ε Nd = 3.2 to 5.3). Petrogenetic modelling along with the overall chemical and petrological characteristics are consistent with the generation of the Tigris magma by a small degree of batch partial melting (F = 1.5%) of a deep, garnet-facies, asthenospheric mantle source, possibly containing a minor spinel component. The magmas probably experienced very rapid ascent, with minimal interaction with the crust and little or no crustal contamination as confirmed by various elemental ratios such as K/P (4.6, on average), La/Ta (12), La/Nb (0.90), Nb/Y (1.22) and Th/Nb (0.09), and the low silica values (45.6 wt% SiO2, on average). Shear heating at the base of the lithospheric mantle of the northern boundary of the Arabian plate, developed as a result of a change in plate motion as the Arabian plate moved in a more easterly direction during the Plio-Quaternary could represent a possible cause providing the heat necessary for partial fusion and magma generation. Adiabatic decompression and melting represents a more likely process for the generation of the Tigris magma. Further detailed investigations on products of Cenozoic volcanism in other parts of the Middle East are warranted, in view of their significance in evaluating regional tectonic regimes, Cenozoic mantle dynamics and crustal evolution of the eastern Mediterranean region.
Acknowledgements
The collaboration of Roger Laurent (Laval University, Québec) was essential in this study. We thank Alan Dickin at MacMaster University, Ontario, for isotope analysis work. We acknowledge the help of A. A. Turkmani, Ministry of Petroleum and Mineral Resources of Syria, during the field work, as well as that of Muawia Barazangi and Graham Brew at Cornell University and Michel Delaloye of the University of Geneva. The technical support provided by M. Ijreiss of the American University of Beirut (Lebanon) is appreciated. This work was part of a larger research project made possible by grants from the Fonds pour la formation de chercheurs et l'aide à la recherche (Québec) and the Conseil de recherches en sciences humaines du Canada. Helpful reviews and valuable comments provided by John Maclennan, an anonymous referee and by the editor (Mark Allen) improved this contribution.


