1. Introduction
The Mesozoic rocks of Svalbard have been the subject of numerous palaeomagnetic investigations (e.g. Spall, Reference Spall1968; Sandal & Halvorsen, Reference Sandal and Halvorsen1973; Jeleńska et al. Reference Jeleńska, Kądziałko-Hofmokl, Kruczyk and Vincenz1978; Vincenz et al. Reference Vincenz, Cossack, Duda, Birkenmajer, Jeleńska, Kądziałko-Hofmokl and Kruczyk1981, Reference Vincenz, Jeleńska, Aiinehsazian and Birkenmajer1984; Vincenz & Jeleńska, Reference Vincenz and Jeleńska1985; Jeleńska, Reference Jeleńska1987; Halvorsen, Reference Halvorsen1989). Previous palaeomagnetic studies of the Triassic rocks were carried out mainly on the Middle Triassic rocks (Hounslow et al. Reference Hounslow, Hu, Mørk, Vigran, Weitschat and Orchard2007, Reference Hounslow, Hu, Mørk, Weitschat, Vigran, Karloukovski and Orchard2008a) and the Lower Triassic Vikinghøgda Formation in Central Spitsbergen (Nawrocki, Reference Nawrocki1999; Nawrocki & Grabowski, Reference Nawrocki and Grabowski2000; Hounslow & Nawrocki, Reference Hounslow and Nawrocki2008; Hounslow et al. Reference Hounslow, Hu, Mørk, Weitschat, Vigran, Karloukovski and Orchard2008b). So far, no detailed palaeomagnetic or rock-magnetic studies of the Lower Triassic rocks of the Vardebukta Formation from the southern part of the West Spitsbergen Fold and Thrust Belt (WSFTB) have been conducted.
Hounslow & Nawrocki (Reference Hounslow and Nawrocki2008) concluded that Triassic rocks of Central Spitsbergen record a composite magnetization pattern of both normal and reverse polarity, consisting of a primary magnetization overlapped by secondary component(s). Remagnetization episodes are very common in the Triassic rocks from Spitsbergen and have been reported previously as a post-folding overprint (e.g. Sandal & Halvorsen, Reference Sandal and Halvorsen1973; Nawrocki, Reference Nawrocki1999; Hounslow et al. Reference Hounslow, Hu, Mørk, Vigran, Weitschat and Orchard2007; Hounslow & Nawrocki, Reference Hounslow and Nawrocki2008). The natural remanent magnetization (NRM) mineral carriers in Central Spitsbergen were identified as Ti-magnetite, but behaviours typical of iron sulphides have also been observed. Previous studies (Nawrocki, Reference Nawrocki1999; Nawrocki & Grabowski, Reference Nawrocki and Grabowski2000; Hounslow & Nawrocki, Reference Hounslow and Nawrocki2008) have sampled the predominantly subhorizontal Triassic formations in Central Spitsbergen, while this study has focused on several fold structures within the southern part of the WSFTB where bed orientations differ significantly.
The aim here is to recognize the NRM pattern and detect the presence of any preserved primary magnetization directions in the investigated rocks. The palaeomagnetic investigations were accompanied by detailed rock-magnetic and petrographic studies to estimate the sources of any potential primary signal and possible secondary magnetic overprints that could be related to known tectonothermal events.
2. Geological setting and sampling
The majority of the palaeomagnetic data confirms that Svalbard, lying on the northwestern part of the Barents Sea Shelf, constituted a part of Baltica from as early as Devonian (e.g. Jeleńska & Lewandowski, Reference Jeleńska and Lewandowski1986; Nawrocki, Reference Nawrocki1999; Michalski & Lewandowski, Reference Michalski and Lewandowski2004) or even late Silurian time (Michalski, Lewandowski & Manby, Reference Michalski, Lewandowski and Manby2012).
The target area, which is located within the WSFTB (Fig. 1), is a good example of an intra-continental fold belt that is variously interpreted to have formed during the Late Cretaceous – Palaeogene interval (Dallmann, Reference Dallmann1992; Lyberis & Manby, Reference Lyberis and Manby1993a, b; Harland, Reference Harland1997; Leever et al. Reference Leever, Gabrielsen, Faleide and Braathen2011). Two contrasting models have been proposed to account for the formation of the WSFTB. The first model postulates dextral transpression along Hornsund and DeGeer fault zones connected with the opening of the Norwegian–Greenland oceanic basins (Braathen & Bergh, Reference Braathen and Bergh1995; Maher et al. Reference Maher, Braathen, Bergh, Dallmann and Harland1995; Harland, Reference Harland1997). In contrast, Lyberis & Manby (Reference Lyberis and Manby1993a, b) proposed an alternative two-stage model for the WSFTB characterized by an initial Late Cretaceous orthogonal convergence of Greenland–Svalbard followed by oblique deformation linked to the opening of the North Atlantic and Arctic oceans (Braathen & Bergh, Reference Braathen and Bergh1995; Saalmann & Thiedig, Reference Saalmann and Thiedig2001). Recently, Piepjohn, von Gosen & Tessensohn (Reference Piepjohn, von Gosen and Tessensohn2016) identified three stages of evolution with different tectonic regimes for the Arctic-wide Eurekan orogeny based on the ages of successive deformation events.
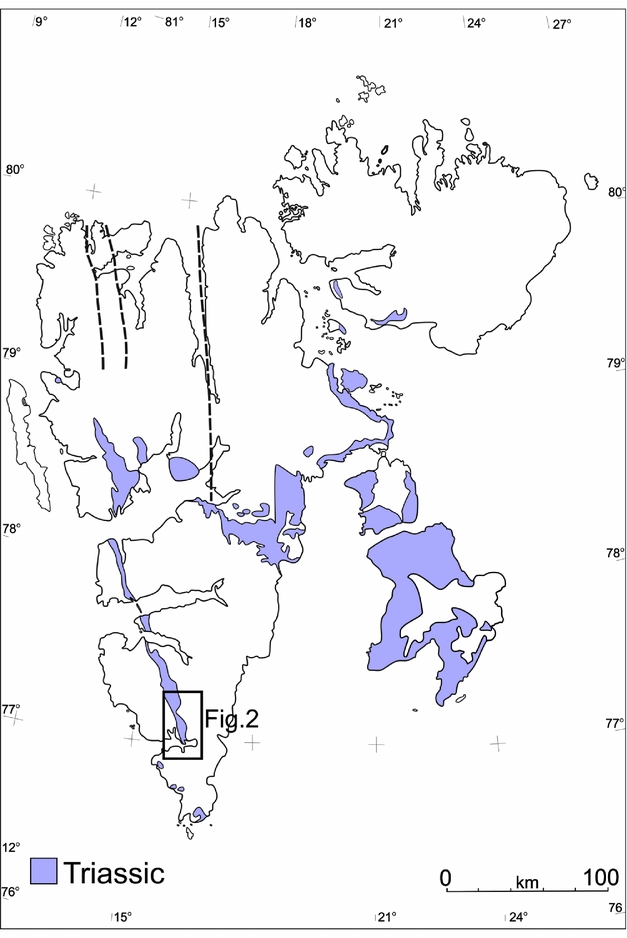
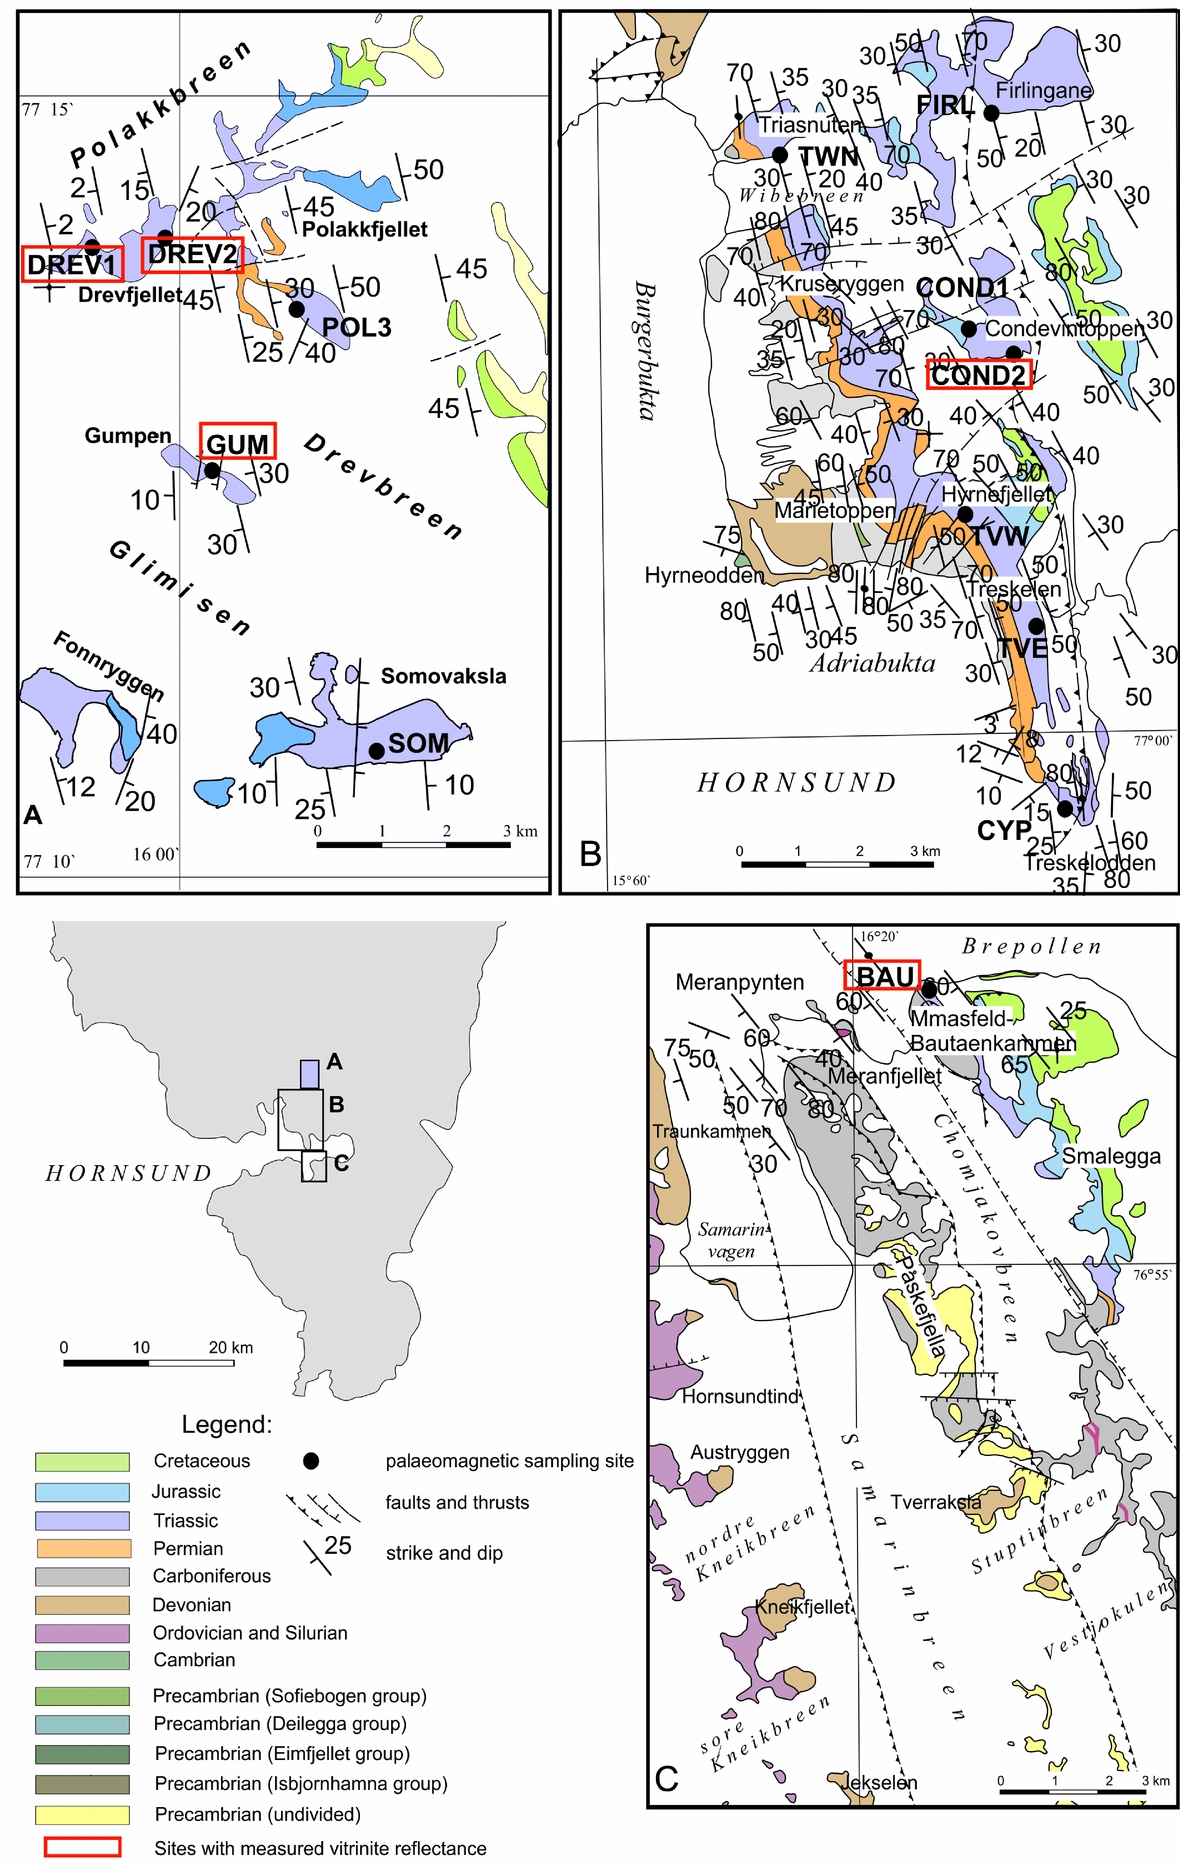
Figure 1. Contour map of Svalbard showing the distribution of the Triassic rocks (modified after Harland, Reference Harland1997). Location of the study area is marked by rectangles.
The preliminary results of the anisotropy of magnetic susceptibility (AMS) from Hornsund area are consistent with an orthogonal convergence model for the Eurekan WSFTB (Dudzisz et al. Reference Dudzisz, Szaniawski, Michalski and Manby2016). In the same area, however, rotations of Carboniferous palaeomagnetic directions around a vertical axis were also observed (Lewandowski et al. Reference Lewandowski, Michalski, Bednarek and Norberciak2005). The most important mechanisms which could have caused significant rotation of large sectors of the WSFTB include transport of the thrusts along listric surfaces during Eurekan convergence and reactivation of the W-dipping normal listric faults related to the opening of the North Atlantic Ocean (Michalski et al. Reference Michalski, Nejbert, Domańska-Siuda and Manby2014, Reference Michalski, Manby, Nejbert, Domańska-Siuda and Burzyński2017).
The tectonothermal events that could have influenced the magnetic record of the Lower Triassic sediments on Svalbard and Barents Sea Shelf include the following. (1) A Late Jurassic – Early Cretaceous rifting event (third rift phase of Clark et al. Reference Clark, Glorstad-Clark, Faleide, Schmid, Hartz and Fjeldskaar2014) accompanied by extensive dolerite intrusions exposed in Central Spitsbergen and Eastern Svalbard (Nejbert et al. Reference Nejbert, Krajewski, Dubińska and Pécskay2011; Senger et al. Reference Senger, Tveranger, Ogata, Braathen and Planke2014). Significant magnetic anomalies also indicate the possible existence of extensive dolerite bodies in southern Spitsbergen (e.g. Grogan et al. Reference Grogan, Nyberg, Fotland, Myklebust, Dahlgren and Riis2000; Krajewski et al. Reference Krajewski, Karcz, Woźny and Mørk2007; Birkenmajer et al. Reference Birkenmajer, Krajewski, Pécskay and Lorenc2010; Polteau et al. Reference Polteau, Hendriks, Planke, Ganerød, Corfu, Faleide, Midtkandal, Svensen and Myklebust2016). (2) Thermal alterations related to burial associated with the formation of the WSFTB, which locally reached values up to 200°C (Dypvik et al. Reference Dypvik, Riber, Burca, Rüther, Jargvoll, Nagy and Jochmann2011; Barnes, Reference Barnes2016). (3) Late Cretaceous – Eocene rifting (fourth rift phase of Clark et al. Reference Clark, Glorstad-Clark, Faleide, Schmid, Hartz and Fjeldskaar2014) related to the opening of the North Atlantic Ocean. (4) Finally, Bruhnes-aged viscous magnetizations and weathering events (Hounslow & Nawrocki, Reference Hounslow and Nawrocki2008) could also have influenced the magnetic record.
The Lower Triassic Vardebukta Formation, which constitutes the lower member of the Sassendalen Group, was sampled for this study. The Lower – Middle Triassic succession was deposited during nine transgressive–regressive sedimentation cycles (Mørk, Embry & Weitschat, Reference Mørk, Embry, Weitschat and Collinson1989), and consists of: a siliciclastic sequence deposited with a high sedimentation rate; a coastal fluvio-deltaic to shallow-marine facies that are concentrated westwards; and an open-marine shaly facies dominating the platform to the east (Steel & Worsley, Reference Steel, Worsley, Spencer, Holter, Johnsen, Mørk, Nysæther, Songstad and Spinnangr1984; Dallmann, 1999). In the Sørkapp–Hornsund region and Torell Land this formation is represented by grey-coloured, laminated siltstones, mudstones and fine-grained sandstones (Birkenmajer & Trammer, Reference Birkenmajer and Trammer1975) with variable carbonate contents. The Vikinghøgda Formation of Central and Eastern Spitsbergen, which is the age equivalent of the Vardebukta and the Tvillingodden formations, consists mainly of mudstones and siltstones that give way to black, organic-rich shales intercalated with dolomites and nodules (Mørk et al. Reference Mørk, Dallmann, Dypvik, Johannessen, Larssen, Nagy, Nøttvedt, Olaussen, Pchelina, Worsley and Dallmann1999).
The 13 palaeomagnetic sites were located in the southern part of the WSFTB (Fig. 2). The sampled area can be divided into two regions exhibiting different structural geometries. The palaeomagnetic sites of Northern Sørkapp Land, Hornsund and the southern part of Torell Land are located along the main segment of the WSFTB, which is characterized by complex thrusting and folding with numerous overturned fold structures (Figs 3, 4a–d) with an easterly vergence (Bautaen, Treskelen, Hyrnefjellet, Triasnuten, nunataks of Condevintoppen and Firlingane; Fig. 4a, b). In contrast, the sampled area in Central Torell Land is situated a few kilometres to the east of the main WSFTB line where wide open folds with gently dipping strata (nunataks of Somovaksla, Gumpen, Polakfjellet, Drevfjellet; Fig. 4e, f) are found. At each of the 13 sites, 6–12 hand samples were collected. All samples were independently oriented using a magnetic compass. From each of the 99 oriented hand samples, cylindrical cores of diameter c. 24 mm were drilled in the laboratory.

Figure 2. (a–c) Geological maps of the sampled areas (map modified after Birkenmajer, Reference Birkenmajer1990; Ohta & Dallmann, Reference Ohta and Dallmann1994). Sampling sites are marked by dots; their names are highlighted in rectangular frames.
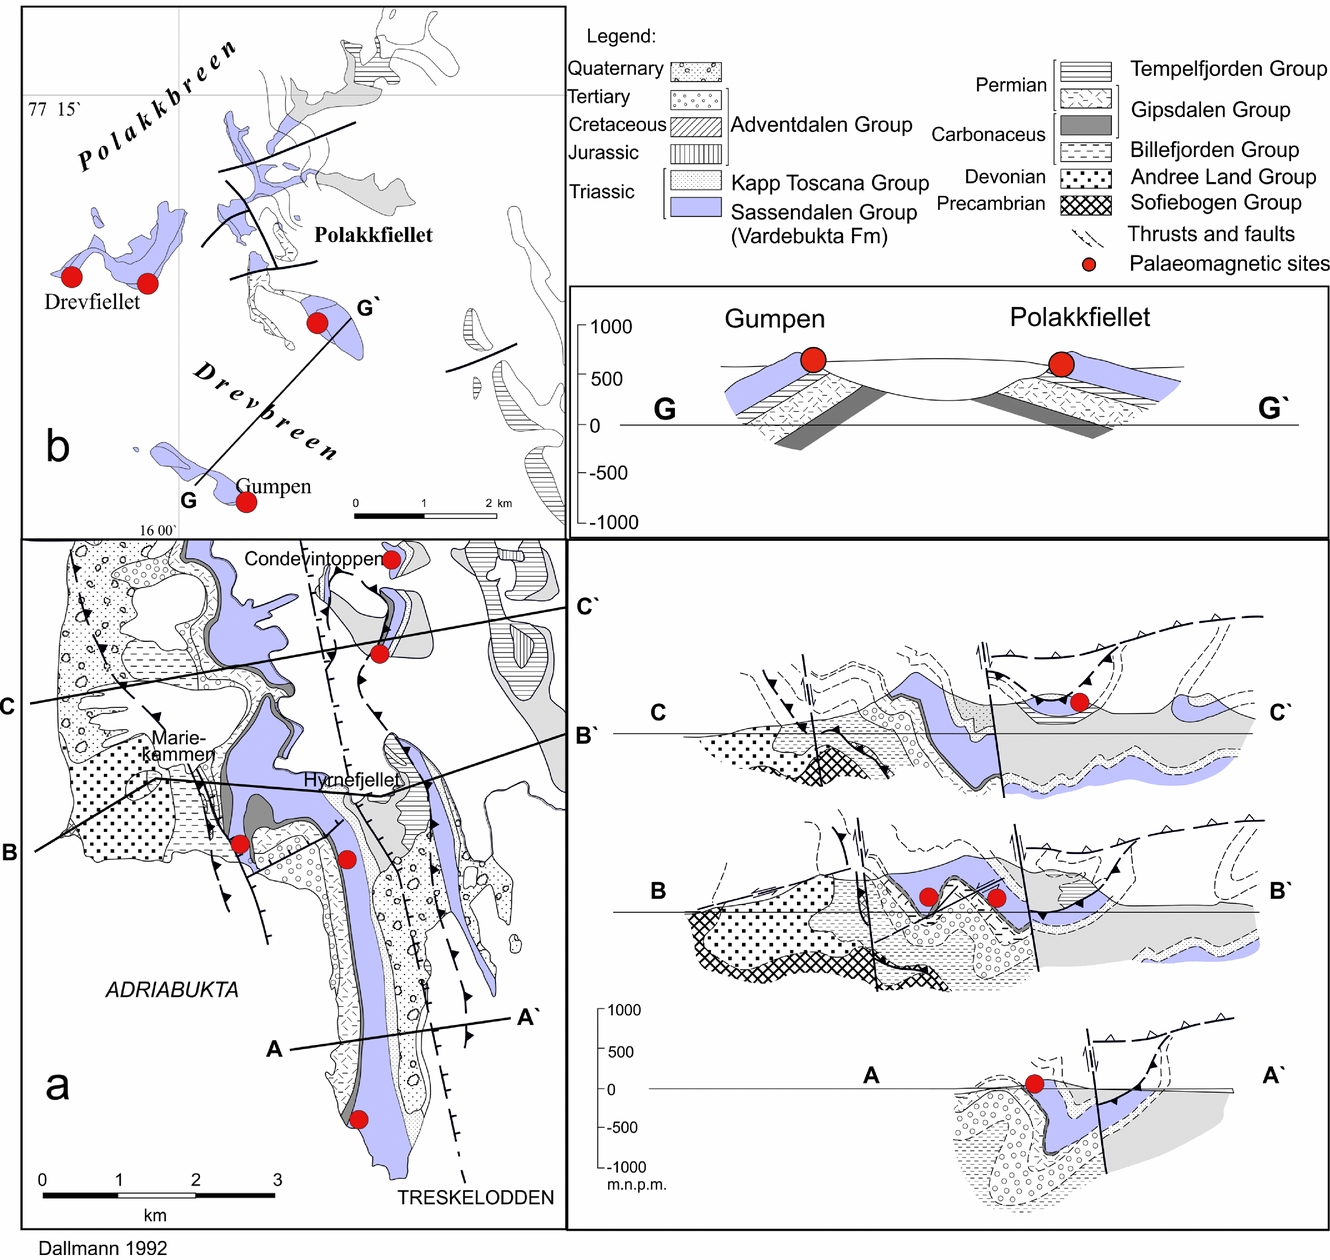
Figure 3. Geological maps and cross-sections showing two sampled areas representing different styles of tectonic architecture: (a) the Treskelen–Hyrnefjellet–Condevintoppen area situated along the main zone of WSFTB deformation; and (b) the Polakfjellet area situated outside the main area of WSFTB deformation. Selected palaeomagnetic sites are highlighted by dots; maps and cross-sections are modified after Dallmann (Reference Dallmann1992).
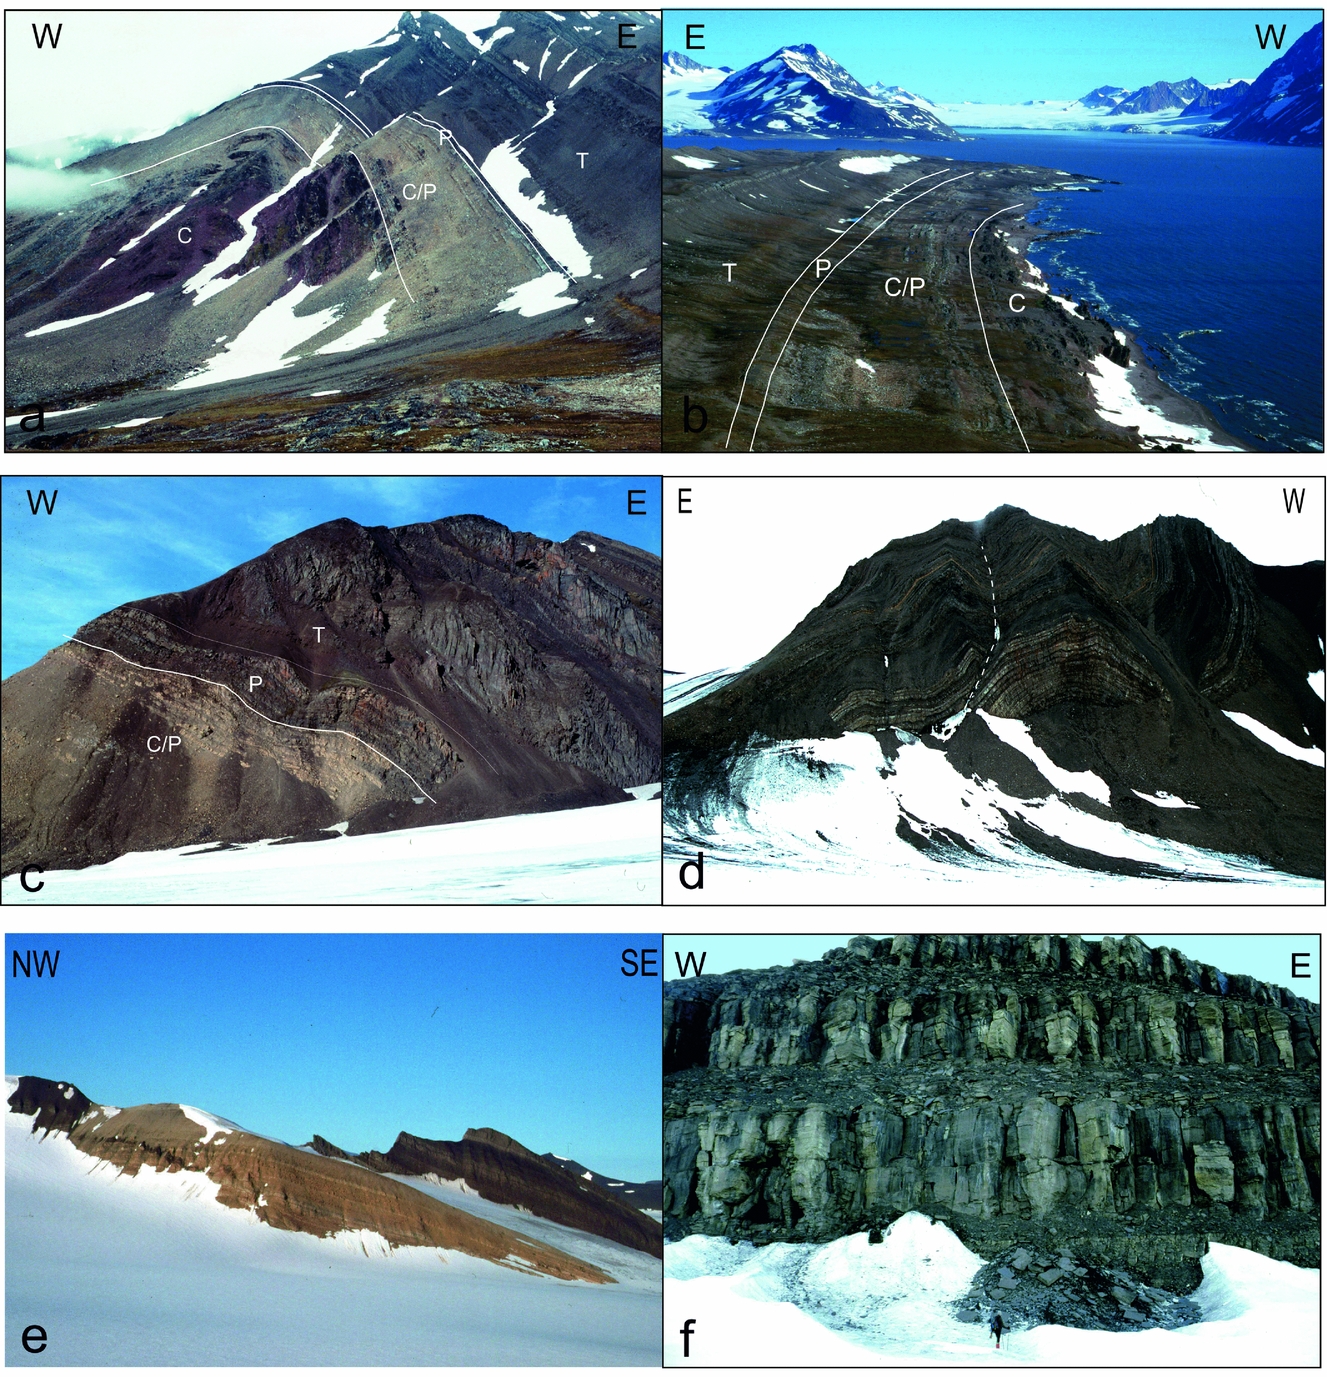
Figure 4. Field photographs of sampling areas: (a) the Hyrnefjellet Anticline; (b) the Treskelen Peninsula; (c) Triasnuten; (d) Kvalfangarbreen; (e) Polakfiellet nunatak; and (f) Drevfiellet nunatak.
3. Methods of investigation
3.a. Petrological and mineralogical studies
Petrographic and mineralogical analyses were performed on oriented thin-sections from each of the 13 sites and magnetic separates from one site on the southern tip of Treskelen (site CYP, Fig. 2). Mineral identification and recognition of the rock textures were carried out in transmitted and reflected light using a Nikon Eclipse E600 POL and Nikon Eclipse LV100 POL microscopes. The chemical composition of minerals in selected thin-sections were determined using a Cameca SX 100 (Gennevilliers, France) electronprobe microanalyser (EPMA). The microprobe was equipped with four wavelength-dispersive spectrometers using a 15 keV accelerating voltage, a 20 nA beam current and a 1 μm beam diameter. Standard counting times were 20 s on peak and 10 s on both background positions. The calibration standards (natural and synthetic materials) used during analyses were provided by Cameca and SPI Supplies (West Chester, PA, USA).
Magnetic fractions were separated from the whole-rock samples (c. 1 kg weight) collected from site CYP by applying a ferrite magnet and Frantz isodynamic separator, as rock-magnetic experiments suggested the presence of pyrrhotite at this site. The presence of numerous Fe, Cu and Zn sulphides was also identified by optical and scanning electron microscope (SEM)/EPMA analyses. The crushed specimen (c. 1 cm in size) was digested in acetic acid for a few weeks. The magnetic fraction from the solution was separated out using a weak magnet and divided into two groups using a stereoscopic microscope. This procedure allows the separation of the small grains of pyroclastic and/or detrital components rich in ferrimagnetic minerals (e.g. magnetite).
To precisely control the intensity of the magnetic field during separation, a Franz isodynamic separator was used. Before separation, the rock sample was crushed and then ground (using Retsch agate mortar grinder RM200) to fractions below 0.25 mm, then separated into two fractions of <0.25 mm and <0.125 mm in size. The Frantz isodynamic separator was set to standard operating conditions (McAndrew, Reference McAndrew1957; Rosenblum & Brownfield, Reference Rosenblum and Brownfield2000); the side slope was fixed at 15° while the forward slope of the chute was set to 20°. The vibrational nodes of the chute were adjusted manually to obtain the optimal travel speed of the mineral stream. Currents of 0.1 A and 0.2 A were used to separate fine rock fragments and mineral particles containing ferrimagnetic phases. The optimum current values for magnetite and pyrrhotite separation is 0.01 A and 0.01–0.05 A, respectively (Rosenblum & Brownfield, Reference Rosenblum and Brownfield2000). The separation of pyrite, which occurs in the examined samples, requires very strong currents of >1.7 A (Rosenblum & Brownfield, Reference Rosenblum and Brownfield2000). The separates were investigated using the Cameca EPMA and the SEM–JEOL JSM-6380LA with an energy-dispersive spectroscopy system. Mineralogical and petrographic analyses were conducted at the Inter-Institute Analytical Complex for Minerals and Synthetic Substances and the Scanning Electron Microscope and Microanalysis Laboratory of the Department of Geology, University of Warsaw.
3.b. Vitrinite reflectance studies
Vitrinite reflectance analyses were performed on five polished sections from selected samples using a Zeiss Axioskop MPM 200 reflected-light microscope with monochromatic (λ=546 nm) polarized light, 500× magnification, in oil immersion, according to the procedure proposed by the International Committee for Coal and Organic Petrology.
3.c. Rock-magnetic studies
The identification of the ferrimagnetic carriers was based mainly on a three-component isothermal remanent magnetization (IRM) procedure of Lowrie (Reference Lowrie1990). The analyses were carried out using a 2G SQUID cryogenic magnetometer, magnetic measurements MMTD-80 furnace and pulse magnetizer MMPM-10. The initial stages of the experiment were conducted at room temperature, and two to four specimens representing each site were gradually magnetized along the z-axis up to 3 T. Thereafter, the specimens were magnetized at 0.4 T and 0.12 T along orthogonal y and x axes, respectively, and then subjected to a stepwise thermal demagnetization. The magnetic signal of the specimens was measured after each demagnetization step. The experiment provided an estimate of the relative proportions and defined the unblocking temperatures of particular coercivity fractions magnetized in 0.12 T, 0.4 T and 3 T. The hysteresis parameters of the magnetic separates were also estimated using the Micro-Mag alternating-gradient magnetometer (AGM) vibrating sample magnetometer.
3.d. Palaeomagnetic studies
A maximum of 19 cores from each site were subjected to thermal demagnetization, giving a total 220 analysed specimens. The samples chosen were subjected to a gradual thermal demagnetization up to 700°C (up to 250°C following steps every 50°C; above 250°C following steps every 25°C) and cooled to room temperature after each step in a zero-magnetic field. All samples were heated under atmospheric conditions. After each of the demagnetization steps, the residual NRM was measured on the SQUID. After the selected demagnetization steps, the magnetic susceptibility (κ) was monitored using the KLY-2 susceptibility bridge (AGICO, Czech Republic). Additionally, up to 10 core specimens per site were subjected to an alternating field (AF) demagnetization up to 140 mT. The calculation of the NRM components and separation of the palaeomagnetic directions were performed using Remasoft v.3.0 (Chadima & Hrouda, Reference Chadima and Hrouda2006), which is based on principal component analysis (PCA; Kirschvink, Reference Kirschvink1980) and Fisher (Reference Fisher1953) statistics. The means of sites for further investigations were selected on the basis of the modified criteria proposed by Van der Voo (Reference Van der Voo1990): κ > 10, α 95 < 16° (half-angle of the cone of confidence interval) and N > 3 (where N is the number of independently oriented samples).
4. Petrography and mineralogy of investigated rocks
Deposited in a proximal shelf environment, the Lower Triassic rocks are petrographically diverse. In the southern part of the Hornsund–Sørkapp region fine-grained sandstones with some early diagenetic carbonates, detrital micas and clay minerals predominate (Fig. 5). The carbonate content increases northwards, with an increase in carbonate grain support at the expense of detrital quartz and feldspar (Fig. 5b). The sediments contain numerous sub-rounded to angular quartz, feldspar and lithoclast grains, mainly of volcanic origin as well as diagenetic pyrite (Fig. 6). The volcanic lithoclasts are potential carriers of a palaeomagnetic signal, but the random orientations and variable amounts in the samples renders their contribution questionable (e.g. Fig. 6a, b).

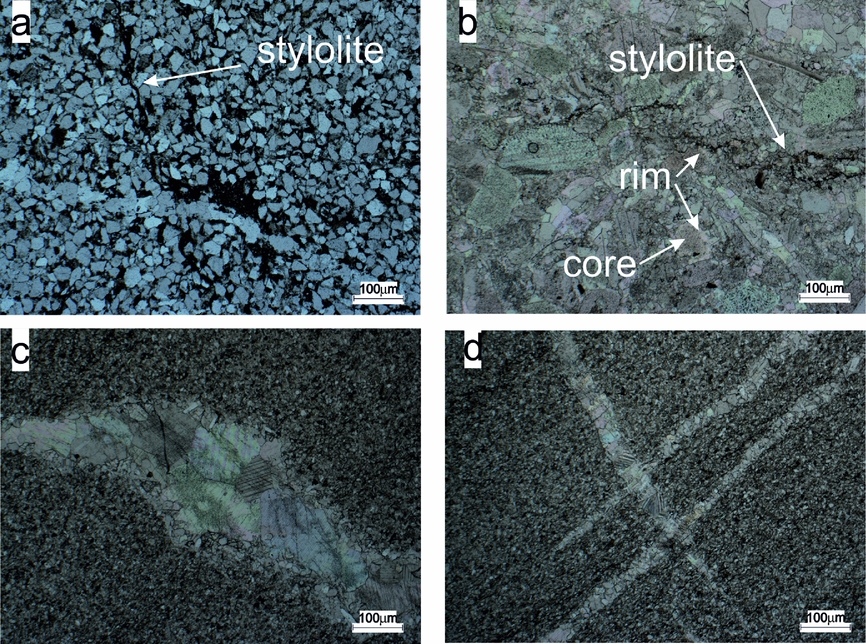
Figure 5. Lithological variability between sites located in (a, c, d) Hornsund and (b) Polakfjellet areas. (a) Site BAU, visible NNW–ESE-trending stylolite and a WNW–ESE-aligned recrystallized calcite vein. The stylolite appears to cut through the vein. (b) Site DREV1; observe its irregular WNW–ESE-aligned stylolite. Many grains are sutured and many of the carbonate grains also show two-stage growth with an inclusion-rich core and inclusion-free rim. The top right of the image also shows a recrystallized polygonal coarse-grained inclusion-free vein. (c, d) Generally untwinned, recrystallized calcite veins with no further mineralization inside.

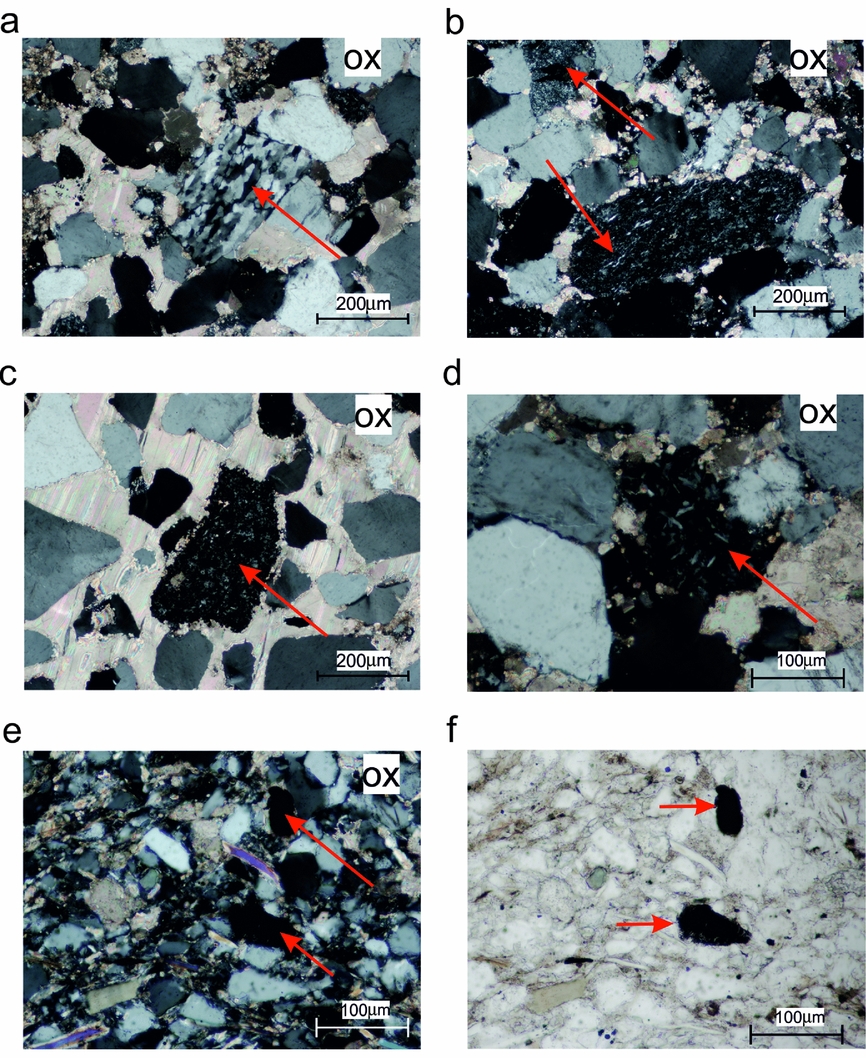
Figure 6. Lithoclasts of (a, b) metamorphic and (c–f) volcanic (magmatic) origin in thin-sections from sites CYP and SOM. (a–d) Photographs from site CYP are characterized by the occurrence of medium- or coarse-grained calcite cement. (e, f) Fine-grained sandstone (site SOM) contains numerous detrital grains of quartz, mica and small lithoclasts. ox – crossed polarization.
The organic matter content, which is represented by vitrinite and inertinite maceral group, does not exceed 1vol. %. The vitrinite reflectance values vary from 0.5 to 0.7 (±0.06–0.1, n > 19; where n is the number of counts) and correspond well to those obtained by Abdullah (Reference Abdullah1999) for Triassic rocks in Central Spitsbergen, indicating that these rocks are thermally immature to early mature. There are no significant changes in vitrinite spatial distribution except at site GUM, where this value is the highest (0.7±0.09; n = 19; Fig. 2). These results correspond to maximal palaeotemperatures (T max) in the range of 78–110°C, calculated according to Barker & Pawlewicz (Reference Barker, Pawlewicz, Mukhopadhyay and Dow1994). With an average geothermal gradient of 30°C km–1 (Barbier, Reference Barbier2002; Dörr et al. Reference Dörr, Lisker, Clift, Carter, Gee, Tebenkov and Spiegel2012), T max gives a maximal burial depth of 2.5–4 km.
The majority of specimens exhibit strong remineralization while others are characterized by well-preserved grain-supports and two generations of carbonate cement that are often twinned (online Supplementary Fig. S1a, b and Table S1, available at http://journals.cambridge.org/geo). Fine-grained Ti-oxides (anatase/brookite) that crystallized contemporaneously with the carbonate cement from altered grains of ilmenite or magnetite (Supplementary Fig. S1a) document the local mobility of Ti during diagenetic and/or later processes (Morad & Aldahan, Reference Morad and Aldahan1986; Mücke & Bhadra Chaudhuri, Reference Mücke and Bhadra Chaudhuri1991; Parnell, Reference Parnell2004). An extensive breakdown of detrital Ti-magnetite and ilmenite grains during diagenetic (e.g. Rowan, Roberts & Broadbent, Reference Rowan, Roberts and Broadbent2009) and/or epigenetic processes (e.g. Qian et al. Reference Qian, Brugger, Skinner, Chen and Pring2010) could be invoked to explain how some detrital magnetite and ferrimagnetic FeS phases were dissolved (Figs 7a, b, 8a, b). The presence of unaltered rutile, which is a very resistive mineral, and rare ilmenite grains indicate that some investigated sections escaped intensive alteration; relicts of the primary ferrimagnetic minerals may therefore survive (Supplementary Fig. S1c–f).

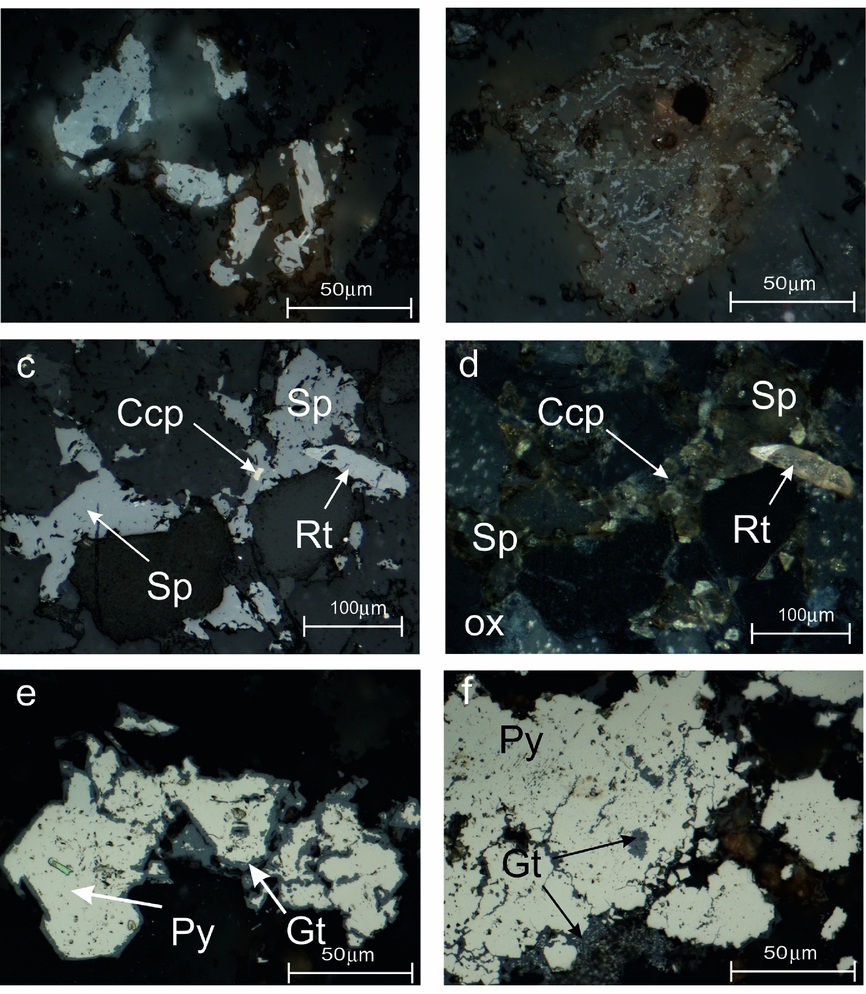
Figure 7. Examples of mineralization and mineral alteration in sites (a, b) COND1, (c, d) CYP and (e, f) BAU. Examples of (a, b) detrital grains being replaced by Ti-oxides and goethite; (c, d) Zn-Cu-Fe mineralization; (e, f) pyrite being replaced by goethite. Brk – brookite; Ccp – chalcopyrite; Gt – goethite; Py – pyrite; Rt – rutile; Sp – sphalerite; ox – crossed polarization. All microphotographs were taken under reflected light.
The iron sulphides predominate within the investigated rocks as recrystallized framboidal pyrite aggregates, large pyrite intergrowths, dispersed euhedral pyrite grains within carbonate matrix (online Supplementary Fig. S2a–e, available at http://journals.cambridge.org/geo) and also as cement filling brittle cracks in quartz grains (Supplementary Fig. S3). The diversity of pyrite forms in the Triassic rocks has been described previously by Hounslow et al. (Reference Hounslow, Hu, Mørk, Weitschat, Vigran, Karloukovski and Orchard2008b) or Krajewski (Reference Krajewski2013).
Texturally diverse Fe, Zn and Cu sulphides occur in most of the Vardebukta samples, especially in the southern sites, represented by the pyrite as well as some marcasite, chalcopyrite and sphalerite intergrowths (Fig. 7c, d). All sulphides are present as single grains (Fig. 7c, d) or replacing euhedral pyrite grains (online Supplementary Fig. S2f, available at http://journals.cambridge.org/geo). Sphalerite is also present as cement, which grew together with chlorite and carbonates (Fig. 7c, d) occupying mineralized zones. Sulphide mineralization therefore looks like it post-dates the stylolites (Fig. 5) which are sub-parallel to the bedding, suggesting a compaction rather than a tectonic origin. On the other hand, these sulphides seem to pre-date the untwinned carbonate veinlets as no sub-microscopic Ti-oxides or any evidence for Fe-Zn-Cu mineralization has been observed (Fig. 5c, d).
5. Identification of ferrimagnetic carriers
The optical microscopy was unsuccessful in the identification of ferrimagnetic carriers due to the low concentration of these minerals. The only identified phases were goethite (Fig. 7e, f) and homogenous ilmenite (online Supplementary Fig. S1e, f, available at http://journals.cambridge.org/geo). Electron microscope/microprobe analyses of magnetic separates was more effective and ferrimagnetics were observed for two of the three separated phases. The presence of ferrimagnetics was confirmed thereafter by rock-magnetic studies.
(1) Individual magnetite grains and the inclusions of magnetite within quartz grains are subhedral with sizes varying over the range 30–150 μm (Fig. 8a, b); all possess an almost stoichiometric chemistry (online Supplementary Table S2, available at http://journals.cambridge.org/geo).

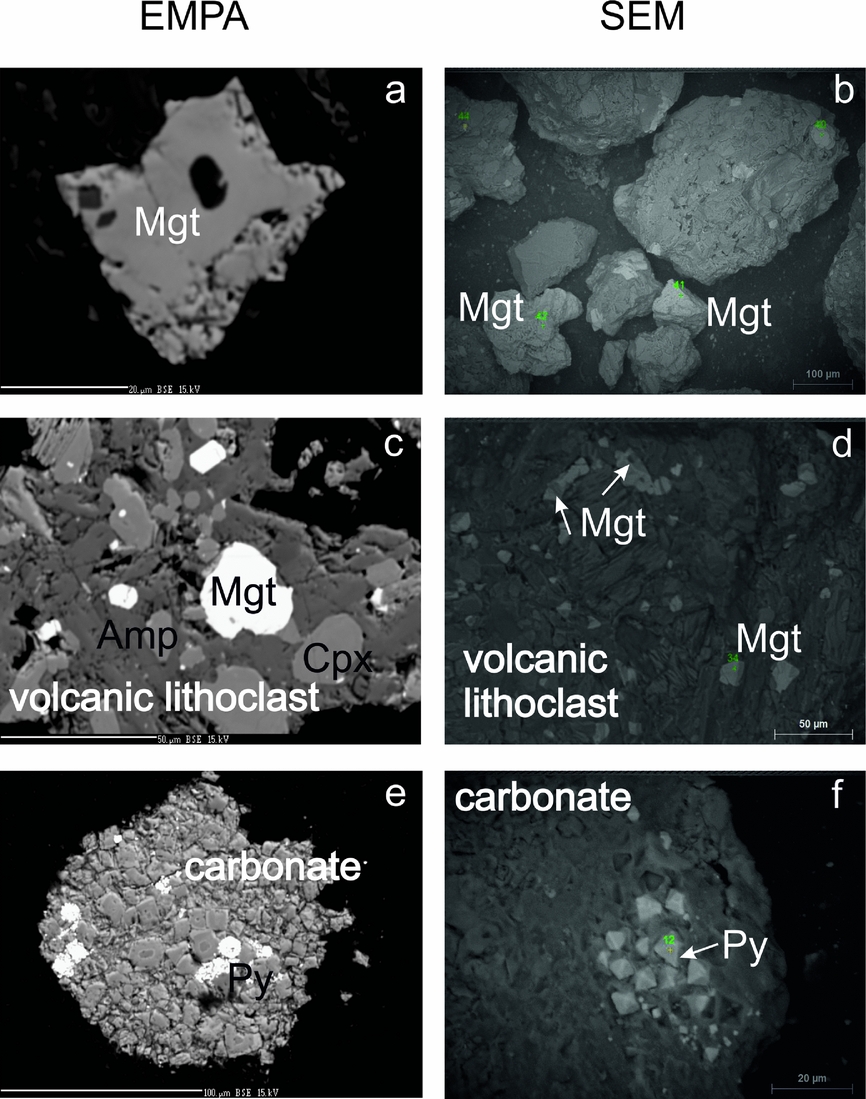
Figure 8. Separated magnetic particles from site CYP. BSE (backscatter electron) images of non-polished specimens derived from EPMA on the left and SEM on the right. (a, b) Low-Ti magnetite grains; (c, d) volcanic lithoclasts with Ti-rich magnetites; and (e, f) pyrite aggregates within carbonate fragments. Amp - amphibole; Cpx - clinopyroxene; Mgt - magnetite; Py - pyrite.
(2) The volcanic fragments contain titanomagnetite grains (online Supplementary Table S2, available at http://journals.cambridge.org/geo). The volcanic lithoclasts, which vary in size over the range 50–300 μm, contain plagioclase, amphibole and clinopyroxene (Fig. 8c, d). The titanium contents in Ti-magnetite within these clasts are in the range of 22.56–24.31 wt% (Supplementary Table S2); there are no dissolution features, suggesting they formed during rapid crystallization of volcanic rocks.
(3) Carbonate fragments contain recrystallized framboidal pyrite or euhedral pyrite grains (Fig. 8e, f) dispersed within a carbonate matrix with compositions similar to ankerite. Within these fragments only paramagnetic minerals (ankerite, pyrite) have been identified; however, some ferrimagnetic minerals of submicron size must be present here as indicated by the ferrimagnetic properties of these rocks.
6. Rock-magnetic experiments
In the majority of samples, the IRM acquisition curves revealed the dominance of low- to medium-coercivity minerals which are saturated in fields up to 0.4 T (Fig. 9). Selected samples from COND1, BAU, DREV1, DREV2 and TWN do not saturate at the maximum applied field of 3 T (Fig. 9, dashed lines), indicating the presence of high-coercivity minerals.
Figure 9. Results of stepwise acquisition of IRM. Dashed lines indicate samples which do not saturate in maximum applied field up to 3 T.
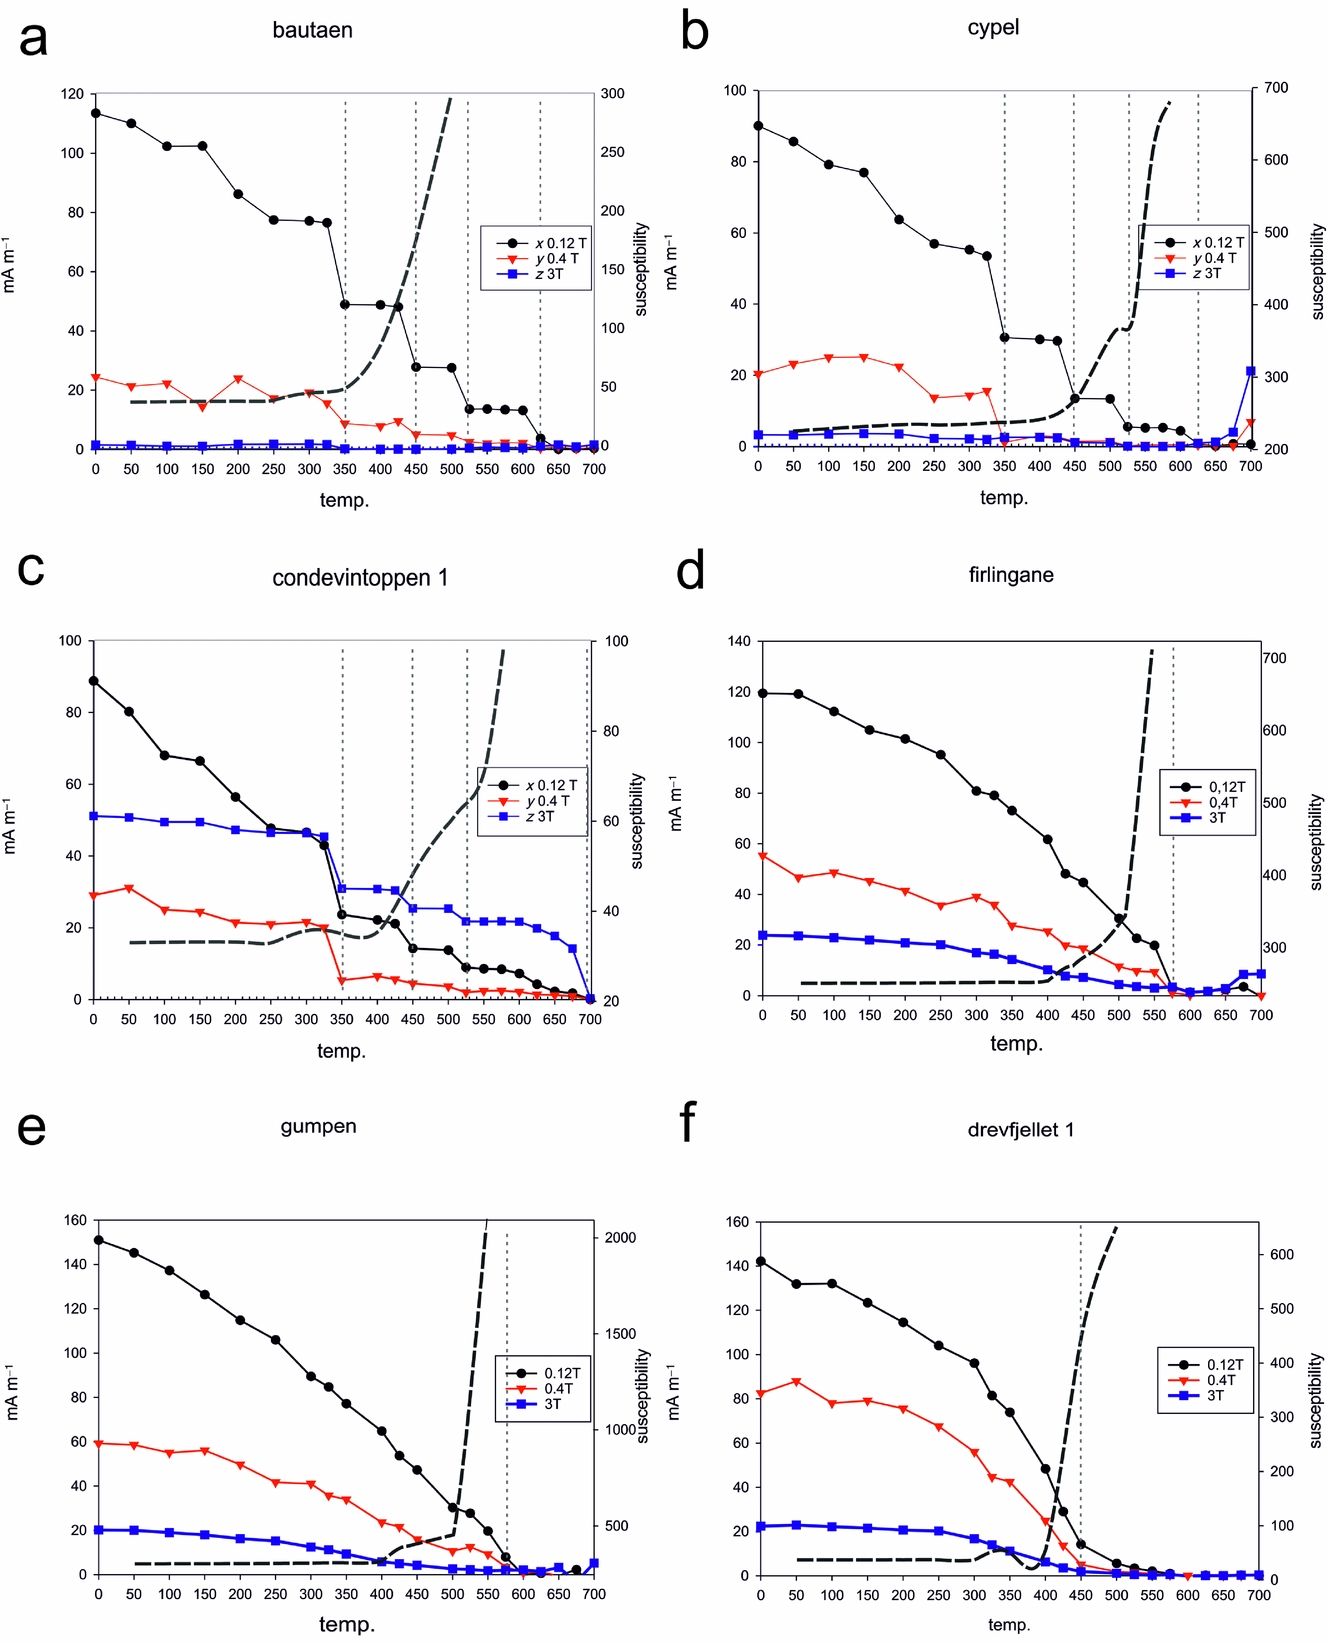
The stepwise thermal demagnetization of the IRM (Lowrie, Reference Lowrie1990) shows the dominance of low-coercivity minerals in the majority of sites, with maximum unblocking temperatures (T ub) of c. 450, 525–575 and 620–640°C (Fig. 10a–c, f). The values of 325–350°C observed at a few sites (Fig. 10a–c) can be related to monoclinic pyrrhotite as this ferrimagnetic phase is indicated on all three axes. Unblocking temperatures of c. 450°C might indicate the presence of maghemite or Ti-rich magnetite (Fig. 10a–c, f). The range of temperatures 525–575°C (Fig. 10a, b, d, e) suggests the presence of low-Ti titanomagnetite whereas values of c. 620–640°C (Fig. 10a, b) may be an indication of maghemite that may have formed during the breakdown of Fe-bearing carbonates (Ellwood et al. Reference Ellwood, Burkart, Rajeshwar, Darwin, Neeley, McCall, Long, Buhl and Hickcox1989) or the oxidation of iron sulphides (Dunlop & Özdemir, Reference Dunlop and Özdemir1997). High-coercivity phases were found in all samples from the siliciclastic sample site COND1 (Fig. 10c) and in single samples from the carbonate-dominated DREV1 and DREV2 sites, with maximum T ub within 680–700°C. These magnetic phases have been interpreted as haematite (Dunlop & Özdemir, Reference Dunlop and Özdemir1997).

Figure 10 (a–f) Examples of the three-component IRM acquisition curves (Lowrie, Reference Lowrie1990). The dashed grey curves indicate susceptibility and the dashed vertical lines indicate the interpreted unblocking temperature.
Additionally, three magnetic phases derived from separates were studied using hysteresis data. The tight shape of hysteresis loops of both individual magnetite grains and volcanic lithoclasts is characteristic of low-coercivity minerals such as magnetite and titanomagnetite, respectively (online Supplementary Fig. S4a, available at http://journals.cambridge.org/geo). Wider hysteresis loops were obtained for the pyrite aggregates, and the hysteresis parameters are suggestive of a ferrimagnetic mineral of moderate coercivity or a mixture of low and high coercivity (online Supplementary Fig. S4b).
7. Palaeomagnetic results
The NRM intensity displays variations of three orders of magnitude, ranging typically between 0.02 and 9 mA m–1. The application of thermal demagnetization procedures appears to be the most efficient means of extracting the NRM components. In 80% of samples, the initial susceptibility had values of c. 10–4 SI (dimensionless in SI units). Sites BAU and COND1 displayed lower levels of susceptibility of c. 10−5 SI. All investigated specimens revealed significant thermochemical alterations between 400°C and 500°C during demagnetization, disabling further NRM studies.
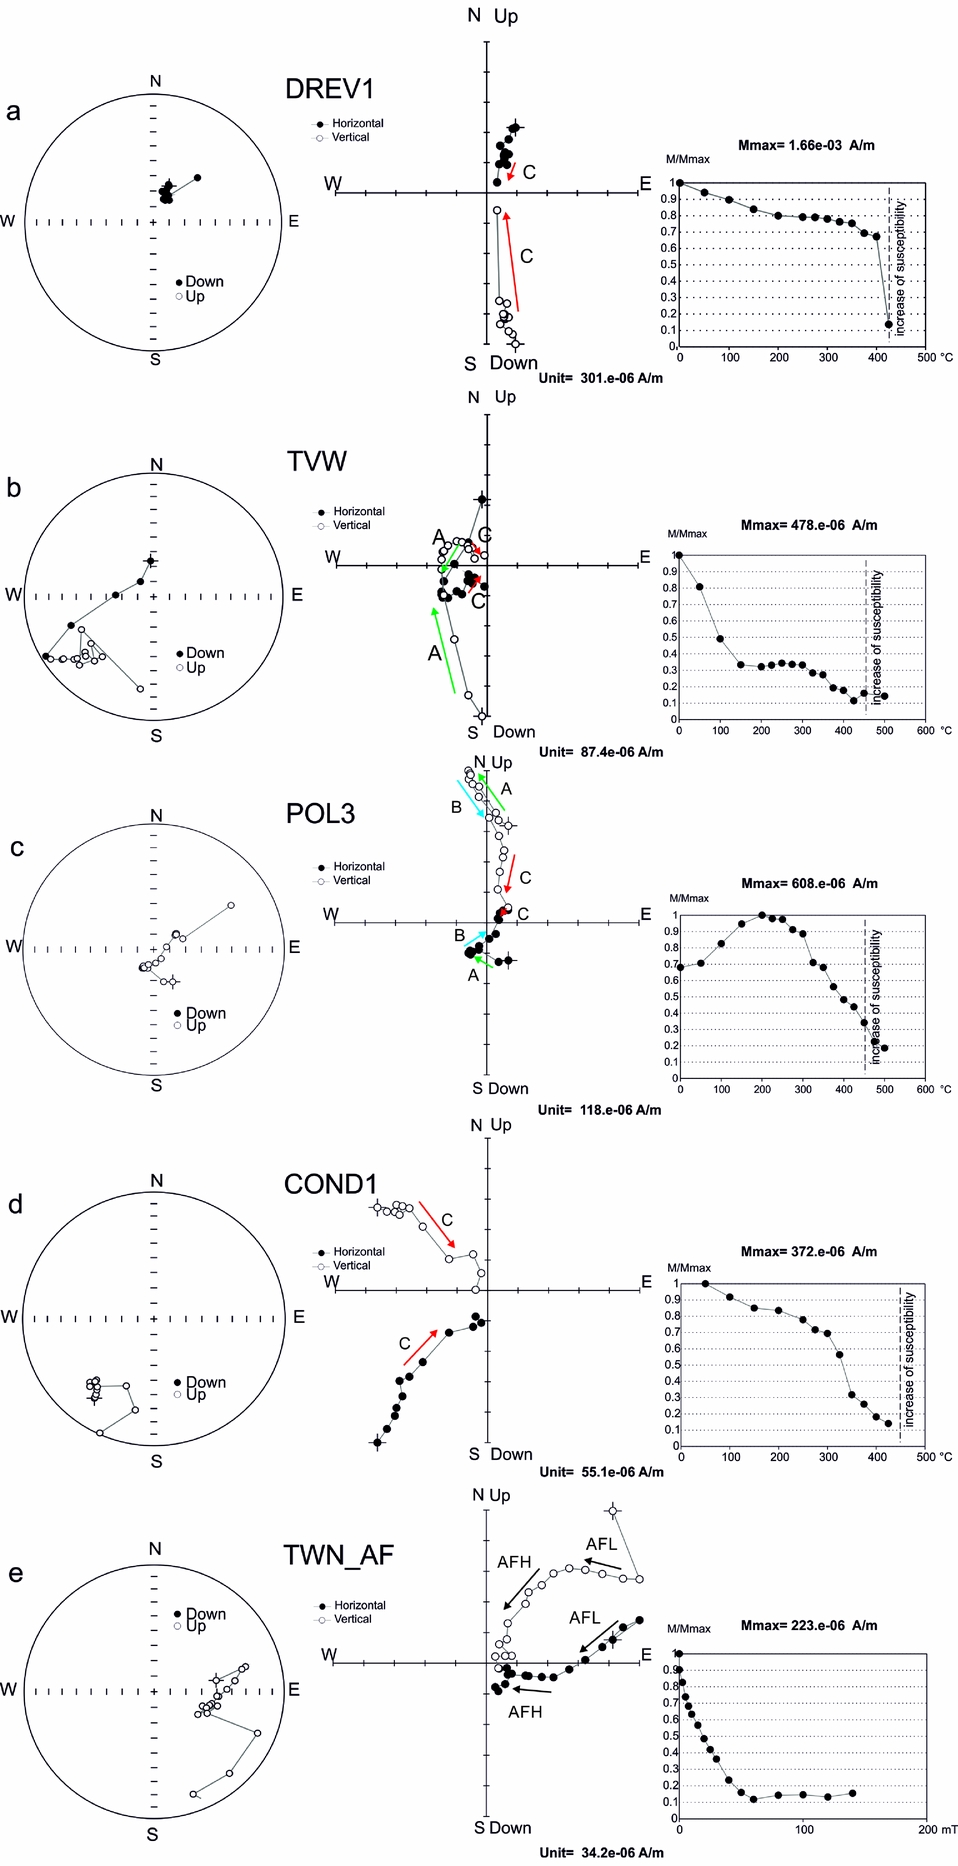
In the course of the thermal demagnetization process, two main palaeomagnetic components were distinguished (Fig. 11). (1) Component A (T ub < 250°C) was defined by a free-line fit method sensu Butler (Reference Butler1992), representing the least stable part of demagnetization process which was probably influenced by the recent magnetic field and viscous remanence (Fig. 11b, c). (2) The most stable directions of component C (T ub > 300°C) were defined by an anchored-line fit method sensu Butler (Reference Butler1992) forced through the origin of the Zijderveld diagrams, determined before an increase in susceptibility driven by thermochemical changes (Fig. 11a, d). Moreover, for the COND1 site and single specimens of other sites, an additional component B (250°C < T ub < 500°C) has been defined based on the free-line fit method of Butler (Reference Butler1992). This direction did not trend to the origin of the Zijderveld diagrams, which suggests the coexistence of additional, more stable components characterized by higher unblocking temperatures (Fig. 11c) than component B.

Figure 11. (a–d) Examples of thermal demagnetization diagrams of the Vardebukta Formation from Torell Land–Hornsund area. Diagrams on the left are equal-area plots, in the middle are orthogonal (Zijderveld) projections and on the right are the NRM intensity decay curves during thermal demagnetization with marked temperature where susceptibility increased. (e) Examples of AF demagnetization; projections are presented in in situ position. On the equal-area projection (left) open/full symbols represent upper/lower hemisphere; on the orthogonal projection (centre) open/full symbols denote projections onto vertical/horizontal planes and arrows indicate identified NRM components.
Specimens were readily demagnetized in an alternating field up to 20–30 mT but, despite the well-defined directions of particular specimens, the site means had large α 95 values and were oriented randomly on stereoplots. The results of the AF demagnetization only enabled the calculation of the mean directions at one site (TWN); two AF components were therefore distinguished for site TWN. The low-field component (AFL) was determined in the field range up to 20 mT, whereas the high-field component (AFH) was calculated for values > 20 mT until the last stable measurement (Fig. 11e).
Only principal component analysis (PCA) line fits from specimens with a maximum angular deviation (MAD) ≤ 10 were used in this work; any of value > 10 were excluded. In practice, 80% of PCA fits had MAD values of < 8.
Of the 13 sites subjected to palaeomagnetic investigations, only four of those with component C and two of the component AF site means passed the adopted statistical filtering criteria (κ > 10 and α 95 < 16°; Van der Voo, Reference Van der Voo1990) and qualified for palaeopole interpretation (Table 1). The observed complex NRM pattern can be explained by an overlapping of the T ub spectra of the palaeomagnetic components and consequent incomplete cleaning of particular vectors. At some of the sites, the low NRM intensity of the specimens of c. 20 μA m–1 (e.g. at BAU site), approaching the noise level of the SQUID magnetometer (5 μA m–1), and mineralogical changes which appeared during thermal demagnetization could be responsible for the large MAD values.
Table 1. Orientation and statistical parameters of the palaeomagnetic directions identified in Vardebukta Formation (this study).
NRM components characterized by α 95<16° and κ>10 are in bold. Bed orientation is given as dip direction and dip. Component A characterized by T ub < 250°C, determined by free line method; component B determined by free line method (250°C < T ub < 500°C); component C determined by anchored line fit method (T ub > 350°C); component AFL demagnetized in fields < 20 mT; component AFH demagnetized in fields ≥ 20 mT; D, declination; I, inclination; S, total number of independently oriented hand samples per site used for analyses; s, total number of demagnetized specimens per site; N/n, number of independently oriented hand samples/cylindrical specimens used for Fisher statistics; α 95, half-angle of a cone of the confidence limit α 95; κ, Fisherian precision parameter with MAD < 10.
8. Discussion
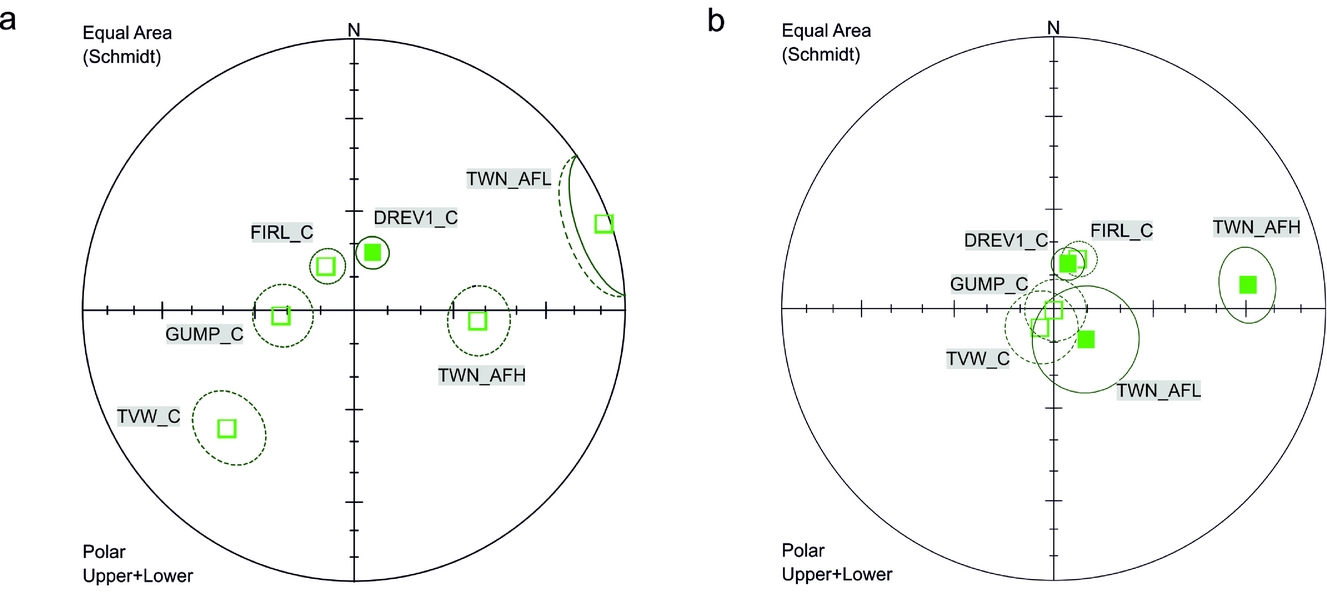
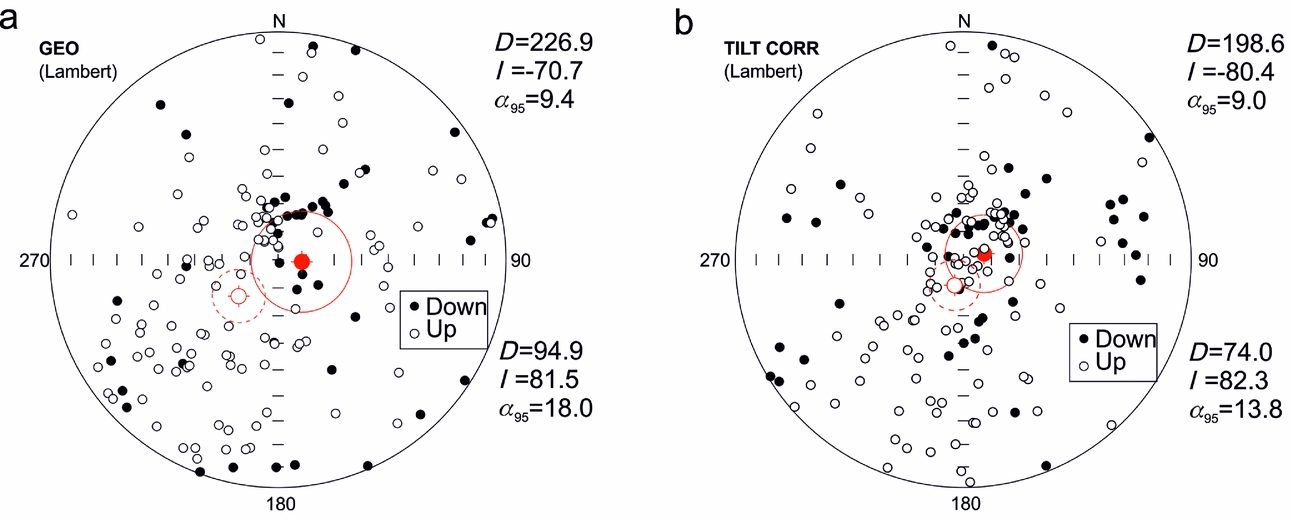
Six sites which contained the component C and component AFH or AFL qualified for palaeopole interpretation, representing both polarities (Fig. 12, Table 2). These site means do not pass a reversal test (McFadden & McElhinny, Reference McFadden and McElhinny1990) at 95% confidence levels at any stage of the unfolding procedure, but they are better grouped after complete unfolding (the exception is TWN_AFH component; Fig. 12b). After applying tectonic corrections, five of the six accepted site means change to inclinations of 70–80° as would be expected for southern Spitsbergen during the post-Jurassic interval. Some of the analysed directions could have originated before WSFTB deformation, and at least part of them could represent pre-folding post-Jurassic remagnetizations.

Figure 12. Distribution of the sites means with α 95 < 16; κ > 10 (a) in situ and (b) after tectonic correction, Vardebukta Formation, Torell Land–Hornsund area. Mean site directions are shown with α 95 confidence cones, lower hemisphere, equal-area projection.
Table 2. Palaeopoles calculated from the C and AF components in the Vardebukta Formation, with site means of α 95 < 16° and κ > 10, Torell Land Hornsund area, southern Spitsbergen.
Φ, palaeopole latitude; Λ, palaeopole longitude; D p/D m, half axes of the palaeopole oval of the confidence limit α 95; P lat, palaeolatitude. Other abbreviations as in Table 1.
Analyses of palaeomagnetic PCA directions conducted on the specimens are shown in Figure 13. The directions from all of the investigated locations were tested, including those sites where, according to the large dispersion of directions, the site means were rejected. The analysed populations for the in situ and after complete unfolding cases did not pass the reversal test at the 95% confidence level (determined from the critical angle in situ γ c = 18.89° or, after complete unfolding, 16.17°). As for the site mean directions, those for the specimen populations are better grouped after unfolding with their means falling within inclinations of 70–80°. A feature of these specimen PCA directions is the large dispersion which may be partly related to specimens with an incomplete cleaning of NRM components.

Figure 13. Stereographic projection showing direction of magnetization for all specimens with MAD values of < 10; 95% confidence cones were calculated separately for both polarities in (a) in situ position and (b) after unfolding.
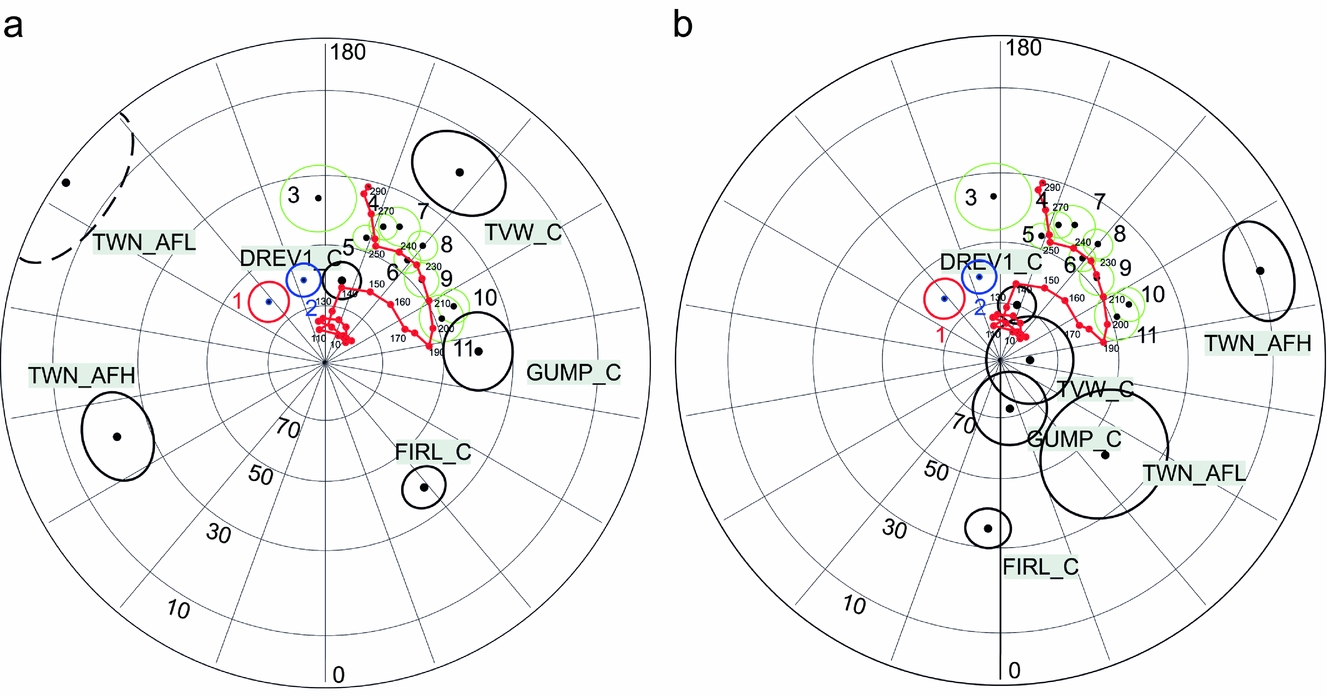
An important question is whether the analysed palaeomagnetic directions represent one event that lasted long enough to record magnetic field reversals or whether they represent separate pulses of magnetization. Contoured density diagrams suggest that the PCA directions may represent at least two stages of magnetization (Fig. 14) where directions are present after complete unfolding; the population is notably elongated between Triassic and post-Jurassic sectors. Composite magnetizations of a primary Triassic signal with post-Jurassic remagnetizations could generate the observed pattern of magnetization. Based on the apparent polar wander path (APWP) analysis (Fig. 15) the approximate age of majority of identified magnetizations is post-Jurassic.
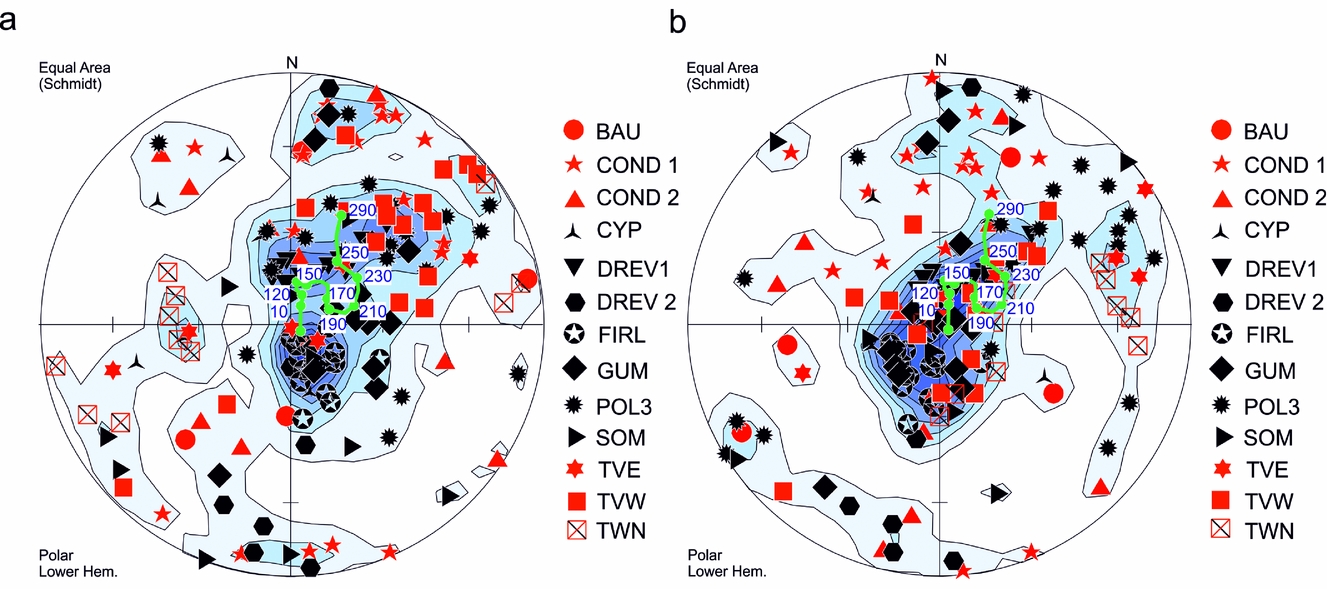
Figure 14. Distribution of the C components in investigated sites of the Vardebukta Formation (a) in situ and (b) after tectonic correction. Analyses were performed on the level of palaeomagnetic specimens. Red colour indicates dip > 40°. All directions were recalculated into lower hemisphere. Density peaks calculated according to Gaussian counting model, distribution parameter K=100 (Spheristat ver. 3.2.1.). Equal-area projection. Green dots represent expected palaeomagnetic directions calculated for the region of study on the basis of the reference APWP of Baltica given by Torsvik & Cocks (Reference Torsvik and Cocks2005).

Figure 15. The position of palaeopoles calculated for the six components which qualified for tectonic interpretations. Projection (a) in an in situ position; and (b) after tectonic correction. Black: Vardebukta Formation palaeopoles are presented with their D p/D m ovals of the confidence limit α 95; green, Early Triassic palaeopoles derived from previous work; red (1) and blue (2), palaeopoles of Late Mesozoic dolerites obtained by Jeleńska (Reference Jeleńska1987) and Halvorsen (Reference Halvorsen1989), respectively; red dots, reference palaeopoles of the APWP of Baltica. Ages of particular reference palaeopoles (red dots) are given. Reference APWP of Baltica derived from Torsvik & Cocks (Reference Torsvik and Cocks2005). References for the Triassic palaeopoles: 3, Nawrocki (Reference Nawrocki1999); 4–6, Hounslow et al. (Reference Hounslow, Hu, Mørk, Weitschat, Vigran, Karloukovski and Orchard2008b); 7, 8, Hounslow et al. (Reference Hounslow, Hu, Mørk, Weitschat, Vigran, Karloukovski and Orchard2008a); 9–11, Hounslow et al. (Reference Hounslow, Hu, Mørk, Vigran, Weitschat and Orchard2007).
Hounslow et al. (Reference Hounslow, Hu, Mørk, Weitschat, Vigran, Karloukovski and Orchard2008b) identified potential material in which residual Fe-Ti oxides might have survived. The petrographic observations on selected zones in this study also suggest that some Fe-Ti oxides may have escaped diagenetic alterations. Titanomagnetites have been found in some volcanic lithoclasts, especially in the slightly coarser-grained samples from the Sørkapp–Hornsund area. They are dominated by the ulvöspinel member (>0.6) in magnetite-ulvöspinel solid solution (online Supplementary Table S2, available at http://journals.cambridge.org/geo) with potential unblocking temperatures of 100°C < T ub < 200°C (Lattard et al. Reference Lattard, Engelmann, Kontny and Sauerzapf2006). This assumes the titanomagnetites are not unmixed at a submicron scale. However, the IRM demagnetization curves (Fig. 10) show no evidence of a drop in the magnetization at temperatures < 200°C. The titanomagnetites in the volcanic lithoclasts, the most likely candidates to carry primary NRM, did not record any magnetic remanence. The 300–350°C blocking temperature transition is indicated by both the low- and medium-coercivity curves and, in some samples, on the high-coercivity IRM curve (Figs 10a–c), possibly suggesting the presence of iron sulphides of higher coercivity than that of titanomagnetite or magnetite. Nevertheless, T ub of 450°C might indicate the presence of titanomagnetite with a lower ulvöspinel (c. 0.3) contribution (Lattard et al. Reference Lattard, Engelmann, Kontny and Sauerzapf2006) as we cannot fully exclude the presence of submicroscopic unmixed magnetite within titanomagnetite. It should be noted that the volcanic lithoclasts and detrital grains with magnetite, a potential source of the primary signal (Heider, Körner & Bitschene, Reference Heider, Körner and Bitschene1993), are characterized by random orientations in selected sectors of the thin-sections, reflecting their accumulation in a dynamic sedimentary environment. In such sectors the identification of a primary detrital signal is not possible.
All of the samples contain pyrite that may break down by heating, for example during burial diagenesis or faulting, into magnetite or pyrrhotite (Banerjee, Elmore & Engel, Reference Banerjee, Elmore and Engel1997; Tanikawa et al. Reference Tanikawa, Mishima, Hirono, Soh and Song2008). Pyrite aggregates in magnetic separates show some ferrimagnetic properties, which suggest the presence of submicron-sized ferrimagnetic minerals such as magnetite or pyrrhotite (Fig. 8e, f; online Supplementary Fig. S4b, available at http://journals.cambridge.org/geo). Moreover, the estimated maximum burial depth and maximum palaeotemperatures are sufficient to remagnetize these rocks and create authigenic magnetite from pyrite (Barker & Pawlewicz, Reference Barker, Pawlewicz, Mukhopadhyay and Dow1994; Brothers, Engel & Elmore, Reference Brothers, Engel and Elmore1996; Banerjee, Elmore & Engel, Reference Banerjee, Elmore and Engel1997). However, magnetite is potentially the most important carrier of the secondary overprints with T ub < 400°C. The chemical origin of the observed remagnetization, arising from a smectite-illite transformation (e.g. Tohver et al. Reference Tohver, Weil, Solum and Hall2008) is also possible. The observed, post-Jurassic pre-folding, secondary overprints may be related to the third rifting phase of Clark et al. (Reference Clark, Glorstad-Clark, Faleide, Schmid, Hartz and Fjeldskaar2014), the injection of the Cretaceous dolerites (Nejbert et al. Reference Nejbert, Krajewski, Dubińska and Pécskay2011) or the early stages of the WSFTB event (Dypvik et al. Reference Dypvik, Riber, Burca, Rüther, Jargvoll, Nagy and Jochmann2011; Barnes, Reference Barnes2016). The low temperatures indicated by the vitrinite reflectance values would seem to support the view that the identified remagnetizations are of chemical rather than thermal origin. The (U–Th)/He thermochronometry studies (Barnes, Reference Barnes2016) of apatite and zircon minerals from southern Spitsbergen also show that this area has not experienced temperatures higher than 200°C since Triassic time. The time relation between remagnetization event(s) and the observed Fe-Zn-Cu mineralization remains unresolved.
9. Conclusions
The Vardebukta Formation in southern Spitsbergen is characterized by complex NRM patterns where the observed magnetization is most likely the effect of coexisting and often partly overlapped components characterized by both normal and reverse polarity. The analysed site means and the single specimen components do not pass the reversal test at any stage of unfolding procedure at the 95% confidence level but they are better grouped after complete unfolding, giving inclinations of c. 70–80°. This suggests that a substantial part of the components are of secondary, pre-folding, origin that could have originated in post- Jurassic time before the main WSFTB deformation event.
Relicts of primary magnetizations may persist in volcanic lithoclasts and quartz grains with magnetite inclusions. Magnetite as the main potential carrier of secondary magnetization can be, at least partially, an alteration product of abundant sulphides. Its origin related to observed Fe-Zn-Cu mineralization also cannot be excluded.
Vitrinite reflectance (this study) and (U–Th)/He thermochronometry (Barnes, Reference Barnes2016) suggest that rocks from southern Spitsbergen were heated to a temperature below 200°C. Clearly, more in-depth and interdisciplinary studies are needed to improve our understanding of the relationships between the thermal and tectonic events, the pulses of mineralization, their timing and their effects on the palaeomagnetic record in the Vardebukta Formation.
Acknowledgements
Rock material for this study was collected during the following palaeomagnetic expeditions of IGF PAS to Hornsund (southern Spitsbergen): 1999 (K. Michalski); 2002 (K. Michalski, R. Szaniawski); and 2004 (K. Michalski, J. Bednarek). Dr Ewa Krzeszowska from the Faculty of Mining and Geology, Silesian University of Technology is thanked for conducting vitrinite reflectance analyses. This work was partially financed by funds from the Leading National Research Centre (KNOW) received by the Centre for Polar Studies for the period 2014–2018, and also partially supported by statutory activities No. 3841/E-41/S/2016 of the Ministry of Science and Higher Education of Poland. Mark Hounslow and the anonymous reviewer are thanked for their careful and thorough reviews, both of which helped to improve the manuscript.
Supplementary material
To view supplementary material for this article, please visit https://doi.org/10.1017/S0016756817001145