


1. Introduction
The influence of tides in both recent and ancient deltaic depositional environments has been extensively examined, leading to the development of elegant conceptual models (e.g. Nio & Yang, Reference Nio and Yang1991; Willis, Reference Willis, Giosan and Bhattacharya2005; Martinius & Van den Berg, Reference Martinius and Van den Berg2011; Longhitano et al. Reference Longhitano, Mellere, Steel and Ainsworth2012; Plink-Björklund, Reference Plink-Björklund2012; Magalhães et al. Reference Magalhães, Scherer, Raja Gabaglia, Ballico and Catuneanu2014). Despite the confidence provided by sedimentological evidence and facies analysis, the interpretation of deltaic depositional environments is not always straightforward. Tidal influence on sedimentation is common in both estuarine and deltaic environments (Martinius et al. Reference Martinius, Kaas, Naess, Helgesen, Kjaerefjord, Keith, Martinsen and Dreyer2001; Boyd et al. Reference Boyd, Dalrymple, Zaitlin, Posamentier and Walker2006). Similar facies are deposited in both settings but exhibit different architectural styles and facies trends (e.g. retrogradational vs progradational trends, respectively; Legler et al. Reference Legler, Johnson, Hampson, Massart, Jackson, Jackson, El-Barkooky and Ravnas2013). Tidally influenced deltas have received less attention than the estuarine systems, but some important case studies provided valuable information about their development (e.g. Willis et al. Reference Willis, Bhattacharya, Gabel and White1999; Zelilidis & Kontopoulos, Reference Zelilidis and Kontopoulos1999; Mellere & Steel, Reference Mellere, Steel, Hunt and Gawthorpe2000; Willis & Gabel, Reference Willis and Gabel2001; Pontén & Plink-Björklund, Reference Pontén and Plink-Björklund2007; Tänavsuu-Milkeviciene & Plink-Björklund, Reference Tänavsuu-Milkeviciene and Plink-Björklund2009; Mellere et al. Reference Mellere, Mannie, Longhitano, Mazur, Kulausa, Brough, Cotton, Hampson, Reynolds, Kostic and Wells2016; Rossi & Steel, Reference Rossi and Steel2016).
Despite the increasing amount of research conducted in ancient examples (Mellere & Steel, Reference Mellere and Steel1995; Bhattacharya & Willis, Reference Bhattacharya and Willis2001; Martinius et al. Reference Martinius, Kaas, Naess, Helgesen, Kjaerefjord, Keith, Martinsen and Dreyer2001; Willis, Reference Willis, Giosan and Bhattacharya2005; Pontén & Plink-Björklund, Reference Pontén and Plink-Björklund2009), tidally influenced and tidally dominated deltas are not still widely recognized within the ancient record (Plink-Björklund, Reference Plink-Björklund2012). In particular, most of these examples are primarily composed of delta-front deposits, whereas case studies that describe delta-plain deposits are not abundant (e.g. Willis & Gabel, Reference Willis and Gabel2003; Rebata et al. Reference Rebata, Räsänen, Gingras, Vieira, Barberi, Irion, Hoorn and Vonhof2006; Pontén & Plink-Björklund, Reference Pontén and Plink-Björklund2007). Therefore, comprehensive outcrop-based facies models for their development are still needed. Although unembayed shelf-edge tidally influenced deltas have been recorded in the literature (Cummings et al. Reference Cummings, Arnott and Hart2006; Carvajal & Steel, Reference Carvajal and Steel2009; Schwartz & Graham, Reference Schwartz and Graham2015), they are mostly ascribed to embayment settings on the shelf, most likely as a result of the increased tidal energy in these locations compared to the shelf edge (Porebski & Steel, Reference Porebski and Steel2006; Yoshida et al. Reference Yoshida, Steel and Dalrymple2007).
Deltas exhibit a complex depositional architecture that depends on the interaction between river input, tidal and wave processes, as well as changes in the prevalence of these competing processes during relative sea-level changes (Willis & Gabel, Reference Willis and Gabel2001). These settings are intermittently influenced by tides in an environment mainly dominated by fluvial processes (Plink-Björklund, Reference Plink-Björklund2012; Rossi & Steel, Reference Rossi and Steel2016). The shift from fluvial to tidal sedimentation has been described in transgressive systems (e.g. Dalrymple et al. Reference Dalrymple, Zaitlin and Boyd1992; Plink-Björklund Reference Plink-Björklund2005; Dalrymple & Choi, Reference Dalrymple and Choi2007). Nevertheless, the detailed analysis of facies and facies associations that are involved in this transition in regressive systems needs further investigation. In some of the scarce examples available, this transition occurs gradually with the development of tidally influenced fluvial deposits (Pontén & Plink-Björklund, Reference Pontén and Plink-Björklund2007). In other cases, the change from deltaic to continental sedimentation takes place abruptly, with sudden change from delta-plain to fluvial deposits (Rossi & Steel, Reference Rossi and Steel2016).
The Sydney Basin (SB) is a large Permo-Triassic sedimentary depocentre in eastern Australia that rimmed the Gondwanan landmass, contains significant proven coal reserves and offers an opportunity to evaluate important sedimentological and stratigraphic aspects of a tidally influenced fluvio-deltaic system (Fig. 1). The SB and surrounding basins (e.g. Myall Trough) are of great economic importance (e.g. Stewart & Adler, Reference Stewart and Adler1995; Alder et al. Reference Alder, Hawley, Maung, Scott, Shaw, Sinelnikov and Kouzmina1998; Montoya, Reference Montoya2012; Maravelis et al. Reference Maravelis, Chamilaki, Pasadakis, Zelilidis and Collins2017a, b; Palozzi et al. Reference Palozzi, Pantopoulos, Maravelis, Nordsvan and Zelilidis2018), and have been the subject of long-standing industry interest. This study focuses on the Upper Permian (PR Warbrooke, unpub. Ph.D thesis, Univ. Newcastle, Australia, 1981; Diessel, Reference Diessel1992; Herbert, Reference Herbert1995) sedimentary succession (c. 400 m thick) that outcrops in the Northern Sydney Basin (NSB). The exact age of the Waratah Sandstone has not been defined, but its stratigraphic position (below the Newcastle Coal Measures) has been documented in exploration wells (Diessel & Warbrooke, Reference Diessel and Warbrooke1987). The Upper Permian age of the Newcastle Coal Measures has been documented with high-precision U–Pb chemical abrasion thermal ionization mass spectrometry (CA-TIMS) data (Metcalfe et al. Reference Metcalfe, Crowley, Nicoll and Schmitz2015). The precise documentation of the depositional environments and sub-environments for the strata that make up this succession has received limited attention (PR Warbrooke, unpub. Ph.D thesis, Univ. Newcastle, Australia, 1981; Diessel, Reference Diessel1992), although it is known to contain valuable coal reserves. As a result, the proposed sequence-stratigraphic scenarios are largely lithologically based (Herbert, Reference Herbert1995, Reference Herbert1997) and lack a thorough sedimentological analysis, which is essential for sequence-stratigraphic interpretations. These scenarios suggest a generally regressive sedimentary succession. The current study utilizes more sedimentological data in order to constrain the depositional environments and sub-environments, and the sequence-stratigraphic framework. This basin provides a case study to correlate regressive fluvio-deltaic deposits, over an area of 1800 km2.
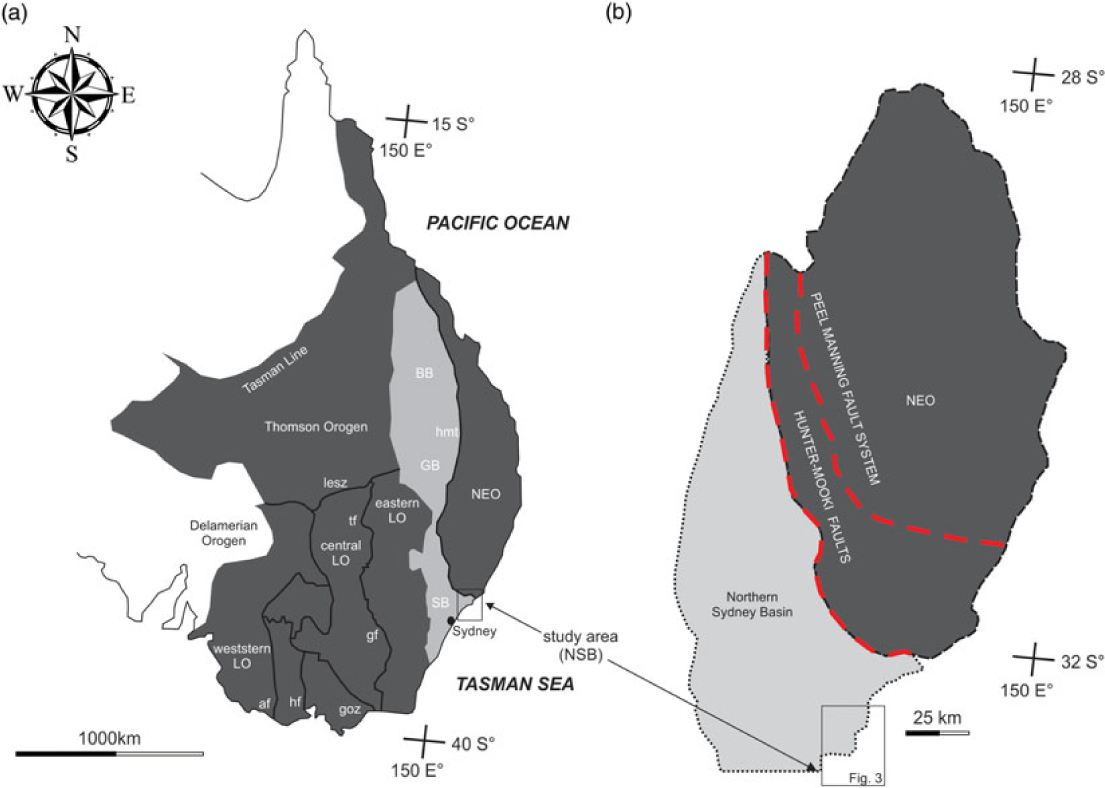
Fig. 1. Geological map of eastern Australia depicting the position of the Sydney Basin with respect to the major structural elements. Abbreviations: LO = Lachlan Orogen; NEO = New England Orogen; GB = Gunnedah Basin; SB = Sydney Basin; BB = Bowen Basin; af = Avoca Fault; goz = Governor Fault; hf = Heathcote Fault Zone; hmt = Hunter–Mooki Trust; gf = Gilmore Fault Zone; lesz = Louth-Eumarrra Shear Zone; tf = Tullamore Fault Zone (from Glen, Reference Glen, Vaughan, Leat and Pankhurst2005).
This research documents a sedimentary succession that encompasses delta-front deposits and the overlying delta-plain facies that are, in turn, capped by fluvial deposits exhibiting a shoaling-upward trend. This study integrates detailed facies analysis, stratigraphic and sequence-stratigraphic correlations, as well as palaeocurrent analysis to unravel the depositional environments, palaeogeographic evolution and sediment palaeodispersal in the NSB. The results of this research will help to better understand the facies and facies associations that occur across the transition zone between the tidal and fluvial sedimentation, providing implications for the nature (gradual vs abrupt) of this transition. Moreover, this analysis provides an example of a regressive fluvio-deltaic system with sudden temporal changes in the dominant depositional processes, as a result of tectonic uplift and confinement.
2. Geological setting
During the Permian – early Triassic, Australia was part of eastern Gondwana, the southern hemisphere component of supercontinent Pangaea, and was located in high southern palaeolatitudes (Veevers & Powell, Reference Veevers and Powell1987). The SB represents the southernmost edge of the larger, N–S-trending, composite Bowen–Gunnedah–Sydney Basin in eastern Australia that is c. 1600 km long (Glen, Reference Glen, Vaughan, Leat and Pankhurst2005) (Fig. 1). Stratigraphic equivalents can be traced through Antarctica, South Africa and South America as the foreland basin to the Gondwanide orogen (e.g. Veevers & Powell, Reference Veevers and Powell1994). The SB is underlain by two different basement types and displays an asymmetric geometry, with the thickest succession occurring in the northeast. In the southwest, the SB overlies the Early–Middle Palaeozoic Lachlan Orogen, and to the northeast the SB is underlain by the Late Palaeozoic New England Orogen (Roberts & Engel, Reference Roberts and Engel1987).
The SB initiated as a continental backarc in the Late Carboniferous – Early Permian (Collins, Reference Collins1991), confirmed by the trace-element chemistry of gabbroic and basaltic rocks (Jenkins et al. Reference Jenkins, Landenberger and Collins2002). During the later stages of the Early Permian, a mixture of post-rift subsidence and the cessation of loading caused a westward marine transgression over the Lachlan Orogen to the SW during subduction of an east-facing convergent margin in the New England Orogen to the NE (C Danis, unpub. Ph.D thesis,Macquarie Univ., 2012). The NSB experienced subsequent conversion to a foreland basin by progressive west-directed thrusting and folding, as evidenced by the geometry and kinematics of the Late Permian folds and faults in the southern New England Orogen and SB (Collins, Reference Collins1991; Landenberger et al. Reference Landenberger, Farrell, Offler, Collins and Whitford1995; Jenkins & Offler, Reference Jenkins and Offler1996; Glen & Beckett, Reference Glen and Beckett1997). The Late Permian deformational pattern in the southern New England Orogen is interpreted as the result of a single but complex compressive tectonic event, the Hunter–Bowen Orogeny, 265–250 Ma ago (Collins, Reference Collins1991).
The uplifted and over-thrusted New England Orogen became a major sediment contributor into the NSB, and its evolution was responsible for the evolution of the NSB as a foreland basin (Conaghan et al. Reference Conaghan, Jones, McDonnell and Rouce1982). During the evolution of the SB into a foreland basin, sediments display rapid lateral and vertical facies changes as a result of eustatically and tectonically driven regressions and transgressions (Herbert & Helby, Reference Herbert and Helby1980). During the Middle to Late Triassic, the SB was dissected by fold and thrust belts in response to westward-migrating thrust fronts with associated crustal shortening (Glen & Beckett, Reference Glen and Beckett1997). This deformation was responsible for the termination of deposition in the SB during the Middle Triassic time (Herbert & Helby, Reference Herbert and Helby1980). In this setting, the evolution of the SB is remarkably similar to the evolution of other contemporary sedimentary basins in southern Gondwana, including the Karoo Basin in southern Africa (e.g. Catuneanu et al. Reference Catuneanu, Hancox and Rubidge1998, Reference Catuneanu, Wopfner, Eriksson, Cairncross, Rubidge, Smith and Hancox2005; Catuneanu, Reference Catuneanu2004) and the foreland systems of South America (Menegazzo et al. Reference Menegazzo, Catuneanu and Chang2016). Similar net progradation of the shoreline has also been documented in the Karoo Basin, although with less evidence for tidal activity (Rubidge et al. Reference Rubidge, Hancox and Catuneanu2000).
3. Methodology
The reconstruction of palaeodepositional environments and sub-environments through facies analysis is essential for basin analysis and has been applied to non-marine and marine deposits (Catuneanu & Eriksson, Reference Catuneanu and Eriksson2002; Catuneanu et al. Reference Catuneanu, Khalifa and Wanas2006; Maravelis et al. Reference Maravelis, Konstantopoulos, Pantopoulos and Zelilidis2007; Maravelis & Zelilidis, Reference Maravelis and Zelilidis2011), and to reveal differences in sedimentary successions between extensional and compressional settings (Di Celma et al. Reference Di Celma, Cantalamessa, Landini and Ragaini2010; Maravelis et al. Reference Maravelis, Boutelier, Catuneanu, Seymour and Zelilidis2016). In the NSB, the examined lithostratigraphic units include (from oldest to youngest) the Waratah Sandstone and the Lambton, Adamstown and Boolaroo sub-groups. These sub-groups are further subdivided into several formations and members (Fig. 2).
Fig. 2. Lithostratigraphic chart of the Northern Sydney Basin illustrating the different sub-groups that make up the studied succession (from PR Warbrooke, unpub. Ph.D thesis, Univ. Newcastle, Australia, 1981; Diessel, Reference Diessel1992). The Lambton, Adamstown and Boolaroo sub-groups make up the Newcastle Coal Measures.
Thirteen outcrops were examined along a 25 km transect of the New South Wales coastline, between Nobbys Head in the north, and Caves Beach in the south (Fig. 3). The size and connectivity of the outcrops varies considerably, with outcrops ranging in size from 40 m long and 10 m high to 1 km long and 120 m high. Most outcrops are several hundreds of metres long and are either connected or partially connected (less than 100 m between outcrops). Only two outcrops are wider-spaced (up to a few km, outcrops 10 and 13). The studied succession encompasses the Waratah Sandstone (outcrop 13) and the Newcastle Coal Measures (outcrops 1–12). Primary sedimentological features (lithology, sedimentary structures and texture) were utilized in order to interpret depositional processes, environments and sub-environments of deposition, and the distribution of architectural elements. The facies analysis was conducted by detailed sedimentological logging, and field photographs. Facies characteristics were used to define facies associations and allow for facies sets to be grouped into ascribed depositional sub-environments. Classification of these sub-environments and their processes allows for an interpretation of the shape and lateral accretion, identifying important architectural elements in the studied succession. Palaeocurrent measurements from sole marks, cross-stratification and clast imbrication revealed the main palaeoflow direction.
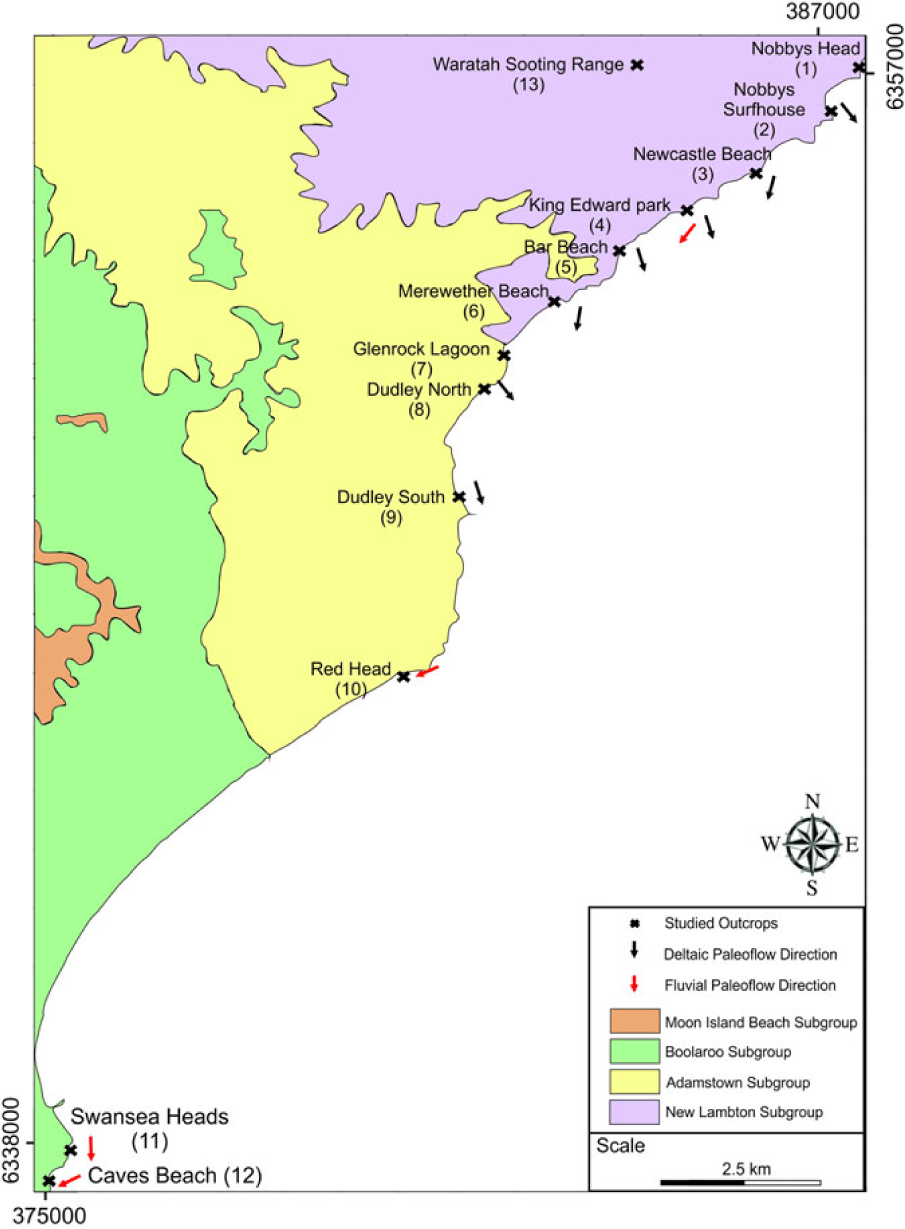
Fig. 3. Map of the Northern Sydney Basin depicting the spatial evolution of the involved sub-groups. Black crosses correspond to the studied sections.
Outcrop-based analysis allowed documentation of key stratigraphic surfaces and marker beds in the NSB, which allowed for correlations to be made throughout the studied succession. Coal deposits and volcaniclastic sediments (tuffs) regularly outcrop in the study area and form thick and laterally extensive beds. These deposits were used as marker beds for establishing stronger lithostratigraphic correlations. The upward transitions of depositional environments, documented on stratigraphic columns, revealed the palaeogeographic evolution. The construction of detailed stratigraphic cross-sections assisted in determining the spatial and temporal distribution of the depositional environments and sub-environments. The interpretation of detailed field data, integrated with the identification of sequence-stratigraphic surfaces, led to the proposed sequence-stratigraphic model. This integration of data allowed the documentation of the depositional systems and systems tracts.
4. Sedimentary facies and facies associations
The studied sedimentary succession includes an intricate facies architecture, and 15 depositional facies have been identified (F1–F15). These facies were grouped into three facies associations (FA1–FA3), based on facies assemblages and variations, the dominant depositional process, and the geometry and position of major bounding and stratigraphic surfaces. Furthermore, FA1 and FA2 are subdivided into several sub-facies associations (sub-FA1a and sub-FA1b, and sub-FA2a to sub-FA2f respectively). The main facies characteristics are summarized in Table 1.
Table 1. Summarizing table of facies and facies associations and their main characteristics, in relation to sedimentary structures, depositional environments and appearance in the Northern Sydney Basin

4.a. FA1: fluvial deposits
Facies Association 1 (FA1) is over 200 m thick. FA1 includes sedimentological features that are characteristic of a fluvial depositional environment. These features correspond to depositional elements such as fluvial channels (sub-FA1a) and mid-channel bars deposits (sub-FA1a).
4.a.1. Sub-FA1a: fluvial-dominated channelized deposits
Description:
Sub-FA1a is characterized by thick (2–10 m), stacked sedimentary packages that are dominated by conglomerate and coarse- to medium-grained sandstone (Fig. 4a). Conglomerate in the sub-FA1a is either clast- to matrix-supported (F1) or cross-stratified (F2) (Fig. 4b, c). It is sometimes imbricated (Fig. 4d) and is often overlain by planar and trough cross-bedded conglomerate. The conglomerate is usually structureless, but often displays normal- to reverse-graded units (Fig. 4e). The clasts occur in a sandy matrix, include granules or pebbles (0.2–10 cm), and are sub-rounded to well-rounded. The clasts are composed of sandstone, tuff, mudstone, quartz and chert. Sandstone is often interbedded with conglomerate, it is structureless (F3) at the base of the sandstone beds and may evolve into trough cross-stratified (F4), or planar cross-stratified (F5) and/or compound cross-stratified (F6) towards the top of the beds (Fig. 5a). Trough-cross-stratified sandstone forms both single sets and co-sets that are separated by bounding surfaces, often highlighted by pebbles (Fig. 5b). Compound cross-stratified sandstone forms medium- to thick-bedded (0.2–1 m), stacked sets of both trough- and planar cross-stratified sandstone. In places, the cross-beds display a fining-upward transition from conglomerate to sandstone (Fig. 5c). Ripple cross-laminated sandstone (F7) is present at the top of the beds and is associated with parallel-laminated sandstone (F8, Fig. 5a). Mudstone is rare and restricted in the uppermost parts of these packages. It is interbedded with medium- to thin-bedded sandstone (0.1–0.3 m) and, when present, it is mostly structureless (F12). Rarely, horizontally laminated mudstone occurs. Transported coal debris and tree branches are common in the sub-FA1a. Very thin (millimetre- to centimetre-thick) mud drapes occur in places in this facies association (Fig. 5d).
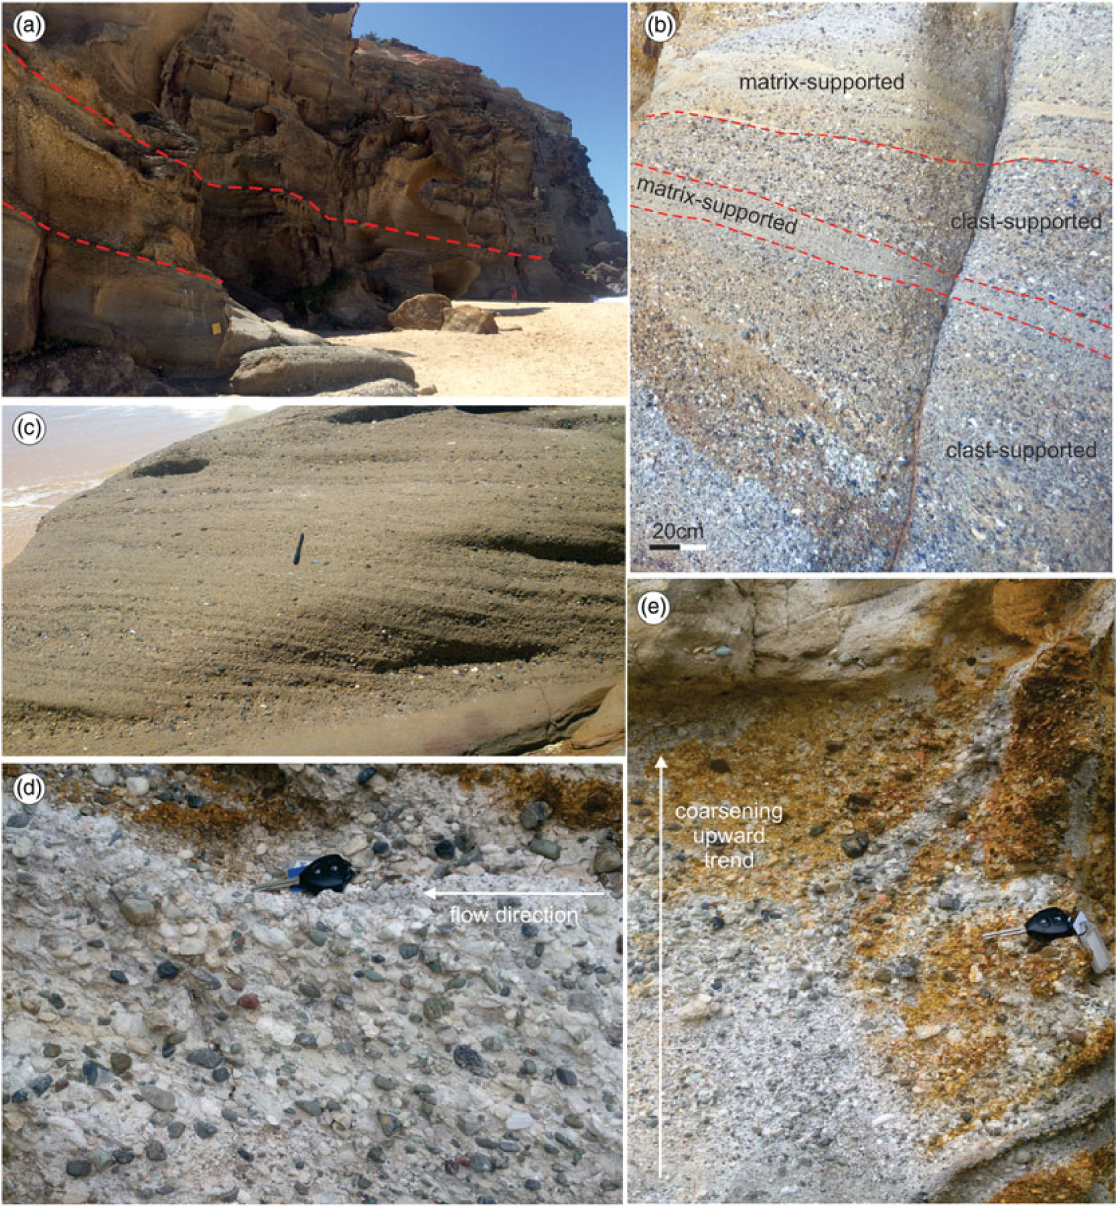
Fig. 4. Outcrop photographs illustrating diagnostic features of the fluvial sediments in the Northern Sydney Basin. (a) Repetitions of thick-bedded and coarse-grained sandstone with conglomerate. Note the bounding surfaces that dip towards the palaeoflow direction. (b) Repetitions of matrix- and clast-supported conglomerate. (c) Planar cross-stratified conglomerate. Note the abundant rounded pebble-grade extraclasts. (d) Clast-supported conglomerate with clast imbrication. The arrow points to the palaeoflow directions (to the left). (e) Reverse-grained conglomerate. Note the coarsening-upwards trend. Notebook for scale is 25 cm long. Key for scale is 8 cm long. Pen for scale is 15 cm long.
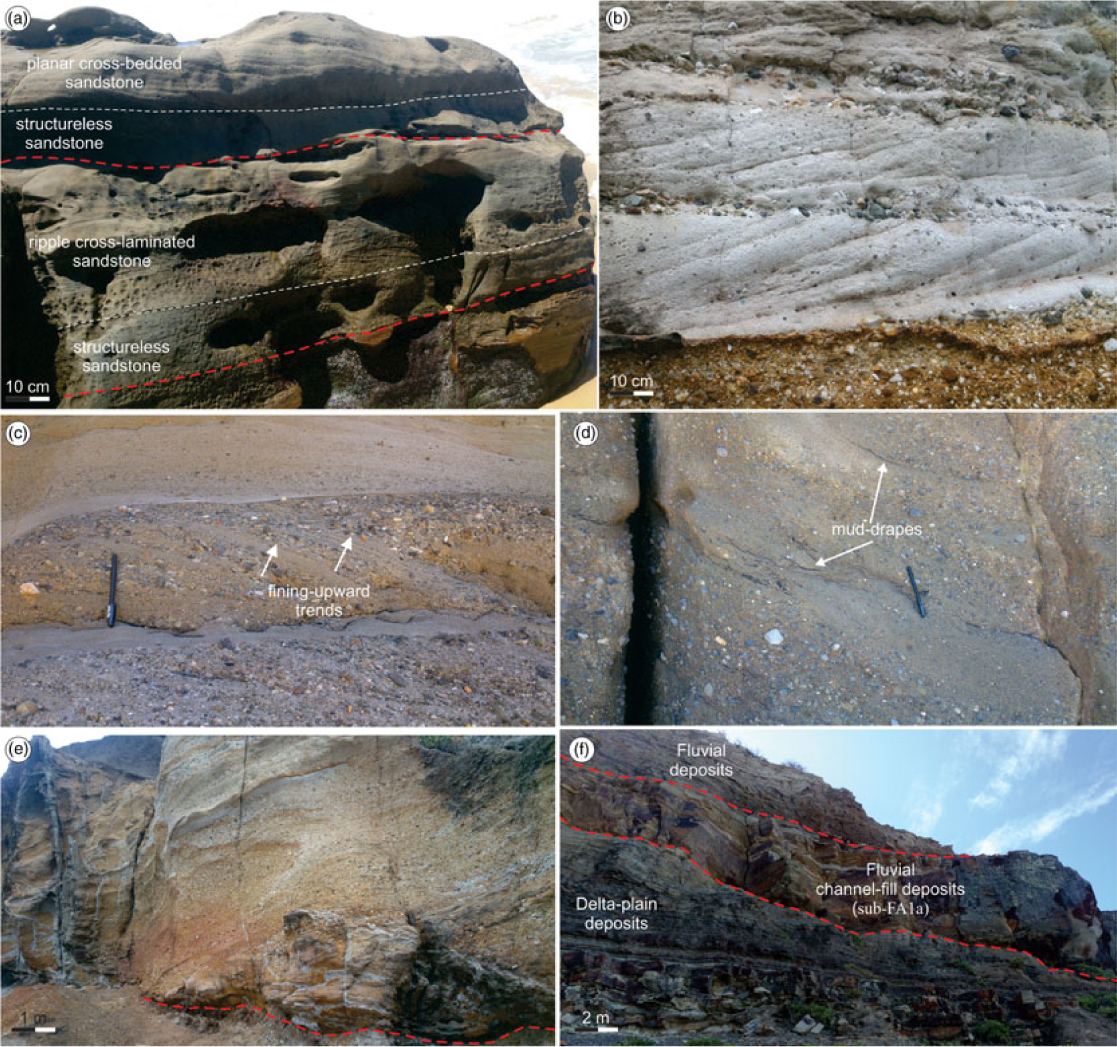
Fig. 5. Outcrop photographs illustrating diagnostic features of the fluvial sediments in the Northern Sydney Basin. (a) Structureless sandstone that overlays ripple cross-laminated and planar cross-bedded sandstone. (b) Co-sets of trough-cross-stratified sandstone. Note the bounding surfaces that separate the co-sets and are often highlighted by pebbles. (c) Cross-bedded sandstone with alternating foresets of sandstone and conglomerate within cross-beds. (d) Scattered mud drapes within the fluvial deposits. (e) Thick conglomeratic sediments that exhibit erosional contacts with the underlying sediments. (f) Fluvial channels that erode the underlying overbank and/or floodplain deposits and evolve laterally into overbank sediments. Pen for scale is 15 cm long.
The sedimentary packages that make up this sub-FA display a thinning- and fining-upward trend. Thick (2–5 m) conglomeratic bodies dominate the lower parts of these packages and evolve upwards into very thick- (1–2.5 m) to thick-bedded (0.4–0.9 m) sandstone that is interbedded with thinner-bedded conglomerate. These packages evolve upwards into medium- to thin-bedded sandstone (0.1–0.2 m) that is rarely interbedded with thin-bedded (1–5 cm) mudstone (Fig. 5e). They are often arranged into thick (1–5 m) amalgamated units, bounded by erosional surfaces that dip towards the palaeocurrent direction and display a flat to concave-up to erosional pattern (Fig. 4a). These packages pinch out laterally into finer-grained deposits that belong to sub-FA2d (Fig. 5f). The degree of amalgamation is very high and may reach 95% of the sub-FA1a. Rarely, these packages are separated by thin-bedded mudstone. Basal contacts of sub-FA1a with the underlying sediments are often erosional, whereas internally contacts between facies are sharp and/or erosional.
Interpretation:
Sub-FA1 is interpreted as fluvial channels, indicated by the thick sedimentary units that exhibit a general fining-upward trend and concave-up geometry, in association with lack of tidally influenced sedimentary structures. The presence of scarce mud drapes suggests some modification by tidal currents, but they are randomly oriented and thus are probably related to fluvial processes (Rossi & Steel, Reference Rossi and Steel2016). This FA contains the coarsest sediments observed within the studied section. The dominance of clast- to matrix-supported (F1) or cross-stratified (F2) conglomerate, and the predominant clast-supported nature of most conglomerates are characteristics of braided stream sediments (Nemec & Steel, Reference Nemec and Steel1984). Clast imbrication indicates traction currents during deposition (Whiting et al. Reference Whiting, Dietrich, Leopold, Drake and Shreve1988). Planar and trough cross-stratified conglomerate is ascribed to the migration and deposition of 2D and 3D gravelly dunes respectively (Allen, Reference Allen1983; Plink-Björklund, Reference Plink-Björklund2005). They reflect the deposition of high-energy currents in a channelized environment during lower-flow-regime conditions (Allen, Reference Allen1983).
Cross-stratified pebbly sandstone indicates migration and deposition of sandy barforms in a fluvial channel and represents downstream accretion under lower-flow-regime conditions (Medici et al. Reference Medici, Boulestei, Mountney, West and Odling2015). Repeating foresets of conglomerate and sandstone in the cross-beds is ascribed to discharge fluctuations (Steel & Thompson, Reference Steel and Thompson1983). Structureless sandstone that is present at the base of channel sandbodies corresponds to deposition during floods (Collinson, Reference Collinson and Reading1996). Parallel-laminated sandstone is developed through migration of bedforms during upper-flow-regime conditions (Collinson, Reference Collinson and Reading1996), and cross-laminated sandstone reflects relatively weak currents during the lower-flow regime (Stear, Reference Stear1978).
The general absence of overbank and floodplain fines (coal and mudstone), in conjunction with the high degree of amalgamation of the sandstone beds, suggests recurrent cut-and-fill processes (Collinson et al. Reference Collinson, Mountney and Thompson2006). This evidence implies mobile fluvial channels and frequent channel migration that is responsible for the erosion of the associated floodplain deposits (Nichols & Fisher, Reference Nichols and Fisher2007). Such absence of fine-grained deposits could be associated with recurrent channel avulsion to new positions on the proximal floodplain area (Nichols & Fisher, Reference Nichols and Fisher2007). The bounding surfaces that dip towards the palaeoflow direction correspond to downstream accretion elements (Miall, Reference Miall1977), which develop during repeated flood events and macroform aggradation (Magalhães et al. Reference Magalhães, Scherer, Raja Gabaglia, Ballico and Catuneanu2014). The general fining-upward trend could be related to either systematic migration of the channels or to decrease in the flow energy through diversion (Bridge, Reference Bridge, Posamentier and Walker2006).
4.a.2. Sub-FA1b: mid-channel bars
Description:
Sub-FA1b consists of conglomerate and fine- to very coarse-grained (and pebbly) sandstone that form thick (1–2.5 m) and laterally extensive (up to 6 m) sedimentary bodies (Fig. 6a). The main lithofacies include cross-stratified conglomerate (F2), trough (F3) and planar cross-stratified sandstone (F4) (Fig. 6b). These foresets are 0.5–1 m thick, exhibit lateral and vertical stacking, and form thicker (up to 2.5 m) co-sets. The sets are separated by first-order set boundaries, and the co-sets are bounded by second-order surfaces. First- and second-order bounding surfaces are characterized by sub-horizontal, sharp and often erosional contacts with the underlying units (Fig. 6c). The cross-beds are generally steeper-inclined (up to 25°), compared to the associated set and co-set bounding surfaces (up to 15° and 10°, respectively). Occasionally, ripple-cross-laminated (F7) and, rarely, parallel-bedded sandstones (F8) are observed and are restricted to the uppermost parts of the sub-FA1b. Both inclined and sheet-like heterolithic beds occur in some of the sub-FA1b deposits (Fig. 6d, e, f). The heterolithic beds form 0.5–1 m thick sets that exhibit repetitions of flaser, wavy and lenticular bedding. Commonly, individual cross-beds in the sets are truncated by first-order reactivation surfaces, and in some cases the toesets of individual cross-strata become indistinct, evolving into thin (3–8 cm) pebbly sandstone layers. Occasionally, the upper bounding surface displays a characteristic convex-down shape (Fig. 6d, g). In spite of the variety in the angle of dip, the surfaces associated with foresets, sets and co-sets vary in their respective dip inclinations, and exhibit similar mean azimuths to the SW or SE, in agreement with the main palaeodispersal direction.
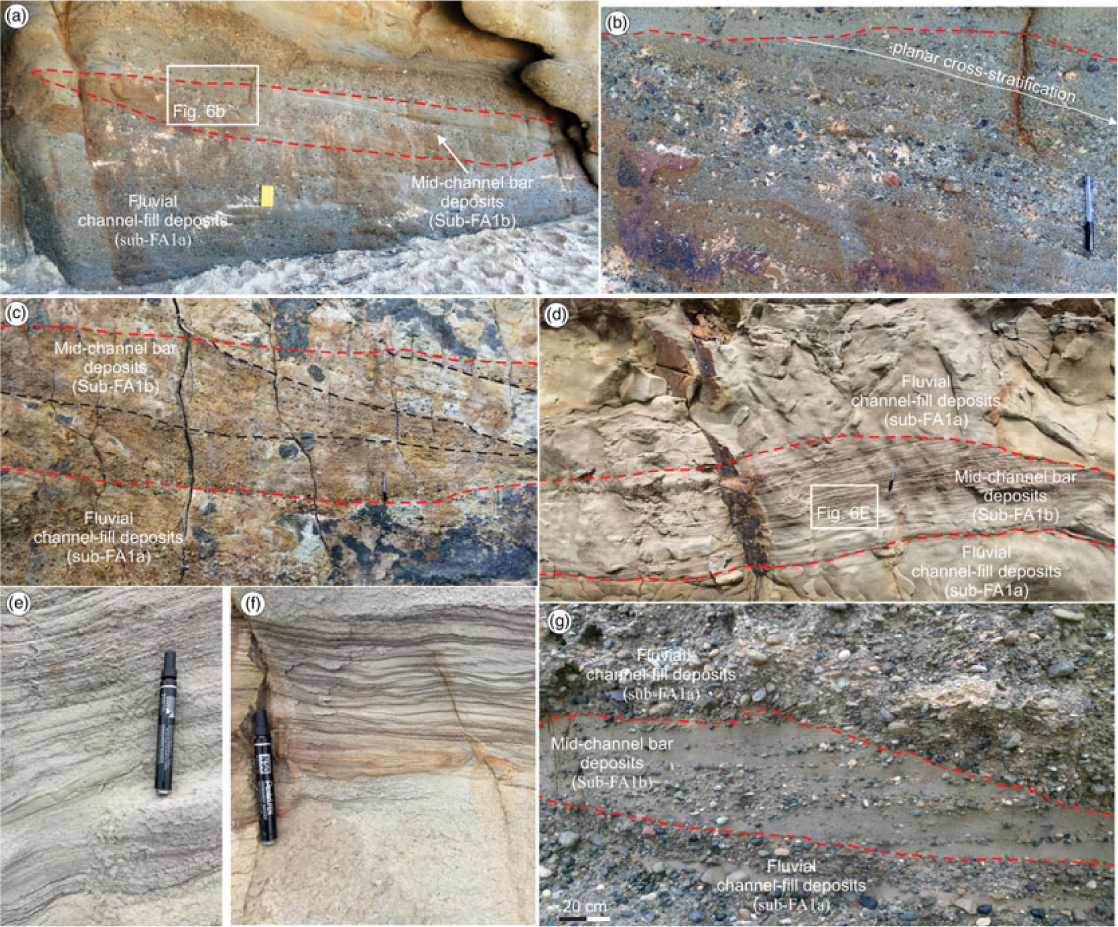
Fig. 6. Outcrop photographs illustrating diagnostic features of the mid-channel bar deposits in the Northern Sydney Basin. (a) Mid-channel bar deposits overlying channel sediments. Note the erosional contacts with the underlying units (b) Cross-bedded sandstone and conglomerate in the mid-channel bar deposits. (c) First- and second-order set boundaries that separate sets and co-sets. Note the sub-horizontal and/or erosional contacts with the underlying units. (d) Tidally influenced mid-channel bar deposits. Note the inclined heterolithic bedding that testifies the influence of tidal currents in these deposits. (e, f) Regular changes between flasher, wavy and lenticular bedding that are interpreted as rhythmites. (g) Characteristic convex-down shape of the upper bounding surface. Notebook for scale is 25 cm long. Pen for scale is 15 cm long.
Interpretation:
Sub-FA1b is interpreted as the result of migration of barforms in a downstream direction. This sub-facies is interpreted as mid-channel bar deposits that have been deposited in a fluvial environment. The regular changes between flaser, wavy and lenticular bedding are interpreted as rhythmites reflecting the impact of tides in some the Sub-FA1b deposits. The presence of inclined heterolithic bedding in some of the deposits of sub-FA1b suggests migration of barforms, such as mid-channel bars within a tidally influenced depositional setting, such as delta plain (Legler et al. Reference Legler, Johnson, Hampson, Massart, Jackson, Jackson, El-Barkooky and Ravnas2013). The convex-down shape of the upper bounding surface further supports the mid-channel bar interpretation (Miall, Reference Miall1977; Wakefield et al. Reference Wakefield, Hougha and Peatfield2015). The second-order surfaces are most likely related to the downstream migration of larger barforms, and the included planar and trough cross-bedded sandstone units reflect the migration of smaller straight- and sinuous-crested dunes (Miall, Reference Miall1988). The erosional nature of these surfaces can be ascribed to either change in the palaeoflow direction and bar readjustment, or localized scour in front of advancing barforms (Miall, Reference Miall2014). The co-sets that are separated by first-order set boundaries are associated with repeated bedform migration (train of dunes) over larger barforms (Ashworth et al. Reference Ashworth, Sambrook Smith, Best, Bridge, Lane, Lunt, Reesink, Simpson and Thomas2011; Miall, Reference Miall2014). The reactivation surfaces suggest erosion that is related to short episodes of bedform adjustment, as a consequence of change in the rate and direction of the flow (Røe & Hermansen, Reference Røe and Hermansen2006). Both inclined cross-beds and first- and second-order bounding surfaces display similar azimuths and demonstrate that both the smaller-scale dunes and the larger-scale bars migrated in the same direction. These features are in agreement with a downstream accretion element (Miall, Reference Miall2014).
4.b. FA2: delta-plain deposits
Facies Association 2 (FA2) is c. 40 m thick. FA2 exhibits depositional elements that are present in a delta-plain depositional environment, such as distributary channel (sub-FA2a), ribbon channel (sub-FA2b), lateral bar (sub-FA2c), overbank (sub-FA2d), coal-prone floodplain (sub-FA2e) and crevasses splay deposits (sub-FA2f).
4.b.1. Sub-FA2a: delta-plain distributary channels
Description:
Sub-FA2a is sand-rich and primarily composed of thin- to very thick-bedded (0.2–1.5 m), fine- to very coarse-grained sandstone interbedded with thin- to medium-bedded (0.1–0.3 m) mudstone (Fig. 7a). Clast- to matrix-supported conglomerate (F1) and cross-stratified conglomerate (F2) occur in sub-FA2a, but are finer-grained, thinner-bedded and less laterally continuous, compared to sub-FA1a. The sandstone of sub-FA2a is moderately to poorly sorted. Sandstone bodies appear as stacked sets that are mainly composed of thick beds of structureless (F3), trough cross-stratified (F4) and/or planar cross-stratified sandstone (F5). Often, structureless sandstone occupies the lower parts of the beds and is replaced upward by trough- or planar-cross-stratified sandstone (Fig. 7b). In places, cross-bedded sandstone is steeply dipping (20–30°) and may include and be overlain by mud drapes (Fig. 7c). Ripple cross-laminated sandstone (F7) and horizontally laminated sandstone (F8) are less common at the top of the thicker beds or may be the principal lithofacies in thinner beds (Fig. 7d). In addition, contorted sandstone (F9) and heterolithic deposits (F11) are present. Contorted sandstone displays folded and overturned cross-stratification. It comprises fine- to medium-grained sandstone with irregular, deformed beds (Fig. 7e). The heterolithic beds form mostly sand-dominated packages (flaser bedding), whereas packages with equal sandstone–mudstone contents (wavy bedding) also occur (Fig. 7f). Internally, sandstone is structureless (F3) and/or ripple cross-laminated (F7), with these ripples having sometimes opposite dip directions.
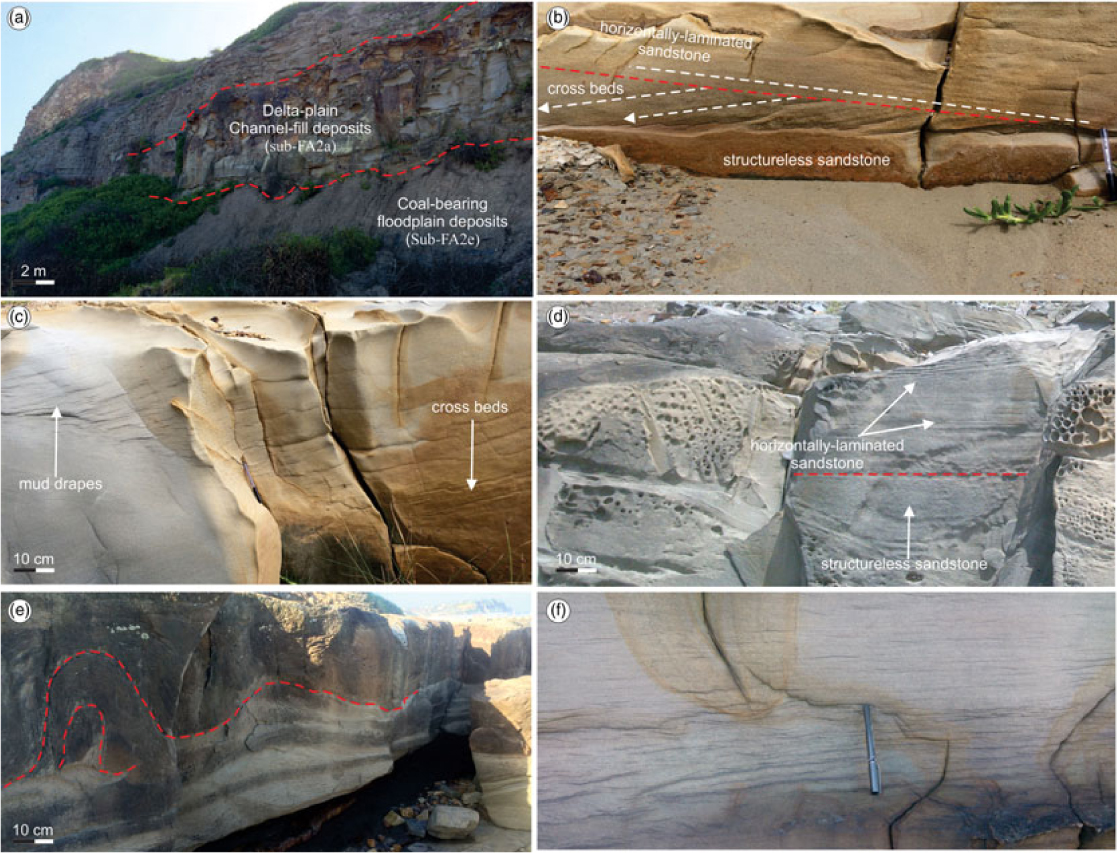
Fig. 7. Outcrop photographs illustrating diagnostic features of the delta-plain, distributary channel deposits in the Northern Sydney Basin. (a) Delta-plain, distributary channel sediments that exhibit erosional contacts with the underlying sediments. (b) Structureless sandstone that evolves upwards into cross-bedded and horizontally laminated sandstone. (c) Mud-drapes overlying cross-bedded sandstone. (d) Parallel-laminated sandstone. (e) Contorted sandstone displaying folded and overturned cross-stratification. (f) Heterolithic beds that form sand-dominated packages (flaser bedding). Pen for scale is 15 cm long.
Mudstone is usually structureless (F12), but often parallel- laminated (F13). Sub-FA2a contains abundant coal chips, wood fragments and petrified logs/branches, as well as thin (2–7 cm thick) coal beds (F14). Sub-FA2a exhibits sharp and/or erosional contacts with the underlying deposits and develops an erosional relief of 0.2–0.5 m (Fig. 8a). Such a feature leads to a concave-up basal scour surface, with a low topographic relief. These erosional surfaces are frequently highlighted by mud clasts and coarser grain sizes (Fig. 8a). Individually, the bed contacts can be erosional, gradational or sharp, with the latter two being gradually more prevalent towards the top of the sub-FA2a. Common sedimentary structures that are observed in this sub-FA include: abundant mud drapes and double mud drapes, tidal bundles and oppositely dipping current ripples (Fig. 8b, c, d). The bundles are bounded by mud drapes, and illustrate systematic thickness variations, from several millimetres to a few centimetres. These structures occur in most sandstone facies (less often in structureless sandstone) but are abundant in ripple cross-laminated sandstone and heterolithic deposits. Larger-scale cross-stratified sandstone (0.3–1 m thick) bodies are also present within this sub-FA. Sub-FA2a consists of thick (3–8 m) packages of strata that are composed of stacked cycles with a characteristic fining-upward trend.
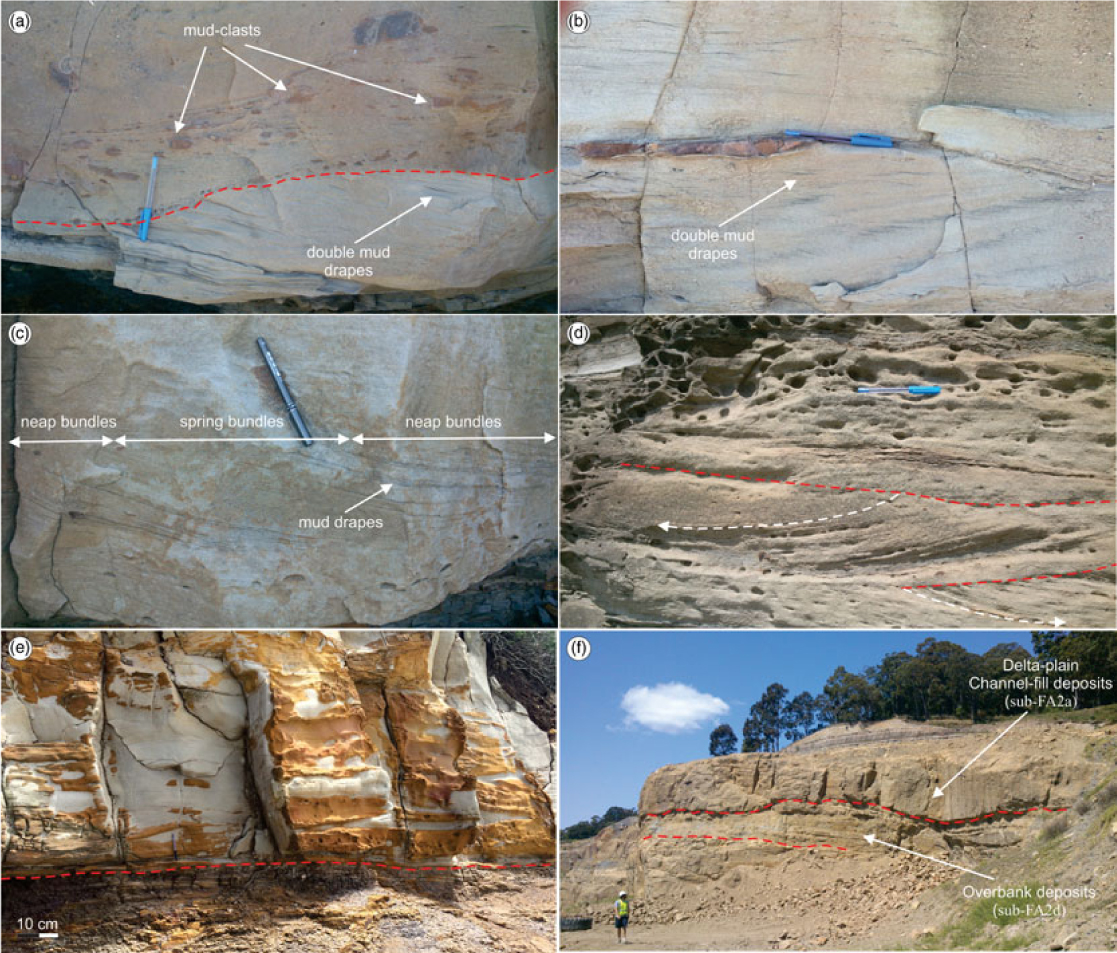
Fig. 8. Outcrop photographs illustrating diagnostic features of the delta-plain, distributary channel deposits in the Northern Sydney Basin. (a) Erosional surfaces that are highlighted by mud clasts. (b) Double mud drapes. (c) Tidal bundles reflecting deposition during neap and spring periods. (d) Bipolar current ripples. (e, f) Delta-plain, distributary channel deposits overlying overbank and/or floodplain deposits. Note the erosional contact with the underlying sediments. Person for scale is 180 cm tall. Pen for scale is 15 cm long.
The basal parts of these cycles are composed of very thick-bedded sandstone (1–2 m) that evolves upwards into repetitions of thick- (0.5–1 m) and medium-bedded (0.1–0.2 m) sandstone with thin- to medium-bedded mudstone (0.05–20 cm). These sedimentary packages form thick bodies that can be laterally extensive for up to hundreds of metres (Figs 7a, 8e and Fig. 11a below). Sub-FA2a is associated with sub-FA2d (overlays, and also evolves laterally) and sub-FA2e (overlays). In places, sub-FA2a forms amalgamated sandbodies that are 8–15 m thick (Fig. 8e). Elsewhere, single sandstone beds erode in the underlying mudstone beds (Fig. 8f).
Interpretation:
Sub-FA2a is interpreted as tidally influenced channelized deposits in a delta-plain setting, with relatively shallow and narrow channels that cut into underlying fine-grained overbank and/or floodplain deposits. This is supported by the basal erosion surfaces that document confined geometries, and the fining-upward trend that is ascribed to the upward waning of current energy (Bridge, Reference Bridge, Posamentier and Walker2006; Legler et al. Reference Legler, Johnson, Hampson, Massart, Jackson, Jackson, El-Barkooky and Ravnas2013). The inclusion of coal and wood fragments, lack of marine bioturbation and presence of pebble-sized clasts, in conjunction with the prevalence of fluvial-related sedimentary structures (e.g. trough cross-bedding), suggest high-energy, fluvial style deposition (Visser, Reference Visser1980; Nio & Yang, Reference Nio and Yang1991). The contribution of tidal currents during the deposition of these sediments is documented by the abundance of single and double mud drapes, and by the presence of bipolar current ripples, tidal bundles and heterolithic beds (Cant & Walker, Reference Cant and Walker1978; Mellere & Steel, Reference Mellere, Steel, De Baptist and Jacobs1996). Mud drapes reflect deposition during slack periods. The double mud drapes document deposition within the zone of tide dominance (Dalrymple & Choi, Reference Dalrymple and Choi2007). The bipolar current ripples testify to the action of reversing tidal currents (Reineck & Wunderlich, Reference Reineck and Wunderlich1968). Tidal bundle thickness variations are interpreted to record neap–spring cyclicity. Heterolithic bedding indicates deposition by sporadic tidal flows, leading to observed cyclic mud and sand beds (Martin, Reference Martin2000).
Sub-FA2a shares similar features with sub-FA1a and illustrates the lateral migration of energetic and channelized depositional settings over their associated overbanks and floodplains. The principal differences are associated with the much better preservation of overbank deposits and the abundance of tidally influenced sedimentary structures in sub-FA2a compared to sub-FA1a. The preservation of adjacent overbanks in sub-FA2a could be associated with the fluvial style, and suggests a still braided, but a less confined nature of these deposits compared to sub-FA1a. Less frequent channel migration probably prevented the removal of fine-grained sediment and facilitated the formation of overbanks in sub-FA2a (Nichols & Fisher, Reference Nichols and Fisher2007).
4.b.2. Sub-FA2b: ribbon channels
Description:
Sub-FA2b forms single, isolated lenticular-shaped sedimentary bodies that are 1–1.5 m thick and 6–12 m wide (low width/thickness ratio; Fig. 9a). These bodies are filled with sandstone that is fine- to medium-grained and moderately sorted. Some vertical and lateral amalgamation is present in this sub-FA, although individual concave-up geometries typically remain well defined (Fig. 9b). These deposits pinch out laterally over short distances and display a fining-upward trend (Fig. 9a). Sandstone within the sub-FA2b is structureless (F3), planar cross-stratified (F5) and/or horizontally laminated. Structureless sandstone occurs at the base of the sandstone beds, whereas planar cross-stratified and/or horizontally-laminated sandstone is common towards the top of the beds (Fig. 9c). In some places, mud drapes and heterolithic bedding (flaser bedding, F11) occur (Fig. 9d). Sub-FA2b overlays and evolves laterally into repetitions of sandstone and mudstone beds that belong to sub-FA2d. The basal contacts with these underlying finer-grained strata are sharp and erosional, defining a concave-up geometry. The incision in the sub-FA2b may reach 1 m, where the erosional relief is also the total thickness of the channel at its axis. Sub-FA2b is also associated with sub-FA2e.
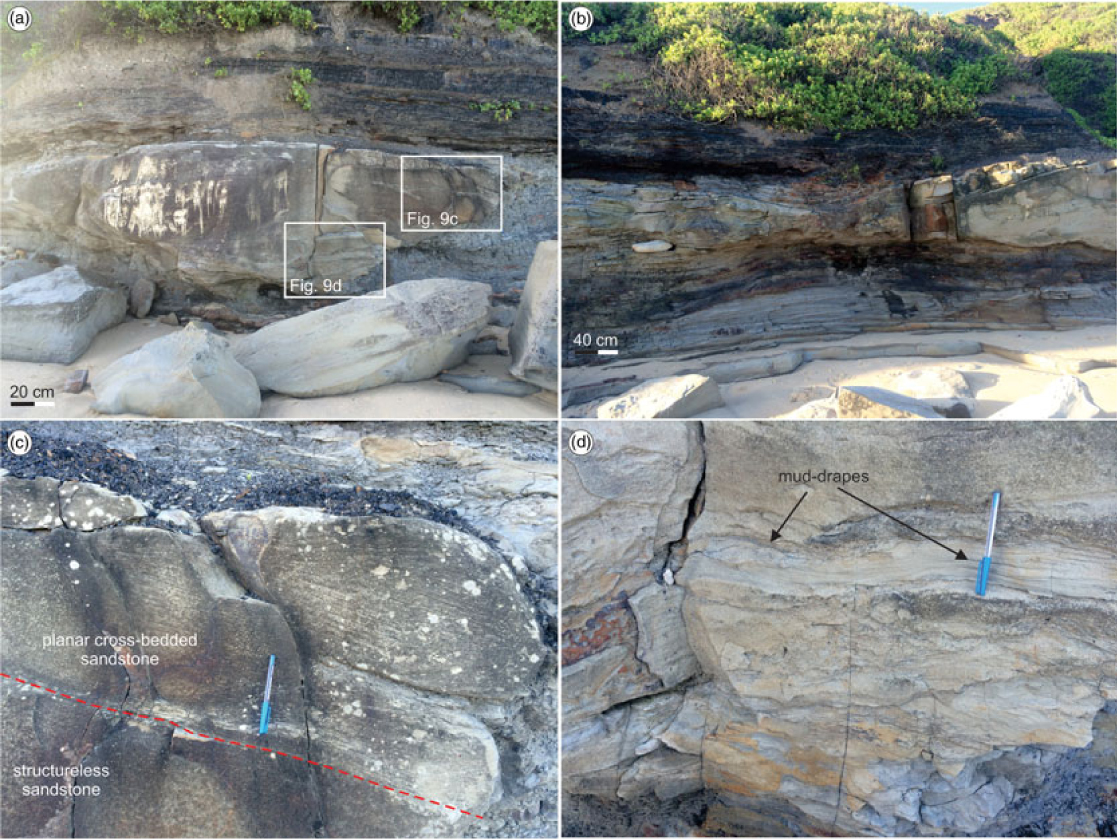
Fig. 9. Outcrop photographs illustrating diagnostic features of the ribbon channel deposits in the Northern Sydney Basin. (a) Lenticular-shaped sedimentary bodies with low width/thickness ratio. (b) Lateral amalgamation of ribbon channel deposits. (c) Planar cross-bedded sandstone occupying the upper parts of the deposits and underlain by structureless sandstone. (d) Mud drapes and heterolithic bedding observed at the base of the ribbon channels. Pen for scale is 15 cm long.
Interpretation:
Sub-FA2b is interpreted as ribbon channels (single-threaded channels) that form in sediment-starved environments, based on the concave-up geometry and the fining-upward trend. These channels reflect short-lived flows and form as a result of channel incision into their surrounding fine-grained facies (Friend et al. Reference Friend, Hirst and Nichols1986). They suggest that the deposition of sand took place until they become water- or sediment-starved (Friend et al. Reference Friend, Hirst and Nichols1986), and eventually pinch out into overbank (sub-FA2d) deposits. The fining-upward sandstone that extends laterally from the core of the body of sub-FA2b (wings) is related to flooding episodes and associated emplacement of sand further into overbanks (Mohrig et al. Reference Mohrig, Heller, Paola and Lyons2000).
4.b.3. Sub-FA2c: lateral bars
Description:
Sub-FA2c is commonly interbedded between coarse-grained deposits (sub-FA1a and mostly sub-FA2a) or overlays fine-grained sediments (sub-FA2d and/or sub-FA2e). It forms tabular to wedge-shaped, thick (1–3 m) sedimentary bodies that are laterally extensive (3–8 m). These deposits range from simple deposits, 0.5–1 m high, to complex bedforms up to 3 m high (Fig. 10a, b). The master bedding surfaces are planar and/or concave-up and are locally overlain by very thin bedded mudstone (a few mm thick). The dip of the master bedding surfaces decreases towards the downcurrent parts of the sandstone bodies. Sub-FA2c is composed of medium- to very fine-grained sandstone and scarce pebbly sandstone. Component lithofacies include mainly planar cross-stratified sandstone (F5), but trough cross-stratified sandstone (F4) and, less often, structureless (F3) and/or horizontally laminated (F8) sandstone occur (Fig. 10c). The foresets are organized in a toplap, offlap and downlap relationship with the adjacent strata. The cross-beds commonly downlap abruptly onto the underlying deposits or onto the basal surface (Fig. 10c). Some of the cross-beds may fine upwards, commonly from pebbly- and coarse-grained sandstone at the base to medium- to very fine-grained sandstone at the top (Fig. 10c). Palaeocurrent data derived from cross-beds are oblique to the main palaeocurrent direction (refer to palaeocurrent analysis). Mud drapes and heterolithic bedding (flaser bedding) occur in some of these deposits. Basal surfaces with underlying strata are concave-up, sharp and commonly erosional. In some instances, the base of the sub-FA2c rests upon erosive surfaces that may extend beyond the lateral extents of this sub-FA.
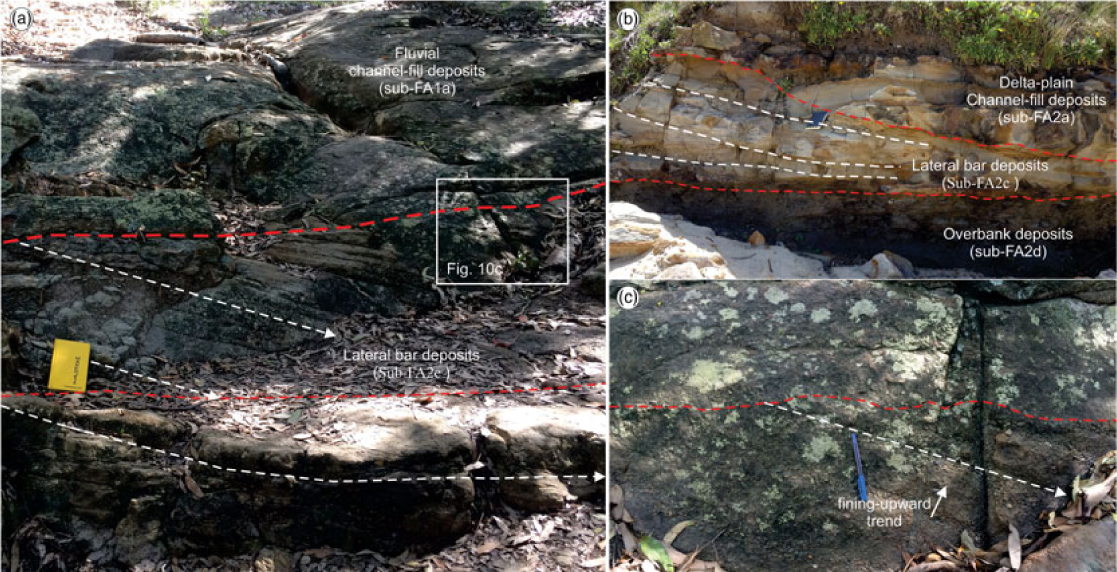
Fig. 10. Outcrop photographs illustrating diagnostic features of the lateral bar deposits in the Northern Sydney Basin. (a, b) Tabular to wedge-shaped, thick sedimentary bodies. Note the planar and/or concave-up master bedding surfaces. The dip of these surfaces decreases towards the downcurrent parts of the sandstone bodies. (c) Cross-beds that downlap abruptly on the underlying deposits. Note the fining-upwards trend in some of the cross-beds. Notebook for scale is 25 cm long. Pen for scale is 15 cm long.
Interpretation:
Sub-FA2c is interpreted as a lateral accretion element (lateral bar) indicating localized sinuosity in a channelized depositional environment. Supporting evidence derives from the dip of the cross-beds that is oblique to the main palaeoflow direction of the river channels, the tabular to wedge shape, the close association with channelized sediments (sub-FA2.1), and the dominance of planar and trough cross-stratification. These characteristics are indicative of deposition in lateral bars that form along the margins of fluvial channels (Bridge, Reference Bridge2003). Where present, mud drapes and double mud drapes suggest the tidal influence in some of the sub-FA2c deposits (Pontén & Plink-Bjorklund, Reference Pontén and Plink-Björklund2007). The master bounding surfaces that dip obliquely to the main palaeoflow direction are interpreted as lateral accretion surfaces and are consistent with the lateral bar interpretation of these deposits. The absence of erosion or reorganization, related to periods of low discharge, indicates that lateral accretion may have occurred coevally with downstream accretion. Similar features have been also described in other studies (Santos et al. Reference Santos, Almeida, Godinho, Marconato and Mountney2014; Wakefield et al. Reference Wakefield, Hougha and Peatfield2015; Mellere et al. Reference Mellere, Mannie, Longhitano, Mazur, Kulausa, Brough, Cotton, Hampson, Reynolds, Kostic and Wells2016).
4.b.4. Sub-FA2d: overbank deposits
Description:
Sub-FA2d is composed of thin- to medium-bedded (0.1–0.3 m) sandstone and mudstone, commonly associated with sub-FA1a, sub-FA2a and sub-FA2b. They are often interbedded between the underlying sub-FA2a and sub-FA2b and the overlying sub-FA2e (Fig. 11a). This sub-FA forms thick sedimentary successions (5–7 m). The sandstone is structureless (F3), ripple-cross-laminated (F7) and/or heterolithic-bedded (F11). Internally, the heterolithic beds comprise thin- to medium-bedded (2–25 cm thick) sand- to mud-dominated couplets. The sandy (flaser) parts contain current ripple cross-lamination (F3). The muddy parts are structureless or parallel-laminated and may include very thin- to thin-bedded (1–10 cm) sandstone forming lenticular to wavy bedding (Fig. 11b). Rarely, an upward transition from flaser through wavy to lenticular bedding exists within the medium-bedded sandstone of the sub-FA2d (Fig. 11c). Mudstone beds are structureless (F12) and/or parallel-laminated (F13). The tops of the sandstone beds are often flat, but they often exhibit lenticular geometry (Fig. 11c). The bases of the sandstone beds are mostly flat, but in some cases record localized erosion. Sub-FA2d can be laterally extensive for up to several hundred metres. Sub-FA2d is common within the lower stratigraphic levels (in the deltaic section of the studied succession). Up-sequence (in the fluvial section of the succession), it contains more sand, becomes less common and is typically thinner.
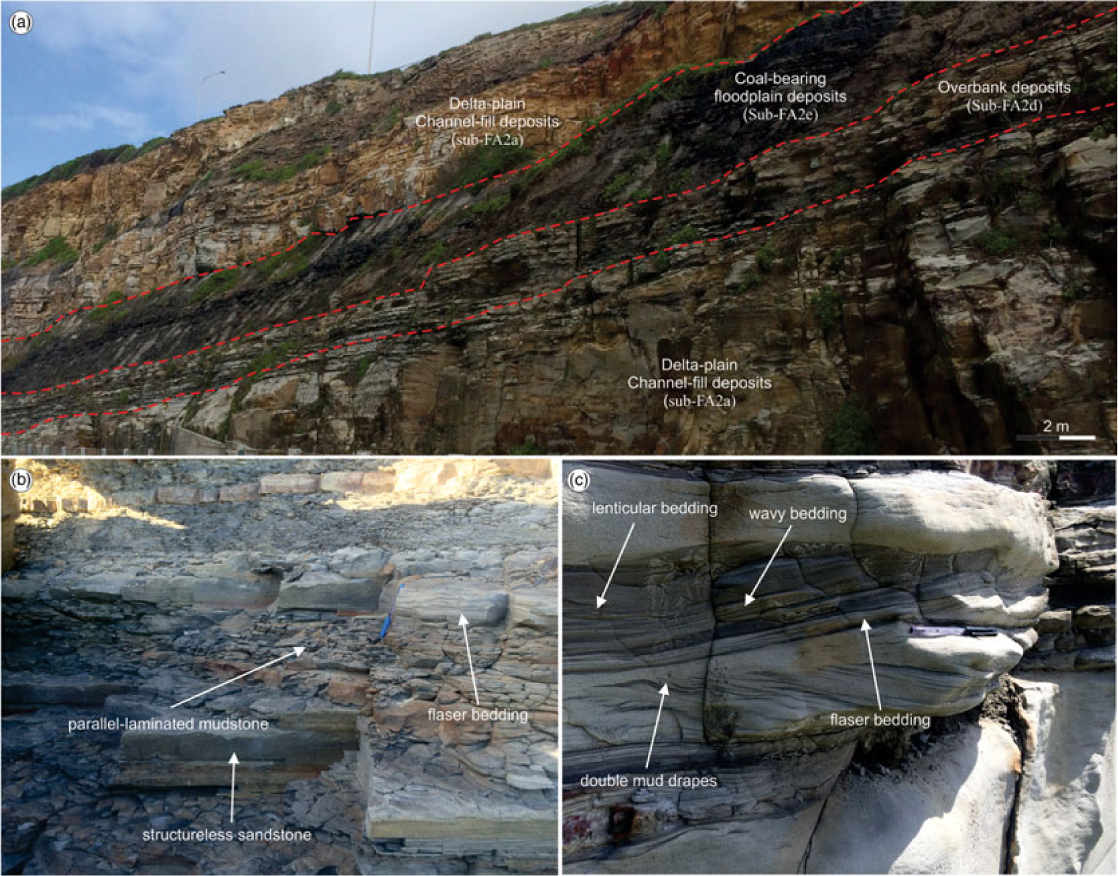
Fig. 11. Outcrop photographs illustrating diagnostic features of the overbank deposits in the Northern Sydney Basin. (a) Overbank facies interbedded between the underlying channelized and the overlying coal-bearing floodplain deposits. (b) Repetitions of structureless and heterolithic-bedded sandstone with mudstone. (c) Heterolithic bedding in the overbank deposits. Note the upwards transition from flaser to lenticular bedding. Pen for scale is 15 cm.
Interpretation:
Sub-FA2d is interpreted as overbank deposits that form on top of inactive channels and adjacent to active channels in the delta plain. The thicker, fine-grained sandstone beds suggest that the energy of the depositional environment was low and located adjacent to the active channels (Nichols, Reference Nichols1999). The presence of fine-grained heterolithic bedding indicates tidal modulation during the deposition of some of the sediments (Reineck & Wunderlich, Reference Reineck and Wunderlich1968). Parallel-laminated mudstone indicates that sub-FA2e was influenced by weak currents that reworked the sediments into laminated units (Pontén & Plink-Bjorklund, Reference Pontén and Plink-Björklund2007). The lenticular geometry of the beds could be associated to sea floor instability, in agreement with overbank settings (Pontén & Plink-Bjorklund, Reference Pontén and Plink-Björklund2007). The up-sequence decrease in abundance, thickness and grain size of the sub-FA2d indicates an increase in the erosion of the associated floodplain deposits (Nichols & Fisher, Reference Nichols and Fisher2007). The association of sub-FA2d with channelized deposits (sub-FA1a, sub-FA2a and sub-FA2b) suggests that this increased erosion was most likely associated with enhanced channel migration.
An alternative interpretation could be that this sub-FA corresponds to tidal flat deposits. However, the lack of regular variations between flaser, wavy and lenticular bedding in an upward-fining fashion, a diagnostic feature of tidal flats (Dalrymple, Reference Dalrymple, James and Dalrymple2010; Daidu, Reference Daidu2013), makes the overbank setting the most plausible interpretation for the sub-FA2d.
4.b.5. Sub-FA2e: coal-prone floodplain deposits
Description:
Sub-FA2e occurs on a range of scales from mm-sized ribbons to metre-thick (up to 8 m thick) beds (Fig. 12a). Coal appears as dull black to shiny black in colour and forms tabular beds that thin, split and pinch out laterally, interfingering with volcaniclastic sediments (Fig. 12b). Coal beds can be traced for hundreds of metres at the same stratigraphic levels and are characterized by a sharp boundary with the underlying heterolithic-bedded sandstone, structureless (F12) and/or parallel-laminated mudstone (F13) that belong to sub-FA2d (Fig. 12c). Often, coal deposits are overlain by sand-dominated beds of sub-FA2a.
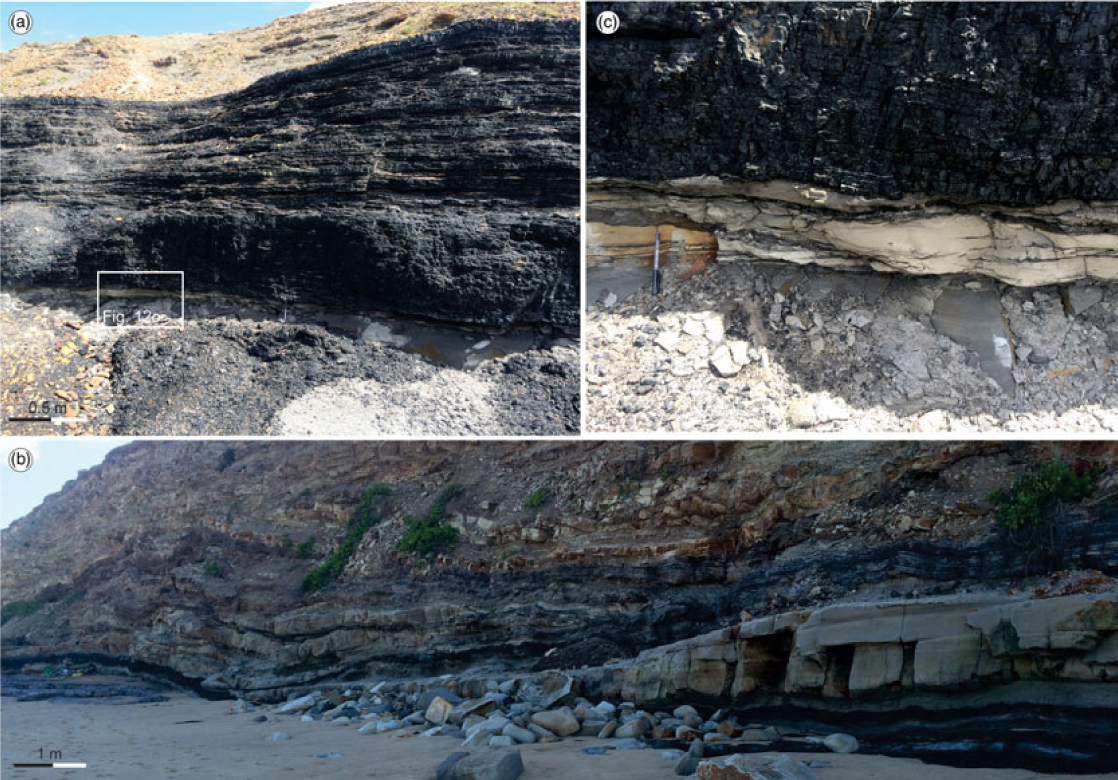
Fig. 12. Outcrop photographs illustrating diagnostic features of the coal-bearing floodplain deposits in the Northern Sydney Basin. (a) Tabular-shaped, thick coal bed in the studied region. (b) Coal beds that thin, split and pinch out laterally, interfingering with volcaniclastic sediments. (c) Coal bed that exhibits sharp boundary with the underlying heterolithic-bedded sandstone and structureless mudstone that belong to overbank deposits. Pen for scale is 15 cm.
Interpretation:
The formation of peat mires is associated with climatic conditions and availability of organic matter. Their formation requires humid, swampy conditions in areas where rainfall exceeds evaporation and organic growth is rapid (Guion et al. Reference Guion, Fulton, Jones, Whateley and Spears1995). The great thickness of the coal deposits in the study area indicates prolonged periods of peat accumulation. In deltaic settings, coal beds can form under continuously rising mire water table (base level) relative to the sediment surface that generated the accommodation required for peat accumulation (Davies et al. Reference Davies, Howell, Boyd, Flint and Diessel2006). A similar environment is indicated for these deposits. Their association with delta-plain channelized deposits (sub-FA2a) reflects the lateral migration of the distributary channels that rest on the former, coal-bearing floodplain area.
4.b.6. Sub-FA2f: crevasse splays
Description:
Sub-FA2f is composed of thin- to thick-bedded (0.2–1 m), fine- to medium-grained sandstone that is mostly enclosed within mudstone (Fig. 13a). The surrounding mudstone is structureless (F12) or parallel-laminated (F13) and belongs to the sub-FA2d. The surrounding sediments may also include very thin- to thin-bedded (0.1–0.2 m) sandstone. The sandstone in the sub-FA2f is structureless (F3), horizontally laminated (F8) and/or ripple cross-laminated (F7) and displays a fining-upward trend (Fig. 13b). Mud drapes may be present in the cross-beds of some of the sandstone beds (Fig. 13c). The sandstone beds are 4–6 m wide and exhibit tabular to lenticular geometry. The beds have a maximum thickness of 11 m, and gradually decrease laterally before merging into the surrounding mudstone (Fig. 13a). The contacts with the underlying fine-grained sediments are sharp and/or erosional and incise a few centimetres down (1–15 cm). The upper bed contacts are often gradational and/or sharp.
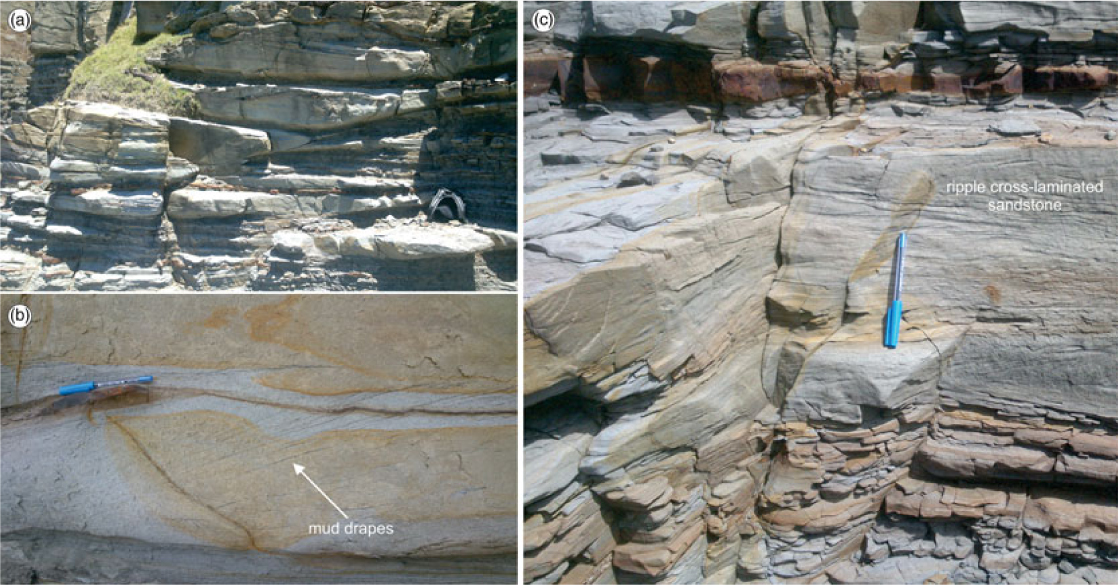
Fig. 13. Outcrop photographs illustrating diagnostic features of the crevasse splay deposits in the Northern Sydney Basin. (a) Thin- to thick-bedded sandstone that pinches out into the surrounding fine-grained overbank deposits. (b) Mud drapes in the cross-beds of some of the sandstone beds. (c) Ripple cross-laminated sandstone. Bag for scale is 45 cm long. Pen for scale is 15 cm.
Interpretation:
Sub-FA2f is interpreted as crevasse splay deposits that have been deposited in a deltaic depositional environment. Supporting evidence derives from the lenticular geometry of this sub-FA, the association with overbank sediments (sub-FA2d) and the fining-upward trend. The thick (up to 1 m) sandstone beds that are enclosed between mud-rich sediments point to sporadic input of coarser material into a region of low energy. This sub-FA represents deposits that formed by breaching of overbank deposits by active channels and associated deposition in the floodplain/overbank areas (O’Brien & Wells, Reference O’Brien and Wells1986). The sharp bases with the underlying sediments and the fining-upward trend are associated with initial rapid flow that follows the break of the overbanks, which in turn is followed by subsequent waning. This waning reflects the decrease in the water and sediment availability through time (Nichols, Reference Nichols1999). Fast sediment input is interpreted from erosional basal contacts, capable of scouring and eroding the underlying mudstone, whereas the overlying gradational base indicates the steady reduction in sediment input and energy over time (Ethridge et al. Reference Ethridge, Skelly, Bristow, Rogers and Smith1999).
4.c. FA3: delta-front deposits
Facies Association 3 (FA3) is c. 251 m thick. FA3 exhibits features that are characteristic of a delta-front depositional setting including thick, amalgamated and medium- to well-sorted sandstone bodies that hold evidence of wave and storm influence. FA3 does not outcrop throughout the study area but does outcrop inland at outcrop 13 (Fig. 2).
4.c.1. Description
FA3 is sand-rich and forms a sedimentary succession that is composed of fine- to medium-grained, thin- to thick-bedded sandstone (0.1–1.21 m, Fig. 14a). Rarely, isolated pebbles or very thin pebbly layers (a few mm thick) have been observed. This FA exhibits a coarsening- and thickening-upward trend, and thus, mudstone is not abundant and is mainly restricted to the lower parts of the succession (Fig. 14b). Thin mudstone layers, up to 2 cm thick, may be present between sandstone beds. FA3 displays a variety of sedimentary structures (Fig. 14c, d, e, f). The sandstone beds can be structureless (F3), trough cross-stratified (F4), planar cross-stratified (F5), ripple cross-laminated (F7), horizontally laminated (F8) or hummocky/swaley cross-stratified (HCS and SCS respectively, F10). Oscillatory ripple cross-lamination is sometimes present and may occur at the tops of hummocky cross-stratified beds. Mudstone drapes are very rare.
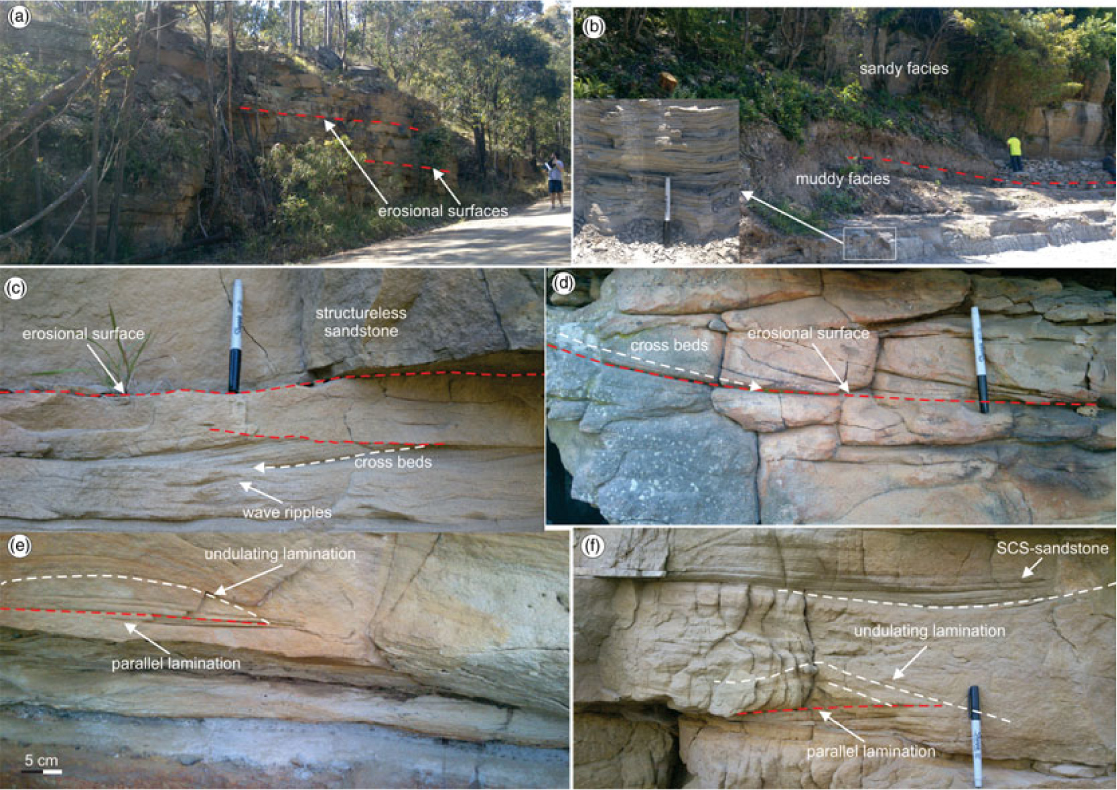
Fig. 14. Outcrop photographs illustrating diagnostic features of the delta-front deposits in the Northern Sydney Basin. (a) Thick amalgamated sandstone units. Note that the beds are separated by erosional surfaces. (b) Thickening- and coarsening-upwards trend in the studied deposits. (c) Cross-laminated sandstone that is overlain by structureless sandstone. Note the wave ripples below the cross-laminated sandstone. (d) Cross-bedded sandstone. (e) HCS-sandstone. Note the basal planar to low-angle laminated unit that is overlain by undulose lamination. (f) SCS-sandstone exhibiting low-angle lamination that infills basal scour surfaces. Pen for scale is 15 cm. Person for scale is 180 cm tall.
Sandstone beds are commonly amalgamated, and form sets that are up to 41 m thick. Upper bed surfaces may be flat or undulose, and locally are sharply overlain by thin-bedded mudstone. Internally, sandstone beds are separated by erosional surfaces (Fig. 14c). HCS and SCS, along with traction structures (e.g. planar and trough cross-bedding), are the dominant sedimentary structures in the FA3 deposits (Fig 14d, e, f). HCS- and SCS-sandstone develops medium- to large-scale cross-stratification, in which the undulating and gently dipping laminae comprise large-amplitude (tens of cm) and low-relief (a few cm) hummocks and troughs (Fig. 14e, f). HCS-sandstone consists of a basal planar to low-angle laminated unit (1–5 cm thick) and is overlain by undulose lamination (Fig. 14e). SCS-sandstone exhibits low-angle lamination that often infills basal scour surfaces (Fig. 14f). Bioturbation is generally scarce. Rare vertical specimens of Ophiomorpha comprise the only ichnotaxon observed.
4.c.2. Interpretation
This facies association is interpreted here as delta-front deposits. The main lines of evidence come from the presence of HCS and SCS, as well as the stratigraphic position of these deposits that are sitting below delta-plain (FA2) deposits. The HCS and SCS have long been regarded as storm-related sedimentary structures (Leckie & Walker, Reference Leckie and Walker1982), whereas the isolated wave ripples may record wave reworking during the waning stage of a storm, or fair-weather reworking (De Raaf et al. Reference De Raaf, Boersma and Van Gelder1977). Massive to planar-laminated sandstone below HCS-sandstone records initial erosion and subsequent fallout from suspension. The low-angle lamination in SCS-sandstone that mantles scours represents relatively low aggradation rates and the preferential preservation of troughs (swales) rather than mounds (Dumas & Arnott, Reference Dumas and Arnott2006). The structureless sandstone beds may indicate periods of high sedimentation rates. The thick, sandstone beds of FA3 are interpreted as the results of combined effect of continuous supply of relatively coarse material, along with deposition within a turbulent environment (Myrow & Southard, Reference Myrow and Southard1991).
The cross-bedded sandstone is interpreted as being deposited by dunes. Similar cross-stratification, with high dip angle and large set thickness, can be produced by waves in coarse-grained sandstone (Leckie, Reference Leckie1988; Cummings et al. Reference Cummings, Dumas and Dalrymple2009). The fine grain size of this FA indicates that these cross-stratified sandstone beds represent unidirectional traction structures, further suggesting a high-energy delta-front environment of deposition for the FA3. The general absence of mudstone in the succession is also compatible with a high-energy delta-front environment (Pemberton et al. Reference Pemberton, Spila, Pulham, Saunders, MacEachern, Robbins and Sinclair2002). The overall coarsening-upward trend could be indicative of mouth bar progradation and corresponds to the unconfined deposits accumulated at the mouths of the distributary channels. Structureless sandstone most likely accumulated during high discharge periods and is indicative of river floods, documenting the influence of river currents during deposition (Rossi & Steel, Reference Rossi and Steel2016). The very low (nearly absent) degree of bioturbation is probably associated with hostile environmental conditions that are ascribed to increased fluvial input, and is in agreement with deposition in a high-energy setting (MacEachern & Bann, Reference MacEachern, Bann, Hampson, Steel, Burgess and Dalrymple2008). It suggests environmentally stressed conditions (e.g. increased turbidity or lowered salinity), which could reflect proximity to delta distributary mouths (MacEachern & Bann, Reference MacEachern, Bann, Hampson, Steel, Burgess and Dalrymple2008).
5. Palaeocurrent analysis
Palaeocurrent analysis was conducted within both the deltaic and the fluvial portion of the succession. Paleoflow data were collected from several outcrops. In particular, 21 measurements were taken from one outcrop from the delta-front deposits, 148 measurements were collected from seven outcrops from the delta-plain sediments and 100 measurements were collected from four outcrops from the fluvial deposits (Table 2).
Table 2. Summary of palaeocurrent measurements, in relation to depositional environments in the Northern Sydney Basin
The data exhibit a SE- to SW-directed transport direction indicating a NW- to NE-located sediment source. These results agree with previous studies that also indicate a predominantly north to south operating routing system with a slight NE to SW shift (G Fay, unpub. Honours thesis, Univ. Newcastle, Australia, 1980; PR Warbrooke, unpub. Ph.D. thesis, Univ. Newcastle, Australia, 1981). However, the studied succession records a complex palaeocurrent pattern, with major routing systems flowing both axially and transverse to the principal uplift structures in the New England Orogen, such as the Peel–Manning Fault System (Collins, Reference Collins1991). In particular, the data from the delta-front and delta-plain deposits indicate a S, SE (axial) transport pathway (Fig. 15), whereas the overlying fluvial sediments exhibit a mostly SW (transverse) palaeoflow pattern (Fig. 16).
Fig. 15. Rose diagrams (a–h) illustrating the measured values and the mean palaeocurrent direction in the delta-plain deposits. Note the main S-SE palaeodispersal direction.
Fig. 16. Rose diagrams (a–d) illustrating the measured palaeoflow values and the mean direction in the fluvial deposits. Note the main S-SW palaeodispersal direction.
6. Stratigraphy
The studied succession (c. 901 m thick) was examined by logging and correlating 13 laterally extensive (hundreds of metres) outcrops, with all but one (outcrop 13) being situated along the 25 km of coastline (Fig. 2). Delta-front deposits (FA3, 251 m thick) are restricted to one outcrop (outcrop 13). Delta-plain deposits (FA2, 40 m thick) correspond to the bulk volume of the studied succession and are exposed in almost all studied outcrops (except outcrop 12). The fluvial sediments (FA1, 25 m thick) correspond to a considerable volume of the studied succession and are exposed at several outcrops (Figs 17–19). The outcrops illustrate the vertical and lateral facies transitions evident in different parts of the delta system. From northeast to southwest, the region exhibits a general trend from delta-front deposits (FA3), through delta-plain sediments deposited below the tidal limit (FA2), to fluvial channels above or close to the inferred tidal limit (FA1). Similarly, the overall vertical transition through the succession (Figs 17–19) is from delta-front sediments (FA3) into delta-plain deposits (FA2), overlain by fluvial and mostly channelized deposits (sub-FA1a). The boundary between the delta-front and delta-plain deposits was not observed, but the boundary between the delta-plain and fluvial can be traced in several outcrops across the entire study region and is represented by an extensive erosion surface (Figs 18, 19). This fluvio-deltaic system was impacted by volcanic activity, as evidenced by the occurrence of tuff units (Figs 17, 18). The principal volcanic activity is well constrained at the boundary between the delta-plain and fluvial sediments.
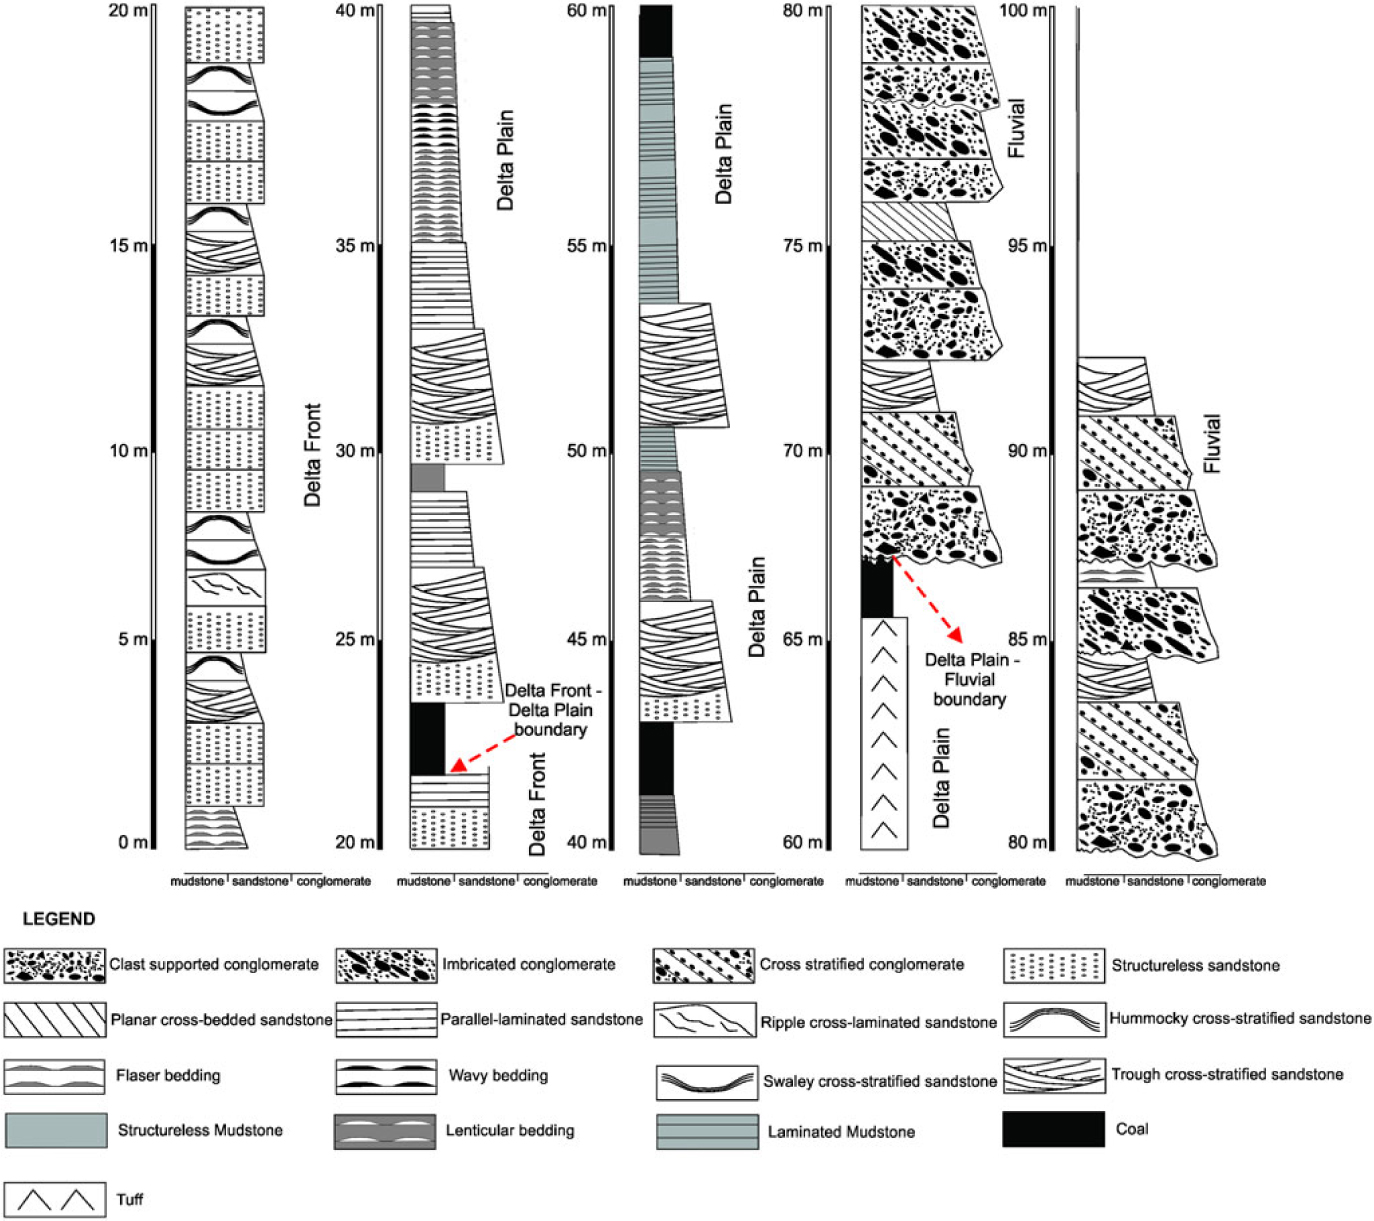
Fig. 17. Generalized stratigraphic column that illustrates the up-sequence evolution of the studied sedimentary succession. Note the shoaling-upward trend as documented by the transition of delta-front to tidally influenced delta-plain sediments and finally to fluvial deposits.
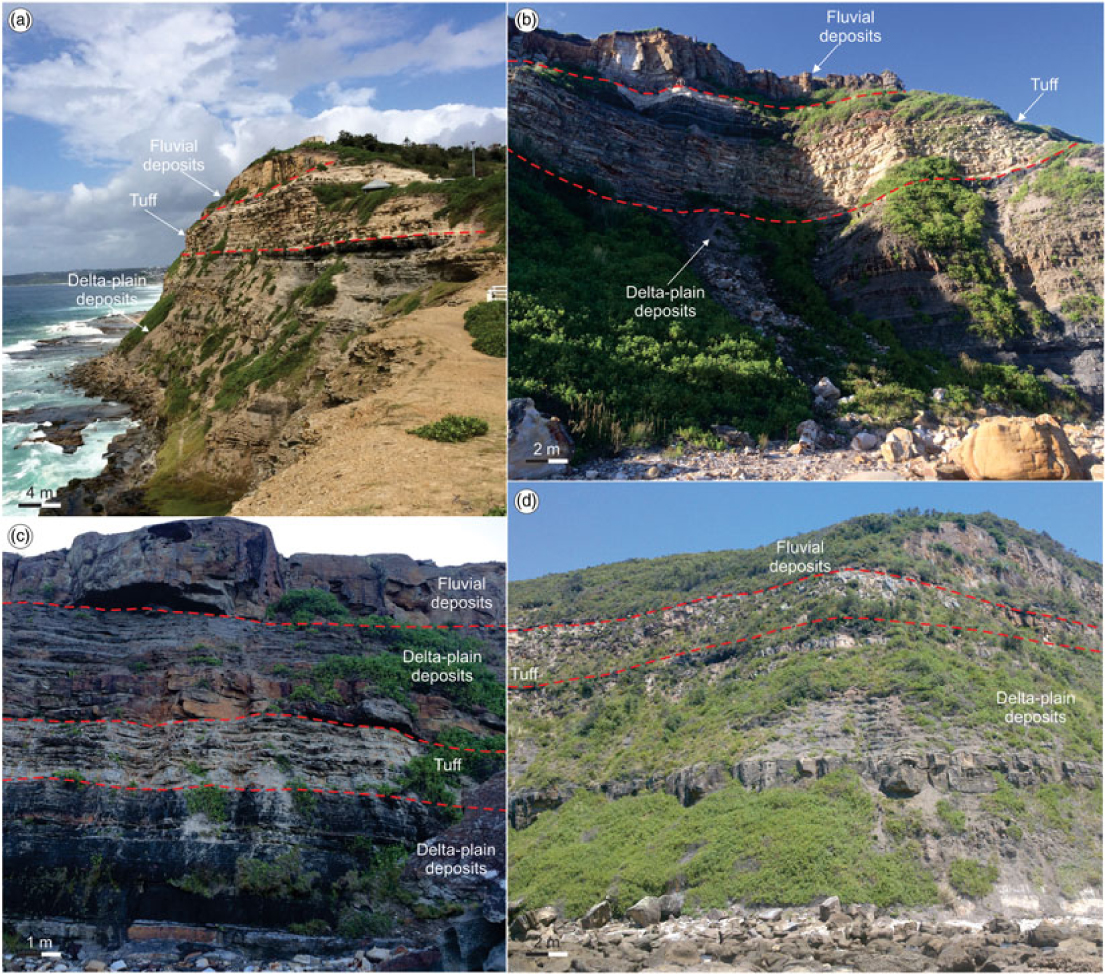
Fig. 18. Outcrop photograph illustrating the stratigraphic evolution and the transition from deltaic to fluvial sedimentation in the NSB. (a) Bar Beach. (b) Merewether Beach. (c) Dudley North. (d) Dudley South. Note the presence of thick and laterally extensive volcaniclastic sediments (tuff) at the boundary between the underlying deltaic and the overlying fluvial deposits.
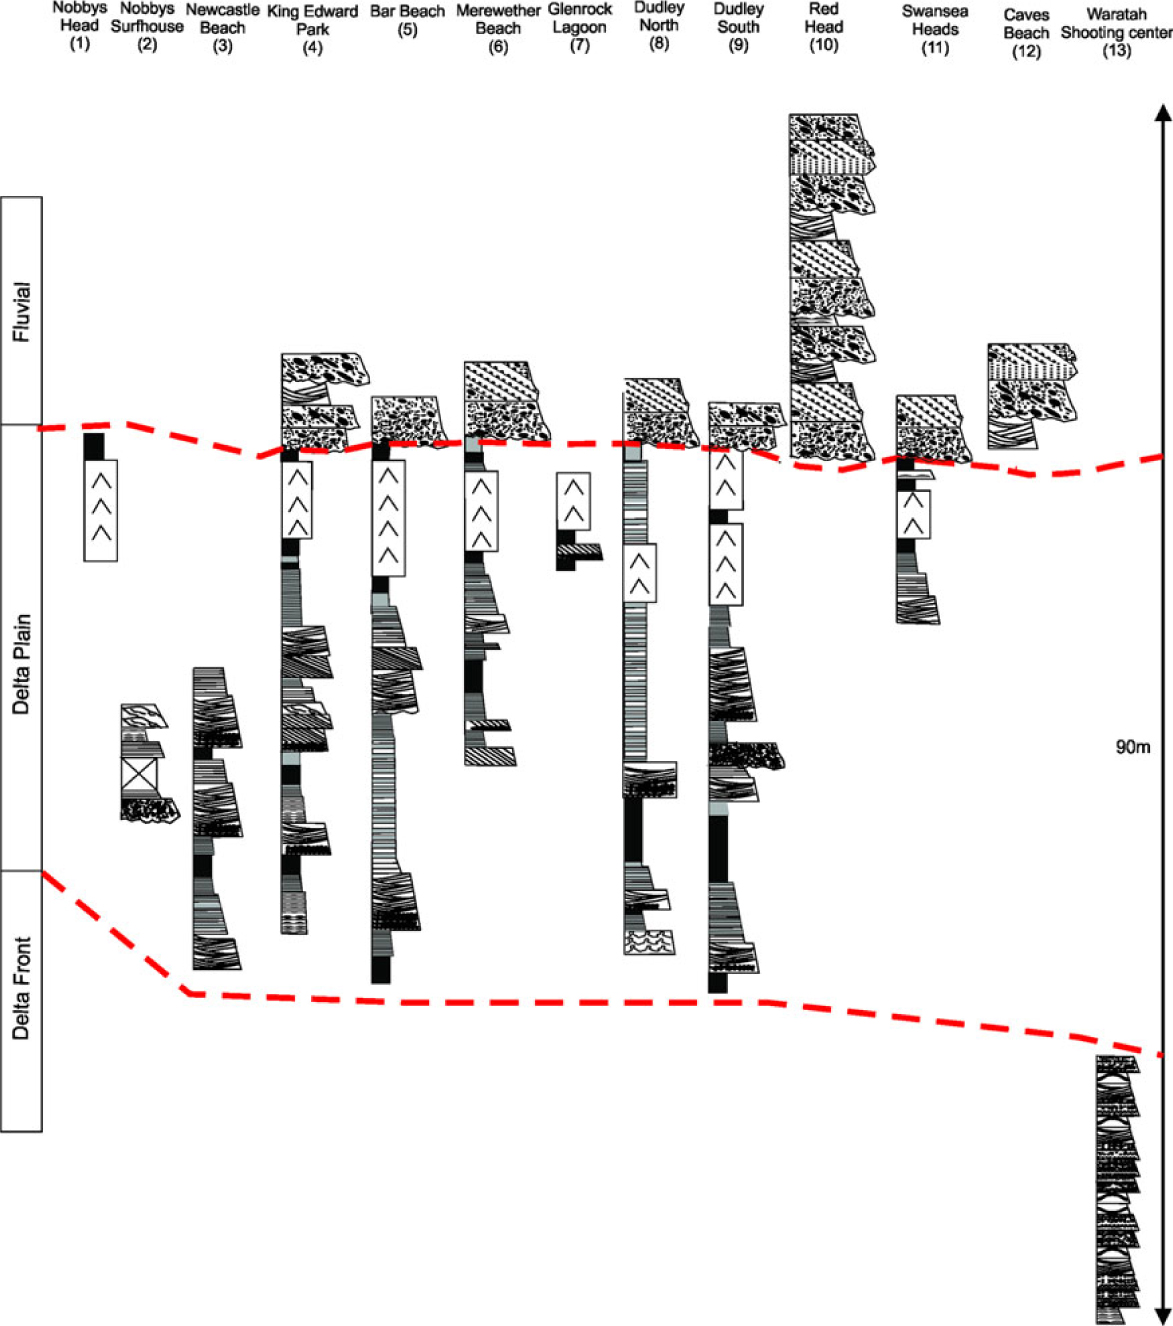
Fig. 19. Synthetic stratigraphic cross-section of the studied region that presents the spatial and temporal evolution of different depositional environments and sub-environments. Note the shoaling-upward trend as documented by the transition of delta-front to tidally influenced delta-plain sediments and finally to fluvial deposits. Red lines indicate interpreted boundaries between depositional settings. See Figure 9 for legend symbols.
In sequence-stratigraphic terms, the progradation and aggradation recorded by the studied deltaic system indicate deposition during a normal regression of the shoreline (Catuneanu, Reference Catuneanu and Montenari2017). The abrupt increase in grain size from the deltaic system to the overlying fluvial system also indicates an increase in topographic gradients and energy levels across the subaerial unconformity, which is typical of the contrast between highstand (lower energy, at the top of a depositional sequence) and lowstand (higher energy, at the base of a depositional sequence) conditions (Catuneanu, Reference Catuneanu2006). Therefore, the deltaic system is interpreted as the foreset (delta front) and the topset (delta plain) of a highstand systems tract, whereas the overlying fluvial system is interpreted as the topset of a lowstand systems tract. The depositional patterns recorded in this case study are similar to the trends documented in other sedimentary basins along the southern margin of Gondwana, during the Permian (Rubidge et al. Reference Rubidge, Hancox and Catuneanu2000).
7. Discussion
7.a. Controls of depositional processes on sedimentation
Tidally influenced regressive, deltaic settings still need further research in order to improve our understanding of their development. Outcrop-based sedimentologic and stratigraphic models are not abundant, but include the Cretaceous Sego Sandstone, Utah, USA (Willis & Gabel, Reference Willis and Gabel2003), the Jurassic Lajas Formation, Argentina (McIlroy et al. Reference McIlroy, Flint, Howell, Timms, Veiga, Spalletti, Howell and Schwarz2005; Rossi & Steel, Reference Rossi and Steel2016), the Devonian Amata and Gauja Formations, Latvia and Estonia (Pontén & Plink-Björklund, Reference Pontén and Plink-Björklund2007; Tänavsuu-Milkeviciene & Plink-Björklund, Reference Tänavsuu-Milkeviciene and Plink-Björklund2009), and the Eocene lower Dir Abu Lifa Member, Western Desert, Egypt (Legler et al. Reference Legler, Johnson, Hampson, Massart, Jackson, Jackson, El-Barkooky and Ravnas2013). In addition, similar settings have been described based on well datasets (Middle Jurassic Bryne Formation, Norwegian North Sea, Mellere et al. Reference Mellere, Mannie, Longhitano, Mazur, Kulausa, Brough, Cotton, Hampson, Reynolds, Kostic and Wells2016).
The sedimentological study presented here indicates an upward shift of the depositional environments and sub-environments from delta-front to delta-plain and fluvial deposits. This trend, in conjunction with the palaeoflow directions, indicates progradation of the fluvio-deltaic system towards the SSE and SSW (Fig. 20). The sedimentary succession reflects the interplay of river, wave and tidal currents. The lowermost delta-front deposits were mainly controlled by wave and storm action, indicated by wave ripples and HCS, with no sedimentological evidence for tidal influence. The overlying delta-plain deposits reflect a change in the dominant processes that controlled deposition. These sediments were impacted by the interaction of river and tidal currents. Sedimentary structures that testify concurrent tidal action include: mud drapes, bidirectional current ripples, tidal bundles, flaser, wavy and lenticular bedding. These structures are abundant in the delta-plain deposits (in both distributary channels and overbanks). River influence is recognized by the abundant wood debris and high degree of internal erosional surfaces. No significant wave influence has been recorded in the studied delta-plain deposits, suggesting weak wave interaction during sediment deposition.
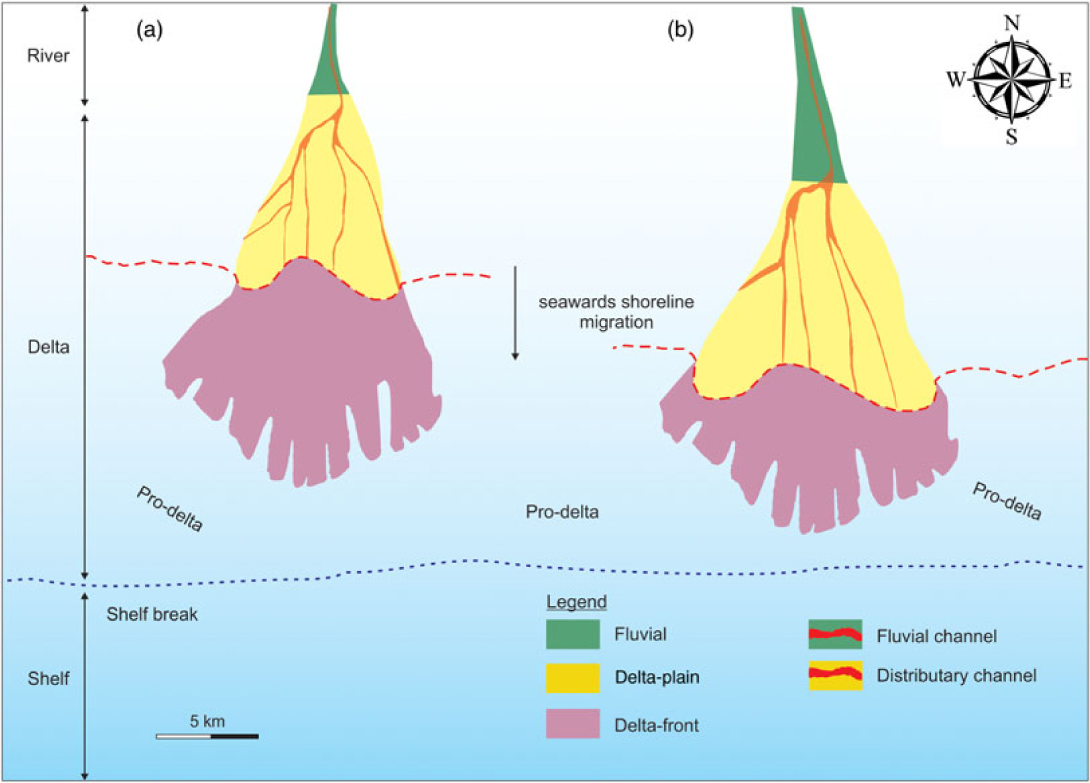
Fig. 20. Schematic block diagram that depicts the evolutionary stages of the deltaic system. Note the progradation of delta-plain deposits over the deeper-positioned delta-front deposits (modified from Chen et al. Reference Chen, Steel, Dixon and Osman2014).
The overlying fluvial deposits display a predominant river influence. This is documented by: (1) the high degree of amalgamation and internal erosional surfaces, (2) the coarse grain size (cobbles and pebbles), (3) the lack of bioturbation, and (4) the abundant plant debris. Sporadic mud drapes may be related to tidal modification of river currents. Nevertheless, the lack of organization in the drapes makes this scenario unlikely (Ichaso & Dalrymple, Reference Ichaso, Dalrymple, Martinius, Ravnas, Howell, Steel and Wonham2014; Rossi & Steel, Reference Rossi and Steel2016). Similar characteristics have been described in the Middle Devonian Gauja Formation in the Baltic Basin, Latvia and Estonia (Pontén & Plink-Björklund, Reference Pontén and Plink-Björklund2007). In the Gauja Formation, tidal and fluvial processes control the sediment accumulation, but the wave influence is of secondary importance. Like the studied NSB succession, the Gauja Formation displays an upwards decrease in tidal influence, and an absence of sedimentary structures that would suggest wave action. These features have been associated with a gradual increase in the fluvial input and with the sufficiently strong tidal currents that were capable of suppressing the wave action (Pontén & Plink-Björklund, Reference Pontén and Plink-Björklund2007).
The tidal to fluvial transition in the Gauja Formation is gradual, with the development of fluvial channels with weak tidal influence that overlie delta-plain deposits. In contrast, in the NSB, delta-plain deposits are overlain by fluvial sediments with no evidence of tidal influence. This trend is interpreted as the result of the sudden increase in river power, associated with tectonic activity and large availability of coarse-grained sediment. This interpretation is compatible with the tectonic history of the NSB, indicating that it was influenced by the Hunter–Bowen Orogeny during the deposition of the sediments (Collins, Reference Collins1991). Similarly, this trend has been observed in the Jurassic Lajas Formation, Argentina, and has been ascribed to high topographic gradients (Rossi & Steel, Reference Rossi and Steel2016).
The relative power of the tidal vs wave vs fluvial currents is the critical factor that controls the delta type (Davis & Hayes, Reference Davis, Hayes, Greenwood and Davis1984; Plink-Björklund, Reference Plink-Björklund2012). The documented upward switch from storm- and/or wave-influenced (delta-front, FA3) to strongly tidally influenced (delta-plain, FA2) sedimentation suggests tidal amplification. The amplification of tidal energy may be related to tectonic, incisional and morphologic constraints (for recent reviews see Goodbred & Saito, Reference Goodbred, Saito, Davis and Dalrymple2012; Plink-Björklund, Reference Plink-Björklund2012). The tectonically active regime of the study region and the absence of evidence of incision (according to the criteria of Boyd et al. Reference Boyd, Dalrymple, Zaitlin, Posamentier and Walker2006) indicate that tectonic confinement controlled the power of tidal currents. The absence of tidal signatures in the delta-front sediments could indicate deposition on a steep delta-front slope, where tidal currents are not usually well developed (Goodbred & Saito, Reference Goodbred, Saito, Davis and Dalrymple2012).
The observed tidal reworking in the studied delta-plain deposits indicates that river power was not strong enough to entirely suppress the tidal current. With fluctuating fluvial input, the tidal effect is recorded as distinct intervals of tidally influenced sediments, with interbeds of thicker fluvial-dominated deposits. The upward decrease in the tidal impact on deposition could be related to regional topography and the long-term progradation of the delta (i.e. the studied sections become more distal relative to the shoreline in the younging direction). High topographic gradients have also been invoked to explain the limited landward penetration of the tidal currents into the fluvial realm in the Jurassic Lajas Formation, Argentina (Rossi & Steel, Reference Rossi and Steel2016). In addition, this trend in the NSB could be the result of local parameters (e.g. sideways limitations in distributary channel mouths) controlling the tidal reworking. Gradual prevalence of fluvial vs tidal processes has also been observed in the Baltic Basin (Tänavsuu-Milkeviciene & Plink-Björklund, Reference Tänavsuu-Milkeviciene and Plink-Björklund2009; Rossi & Steel, Reference Rossi and Steel2016). The sedimentary succession in the Baltic Basin portrays an upwards transition from a tide-dominated delta to a tidally influenced delta, because of the increasing contribution of the river system. The Campanian Chimney Rock Tongue, Western Interior Seaway of Wyoming–Utah, USA, serves as an example of the control of local parameters in the formation of tidally influenced facies (Plink-Björklund, Reference Plink-Björklund, Hampson, Steel, Burgess and Dalrymple2008). In the Chimney Rock Tongue, tidally influenced facies are only recorded in the distributary channel mouths and within some mouth bars, and, in conjunction with the change in the style of mouth bars within the deltaic system, indicate that the tidal reworking was controlled by local conditions.
7.b. Sequence stratigraphy, and tectonic controls on sedimentation
Sequence stratigraphy is a powerful tool that aids in understanding the evolution of sedimentary basins (Cantalamessa et al. Reference Cantalamessa, Di Celma, Ragaini, Valleri and Landini2007; Rodríguez-Tovar et al. Reference Rodríguez-Tovar, Pèrez-Valera and Pèez-López2007; Catuneanu et al. Reference Catuneanu, Abreu, Bhattacharya, Blum, Dalrymple, Eriksson, Fielding, Fisher, Galloway, Gibling, Giles, Holbrook, Jordan, Kendall, Macurda, Martinsen, Miall, Neal, Nummedal, Pomar, Posamentier, Pratt, Sarg, Shanley, Steel, Strasser, Tucker and Winker2009, Reference Catuneanu, Galloway, Kendall, Miall, Posamentier, Strasser and Tucker2011; Di Celma et al. Reference Di Celma, Cantalamessa, Landini and Ragaini2010; Zecchin et al. Reference Zecchin, Civile, Caffau, Sturiale and Roda2011; Eriksson et al. Reference Eriksson, Banerjee, Catuneanu, Corcoran, Eriksson, Hiatt, Laflamme, Lenhardt, Long, Miall, Mints, Pufahl, Sarkar, Simpson and Williams2013; Maravelis et al. Reference Maravelis, Catuneanu, Nordsvan, Landenberger and Zelilidis2018) and also has valuable implications for the industry (De Gasperi & Catuneanu, Reference De Gasperi and Catuneanu2014; Zecchin & Catuneanu, Reference Zecchin and Catuneanu2015). The interpretation of systems tracts relies on the observation of stratal stacking patterns, the nature of the bounding surfaces and the relationship with the adjacent stratigraphic units (Catuneanu, Reference Catuneanu and Montenari2017).
The observed progradation and aggradation of the deltaic system suggest deposition during a normal regression of the shoreline. Normal regressions can be associated with either lowstand or highstand systems tracts (LST and HST respectively), and the lowstand vs highstand interpretation is most reliably based on the underlying stacking pattern: a normal regression that follows a forced regression belongs to the LST, whereas a normal regression that follows a transgression belongs to the HST (Catuneanu, Reference Catuneanu and Montenari2017). In this case study, the underlying stacking pattern is not exposed. Further subsurface work is required for an unequivocal interpretation of systems tracts. However, the abrupt increase in grain size and energy levels across the subaerial unconformity, from the deltaic system to the overlying fluvial system, fits the common vertical trends of depositional sequences, where accumulation is typically accompanied by a decrease in energy levels and grain size from base to top. Consequently, the finer-grained deltaic system below the depositional sequence boundary can be interpreted as a highstand systems tract, whereas the coarser-grained fluvial system above the depositional sequence boundary can be interpreted as a lowstand systems tract. Both lowstand and highstand systems tracts indicate deposition during relative sea-level rise, whereas the intervening subaerial unconformity is interpreted to have formed during a stage of relative sea-level fall.
The subaerial unconformity (SU) is typified by channelized truncations of the underlying deltaic deposits by fluvial erosion (Fig. 21). In this case, the fluvial system is not genetically related to the underlying deltaic system; i.e. they belong to different accommodation cycles. The delta-front deposits correspond to the foresets and the delta-plain deposits to the topsets of the HST. Given the progradation of the deltaic system, it is inferred that the delta-front sediments could overlie pro-delta deposits. In this scenario, these pro-delta deposits would represent the bottom sets of the HST. Further subsurface work is required to establish the stacking pattern of the deposits that underlie the observed sections presented in this paper. This will afford a more precise reconstruction of the sequence-stratigraphic framework. The erosional character of the SU indicates reworking by the overlying high-energy fluvial system that belongs to the LST. This system is interpreted as the product of deposition in braided rivers and relates to the steepening of topographic gradients, which accompanied the uplift of the New England Orogen.
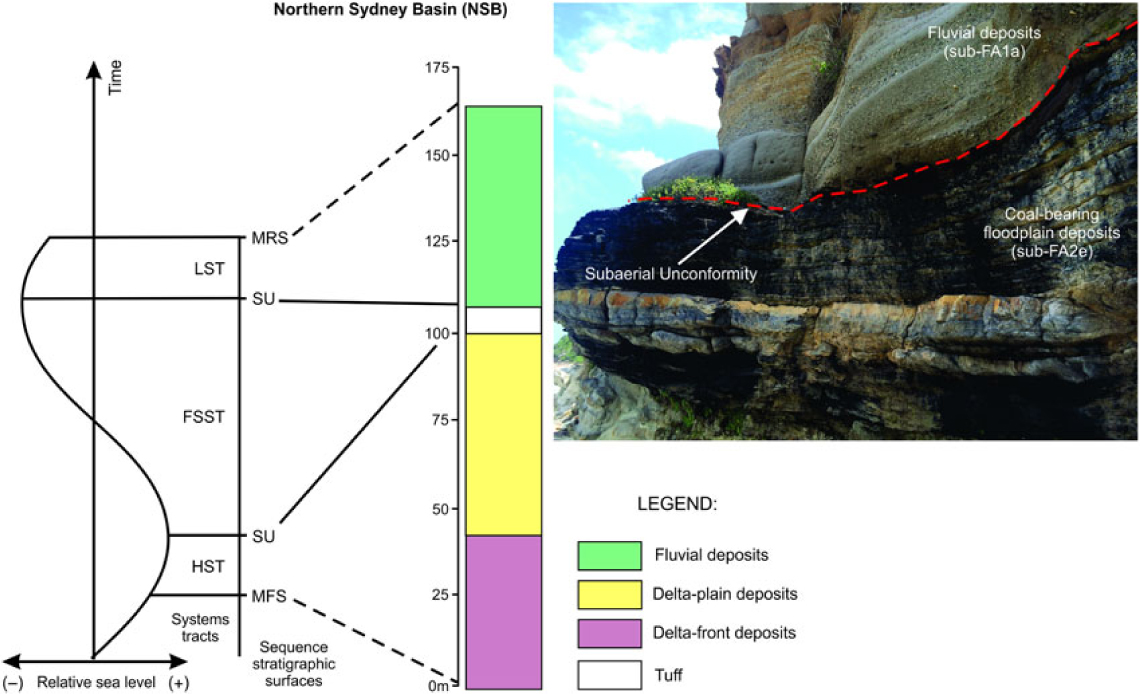
Fig. 21. Sequence-stratigraphic framework for the Northern Sydney Basin. Note the (1) long-term (second-order) shoaling-upward trend from delta-front to fluvial sediments, and (2) interpretation of the depositional facies in terms of third-order systems tracts. Dashed lines represent inferred sequence-stratigraphic surfaces; MFS = maximum flooding surface; MRS = maximum regressive surface; SU = subaerial unconformity; HST = highstand systems tract; LST = lowstand systems tract; FSST = falling stage systems tract.
In an alternative sequence-stratigraphic interpretation, the delta front deposits (FA3) could be attributed to highstand (HST) and/or falling-stage (FSST) systems tracts, and the overlying delta plain sediments (FA2) to a lowstand (LST) systems tract. This interpretation could explain the switch from wave/storm- and river-influenced sedimentation in the delta front to the tide-influenced sedimentation in the delta plain. However, this alternative interpretation would require another subaerial unconformity between the delta front (FA3) and the delta plain (FA2), which has not been observed in the field. In the absence of field evidence to support a more complicated sequence-stratigraphic interpretation, the simpler interpretation is favoured in this paper, which assigns both FA3 and FA2 to one HST delta. The tidal amplification noted from FA3 to FA2 can be attributed to various factors, including: (1) FA3 is only exposed at one outcrop, where no evidence of tidal currents has been observed; however, the potential tidal influence in FA3 cannot be ruled out; (2) ‘hyper-synchronous’ conditions (sensu Dalrymple & Choi, Reference Dalrymple and Choi2007) can explain an increase in the tidal range and current velocities from delta front to delta plain sub-environments (see also earlier discussion).
The grain size and nature (the relative contribution of rivers, waves/storms and tides) of the tidally influenced deltaic systems are associated with tectonic, sedimentary and topographic parameters that in turn control the sediment calibre and availability, as well as the effectiveness, of the depositional process. The studied succession offers a rare example of a sand-rich, regressive fluvio-deltaic system, developed adjacent to tectonically active mountains (New England Orogen). In contrast to most of the modern examples of such systems that are mud-rich (Rossi & Steel, Reference Rossi and Steel2016), the studied system is coarser-grained and dominated by gravel- (FA1) and sand-rich deposits (FA2 and FA3). This could be associated with the proximity of the source area, and the possible steep gradients of the inherited topography. These features, in association with the abundance of coarse-grained sediment, could also explain the switch from storm-influenced (FA3) to tidally influenced (FA2) sedimentation, and the absence of landward penetration of the tidal currents into the fluvial realm. The Jurassic Lajas Formation, Argentina, offers another example of a sand-rich fluvio-deltaic system, with abrupt termination of tidal influence at the delta-plain/fluvial boundary. The development of this system has also been associated to the great proximity of the source region and the steep topographic gradients (Rossi & Steel, Reference Rossi and Steel2016). It is possible that the fluvio-deltaic system is larger, and that the systems recognized in the study area were in fact different distributary channels of the same river system, transformed by regional-scale tectonic elements.
The main regional tectonic element is the NW–SE-oriented Peel–Manning Fault (Collins, Reference Collins1991, fig. 1). The Peel–Manning Fault System corresponds to a major arcuate zone that is composed of serpentinite and mylonite. The fault system extends northward beyond the Queensland border, where it is covered by Mesozoic sediments. This fault system has a complex tectonic history, possibly dating from the Cambrian, and has kinematic elements including thrust, dextral strike-slip and sinistral strike-slip. Most of the later movement is strike-slip (Offler & Hand, Reference Offler, Hand and Kleeman1988), associated with E–W shortening during uplift of the New England Orogen (Collins, Reference Collins1991). Major Permian movement on the Peel–Manning Fault System might be recorded by the 280–275 Ma (Lanphere & Hockley, Reference Lanphere and Hockley1976), whereas the youngest movement of the Peel–Manning Fault System is thought to take place at 248 Ma (Cooper et al. Reference Cooper, Richards and Webb1963). These geochronological constraints indicate that the Peel–Manning Fault System was active during the deposition of the studied succession. The entire orogenic cycle, starting with folding in the Middle to Late Permian and terminating with dispersal of tectonostratigraphic blocks in the Late Permian – Early Triassic (Collins, Reference Collins1991), allowed a large amount of coarse-grained material, from the rapidly uplifting source area (New England Orogen), to be made available for sedimentation in the SB (the Permo-Triassic megacycle of Conaghan et al. Reference Conaghan, Jones, McDonnell and Rouce1982). The palaeocurrent indicators exhibit a SE- to SW-directed transport direction and indicate a NW- to NE-positioned sediment source (Fig. 20). These data suggest sediment transport directions that are either parallel or perpendicular to the Peel–Manning Fault System. In particular, the stratigraphically lower delta-plain deposits display a S, SE (axial) transport pathway, whereas the overlying fluvial sediments exhibit a mostly SW (transverse) palaeoflow pattern. This axial transport could be related to the growth of a fluvio-deltaic drainage divide, probably controlled by surface uplift along the eastern edge of the Peel–Manning Fault System. The transverse-flowing systems are interpreted as fluvial transport transverse to the evolving deformation front. Similar features have been described in the Jurassic Lajas Formation, Argentina. The lowermost parts of the formation display a palaeoflow trend parallel to the fault and/or fold element that becomes perpendicular up-sequence, indicating the contribution of this tectonic element on the development of the depositional systems (Rossi & Steel, Reference Rossi and Steel2016).
8. Conclusions
This outcrop-based integrated investigation of facies, sequence-stratigraphic and palaeoflow analysis applied to the studied Upper Permian sedimentary succession provides valuable information about the syn-depositional conditions in the NSB, SE Australia, including: (1) the spatial and temporal distribution of the depositional environments; (2) the dominant physical processes of deposition; and (3) palaeoenvironmental evolution, as inferred from the observed sedimentologic and stratigraphic features.
The studied succession includes 15 depositional facies (F1–F15) that are grouped into three facies associations (FA1–FA3). In addition, FA1 and FA2 are further subdivided into different sub-facies associations (sub-FA1a and sub-FA1b, and sub-FA2a to sub-FA2f). This grouping of facies and sub-facies associations reflects variations in the dominant physical process and represents delta-front, delta-plain and fluvial settings.
The progradation and aggradation of the deltaic system is supported by the following evidence: (1) the depositional trend associated with an overall shallowing-upward succession; this succession evolves from delta-front to delta-plain deposits; (2) the coarsening-upward trend; (3) the architectural relations that document delta-plain distributary channel-fill successions dominated by lateral accretion elements, overlain by fluvial channels dominated by downcurrent accretion elements; and (4) the lack of any upward-deepening successions.
The contribution of wave, tidal and fluvial currents is variable in the different environments and sub-environments. The delta-front deposits are wave/storm-influenced. The delta-plain sediments are influenced by tidal currents, but their deposition was mainly controlled by fluvial action. The delta-plain deposits record an upward increase in the fluvial energy, and an associated decrease in the frequency and diversity of sedimentary structures that indicate tidal influence. This may relate to an increase with time in (1) topographic gradients and fluvial energy, and/or (2) the distance between the location of the studied sections and the prograding shoreline. The overlying fluvial sediments are not affected by tides, and the river power is the dominant process that controls deposition. This upward decrease of wave and tidal reworking and the predominance of river processes can be ascribed to steep topographic gradients and large availability of coarse-grained sediment, as a result of uplift during active tectonism in the New England Orogen.
The unconformable stratigraphic relationship of the fluvial sediments with the underlying deltaic deposits indicates that these units are not genetically related. The deltaic system is interpreted as the foreset (delta front) and the topset (delta plain) of a highstand systems tract, whereas the overlying fluvial system is interpreted as the topset of a lowstand systems tract. Both systems tracts document deposition during relative sea-level rise. Their contact is a subaerial unconformity, interpreted to correspond to a period of relative sea-level fall in the NSB.
Palaeocurrent data from different stratigraphic levels of the studied succession indicate a trend that is initially parallel to the main structural element (New England Orogen). Up-sequence, the palaeodispersal trend becomes perpendicular to the structural high, indicating an influence of this tectonic element on sedimentation.
Author ORCIDs
Angelos G. Maravelis 0000-0002-9694-7500
Acknowledgements
This investigation was sponsored by the Geological Survey of New South Wales (GSNSW), through the research project ‘Stratigraphic Correlation: Nobbys Tuff-Althorpe Claystone (Kevin Ruming)’. Bulga Coal is thanked for allowing access to the open cut pit and facilitating the collection of field data. The authors acknowledge the journal editor Stephen Hubbard, the journal reviewer Don I. Cummings and two anonymous reviewers for their constructive reviews that improved the manuscript. The authors thank Donatella Mellere for the thorough editing and valuable discussions that improved a previous draft of this research. Our colleagues Alexandra Scott and Sean Melehan are acknowledged for their valuable contribution during several field excursions.


