1. Introduction
The Taklimakan Desert is the second largest sand desert in the world with an area of 337,000 km2 (Zhu et al. Reference Zhu, Wu, Liu and Di1980). Active sand dunes of the Taklimakan Desert occupy 85 % of the Tarim Basin and are surrounded by a nearly continuous belt of amalgamated alluvial fans that is over 100 km wide and is covered with gravel deserts called ‘gobi’ (Fig. 1). The alluvial fans develop at the foot of the Tian Shan Mountains to the north, the Kunlun and Altyn mountains to the south and the Pamir Plateau to the west, and are composed of coarse detrital material supplied from these mountains by rivers running through them.

Fig. 1. A geological map of the Tarim Basin and surrounding area with sampling localities and sample numbers (smaller characters). Solid to half-tone-filled symbols represent river sediments with the different shapes of the symbols representing the different types of depositional setting and the different tones representing the different drainage areas. Larger and bolder dark grey numbers represent rivers cited in the text. 1 – Gez River; 2 – Yarkand River; 3 – Yechen River; 4 – Pishan River; 5 – Karakashi River; 6 – Hotan River; 7 – Cele River; 8 – Keriya River; 9 – Niya River; 10 – Qarqan River; 11 – Washisha River; 12 – Konche River; 13 – Weigan River; 14 – Aksu River; 15 – Tarim River; 16 – Kashgar River. Open squares represent sampling sites of dry lake sediments and open circles represent ‘mountain loess’ sample localities.
The Taklimakan Desert is a mid-latitude desert located at around 40° N. During late spring, the subtropical westerly jet jumps to the north of the Tibetan Plateau over the Taklimakan Desert and stays there until early autumn (Liang & Wang, Reference Liang and Wang1998; Schiemann et al. Reference Schiemann, Ruthi and Schar2009). The Tibetan Low develops on the plateau during this period, and the atmospheric pressure gradient generates strong northerly winds blowing towards the Kunlun Mountains on the northern edge of the Tibetan Plateau that lift up dust emitted from the Tarim Basin to an elevation in excess of 5000 m (Sun, Reference Sun2002; Yumimoto et al. 2009, Reference Yumimoto, Eguchi, Uno, Takemura, Liu, Shimizu, Sugimoto and Strawbridge2010). There, the dust is entrained in the subtropical westerly jet and transported long distances to the central Pacific, and even to Greenland (Rea et al. Reference Rea, Snoeckx and Joseph1998; Bory et al. Reference Bory, Biscaye and Grousset2003; Ruth et al. Reference Ruth, Bigler, Rothlisberger, Siggaard-Andersen, Kipfstuhl, Goto-Azuma, Hansson, Johnsen, Lu and Steffensen2007; Uno et al. Reference Uno, Eguchi, Yumimoto, Takemura, Shimizu, Uematsu, Liu, Wang, Hara and Sugimoto2009). Because of these unique topographical–climatological settings, the Taklimakan Desert is considered to be one of the main sources of fine-grained aeolian dust in the northern hemisphere at present (Zhang et al. Reference Zhang, Gong, Arimoto, Shen, Mei, Wang and Cheng2003; Sun et al. Reference Sun, Zhu and Bowler2004; Uno et al. Reference Uno, Eguchi, Yumimoto, Takemura, Shimizu, Uematsu, Liu, Wang, Hara and Sugimoto2009). However, dune sands of the Taklimakan Desert contain only a small quantity of fine particles that are capable of long-distance transportation by wind. In contrast, wadi (dry riverbed) and dry lake sediments contain abundant fine particles (Honda & Shimizu, Reference Honda and Shimizu1998). Thus, it is considered that the main area of emission of aeolian dust in the Tarim Basin is not the sand desert but the gobi and wadi developed on the alluvial fans that fringe the basin, as well as dry lakes developed on the outer margin of the alluvial fans and lowland area in the northeastern part of the basin (Honda & Shimizu, Reference Honda and Shimizu1998; Mikami et al. Reference Mikami, Yamada, Ishizuka, Ishimaru, Gao and Zeng2005). However, provenance studies of the fine (< 16 μm) fraction of the gobi and wadi sediments, which can be transported long distances by wind, have never been conducted, because no data are available that characterize the fine detrital materials supplied to the Tarim Basin.
The Tarim Basin is surrounded by high-altitude mountain chains, and only the northeastern part of the basin is open and connected to the arid area in central China, such as the Gobi Desert. It is thought that sand particles in the Tarim Basin are delivered from the surrounding mountains by rivers based on a comparison of the mineral composition and Re–Os isotope ratio of river sediments derived from the surrounding mountains and desert sands close to the rivers (Honda & Shimizu, Reference Honda and Shimizu1998; Hattori et al. Reference Hattori, Suzuki, Honda and Shimizu2003). Also, detrital materials delivered to the Tarim Basin from the surrounding mountains are interpreted to have been homogenized by wind processes within the basin (Ishii et al. Reference Ishii, Isobe, Mizota, Kanai, Matsuhisa, Mizota, Qian, Terashima and Okumura1995; Honda & Shimizu, Reference Honda and Shimizu1998; Zheng, Reference Zheng2016). However, these previous studies focused only on the rivers from the Kunlun Mountains and did not demonstrate what kind of wind process was operating in the basin and how detrital materials delivered from the surrounding mountains are mixed. Recently, Rittner et al. (Reference Rittner, Vermeesch, Cartera, Bird, Stevens, Garzanti, Andò, Vezzoli, Dutt, Xu and Lu2016) examined the provenance of Taklimakan desert sand and concluded that the dune sands are dominantly derived from southern and southwestern sources. However, they did not explore the origin and transportation mechanism of the fine silt fraction that corresponds to the dust grain size.
Thus, it is not clear what characteristics aeolian dust emitted from the Tarim Basin has, and how homogeneous the aeolian dust within the basin is. It is also not certain where and how source materials for the aeolian dust are generated, and through what processes the dust is emitted from the basin. To answer these questions, it is necessary to understand the erosion–transportation–deposition processes of the fine detrital materials within the Tarim Basin.
In this study, we focused on quartz and examined the electron spin resonance (ESR) signal intensity of the E1’ centre (an unpaired electron at an oxygen vacancy), hereafter called ESR signal intensity, and crystallinity index (CI) for river sediments derived from the Kunlun and Altyn mountains, Pamir Plateau and Tian Shan Mountains, and dry lake sediments in the northeastern part of the basin and mountain loess accumulated on the northern slope of the Kunlun and Altyn mountains in order to estimate the origin and generation process of the aeolian dust emitted from the Tarim Basin. We focused on quartz because it is the major component of aeolian dust and resistant to chemical and physical weathering. We used the ESR signal intensity and CI of quartz as provenance parameters for the aeolian dust (Ono et al. Reference Ono, Naruse, Ikeya, Kohno and Toyoda1998; Toyoda & Naruse, Reference Toyoda and Naruse2002; Nagashima et al. Reference Nagashima, Tada, Tani, Toyoda, Sun and Isozaki2007, Reference Nagashima, Tada, Tani, Sun, Isozaki, Toyoda and Hasegawa2011, Reference Nagashima, Tada and Toyoda2013; Sun et al. Reference Sun, Tada, Chen, Chen, Toyoda, Tani, Isozaki, Nagashima, Hasegawa and Ji2007, Reference Sun, Tada, Chen, Liu, Toyoda, Tani, Ji and Isozaki2008; Ma et al. Reference Ma, Sun, Tada, Yan, Chen, Lin and Nagashima2015). We separated the detrital materials into coarse (> 64 µm) and fine (< 16 µm) fractions for the sediments described above and analysed the ESR signal intensity and CI of quartz in each fraction to investigate the recycling and homogenizing processes of fine detrital material in the Tarim Basin.
2. Materials
2.a. Sampling locality
In order to collect basic data for the provenance study of the aeolian dust, we analysed 32 surface sediment samples that included 24 river sediment, 4 dry lake sediment and 4 mountain loess samples, whose sampling locations are shown in Figure 1 and Table 1. River samples were taken from the major rivers flowing into the Tarim Basin, and most were collected at locations where the highway around the Taklimakan Desert crosses the rivers. We also took river samples along the Gez and Yarkand rivers that run through the mountainous area between the westernmost part of the Kunlun Mountains and the Pamir Plateau (Fig. 1). Dry lake samples are mud samples obtained from dry lakes in the northeastern part of the basin. Mountain loess samples, which are considered to have been derived from the Tarim Basin (Fang et al. Reference Fang, Lu, Yang, Li, An, Jiang and Chen2002), were taken at the Yecheng and Aqqan sections that are located at the foot of the western and central parts of the Kunlun Mountains (Fig. 1).
Table 1. List of samples analysed in this study and their ESR and CI analysis results for the coarse and fine fractions

2.b. Field occurrence of river samples
In this study, we divided the drainage areas of the studied rivers into the following five regions: the central part of the Tian Shan Mountains, the western part of the Tian Shan Mountains, the westernmost part of the Kunlun Mountains and Pamir Plateau, the western part of the Kunlun Mountains, and the eastern part of the Kunlun Mountains, based on the difference in tectonic setting and estimated relative contribution of older basement rocks (Fig. 1; Table 1). We also classified the river sediments into the following four types based on their depositional settings, considering the degree to which the drainage area of the river upstream of the sampling site is protected from aeolian input by high mountains (Table 1).
2.b.1. High Mountain (HM) type: sediments of the mountainous rivers
Samples of this type were taken from rivers flowing through high mountains in excess of 5000 m height, such as the Gez River and upper reaches of the Yarkand River, which are annual rivers flowing between the westernmost Kunlun and Pamir Plateau (and Karakorum Mountains) (Fig. 1; Table 1). The widths of the rivers are several metres, and the riverbed and riverbank sediments are characterized by boulders (Fig. 2a). The drainage areas of the Gez River and the upper reaches of the Yarkand River are in the westernmost part of the Kunlun Mountains and Pamir Plateau, which are located in the downwind direction of the Tarim Basin. The human influence on the samples is minimal considering the remoteness of the sampling sites. Samples were taken at altitudes in excess of 3000 m, except for samples Tak06-25 (2309 m) and Tak06-26 (1803 m).

Fig. 2. Field photographs of typical depositional settings of the sediments used in this study. (a) Photograph of the HM type sampling site of TS07-04 in the upper reaches of the Yarkand River surrounded by high mountains. (b) Photograph of the UAF type sampling site of Tak06-37 in the upper part of the alluvial fan of the Weigan River. (c) Photograph of the LAF-A type sampling site of TK07-91 in the lower part of the alluvial fan of the Yarkand River. (d) Photograph of the LAF-F type sampling site of TK07-115 in the lower part of the alluvial fan of the Washisha River. (e) Photograph of the dry lake sediment sampling site of TK07-119 in the northeastern part of the Tarim Basin. (f) Photograph of the ‘mountain loess’ sediment sampling site of YC06-73AB at the Yecheng section.
2.b.2. Upper Alluvial Fan (UAF) type: sediments from the upper part of alluvial fans
Samples of this type were taken from the upper part of alluvial fans of rivers flowing into the Tarim Basin, which include the Kashgar River from the Pamir Plateau through the western part of the Tian Shan Mountains, the Aksu River from the western part of the Tian Shan Mountains, the Weigan River from the central part of the Tian Shan Mountains, the ‘Yecheng’ River (a tentative name) from the western part of the Kunlun Mountains, and the Keriya River from the eastern part of the Kunlun Mountains (Fig. 1; Table 1). Among these rivers, the Kashgar, Weigan and Keriya rivers are annual rivers. In the upper part of alluvial fans, the widths of the rivers are a few tens of metres; a natural bank has developed along the rivers and the meander of the rivers is not significant. Pebbles and sands accumulate on the riverbeds and riverbanks (Fig. 2b). Among the sampled rivers, the ‘Yecheng’ River and the Keriya River are located in the leeward of the surface wind direction in the basin, whereas the other rivers were located in the windward of the surface wind in the basin. Some of samples from the Kashgar, Aksu and Weigan rivers could be influenced by human activities such as agriculture and road construction, although we tried to take samples from locations with minimal influences.
2.b.3. Lower Alluvial Fan (LAF)-A type: sediments from the lower part of alluvial fans of rivers draining from the axial part of the mountains
Samples of this type were taken from the lower part of alluvial fans of rivers draining from the axial part of mountains surrounding the Tarim Basin, which include the Yarkand and Karakashi rivers from the western part of the Kunlun Mountains, and the Qarqan River from the eastern part of the Kunlun Mountains (Fig. 1; Table 1). In the lower part of the alluvial fans of these rivers, the widths of the rivers are several tens to over a hundred metres, and show a gentle meandering. Pebbles and sands accumulate on the riverbeds and the riverbanks (Fig. 2c). All the samples of this type were taken from rivers located in the leeward of the dominant surface wind in the basin. Some of the samples from the Yarkand River, the Karakashi River and the Qarqan River could have been influenced by human activities, although we tried to take samples from locations with minimal influences.
2.b.4. Lower Alluvial Fan (LAF)-F type: sediments from the lower part of alluvial fans draining from the frontal hills of the Kunlun Mountains
Samples of this type were taken from the lower part of alluvial fans of rivers draining from the frontal hills of the Kunlun Mountains. Thus, all of this sample type were taken from rivers in the leeward of the surface wind in the basin. Sampled rivers include the Cele River, the Niya River and small rivers tentatively named the ‘Pishan’, ‘Yecheng’ and ‘Washisha’ rivers in this study after the names of the nearest towns (Fig. 1; Table 1). In the lower parts of the alluvial fans of these rivers, the widths of the rivers are ten to a few tens of metres, and show meanders in short wavelengths and are braided in parts. Sands and muds are dominant components of the sediments on the riverbeds and riverbanks (Fig. 2d).
2.c. Field occurrence of other samples
2.c.1. Surface sediments of dry lakes in the northeastern part of the basin
Samples were taken from dry lakes in the northeastern part of the Tarim Basin. The Tarim River, the Qarqan River and the Konche River converge and terminate in the easternmost part of the Tarim Basin. The downstream parts of these rivers are seasonal rivers, and large swamps are formed in the northeastern part of the basin when the river discharge increases. Samples were taken from mud cracks of dry lakes in the northeastern part of the basin at 50 km intervals along the road and within 1 km from the road (Fig. 2e).
2.c.2. Mountain loess
An aeolian deposit called ‘mountain loess’ is widely distributed on the northern slopes of the Kunlun and southwestern part of the Tian Shan mountains (Sun, Reference Sun2002). The mountain loess deposit is distributed to an altitude of up to 5300 m in the Kunlun Mountains, and its maximum thickness is over 100 m (Fig. 2f) (Sun, Reference Sun2002). Samples were taken from the surface of the mountain loess at Yecheng and Aqqan located on the northern foot of the Kunlun Mountains with altitudes in excess of 2000 m (Fig. 1).
3. Analytical methods
In order to characterize the source areas of the detrital materials, we analysed the ESR signal intensity and CI of quartz in surface sediments of the Tarim Basin. The ESR signal intensity of quartz reflects the age of the host rock (Toyoda & Hattori, Reference Toyoda and Hattori2000), whereas CI is controlled by the temperature and speed of crystallization of quartz (Murata & Norman, Reference Murata and Norman1976), thus reflecting the types of host rocks. These two parameters are independent of each other. Therefore, it is expected that the characterization of quartz using these two parameters will allow us to specify its source more reliably than by using a single parameter.
In order to evaluate the contribution of aeolian dust to the river sediments, river samples were analysed for their fine fractions, which are capable of long-distance transportation by wind, and compared with their coarse fractions, which are considered to have been derived from basement rocks exposed in the drainage area of each river, because this size fraction cannot be transported a long distance by wind (Rittner et al. Reference Rittner, Vermeesch, Cartera, Bird, Stevens, Garzanti, Andò, Vezzoli, Dutt, Xu and Lu2016). Samples from the dry lakes and mountain loess were analysed only for their fine fractions, because these samples do not contain sufficient coarse fractions.
3.a. Sample preparation
Prior to the analysis of ESR signal intensity and CI, samples were pretreated to remove organic matter, carbonate and Fe and Mn oxides using the following method modified from Rea & Janecek (Reference Rea, Janecek, Thiede, Vallier, Adelseck, Boersma, Čepek, Dean, Fujii, Koporulin, Rea, Sancetta, Sayre, Seifert, Schaaf, Schmidt, Windom and Vincent1981). First, 50 ml of 20 % CH3COOH was added to c. 150 mg of sample and kept for 8 hours at room temperature with occasional mixing to remove the carbonate. Next, the sample was heated at 80 °C in solution with 40 ml Na3C6H5O7 (0.3 mol/l), 5 ml NaHCO3 (1 mol/l) and 3 g of Na2S2O4 for ∼8 hours to remove Fe and Mg oxides. Finally, the sample was heated at 60 °C with 50 ml of 20 % H2O2 for 4 to 8 hours, until bubbling stopped, so as to remove organic matter. After every step, each sample was washed with distilled water and centrifuged twice. After these chemical pretreatments, the fine (< 16 μm) fraction was separated from the sample by the pipette method (Lerman et al. Reference Lerman, Lal, Dacey and Gibbs1974), and then the coarse (> 64 μm) fraction was sieved out from the residue. Finally, these two fractions were dried at 50 °C.
3.b. ESR signal intensity of quartz
The E1’ centre is an oxygen vacancy with an unpaired electron in quartz, and is created by internal alpha and alpha recoil particles (Rink et al. Reference Rink, Toyoda, Rees-Jones and Schwarcz1999) and external beta and gamma rays, and it increases with age (Toyoda & Hattori, Reference Toyoda and Hattori2000). Therefore, the ESR signal intensity of quartz reflects the age of the host rocks (Toyoda & Hattori, Reference Toyoda and Hattori2000). It should be noted that the ESR signal intensity of quartz is reset at a temperature of > 400 °C in laboratory experiments (S. Toyoda, unpub. Ph.D. thesis, Osaka Univ., 1992) and could be reset at a temperature as low as 200 °C in the burial process where exposure to the higher temperature should have lasted for more than a million years (Toyoda & Ikeya, Reference Toyoda and Ikeya1991).
We estimated the number of oxygen vacancies in quartz by the ESR signal intensity. Prior to the ESR signal intensity analysis, samples were irradiated with gamma-rays to a total dose of 2.5 kGy using a 60Co source at Takasaki Advanced Radiation Research Institute, Japan Atomic Energy Agency. Samples were then heated at 300 °C for 15 minutes to convert the oxygen vacancies to E1’ centres (Toyoda & Ikeya, Reference Toyoda and Ikeya1991). ESR signal intensity measurements were conducted at room temperature using an X-band ESR spectrometer (JEOL, PX-2300) at the Okayama University of Science with 0.01 mW of microwave power, 0.1 mT magnetic field modulation (100 kHz), a 5 mT scan range, 2 minute scan time and 0.03 second time constant (Nagashima et al. Reference Nagashima, Tada, Tani, Toyoda, Sun and Isozaki2007; Sun et al. Reference Sun, Tada, Chen, Chen, Toyoda, Tani, Isozaki, Nagashima, Hasegawa and Ji2007). The ESR signal intensity for a sample was normalized by quartz content to calculate the ESR signal intensity of pure quartz. ESR signal intensity was expressed in spin units, where one spin unit is equivalent to 1.3 × 10¹⁵ spins g−1 (Toyoda & Naruse, Reference Toyoda and Naruse2002). Reproducibility of the ESR signal intensity measurement was better than ± 0.9 spin units.
3.c. Crystallinity index of quartz
The CI of quartz was measured with an X-ray diffractometer (X’Pert Pro, PANalytical) with a Cu target at the University of Tokyo. The measurement conditions were a tube voltage of 45 kV, a tube current of 40 mA, a slit of 1°, a scanning interval of 65 to 75° 2θ, a time per step (s) of 22.86 and a scan speed (°/s) of 0.02321. The measurement was repeated three times for each sample. In this study, we calculated the CI from the degree of resolution of the d (212) reflection of quartz at 1.382 Å on the X-ray powder diffraction (XRD) profile based on the definition by Murata & Norman (Reference Murata and Norman1976). Namely, CI = 10*a*F/b, where a is the depth of the trough between the 67.74° and 68.14° 2θ peaks, b is the peak height at 67.74° 2θ from the baseline defined at 67.00° 2θ, and F is a scaling factor introduced to adjust the CI of the standard quartz sample (20–28 mesh granular quartz; Wako Co., Ltd.; Lot SDE2986) to 10, and was set at 1.246 in this study. Reproducibility of the CI for five repeated XRD measurements on repacked samples was better than ± 0.06.
3.d. Estimation of quartz content
It is necessary to estimate the quartz contents of the samples in order to calculate the ESR signal intensity of pure quartz. Thus, the samples were subject to quartz content analysis based on the internal standard method of XRD analysis (Klug & Alexander, Reference Klug and Alexander1974). A tube voltage of 45 kV, tube current of 40 mA, slit of 1°, scanning interval of 20 to 30° 2θ, time per step (s) of 6.35 and scan speed (°/s) of 0.334 were used. Silicon powder (99.9 % purity; Lot PEG1370) was used as an internal standard, which was added as 10 wt % of the sample to each sample. A sample was packed into a glass holder and subjected to measurement. The measurement was repeated three times for each sample with repacking each time. The second highest peak of quartz at 20.8° 2θ was used to quantify the quartz content, because the main peak of quartz at 26.6° 2θ overlaps with the peak of illite at 26.7° 2θ. The effect of quartz crystallinity on the peak height of quartz was also taken into account when estimating the quartz content, by assuming a linear decrease in peak height with a decrease in CI. According to Y. Isozaki (unpub. Ph.D. thesis, Univ. Tokyo, 2009), QC = (Wsi/Wsample)*(Iqtz/Isi)*(1/K’) where QC is quartz content, Wsi and Wsample are the weight of silicon standard and sample before mixing, respectively, Iqtz and Isi are the XRD peak intensity of quartz at 20.8° 2θ and silicon at 28.5° 2θ, respectively, and K’ is a correction factor for the effect of CI on Iqtz; K’ = (0.0135*CI) + 0.0679 in this study for a sample with silicon standard. Reproducibility of the quartz content for five repeated XRD measurements was better than ± 5 % (2σ).
4. Analytical results
4.a. Coarse fraction
4.a.1. ESR signal intensity
The ESR signal intensity of quartz in the coarse fraction (> 64 µm) of 24 river sediment samples ranges between 0.2 and 19 with an average of 5.5 and standard deviation of 6.1 (Table 1). The ESR signal intensities for samples from rivers draining from the central part of the Tian Shan Mountains show high values of 17∼19, which are significantly above the average. The value decreases to 5.1∼13 in the western part of the Tian Shan Mountains. In contrast, the ESR signal intensities for samples from rivers draining from the northeastern Pamir Plateau are less than 2, which is distinctly lower than the average, whereas two samples from the southeastern Pamir Plateau show higher values of 5.8 and 13. The values range between 1 and 4 with an average of 2.5 for river samples from the Kunlun Mountains. Regarding samples from the main part of the Kunlun Mountains, ESR signal intensities for LAF-F type samples tend to be slightly higher than for UAF and LAF-A type samples.
The ESR signal intensity of quartz in the coarse fraction of other sample types was not available because not enough coarse material was recovered.
4.b.2. Crystallinity index of quartz
The CI of quartz in the coarse fraction of the 24 river sediment samples ranges between 8.2 and 9.5 with an average of 8.6 and standard deviation of 0.3 (Table 1). The CI values of river samples from the northeastern Pamir Plateau are higher than the average value, whereas, the CI for river samples from the western part of the Tian Shan Mountains and the Kunlun Mountains are similar to or lower than the average. On the other hand, samples from the central part of the Tian Shan Mountains and the Altyn Mountains are similar to or slightly higher than the average value. Regarding samples from the Kunlun Mountains, the CI for LAF-F type samples tends to be slightly lower than that for UAF and LAF-A type samples.
4.b. Fine fraction
4.b.1. ESR signal intensity
The ESR signal intensity of quartz in the fine fractions of 24 river sediment samples ranges between 0.9 and 23 with an average of 7.2 and standard deviation of 5.5 (Table 1). The ESR signal intensities for the river sediments (all are UAF type) from the central part of the Tian Shan Mountains (17–23) are clearly higher than the average value for the river sediment samples in the basin, whereas the ESR signal intensities for river sediments from the northeastern Pamir Plateau (all are HM type) (0.9–1.7) are clearly lower than the average value for the river samples in the basin. The ESR signal intensity for river samples derived from the western part of the Tian Shan Mountains, the Kunlun Mountains and the Altyn Mountains ranges between 3.7 and 10, which is more or less similar to the average value for the river samples in the basin.
We examined the difference in the ESR signal intensity between the different types of sediments (= different depositional settings) using samples from the Kunlun Mountains and southeastern part of the Pamir Plateau where all types of samples are present. The ESR signal intensities for HM type samples from the Yarkand River (6.9–12) are distinctly higher than those of LAF-A type samples from downstream (3.7–5.9). UAF, LAF-A and LAF-F type river samples derived from the Kunlun and Altyn mountains show ESR signal intensities (3.7–8.1) similar to or slightly lower than the average value for the river samples in the basin. Moreover, these values are similar to the average values for the surface samples from dry lakes in the northeastern part of the basin (8.15 on average) and mountain loess samples at the foot of the Kunlun Mountains (7.78 on average).
4.b.2. Crystallinity index of quartz
The CI of quartz in the fine fraction of 24 river sediment samples ranges between 8.3 and 9.4, with an average of 8.8 and standard deviation of 0.2 (Table 1). The CI for river samples draining from the central and western parts of the Tian Shan Mountains (8.3–8.8) are similar to the average value for river samples in the basin. The CI for samples from the Pamir Plateau (8.6–9.4) and the western part of the Kunlun Mountains (8.6–9.1) tend to show higher values, whereas samples from the eastern part of the Kunlun Mountains (8.5–8.8) show lower values than the average for river samples.
We examined the difference in CI between the different depositional settings for samples from the Kunlun Mountains and southeastern part of the Pamir Plateau where all types of samples are present. The CI for HM, UAF and LAF-A type samples tends to be different from the average value for river samples in the basin, and each river shows a unique value. In contrast, LAF-F type samples show values similar to the average value for the river samples in the basin. The average value for LAF-F type samples (8.78) is similar to the average value for the dry lake samples in the northeastern part of the basin (8.55), while the CI for the fine fraction of the mountain loess samples (7.78) shows a slightly lower value than the average value for river samples in the basin.
5. Discussion
5.a. Source of quartz in the coarse fractions
5.a.1. ESR signal intensity versus CI of quartz in the coarse fraction
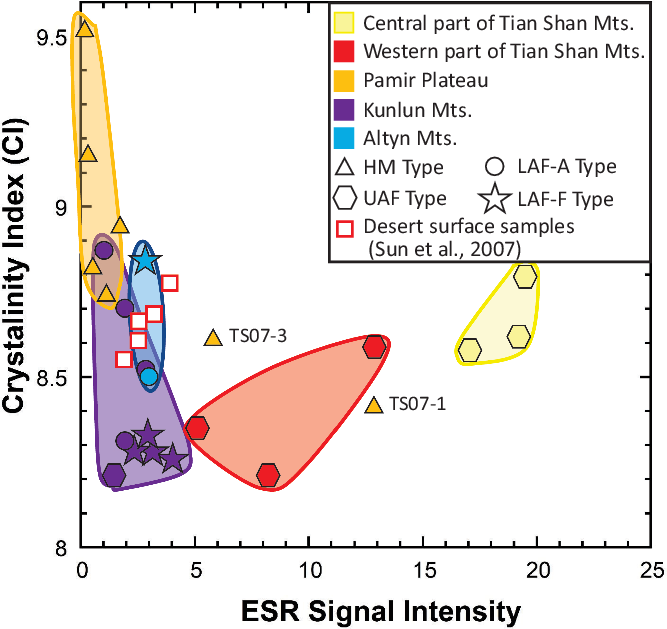
Honda & Shimizu (Reference Honda and Shimizu1998) interpreted the coarse fraction of the detrital material in the Tarim Basin as being produced by mountain glaciers and delivered by rivers based on a comparison of mineral composition and Re–Os isotope ratio between river sediments derived from Tian Shan Mountains and the surface sand of deserts close to the river (also see Hattori et al. Reference Hattori, Suzuki, Honda and Shimizu2003). Recently, Rittner et al. (Reference Rittner, Vermeesch, Cartera, Bird, Stevens, Garzanti, Andò, Vezzoli, Dutt, Xu and Lu2016) conducted an extensive provenance study of desert sand covering the entire Tarim Basin and surrounding mountains based on detrital zircon geochronology, heavy mineral assemblages and grain composition, and came to the same conclusion. In order to characterize the sediment derived from each river and confirm that the coarse fraction of the sediment from each river was derived from basement rocks exposed in its drainage area, we plotted the coarse fraction data on a CI versus ESR signal intensity diagram (Fig. 3). The coarse fractions of the river samples from the Kunlun and Altyn mountains and the northeastern Pamir Plateau plot in an area characterized by ESR signal intensities of less than 4 and CI between 8.2 and 9.6 on the diagram (Fig. 3), with lower ESR signal intensities (< 1.1) and higher CI (> 8.7) from the northeastern Pamir Plateau, and higher ESR signal intensities (> 1) and lower CI (< 8.9) from the Kunlun and Altyn mountains. Plots for the Kunlun and Altyn mountains are indistinguishable, and some overlap exists between the northeastern Pamir Plateau and the Kunlun and Altyn mountains. On the other hand, the coarse fractions of river samples from the Tian Shan Mountains plot in an area characterized by ESR signal intensities of 5.1 to 19 and CI of 8.2 to 8.8 (Fig. 3), with higher ESR signal intensities and higher CI for the central part, and lower ESR signal intensities and lower CI for the western part of the Tian Shan Mountains. The southernmost sample from the southeastern Pamir Plateau (TS07-1) plots close to the area for the western part of the Tian Shan Mountains, but ESR signal intensity gradually decreases and CI gradually increases towards the north (TS07-3), possibly reflecting increasing metamorphic grade or an increasing contribution of metamorphosed quartz towards the north. As is obvious from Figure 3, it is possible to distinguish the provenance of quartz derived from the Kunlun Mountains from that of the Tian Shan Mountains on the CI versus ESR signal intensity diagram. Furthermore, it is possible to distinguish quartz from the northeastern Pamir Plateau and the Kunlun and Altyn mountains, as well as the western Tian Shan Mountains and central Tian Shan Mountains relatively well. Although some of samples of LAF-A and LAF-F types could have been influenced by human activity, their ESR and CI values are conformable with those of nearby sites, suggesting the impact of human activity is not significant.

Fig. 3. A diagram showing plots of the crystallinity index of quartz versus ESR signal intensity in the coarse (> 64 μm) fractions of the river sediments draining into the Tarim Basin. Symbols represent the types of river sediments and colours represent the different regions of the surrounding mountains. Red open squares represent coarse fractions of desert sands from the Taklimakan Desert from Sun et al. (Reference Sun, Tada, Chen, Chen, Toyoda, Tani, Isozaki, Nagashima, Hasegawa and Ji2007).
5.a.2. Comparison between the basement rock ages in the drainage areas and ESR signal intensities of the river sediments
As described in Section 5.a.1, the ESR signal intensity and the CI of quartz in the coarse fraction of the river sediments in the Tarim Basin plot in areas unique to each drainage area on the CI versus ESR signal intensity diagram (Fig. 3), supporting the idea that the coarse fraction of the river sediments was derived from the basement rocks exposed in the drainage area of each river. If correct, we expect a good correlation between the ESR signal intensities of the river sediments and the ages of the basement rocks exposed in their drainage areas, because there is a positive correlation between the ESR signal intensities of quartz and the ages of their host rocks (Toyoda & Hattori, Reference Toyoda and Hattori2000), unless the rocks suffered from metamorphism at temperatures above c. 200 °C. To test this idea, we examined the relationship between the ESR signal intensities of quartz in the coarse fractions of the river sediment samples and the basement rock ages for their drainage areas (Fig. 4) estimated from a geological map (Teraoka & Okumura, Reference Teraoka and Okumura2003).

Fig. 4. Comparison between ESR signal intensity versus basement rock age based on a geological map by Teraoka & Okumura (Reference Teraoka and Okumura2003). Broken line shows the 1:1 line of ESR signal intensity versus host rock age after Toyoda & Hattori (Reference Toyoda and Hattori2000).
ESR signal intensities for the river sediment samples from the central part of the Tian Shan Mountains, where Precambrian to lower Palaeozoic sedimentary rocks and their metamorphic equivalents are dominantly exposed, show signal intensity values of 17–19 that correspond well with the early Palaeozoic age of the basement rocks exposed in their drainage areas. In contrast, ESR signal intensities for samples from the Yarkand and Hotan rivers from the westernmost part of the Kunlun Mountains where Precambrian sedimentary rocks and their metamorphic equivalents are mainly exposed, and the Gez River and the upper reaches of the Yarkand River from the Pamir Plateau, where Precambrian and upper Palaeozoic sedimentary rocks and their metamorphic equivalents are mainly exposed, show a signal intensity of as low as 0.2–2.0, which is significantly lower than the values estimated from the Precambrian to late Palaeozoic ages of the basement rocks exposed in their drainage areas (Fig. 1). Moreover, river samples from the Kunlun and Altyn Mountains, where Precambrian and late Palaeozoic sedimentary rocks and their metamorphic equivalents are mainly exposed, also show ESR signal intensity values of 1.0–4.0, which are lower than those estimated from the Precambrian to late Palaeozoic ages of the basement rocks exposed in their drainage areas (Fig. 1).
According to S. Toyoda (unpub. Ph.D. thesis, Osaka Univ., 1992), oxygen vacancies in quartz start to be preserved at approximately 200 °C when the cooling rate is 10 to 30 °C Myr−1. Therefore, it is possible that the ESR signal intensities of quartz in the coarse fractions of the detrital materials derived from the northeastern Pamir Plateau, which show distinctly lower values than are expected from the ages of the basement rocks in the drainage areas, reflect metamorphic rocks whose ESR signal intensities were reset by metamorphism and subsequently uplifted and eroded rapidly to be exposed on the surface during late Cenozoic time. To test this possibility, we examined the metamorphic conditions and uplift timings of the basement rocks exposed in the northeastern part of the Pamir Plateau.
The Kongr Shan Fault is present within the drainage area of the Gez River, from which sediments are characterized by significantly low ESR signal intensities and high CI. High-grade schists and gneisses of upper-amphibolite facies (metamorphic conditions of 9–10 kbar and 700–750 °C) are exposed along the Kongr Shan Fault (Robinson et al. Reference Robinson, An, Manning, Harrison, Zhang and Wang2007). A Th–Pb monazite age (closing temperature of > 800 °C) suggests a late Oligocene to middle Miocene age, and 40Ar–39Ar biotite cooling ages of high-grade schists and gneisses (closure temperature of 130 ± 30 °C) are 7.5–9 Ma (Robinson et al. Reference Robinson, An, Manning, Harrison, Zhang and Wang2007). Thus, it is suggested that the low ESR signal intensities of quartz in sediments from the Gez River reflect ESR signal intensities that have been reset by metamorphism and subsequent rapid uplift, erosion and exposure of the metamorphic rocks along the Kongr Shan Fault associated with development of the Pamir Arc during late Miocene time (Robinson et al. Reference Robinson, An, Manning, Harrison, Zhang and Wang2007). The gradual decrease in the ESR signal intensity and increase in CI of quartz in the coarse fraction of the sediments towards the granitic intrusion along the Gez River is consistent with this interpretation.
Thus, it is reasonable to consider that the ESR signal intensity and CI of quartz in the coarse fraction of the river sediments can be used as a tracer of source rocks exposed in the drainage area. This idea is consistent with the conclusion obtained by Rittner et al. (Reference Rittner, Vermeesch, Cartera, Bird, Stevens, Garzanti, Andò, Vezzoli, Dutt, Xu and Lu2016) that the coarse fraction of the river sediments is derived from the rocks exposed in the drainage area.
5.b. Origin and recycling mechanism of the fine-grained detrital material within the Tarim Basin
5.b.1. ESR signal intensity versus CI of quartz in the fine fraction
To explore the origin of the fine-grained detrital material in the surface sediments within the Tarim Basin, we compared the ESR signal intensities and CI of quartz in the coarse and fine fractions of the same samples on a CI versus ESR signal intensity diagram (Fig. 5). In Figure 5, the beginnings of arrows represent the coarse fraction data points and the ends of arrows represent the fine fraction data points for the same samples. The fine and coarse fractions of HM type samples from the Pamir Plateau and UAF type samples from the central part of the Tian Shan Mountains show shorter arrows, suggesting the ESR signal intensity and CI are similar between the two fractions. In contrast, the fine and coarse fractions of UAF type samples from the Aksu River draining from the western part of the Tian Shan Mountains and UAF, LAF-A and LAF-F type samples from the Kunlun Mountains show long arrows, indicating large differences between the two fractions on the CI versus ESR signal intensity diagram. In the latter samples, the fine fraction values tend to converge towards the average values for the fine fractions of all the river sediment samples analysed in this study (ESR signal intensity of 7.2 ± 5.5 and CI of 8.8 ± 0.2).

Fig. 5. The difference in plot positions of the crystallinity index of quartz versus ESR signal intensity between the fine and coarse fractions of river samples from the Tarim Basin. Solid to half-tone-filled symbols indicate the data plots for the coarse fraction of the river samples (the same as those in Fig. 3), whereas the heads of arrows indicate data plots for the fine fraction of the same samples. Plots for the fine fraction of dry lake samples (open squares) and mountain loess samples (open circles) are also shown on the diagram. The area surrounded by a circle with a dashed line shows the 2σ distance from the average value for all the river samples in the Tarim Basin.
Based on this observation, we propose that the difference between the two fractions reflects the contribution of fine detrital quartz with more or less constant ESR and CI values close to the average for the fine detrital fraction within the entire basin that was transported from outside of the drainage areas by wind. It is possible that quartz grains in the fine and coarse fractions are derived from different rock types characterized by different grain sizes and ages exposed in the drainage areas. In fact, intrusive rocks with coarser quartz grain sizes are relatively common in the Kunlun and Altyn mountains. However, intrusive rocks exposed in the Kunlun and Altyn mountains are dominantly late Palaeozoic to Mesozoic in age, whereas sedimentary and metamorphic rocks exposed there are dominantly early Palaeozoic to Precambrian in age. Consequently, older ages are expected for the quartz in the fine fraction. With regards to CI, a higher CI is expected for the coarse fraction, because quartz in intrusive rocks is expected to have a higher CI. The latter are the opposite of what is observed in Figure 5 for the Kunlun and Altyn mountains. Thus, the ESR–CI difference between the fine and coarse fractions observed in Figure 5 cannot be explained by the difference in source rock type. The difference in ESR signal intensity and CI between the fine and coarse fractions is most distinct in the LAF-F type samples, which came from the frontal hills of the Kunlun and Altyn mountains. Moreover, there is a thick accumulation of mountain loess on the northern slope of the Kunlun Mountains, supporting an aeolian origin for the fine fraction. On the other hand, there is no significant difference in ESR signal intensity and CI of quartz between the fine and coarse fractions of the HM type samples and UAF type samples from the central part of the Tian Shan Mountains, because the sampling sites are protected from aeolian dust either by the surrounding high mountains or by the wind direction from the Tian Shan mountains towards the Tarim Basin (the dust source).
5.b.2. Homogenizing process of fine-grained detrital material within the Tarim Basin
As described in Section 5.b.1, the data points for the fine fraction of UAF type samples from the Aksu River from the western part of the Tian Shan Mountains and those of UAF, LAF-A and LAF-F type samples from the Kunlun and Altyn mountains plot in distinctly different areas to the coarse fractions from the same samples, and the plots for the fine fractions of these samples tend to converge towards the area close to the average value for the fine fraction of river sediments in the basin on the CI versus ESR signal intensity diagram (Fig. 5). In addition, the area of convergence on the diagram is close to the average value for the mountain loess samples (ESR signal intensity = 7.8 ± 1.3 and CI = 8.7 ± 0.1), which should represent the values for aeolian dust emitted from the Tarim Basin (Fang et al. Reference Fang, Lu, Yang, Li, An, Jiang and Chen2002) (Fig. 5).
The fine fractions of river samples derived from the Kunlun, Altyn and western part of the Tian Shan mountains tend to have an ESR signal intensity and CI similar to the mountain loess samples because the drainage areas of the rivers from these mountains are located in the leeward of the northeasterly surface wind in the Tarim Basin (Yumimoto et al. Reference Yumimoto, Eguchi, Uno, Takemura, Liu, Shimizu and Sugimoto2009). It is likely that the fine fractions of these samples are heavily contaminated with aeolian dust emitted from the Tarim Basin. Development of thick mountain loess deposits covering the northern slopes of the Kunlun and Altyn mountains and the eastern slope of the western part of the Tian Shan Mountains also supports this idea. In fact, the mountain loess is considered to have been derived from the Taklimakan Desert because the median grain size of the mountain loess, ranging from 20 to 60 µm, is the size susceptive to wind transportation by short-term suspension, and active sand dunes in the Taklimakan Desert are moving southwestward towards the Kunlun Mountains (Sun, Reference Sun2002).
However, according to the study by Honda & Shimizu (Reference Honda and Shimizu1998), the Taklimakan Desert does not seem to be the main source of the mountain loess, because the median grain size of the surface sand of the Taklimakan Desert ranges between 62 and 250 µm and contains only a small amount of a fraction less than 45 μm in diameter that can be transported as aeolian dust. On the other hand, dry lake and dry river sediments contain < 45 μm fractions of more than 50 % (Honda & Shimizu, Reference Honda and Shimizu1998). In addition, a ten times greater dust saltation flux was observed on the gobi surface compared to the sand dune surface under the same climatic conditions according to saltation flux measurements by Mikami et al. (Reference Mikami, Yamada, Ishizuka, Ishimaru, Gao and Zeng2005). From this observational evidence, it is considered that the main source of the aeolian dust emitted from the Tarim Basin, which was deposited on the northern slope of the Kunlun Mountains, is not the sand dunes of the Taklimakan Desert but the gobi and wadi developed on the alluvial fans and dry lakes (Honda & Shimizu, Reference Honda and Shimizu1998; Mikami et al. Reference Mikami, Yamada, Ishizuka, Ishimaru, Gao and Zeng2005), especially the latter developed in the northeastern part of the Tarim Basin.
These observations suggest that the large amount of aeolian dust emitted from the gobi and wadi developed on the alluvial fans fringing the basin and dry lakes in the northeastern part of the basin is transported to and deposited in the drainage areas of the rivers flowing down the northern slope of the Kunlun Mountains. As a result, the ESR signal intensities and CI of quartz in the fine fractions of the river sediments derived from the northern slope of the Kunlun Mountains converge on the average values of aeolian dust, because the aeolian dust contribution to the fine fraction of the sediments is expected to be significant in these rivers.
Detrital material shed from the Tian Shan Mountains, the Pamir Plateau and the western part of the Kunlun Mountains is transported in a clockwise direction by the Tarim River along the western to northern margin of the desert, whereas material from the eastern part of the Kunlun Mountains and the Altyn Mountains is transported in a counterclockwise direction by the Qarqan River along the southeastern margin of the desert to the seasonal (= dry) lakes and swamps developed in the northeastern part of the basin (Fig. 1). The detrital material derived from the individual drainage areas is considered to have been mixed and homogenized in the Tarim and Qarqan rivers during transportation over more than several hundred kilometres to the dry lakes in the northeastern part of the basin, thus obtaining ESR signal intensities and CI close to the average values for the fine fraction of the river sediments in the Tarim Basin.
However, there seems to be a slight difference in CI between the fine fraction of the dry lake sediments and the average value for the fine fraction of the river sediments in the Tarim Basin. Namely, the fine fractions of three out of four samples from the dry lake sediments have a CI of 8.4 to 8.5, which is clearly lower than the CI average value of 8.8 ± 0.2 for the fine fraction of the river sediments in the Tarim Basin. One possible explanation is the grain size dependence of CI, because the fine fractions of these dry lake samples are especially enriched in the < 4 μm fraction, and the CI tends to decrease when the grain size becomes smaller than 4 μm owing to the increasing contribution of the molecules exposed on the surface of the quartz grain relative to the molecules inside of it.
Based on the evidence described above, the convergent values of the ESR signal intensity and CI for the fine fractions of the river sediments delivered from the Kunlun Mountains, the Altyn Mountains and the western part of the Tian Shan Mountains are characterized by values close to those of dust emitted from the basin. It is likely that the river sediments delivered from the Kunlun and Altyn mountains and the western part of the Tian Shan Mountains will be transported again to the northeastern part of the basin by major rivers such as the Tarim and Qarqan rivers, and the fine-grained detrital particles are homogenized during the transportation process by the rivers. In other words, there is a recycling circuit of the fine detrital materials shed from the surrounding mountains of the basin, in which the fine-grained detrital materials are homogenized through this recycling process as follows (Fig. 6):
(1) Erosion of basement rocks exposed in the drainage areas of rivers in the surrounding mountains.
(2) Transportation of detrital materials by rivers to the alluvial fans fringing the margin of the Tarim Basin.
(3) Deposition of detrital materials on alluvial fans fringing the basin or (3′) further transportation along the basin margin by major rivers to the dry lakes in the northeastern part of the basin.
(4) Wind erosion of fine-grained detrital material (aeolian dust) from the dry rivers and dry lakes along the outer margin of the alluvial fans and the dry lakes in the northeastern part of the basin, and transportation of fine-grained detrital material towards the southwestern margin of the basin by southerly to southeasterly surface winds.
(5) Deposition of the dust (fine-grained detrital material) on the northern slope of the Kunlun and Altyn mountains and the westernmost part of the Tian Shan Mountains (so-called mountain loess; Fang et al. Reference Fang, Lu, Yang, Li, An, Jiang and Chen2002).
(6) Emission of part of the dust, which is lifted up along the northern slope of the Kunlun Mountains to an altitude of > 5 km, which is entrained and transported outside of the basin by the westerly jet (Yumimoto et al. Reference Yumimoto, Eguchi, Uno, Takemura, Liu, Shimizu and Sugimoto2009, Reference Yumimoto, Kajino, Tanaka and Uno2019).
(7) Cycle then returns back to (1), with re-erosion of fine-grained detrital material deposited in the drainage area of the rivers that drain from those mountains and transportation to the basin, thus closing the circuit.

Fig. 6. A schematic diagram showing the recycling process of the source material of aeolian dust in the Tarim Basin. Black arrows indicate transportation of suspended detrital particles by rivers and orange arrows indicate transportation of aeolian dust by winds. Numbers in circles correspond to the processes numbered in Section 5.b.2 of the text.
The good agreement between the average values of the ESR signal intensities and CI for the fine fractions of river sediments delivered from the surrounding mountains and those of the mountain loess on the northern slope of the Kunlun Mountains suggests that the composition of the aeolian dust emitted from the Tarim Basin approximately represents the average composition of the fine-grained detrital material in the basin.
6. Conclusions
We investigated the erosion–transportation–accumulation processes of the fine fraction of the detrital material in the Tarim Basin and the origin of aeolian dust emitted from the basin based on examination of the ESR signal intensity and the CI of quartz in the coarse (> 64 μm) and fine (< 16 μm) fractions of river sediments delivered from the surrounding mountains, the surface sediments of dry lakes and swamps in the northeastern part of basin, and mountain loess accumulated on the northern slope of the Kunlun Mountains. We classified the occurrence of the river sediment samples into the following four types based on their depositional settings. The HM type is sediments of rivers running through the mountainous area, the UAF type is river sediments from the upper part of alluvial fans, the LAF-A type is river sediments from the lower part of the alluvial fans of rivers draining from the axial part of the Kunlun and Tian Shan mountains, and the LAF-F type is river sediments from the lower part of the alluvial fans of rivers draining from the frontal hills. Quartz in the coarse fraction (> 64 μm) of the river sediment shows a unique ESR signal intensity and CI for each river, suggesting that the coarse fraction was derived from the basement rocks exposed in the drainage area of each river by erosion and stream transportation, because the > 64 μm particles cannot be transported a long distance by wind (Pye, Reference Pye1987). The positive correlation between the ESR signal intensities of quartz in the coarse fractions of the river sediments and the ages of the basement rocks exposed in the drainage areas supports this interpretation.
We compared the ESR signal intensities and CI of quartz in the fine and coarse fractions of the same river sediment samples. The ESR signal intensities and the CI of the fine fractions of the HM type samples from the rivers in the westernmost part of the Kunlun Mountains and the Pamir Plateau and the UAF type samples from the central and western parts of the Tian Shan Mountains located on the windward side of the basin agree well with those of the coarse fractions, suggesting that the fine and coarse fractions are derived from similar basement rocks and that the contribution of aeolian dust in the fine fraction is insignificant. The ESR signal intensities and the CI for the fine fractions of sediments from the rivers draining from the Kunlun and Altyn mountains are different from those values for the coarse fractions of the same samples, and converge towards values characterized by an ESR signal intensity of 7.2 ± 5.5 and CI of 8.8 ± 0.2, the average values for the fine fractions of the river sediments in the basin. The convergent values of the ESR signal intensity and CI of the fine fractions are also similar to the average values of the mountain loess that represents the aeolian dust emitted from the Tarim Basin.
It is considered that the convergence of the ESR signal intensity and CI values of the fine fractions of the detrital material within the basin resulted from the following recycling process: (1) erosion of basement rocks exposed in the drainage areas in the mountains surrounding the basin, (2) transportation by rivers to the basin, (3) deposition on alluvial fans fringing the basin or further transportation by major rivers to and deposition in the dry lakes and swamps in the northeastern part of the basin, (4) erosion and transportation of fine detrital particles from the gobi and wadi on the alluvial fans and dry lakes by surface wind, and (5) aeolian deposition of fine detrital particles on the northern slope of the Kunlun and Altyn mountains and southeastern slope of the westernmost part of the Tian Shan Mountains. Re-erosion of the fine detrital particles by the rivers draining from the Kunlun and Altyn mountains and westernmost part of the Tian Shan Mountains closes the recycling circuit.
Acknowledgements
This manuscript is based on the doctoral thesis of Y. Isozaki under the supervision of R. Tada. Because Isozaki left academia and could not find a time to prepare a manuscript, RT took over the role and revised and updated the manuscript. We thank Yang Wenguang and Wang Ke for their assistance in the field and K. Nagashima for her advice to Y. Isozaki in the laboratory. This research was supported by funding from the Mitsubishi Foundation provided to R. Tada, Fujiwara Natural History Foundation provided to Y. Isozaki, a JSPS fellowship and supporting funds provided to Y. Sun, and the Second Tibetan Plateau Scientific Expedition and Research (STEP) (2019QZKK0704) and National Natural Science Foundation of China (NSFC) (41888101, U1902208, 41991323) and the Strategic Priority Research Program of Chinese Academy of Sciences (XDB26020301) to H. Zheng.