1. Introduction
The study of the morphology and composition of gold grains from stream sediments, soils and regolith has been widely used as a tool in gold exploration programmes (Hallbauer & Utter, Reference Hallbauer and Utter1977; Averill & Zimmerman, Reference Averill and Zimmerman1986; Grant et al. Reference Grant, Lavin and Nichol1991; Styles, Reference Styles1995). According to Loen (Reference Loen1994), the placer gold occurs as coarse-sized, oval to elongated grains characterized by rounded protuberances and inclusions of quartz and sulphide minerals. Native gold is a very malleable mineral and, in a supergenic natural environment, grains are highly deformed during transport. These morphological transformations mainly depend on transport distance and environment (Hérail, Reference Hérail1984; DiLabio, Reference DiLabio1991), so they can be used as excellent distance-to-source indicators (Antweiller & Campbell, Reference Antweiler and Campbell1977; Grant et al. Reference Grant, Lavin and Nichol1991; Zhihui & Fletcher, Reference Zhihui and Fletcher1991; Townley et al. Reference Townley, Herail, Maksaev, Palacios, de Parseval, Sepuldeva, Orellana, Rivas and Ulloa2003). Similar to other resistant minerals such as zircon or tourmaline, gold can be used as a tracer of the genesis and evolution of laterites (Ouangrawa & Yongue, Reference Ouangrawa and Yongue2001). The morphology of a gold grain is rarely sufficient to identify the origin, but can provide useful information to distinguish between primary or secondary origins of gold (Lawrance & Griffin, Reference Lawrance and Griffin1994; Freyssinet et al. Reference Freyssinet, Butt, Morris, Piantone, Hedenquist, Thompson, Goldfarb and Richards2005; Larizzati et al. Reference Larizzatti, de Oliveira and Butt2008; Hough et al. Reference Hough, Butt and Fischer-Bühner2009). According to Grant et al. (Reference Grant, Lavin and Nichol1991), gold grain morphology is a less reliable indicator than gold grain fineness in determining the contribution of single or multiple sources of gold. However, morphology studies provide an effective tool in identifying the proximity to the primary source.
The variation in the composition of the grains reflects differences in the geological environment and chemistry of ore-forming processes, as well as the effect of supergenic processes of dissolution, refinement and re-precipitation. The compositional and mineralogical characterization of gold grains makes it possible to establish chemical signatures that can provide information about the original bedrock mineralization (Grant et al. Reference Grant, Lavin and Nichol1991; Chapman et al. Reference Chapman, Leake, Moles, Earls, Cooper, Harrington and Berzins2000), and they are also useful in identifying different population sources of alluvial grains (Hirdes, Reference Hirdes, Wauschkuhn, Kluth and Zimerman1984; Leake et al. Reference Leake, Styles, Bland, Henney, Wetton and Naden1995, Reference Leake, Chapman, Bland, Stone, Camero and Styles1998).
Gold grain composition may vary widely, especially with respect to silver content. Gold fineness (using Au and Ag contents in weight %) has been commonly used to determine secondary gold enrichment in lateritic environments (Webster & Mann, Reference Webster and Mann1984; Santosh et al. Reference Santosh, Philip, Jacob and Omana1992; de Oliveira & de Oliveira, Reference de Oliveira and de Oliveira2000; Nakagama et al. Reference Nakagawa, Santosh, Nambiar and Matsubara2005; Butt & Hough, Reference Butt and Hough2006).
Automated identification and quantification of mineral phases (in terms of size and shape parameters) make an important contribution in ore petrographic studies or gold characterization. Quantitative assessment of ore petrography is an essential part of geosciences, as it provides a key to successful interpretation of mineralization events (Higgings, Reference Higgings2006). Image analysis is a technique that permits the extraction of meaningful information from images, mainly from digital images by means of digital image processing techniques. In mineralogy, optical image analysis (OIA) is applied in the automated identification of minerals in mineral images (e.g. images acquired by a digital microscope). OIA provides an important advancement over traditional techniques to automatize the characterization of minerals in digital images (Ehrlich et al. Reference Ehrlich, Kennedy, Crabtree and Cannon1984; Russ, Reference Santosh, Philip, Jacob and Omana1992; Pirard et al. Reference Pirard, Lebrun and Nivart1999; Castroviejo et al. Reference Castroviejo, Berrezueta and Lastra2002; Berrezueta & Castroviejo, Reference Berrezueta and Castroviejo2007; Grove & Jerram, Reference Grove and Jerram2011). Furthermore, this technique is a convenient, accessible and inexpensive tool for obtaining comprehensive information about fine fractions of the ore. In the case of applications concerning the identification and quantification of metallic minerals, the appropriateness of using colour images has been demonstrated in a wide variety of studies (Pirard, Reference Pirard2004; Spring, Reference Spring2007; Lane et al. Reference Larizzatti, de Oliveira and Butt2008; Berrezueta et al. Reference Berrezueta, Ordóñez-Casado, Bonilla, Banda, Castroviejo, Carrión and Puglla2016; Jardine et al. Reference Jardine, Miller and Becker2018).
Electron microprobe analysis (EMPA) is one of the most powerful techniques available for non-destructive, micrometre-resolution, high-accuracy, in situ compositional analysis, and has continued to be extensively utilized in the analysis of minerals ever since its first conceptualization by R Castaing (unpublished PhD thesis, University of Paris, 1951).
The objectives of this research are: (1) to define an effective and reproducible methodology that allows researchers to obtain qualitative information about grain size and shape parameters, and to quantitatively describe grains (area, diameter, roundness, aspect ratio) of samples studied by optical microscope; (2) to describe the morphology of gold grains obtained from a lateritic weathering profile and from stream sediments down-drainage from the lateritic occurrences; (3) to characterize chemically the composition of gold grains (fineness, Cu, Hg and other metal content) and mineral inclusions; and (4) to establish a relationship between morphological and chemical studies in order to improve the detailed characterization of gold particles of the Ntem complex greenstone belt lateritic deposit.
2. Geological setting and weathering profile
The Minvoul area is located within Woleu–Ntem Province of the Gabonese Republic bordering with the Republic of Cameroon (Fig. 1). Geologically, the Minvoul area forms part of the Ntem complex, which represents the northwestern portion of the Congo craton and is constituted by Archean formations emplaced during 3.3–2.5 Ga (U–Pb single zircon age; Shang et al. Reference Shang, Satir, Siebel, Taubald, Nsifa, Westphal and Reitter2001; Toteu et al. Reference Toteu, Van Schmus, Penaye and Michard2001; Owona et al. Reference Owona, Ondoa, Tichomirowa, Ratschbacher, Tchoua and Ekodeck2012). Some of those formations were reworked in the Palaeoproterozoic, during the Eburnean–Transamazonian orogeny (R Tchameni, unpublished PhD thesis, University of Orléans, 1997; Njiosseu et al., Reference Njiosseu, Nzenti, Njanko, Kapajika and Nédélec2005). The Ntem complex consists of three principal formations: (1) massive and banded plutonic rocks of the charnockite suite and the intrusive tonalites, trondhjemites and granodiorites (TTG) suite; (2) supracrustal xenoliths of basic and ferriferous rocks interpreted as remnants of greenstone belts dated at c. 3.1 Ga (Tchameni, Reference Tchameni2004); and (3) late K-rich granitoids (2.7–2.5 Ga) intruding all these magmatic bodies (Tchameni et al. Reference Tchameni, Mezger, Nsifa and Pouclet2000; Shang et al. Reference Shang, Satir, Siebel, Taubald, Nsifa, Westphal and Reitter2001). Younger metadoleritic dykes are related to the Palaeoproterozoic events (Vicat et al. Reference Vicat, Léger, Nsifa, Piguet, Nzenti, Tchameni and Pouclet1996).

Fig. 1. Regional geological map. 1, Phanerozoic cover; 2, Yakadouma and Dja Series (Neoproterozoic); 3, Noya Basin (Neoproterozoic); 4, Yaoundé Series (Neoproterozoic, Pan-African); 5, Ntem Complex, Ayina unit and Nyong unit (Neoarchean–Palaeoproterozoic) foliated series: amphibolite/garnet gneiss; 6, Ntem Complex, Ntem unit (Mesoarchean) banded series: undifferentiated granulitic gneiss; 7, Monts de Cristal migmatitic belt (Mesoarchean?); 8, Nord Gabon plutonic complex (3.1–2.8 Ga) granitoid, tonalite, granodiorite; 9, greenstone belts (Mesoarchean–Palaeoproterozoic): amphibolite, itabirite, micaschist; 10, dolerites and gabbros (Pre-Eburnean (2.2 Ga) and Pre-Pan-African (1 Ga)); 11, magmatic charnockitic suite and TTG suite (2.9–2.8 Ga); 12, K-rich granite and porphyroid monzogranite (2.7–2.5 Ga); 13, geological contour; 14, major fault; 15, major thrust; 16, dextral transcurrent movement; 17, sinistral trancurrent movement; 18, Nkol shear zone; 19, Nord Gabon shear zone; 20, Ntem shear zone; 21, Abanga fault; 22, Nouna Fault; 23, National border (after Iglesias-Martínez et al. Reference Iglesias-Martínez, Espí and Edou-Minko2018).
The study area was chosen due to its favourable geological location, the presence of alluvial gold showings and the encouraging geochemical results obtained from soils. It is commonly accepted that there is a strong correlation between the iron-bearing formations and gold mineralization. The presence of Archean or Palaeoproterozoic iron formations can therefore be considered a priority target for gold deposits (Bassot et al. Reference Bassot, Caen-Vachette, Vialette and Vidal1986; Leistel et al. Reference Leistel, Deschamps, Feybesse, Husson, Lambert, Leduc, Milési, Chassignol, Chêne, Heinry, Lançan, Lannez and Ralay2001; Thiéblemont et al. Reference Thiéblemont, Castaign, Billa, Bouton and Préat2009). Even although the geology of the edges of Congo craton remain poorly known and the controls of primary gold mineralization are not completely understood, gold has been known to occur in South Cameroon and northern Gabon since the last century. Although gold showings are common and many placers have been mined artisanally, no industrial-scale gold mines exist on the northern Congo craton border.
In the Minvoul region, similar to the rest of Central Africa, climate conditions are aggressive enough to provoke a strong weathering of all rocks constituting the substratum (Lecomte, Reference Lecomte1988; Edou-Minko et al. Reference Edou-Minko, Colin, Trescases and Lecomte1992; Chevalier et al. Reference Chevallier, Makanga and Thomas2002). The physical and, above all, chemical weathering of these materials affects the rock formations to depths of the order of tens of metres; on the surface, almost exclusively, weathered clay horizons can be found with rock outcrops limited to some valley bottoms.
According to previous studies (Iglesias-Martínez, Reference Iglesias-Martínez2016; Iglesias-Martínez et al. Reference Iglesias-Martínez, Espí and Edou-Minko2018), the following five main alteration horizons have been recognized in the studied area (from bottom to topsoil; Figs 2, 3). (1) A reddish clayey saprolite becomes greenish towards the bottom, derived from the weathering of the amphibolitic basement with primary textures, such as schistosity, locally preserved. X-ray diffraction analysis revealed a kaolinite and smectite composition with minor amounts of hematite and goethite for the saprolite clay matrix. (2) A mottled zone, also termed the transition horizon, consists of yellow, clayey kaolinitic-goethitic material with randomly distributed millimetric–centimetric reddish lumps of Fe/Al-oxides. Higher in this horizon, the spots become larger and increasingly indurated, giving way to ferrigenous nodules that consist of quartz, goethite and minor amounts of kaolinite. (3) The ferruginous zone or iron crust is a hard continuous layer, which is concretionary and pisolitic and consists of cemented nodules of goethite, hematite and other iron oxides and hydroxides. To the top, the duricrust cohesion diminishes, and the nodules start to detach from each other. The presence and thickness of this horizon depends on the topographic level. The thickness ranges from 1 to 4 m. (4) An allochthonous pebbly layer developed at the expense of ancient duricrusts composed of centimetric–decimetric sub-angular blocks of ironcrust and sub-rounded pisolites along with fragments of weathered rocks and quartz veins in a reddish clayey-sandy matrix. The thickness of this horizon, which frequently has been denominated stone-line, varies from 0.5 to > 2 m. (5) A 1.5–4.0-m thick homogenous red to orange, clay-rich matrix latosol, which culminates in a centimetric layer of a dark-brown organic-rich material. Based on granulometric and geochemical data, Thiéblemont (Reference Thiéblemont2013) suggests a Holocene aeolian origin for the orange latosols.

Fig. 2. Geological sketch of the studied area. The whole area is deeply weathered, so definition of the lithological units was based on observation in pits, trenches, auger-drills and river cuts. 1, Alluvial sediments; 2, granite; 3, felsic dyke; 4, meta-leucogabbro and anorthosites; 5, itabirite; 6, metapelites (micaschist and amphibolitic schist; 7, foliated and banded amphibolites; 8, quartz-feldspathic gneiss; 9, corundum occurrences; 10, artisanal gold workings in alluvium; 11, contours of geochemical gold anomalies in soils; 12, inferred fault; 13, trace of lateritic profile; 14, sampling site by auger-drill; 15, sampling site by hand-auger; 16, sampling pit.

Fig. 3. Schematic representation of the typical lateritic profile through an amphibolitic squence in the Minvoul area.
More than 20 streams have been identified in the area where the artisanal exploitation of gold has been intensely active for the last 15 years, although some of the older workings have been mined since colonial times. The grade of the tested alluvial deposits varies from 0.2 to 15 g t−1 Au (Iglesias-Martínez, Reference Iglesias-Martínez2015). The gold-bearing alluvial deposits are essentially composed of quartz-vein fragments, but there are also fragments of chert and altered and decomposed bedrock. Evidence of silicification in the auriferous gravels, together with recrystallized quartz veins exhibiting features of shear deformation, suggests hydrothermal processes and structural control of primary gold mineralization.
3. Materials and methods
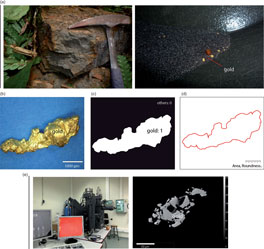
Visual ore mineral characterization of selected samples yielded valuable information about the site. The gold grain samples studied in the present work were collected from the different horizons of the weathering profile at seven locations (Fig. 2). From bottom to top, these horizons are saprolite, mottled zone, iron crust, pisolitic gravels and soil. The sampling also included alluvial deposits draining the study area (Fig. 4a). At each location, bulk samples of 5–20 kg were collected in pits, trenches and by means of auger-drilling. The bulk samples were disaggregated under water, and > 50 g samples of heavy mineral fractions were obtained by gravity washing in a pan. Panning was chosen instead of other centrifugal concentrators to eliminate the risk of particle damage. To extract gold grains from the heavy mineral concentrate, the samples were dried and the magnetic fraction was removed with a neodymium hand magnet. Quartz and other light-fraction minerals were removed by the heavy-liquid separation method. Finally, gold grains were hand-picked under binocular microscope. It should be taken into consideration that, through the panning technique, part of the fine-grained flaky particles may be lost. These losses mostly affect the < 20 μm grain size range, but there were also moderate losses in the 10–20 μm range. Experienced prospectors endeavoured to obtain the maximum amount of gold particles from the more gold-depleted horizons. Even so, only a small amount of gold particles was recovered from the topsoil.

Fig. 4. (a) Gold sample collection; (b) acquisition of digital images; (c) segmentation of gold grains; (d) measurement and quantification of geometric parameters of gold grains; and (e) chemical analysis.
3.a. OIA procedure
The development of a reproducible process to obtain data semiautomatically requires a series of steps: image acquisition, image segmentation and quantification of ore mineral morphological parameters. The quantification of gold grains by OIA was performed on different gold particles that were digitized using a digital microscope (Dino-Lite Digital Microscope, DinoCapture 2.0). The image process was performed by using the ImageJ-Fiji 1.43 image analysis program (available at https://imagej.nih.gov/ij/docs/guide/146.html). These analyses were performed at the Oviedo Unit of the Geological Survey of Spain.
3.a.1. Image acquisition
Digital images were acquired using a Dino-Lite 2.0 digital microscope (Open Dino-Lite > Snapshot > Save). This process can be summarized in the following steps: (1) OIA tools were set up in order to calibrate and clean the digital microscope for the process of image capture; (2) samples were then placed on a blue support to favour the contrast with the metallic yellow colour of the gold samples, hand-picking a selection of gold populations based on optical morphological characteristics (different populations were established when possible); (3) the focus was set manually, and the samples were illuminated with constant light; and (4) the focus and illumination of the images were verified, and the images were recorded in the required format (HSB and RGB, 24-bit tiff) for later use in the gold segmentation phases. The number of pictures by sample depended on the amount of grains and their size, and ranged from 2 to 219 per single sample. Images were acquired at magnification ×55, representing c. 5.7 μm per pixel.
Finally, a pre-processing image checking had to be performed occasionally to ensure that there were no touching grains. If so, a quick modification was made in the image. The success of this method depends on the quality of the hand-picking process, which must be executed with great care.
3.a.2. Image segmentation
The segmentation process was carried out on the acquired colour image (Fig. 4b–d) by ImageJ.Fiji 1.43 software. We followed the thresholding method (Open ImageJ > Image > Adjust > Color Threshold), which consists of separating the objects of interest from the background. In this case, pixels with a value below the threshold were considered grains, and pixels above that threshold value were interpreted as background. The colour model used in this research was the hue–saturation–brightness (HSB) space. Another model that allows colours to be represented in numerical form is the red–green–blue (RGB) model, which uses three values or chromatic components. HSB space was considered more suitable to detect the grains than RGB colour space. In this method, H represents the hue of colour, S the degree of purity and B the general brightness of the image. The segmentation ranges of the gold grains (H, 34–82; S, 38.1–80.4; B, 82–100) were determined by sampling windows on gold grains. Once the gold grains were segmented, a binary image was generated (Open ImageJ > Process > Binary > Make Binary) (gold, 1; others, 0). A function of the image analysis program was then applied to improve the information of the binary image (fill holes). The final binary image was saved for further quantification.
3.a.3. Parameter quantification
Once obtaining individualized binary images of the target objects (gold grains), we proceeded to the identification and measurement of size and shape parameters (Fig. 4d). Size descriptors calculated from Image-J-Fiji 1.43 (Open ImageJ > Analyze > Set Measurements > Analyze Particles) were: area A, perimeter P, major axis A M, minor axis A m, convex area A con and, indirectly, the Folk diameter is calculated as (4A/π)0.5. Morphometric parameters, including aspect ratio (A M/A m), roundness (4A/πA M2), solidity (A/A con) and ratio of perimeter to area (P/A) were also calculated. Data were recorded in spreadsheet format to allow presentation in tables and graphs. The process is depicted in Figure 4d. Statistics of the gold size distribution and gold shape parameters were calculated in microns and phi units. Data were presented graphically as: (1) frequency diagrams (non-cumulative and cumulative) of number of grains related to grain area classes and minimum Feret diameter; (2) cumulative weighted gold grain area, related to gold grain area classes (μm2) (logarithmic scale); and relative cumulative weighted gold grain of minimum Feret diameter related to gold grain Feret diameter (μm2) (logarithmic scale); and (3) cumulative gold size distribution (frequency versus phi) where the phi unit (Φ) is a logarithmic transformation, base 2, of the Folk diameter (mm) into whole integers (Folk & Ward, Reference Folk and Ward1957). In this study, we used phi unit curves to complement the above-described gold size distribution data. Sorting calculations were also performed using phi percentile values: (Φ84−Φ16)/4 + (Φ95−Φ5)/6.6.
3.b. Chemical analysis
Eleven polished mounts of selected gold grains sampled from representative horizons of the weathered profile and four thin-sections of visible gold-bearing iron duricrust were prepared at TSL Laboratories (Toul, France) for microchemical analysis. Cameca SX-100 electron probe microanalysis (EPMA) was used to analyse the composition of the core and rim area of gold grains and their inclusions, with microprobe under 10 s counting time, 1 μm beam size, 15 kV and 25 nA operation conditions, at the Oviedo University (Fig. 4e). Extensive energy-dispersive spectroscopy (EDS) analyses were performed on all grains to check for the presence of elements other than Au, Ag and Cu. Elements such as S, Fe, Co, Ni, Zn, As, Se, Sn, Sb, Te, Hg, Pb and Bi were also analysed.
Gold fineness has been commonly used to determine secondary gold enrichment in lateritic environments (e.g. Hirdes, Reference Hirdes, Wauschkuhn, Kluth and Zimerman1984; Santosh et al. Reference Santosh, Philip, Jacob and Omana1992; de Oliveira and de Oliveira, Reference de Oliveira and de Oliveira2000), and was calculated based on weight % of Au and Ag contents following the formula: [Au/(Au+Ag)] × 1000.
4. Results
4.a. Gold quantification by OIA
The main objective of this section is to present the measurements of the studied samples based on an OIA systematic process. First, the gold grains were separated into groups according to their origin (soil, gravel, mottled clay, laterites, saprolite and alluvial deposits).
The total number of obtained images was 550, while the total number of gold grains was 7233. The distribution of these numbers as a function of sample type was: soil, 2 images and 8 gold grains; pisolitic gravels, 22 images and 167 gold grains; iron duricrust, 37 images and 454 gold grains; mottled clays, 42 images and 440 gold grains; saprolite, 10 images and 53 gold grains; and alluvial deposits, 437 images and 6111 gold grains.
An OIA process was used to measure size and shape parameters on previously segmented gold grains using the ImageJ program. For each of the evaluated groups, five main size parameters were measured (area, Feret diameter, minimum Feret diameter, Folk diameter and phi diameter). The main statistical values (arithmetic mean, maximum and minimum value) measured from the size parameters are presented in Table 1. A statistical formula based on the phi percentiles (Folk & Ward, Reference Folk and Ward1957) was used to calculate the grain size parameter sorting (Table 1).
Table 1. Main grain size and shape parameter data as average values (range in parentheses)

Alluvial gold grains represent the largest population among the studied groups both in terms of grain abundance (84.49% of the total) and cumulative area (83.78%). The soil grains have the lowest abundance in terms of frequency (0.11%), while the smallest total area was measured in the saprolite samples (0.22% versus the 0.34% obtained for the soil grains) as a result of the small grain size.
The parameters in Table 1 reveal remarkable differences between the evaluated populations. The highest value in average area (c. 310 000 μm2) was measured on gold grains from the soil horizon, whereas the saprolite gold grains have the lowest value (c. 31 000 μm2), a ratio of 1/10 between these two horizons. In terms of average area of gold grains, the studied horizons can be ordered from largest to smallest as follows: soil, pisolitic gravels, iron crust, alluvial, mottled clay and saprolite. The same pattern was observed for the parameters of average Feret diameter, minimum Feret diameter, and Folk diameter. In the case of the average Φ diameter value, this pattern is inverted.
Four shape parameters (aspect ratio, roundness, solidity and ratio of perimeter to area) were measured for the different groups. The main statistical values (mean, maximum and minimum value) of these parameters are presented in Table 2. The highest value of average aspect ratio (1.81) was obtained for grains collected in the iron crust horizon, while the lowest (1.6) belongs to the gold found in the pisolitic gravel zone. There is a slight variation in roundness among the horizons; the maximum value (0.67) corresponds to grains of the pisolitic gravel, and the minimum (0.6) was measured in grains from the soil and alluvial deposits. A slight variation of the solidity parameter (from 0.86 to 0.91) was observed.
Table 2. Morphology parameters: aspect ratio, roundness, solidity and perimeter/area (μm−1), as average values (range in parentheses). Sorting was calculated following Folk & Ward (Reference Folk and Ward1957)

No well-defined distribution was observed among the weathering horizons in terms of aspect ratio, roundness or solidity, as there are only slight variations in these parameters. On the other hand, aspect ratio values display wider ranges. The maximum ranges were obtained for the alluvial grains, while there is a trend of decreasing value ranges from the gravels towards the saprolite grains. The perimeter/area ratio proved to be the best parameter to express the differences among the weathering horizons. The average values of this parameter are lower in the superficial horizons (average lowest value for the soil, 0.057 μm−1) and higher in the deeper horizons (average highest value for the saprolite samples, 0.192 μm−1). The value ranges, however, do not show a clearly defined distribution. The highest ranges were provided by the alluvial grains in all the morphological parameters.
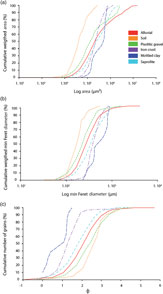
The OIA study allowed us to develop distribution curves of the parameters (Fig. 5). The curves revealed differences in data distribution according to the sample origin. In general, samples from the alluvial horizon, mottled clay, iron crust and gravel had a normal log distribution of area and minimum Feret diameter. It was not possible to establish distribution curves for the saprolite and soil samples, due to the low grain number.
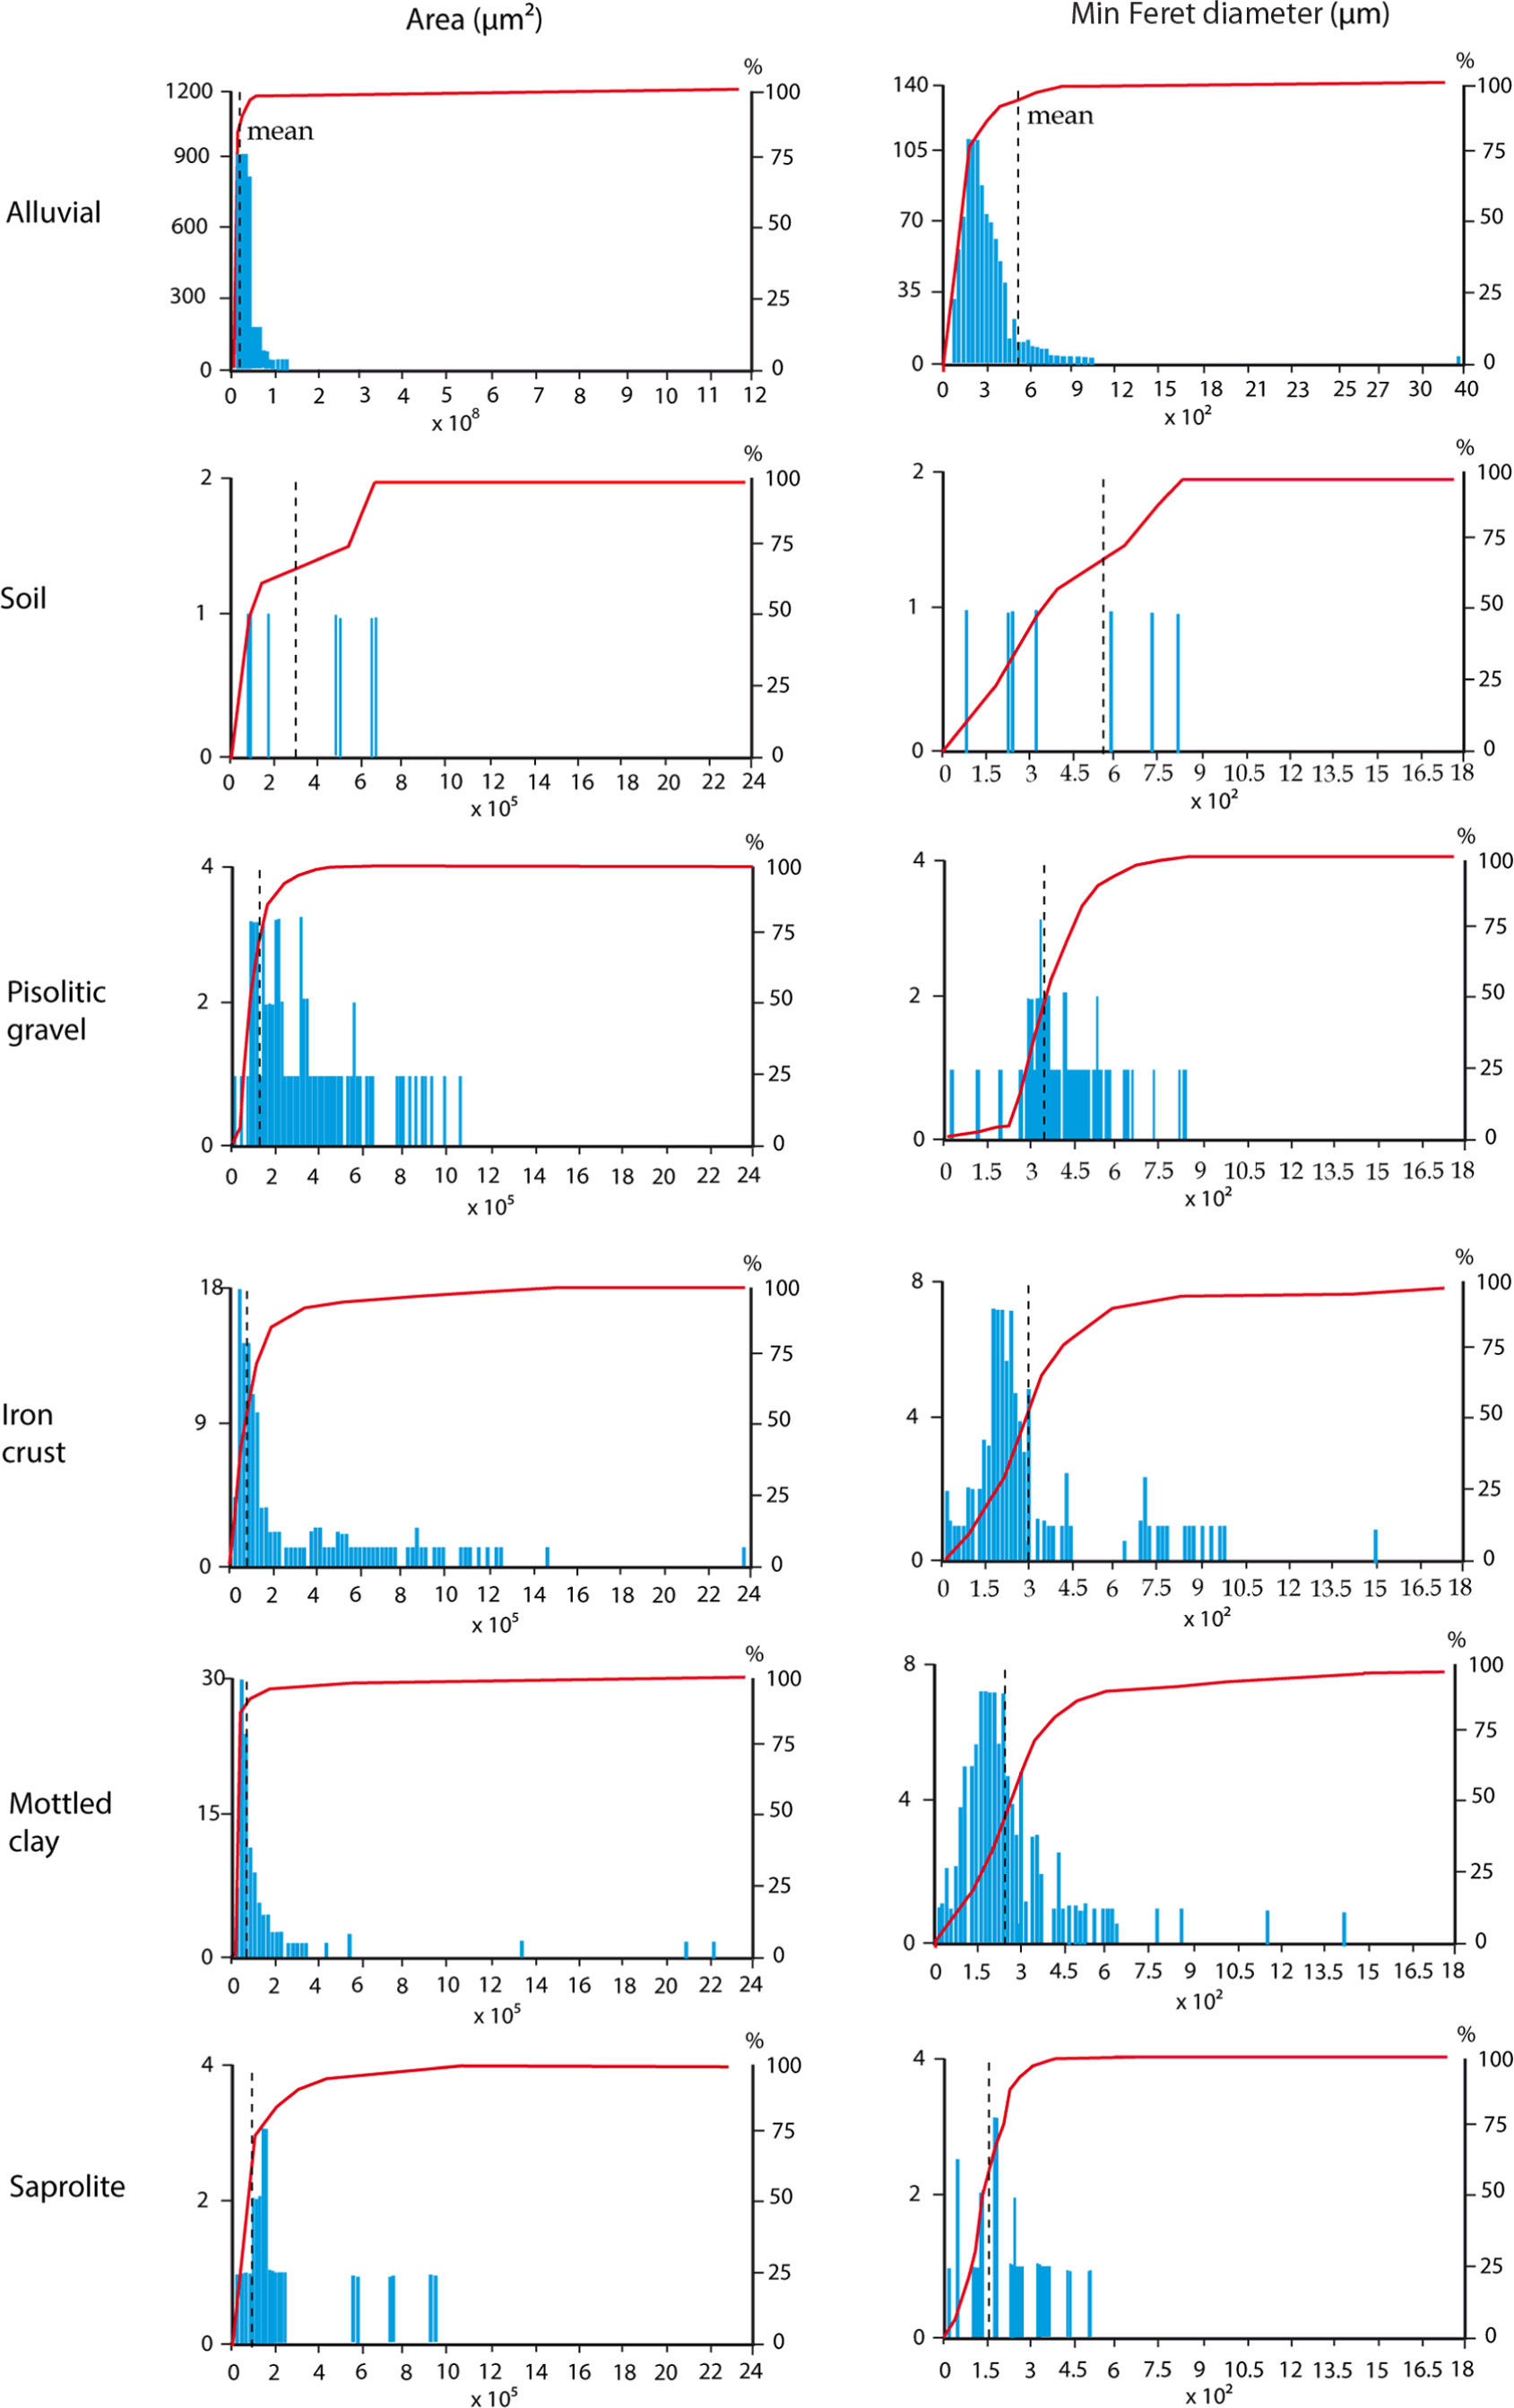
Fig. 5. Left column: frequency diagram of number of gold grains (left, blue bars) and cumulative number of grains (%, right, red line) versus grain area classes (μm2). Right column: frequency diagram of number of gold grains (left, blue bars) and cumulative number of grains (%, right, red line) versus gold grain minimum Feret diameter (μm) (red symbols).
Data describing relative cumulative area of the different horizons were represented as a function of size ranges on logarithmic scale in a single graph (Fig. 6a), which made it possible to visualize the differences in the distribution of samples of different origins. The same representation was made for minimum Feret diameter (Fig. 6b), obtaining similar results. For both parameters, a particular distribution pattern of lower values for the saprolite and higher values for the soil grains was observed. The cumulative frequency of grains using the Φ diameter (Fig. 6c) displays the opposite distribution, that is, lower values for the soil horizon and higher values for the saprolite.
Fig. 6. (a) Cumulative weighted gold grain area (%) versus gold logarithm of grain area classes (μm2). (b) Cumulative weighted gold grain minimum Feret diameter (%) versus logarithm of gold grain minimum Feret diameter (μm). (c) Cumulative number of gold grains (%) versus phi diameter.
The highest values of sorting were found in the iron crust grains, followed by the alluvial and mottled clays that have moderately sorted populations (following the terminology of Folk & Ward, Reference Folk and Ward1957). On the other hand, the soil horizon shows the lowest values of sorting followed by the pisolitic gravels, which have well-sorted populations. Finally, saprolite grains display intermediate sorting with a moderately well-sorted population.
4.b. Microchemical characterization
A total of 66 microchemical analyses were performed on 40 gold grains from all sampled horizons. The results compiled in Table 3 prove that fineness values are higher than 995, and Au contents (wt%) range between 95 and 99. According to Boyle (Reference Boyle1969), the grains can therefore be classified as native gold.
Table 3. Chemical composition of gold grains (wt%) from the study area determined by microprobe analysis as average values (range in parentheses)

The quantitative analyses did not reveal significant amounts of S, Fe, Co, Ni, Zn, As, Se, Sn, Sb, Te, Hg, Pb and Bi, with the exception of seven grains in which detectable concentrations (> 0.1%) of As (four grains) and Bi (five grains) were reported. Several inclusions detected in alluvial gold grains were identified as native bismuth or as an intermetallic compound (AuBi2). Internal heterogeneities of the gold grain cores are products of the variation in the Au/Ag content, mostly in the form of Ag-depleted rims (Fig. 7c). Most of these features were observed on scanning electron microscope (backscattered electron) images.
Less than half of the analysed grains contain detectable concentrations of Ag (> 1%); however, only 5% of the grains contain Ag in the range 3–8%, none of which belong to the upper horizons. Regarding the copper, 16 grains contain 0.5 wt% or more Cu; a maximum of 13.0% was found in a single alluvial grain, which probably represents an intermetallic compound (Au3Cu). High-Ag contents do not seem to be associated with Cu or other elements.
Visible low-silver rims were developed on some grains (Fig. 7c). Microprobe analysis indicates that the Ag content in the border is < 0.5 wt %, whereas this value can reach 8 wt% in the core of some grains. The contact between the Ag-poor rims and the central parts is generally sharp.
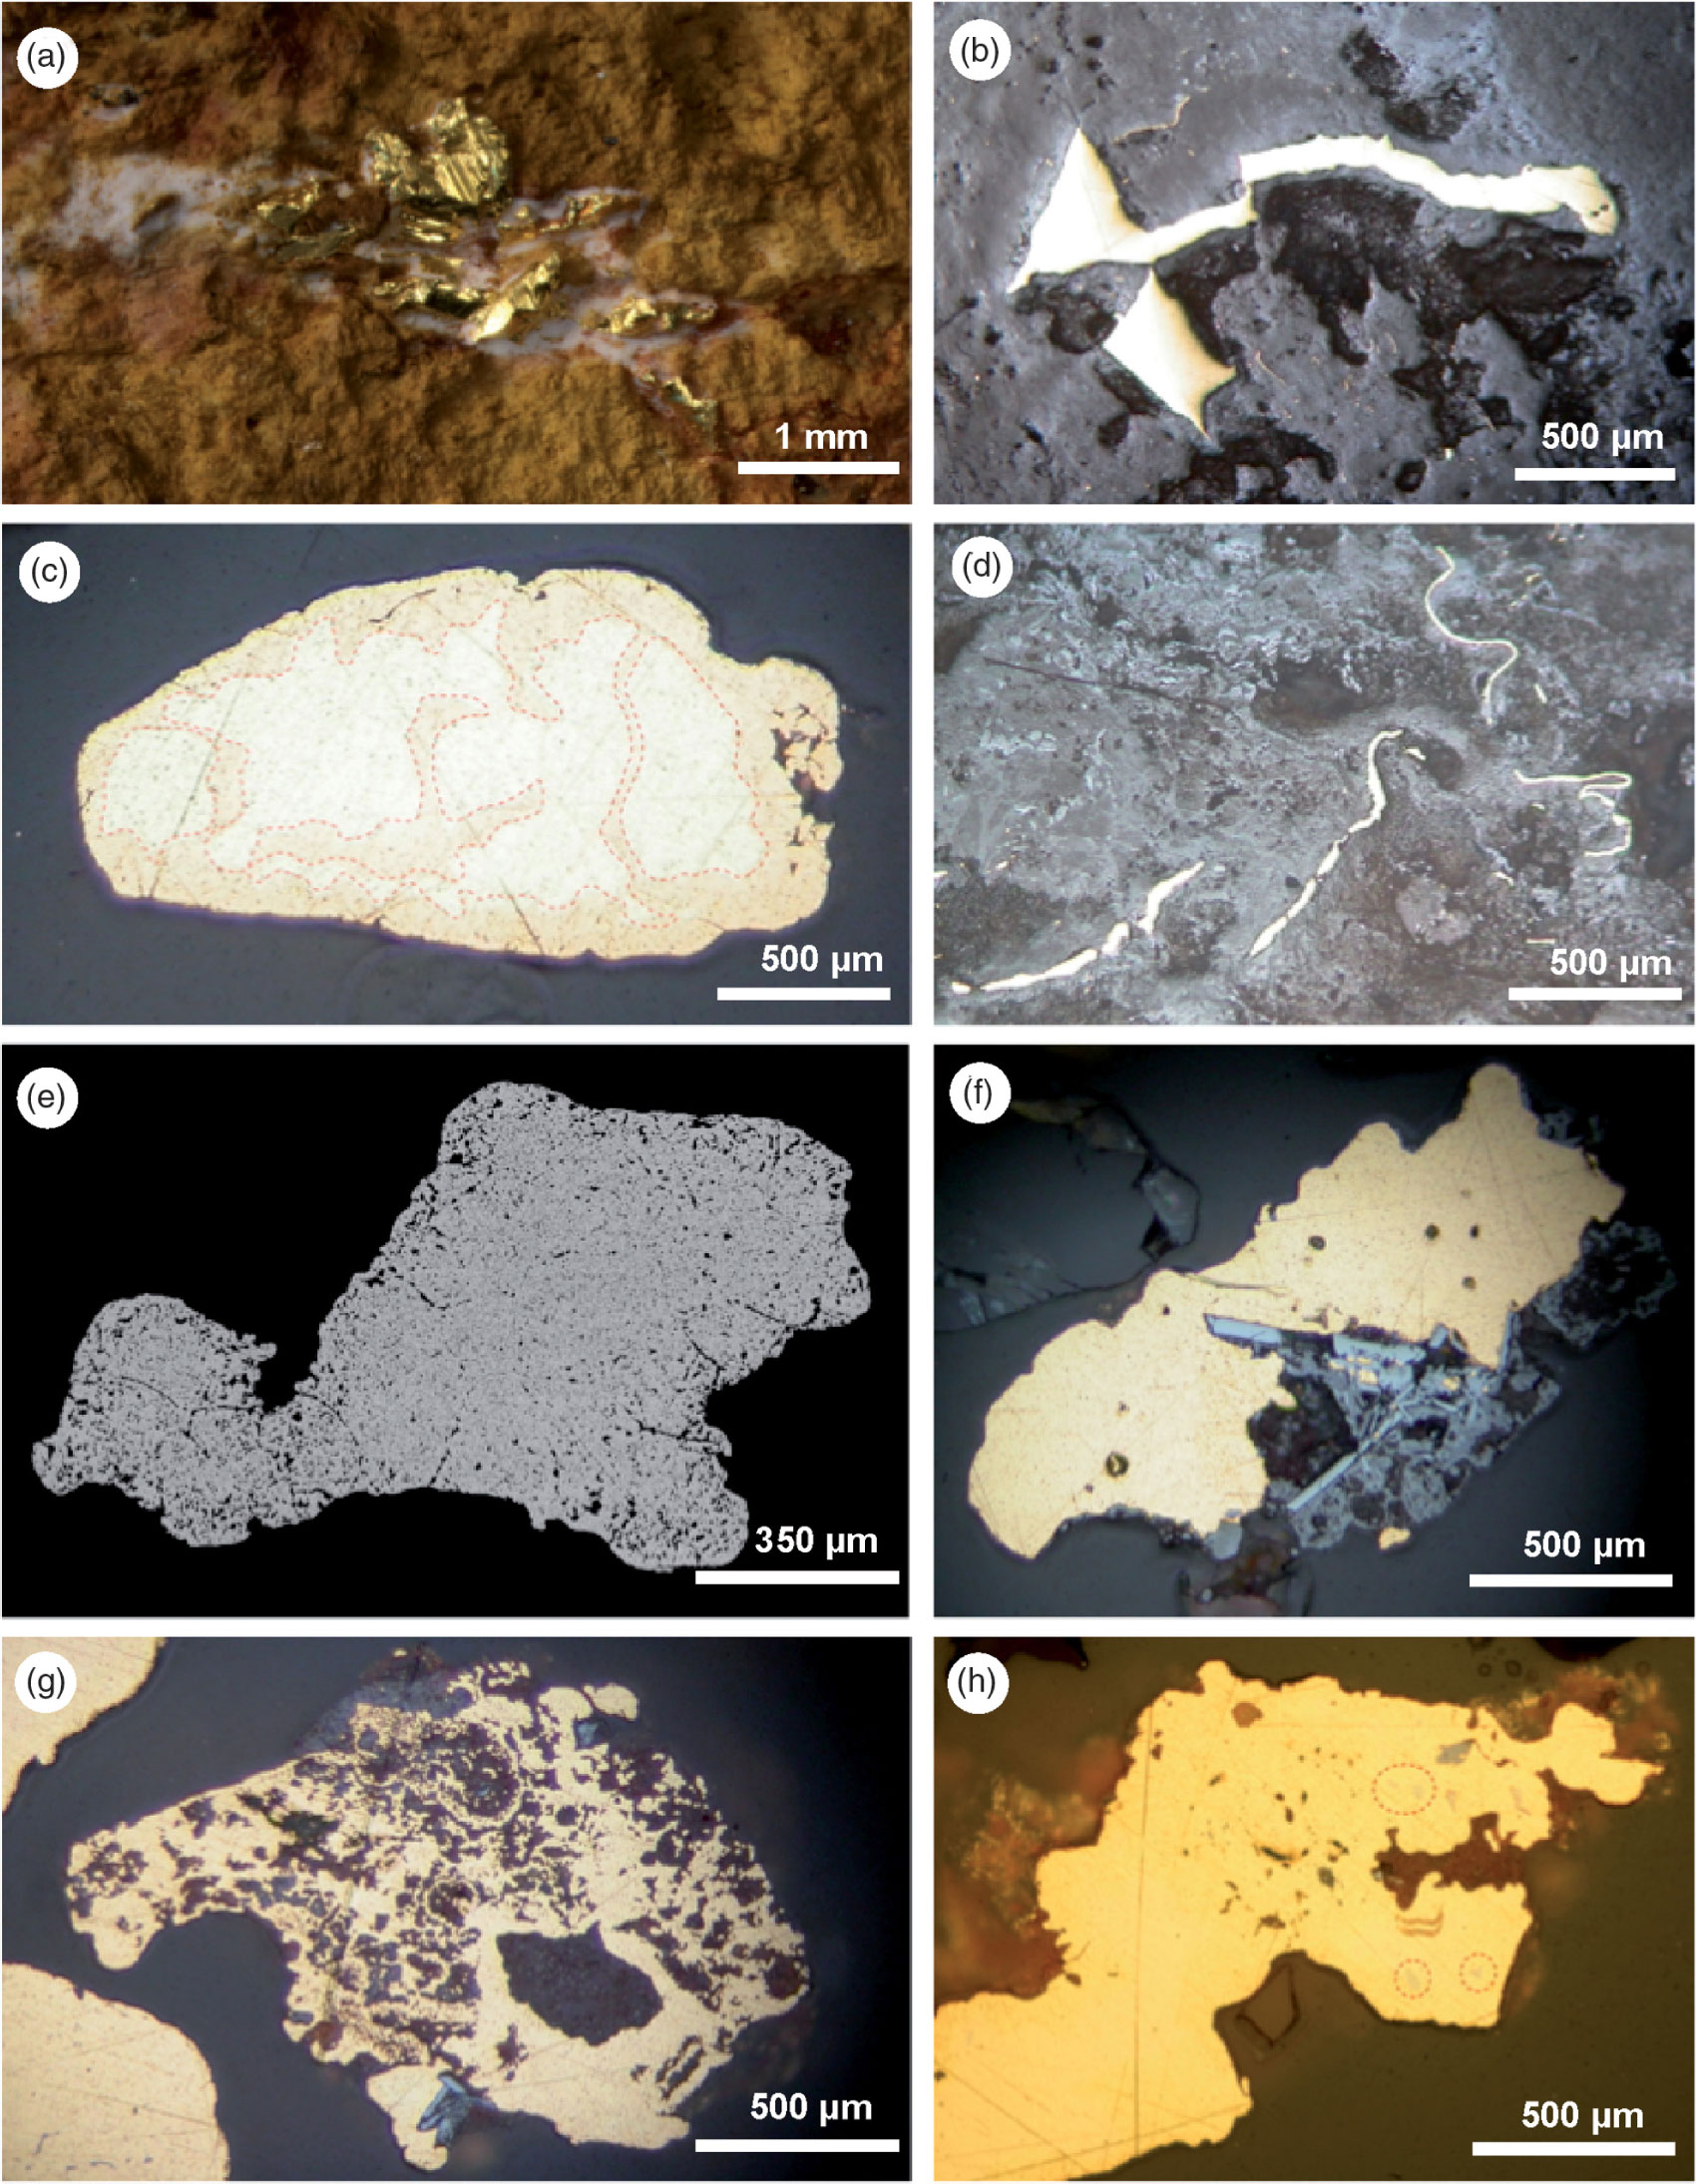
Fig. 7. (a–c) Microphotographs of gold embedded in the iron duricrust and (c, e–h) polished mounts of gold grains. (a) Gold crystals filling voids associated with amorphous silica. (b) Gold filling voids in lateritic matrix. (c) Alluvial gold grain showing external Ag-depleted rim (Au > 99.5%) with a complex penetrative pattern (grain coalescence?) of an Ag-rich core (Au < 95%). (d) Folded filamentous gold in the lateritic matrix. (e) Backscattered electron image of gold grain from soil showing a myrmekitic texture between gold and an already dissolved material (oxide or sulphide). (f) Intergrowth of gold with euhedral hematite crystals in a grain from the saprolite. (g) Intergrowth of gold, limonite and hematite in a grain from the mottled zone. (h) Inclusions of native bismuth and Au–Bi compound (red circles) in an alluvial gold grain.
The highest gold contents correspond to grains from soils, saprolite and iron crust horizons, while the largest variability of Au–Ag alloy was found in the alluvial and pisolitic gravels, both of which represent transported materials and therefore comprise a mix of populations from different sources.
The petrographic study of gold grains embedded in the iron crust (Fig. 7a) revealed gold in the form of large crystals in voids and fractures within the ferruginous lateritic matrix, with evidence of mechanical deformation (Fig. 7b, d). Apart from the iron duricrust, gold grains showed a close association with neo-formed Fe-oxides, such as partial intergrowths with hematite crystals (Fig. 7f) and discontinuous limonitic coatings (Fig. 7g), in the mottled zone and in the saprolite.
5. Discussion
5.a. Applicability of method
As a mineralogical quantification tool, OIA represents an important advance in ore characterization (Ehrlich et al. Reference Ehrlich, Kennedy, Crabtree and Cannon1984; Russ, Reference Russ1992; Pirard et al. Reference Pirard, Lebrun and Nivart1999; Castroviejo et al. Reference Castroviejo, Berrezueta and Lastra2002; Berrezueta & Castroviejo, Reference Berrezueta and Castroviejo2007; Grove & Jerram, Reference Grove and Jerram2011). Automated quantification of mineral phases by digital techniques is an appropriate procedure for systematic mineral quantification.
The systematic procedure presented in this paper is based on the identification of gold grains through the previous establishment of hue, saturation and brightness (HSB) values of their images. We opted for this system instead of others (e.g. RGB system) as a result of its optimal performance in previous studies (Grove & Jerram, Reference Grove and Jerram2011; Berrezueta et al. Reference Berrezueta, Ordóñez-Casado, Bonilla, Banda, Castroviejo, Carrión and Puglla2016). According to Lane et al. (Reference Lane, Martin and Pirard2008), colour images of opaque minerals are often sufficient to make a clear distinction between the target and other phases. In the studied case, gold was easily distinguished.
In order to ensure the reproducibility of the measurements, a rigorous image acquisition and grain segmentation protocol was followed (Berrezueta et al. Reference Berrezueta, González-Menéndez, Ordóñez-Casado and Olaya2015). Images were acquired using fixed controls of constant values for lighting intensity and exposure times following the specification proposed by Pirard (Reference Pirard, Lebrun and Nivart1999). After obtaining optimal acquisition conditions, the segmentation ranges of the gold grains were established in accordance with a previous study on sampling windows on gold grains. These ranges were introduced in an automated quantization routine for the generation of binary images (1, gold; 0, others).
5.b. Experimental results
The obtained morphological and compositional results were compared with other cases in similar weathered terrains. A generally accepted hypothesis is that the coarser gold in lateritic profiles is primary and residual, whereas secondary gold appears as pristine micron-size euhedral crystals, spherulites, delicate dendrites or overgrowths over primary grains (Butt, Reference Butt, Doyle, Glover and Groves1984; Mann, Reference Mann1984; Wilson, Reference Wilson1984; Freyssinet et al. Reference Freyssinet, Zeegers, Tardy and Maignien1987, Reference Freyssinet, Zeegers and Tardy1989; Santosh et al. Reference Santosh, Philip, Jacob and Omana1992; Butt & Hough, Reference Butt and Hough2006). On the other hand, other authors have reported secondary gold in iron crusts occurring in the form of lateritic nuggets, of millimetric size, very high fineness (assaying less than 0.1% Ag) and close association with the lateritic matrix (dos Santos, Reference Dos Santos1984; Michel, Reference Michel1987; de Oliveira & Campos, Reference de Oliveira and Campos1991; Smith & Anand, Reference Smith, Anand, Butt and Zeegers1992; Larizzatti et al. Reference Larizzatti, de Oliveira and Butt2008).
Gold has been reported in all horizons from the studied deeply weathered profile, present as residual, colluvial and alluvial particles. Most of the grains exhibit corrosion and pitting features, evidencing strong weathering processes of dissolution and re-precipitation in supergene environment. The size and morphology of alluvial gold grains suggest little transportation. It was possible to define distinctive features associated with each weathering horizon. The biggest differences were found in grain size, sorting, surface texture, shape and composition between the residual materials (saprolite, mottled clays and iron crust) and the transported materials (pisolitic gravel, yellow latosol and alluvial deposits).
The soil and the gravels have the lowest size-sorting values of all levels in the profile. The values obtained for these two horizons (0.478 and 0.485, respectively) are almost 50% lower than the values of the other groups. Pisolitic gravels also show the lowest values of aspect ratio and the highest values of roundness, as expected for particles that have been transported. This provides new evidence for the aeolian and/or colluvial origin for the upper horizons, given that physical transport most likely contributed to the grain size selection, flattening and surface smoothing. The same is proved by the perimeter versus area ratio, which clearly decreases from saprolite to soil, indicating the smoothing of grain outlines, typical in materials subjected to physical transport. Likewise, mean gold grain size increases notably upwards in the section, with a maximum in the latosol (c. 308 000 μm2) and in the lateritic gravel horizon (c. 171 000 μm2) and a minimum in the saprolite (c. 31 000 μm2 average area) and the mottled zone (c. 65 000 μm2 average area). In most of the lateritic profiles that directly overlay the mineralized bedrock, gold grains decrease in size and are progressively affected by dissolution towards the top of the profile (Edou-Minko, Reference Edou-Minko1988; Colin et al., Reference Colin, Lecomte and Boulange1989; Freyssinet et al., Reference Freyssinet, Zeegers and Tardy1989; Bowell, Reference Bowell1992; Suh & Lehmann, Reference Suh and Lehmann2003; Butt & Hough, Reference Butt and Hough2006). In the present study, the observed tendency is the opposite: the smallest grain size was found in the saprolite and mottled zone, whereas, towards the surface, all the evaluated size parameters increase. The gold sampled from the iron crust appears in the form of large secondary grains and nuggets filling cavities and fractures. Ramanaidou et al. (Reference Ramanaidou, Horwitz and Morris1991) and Ouangrawa & Yongue (Reference Ouangrawa and Yongue2001) reported this same vertical distribution and consider that the gold enrichment in the lateritic horizon was influenced by other processes apart from chemical re-precipitation, very likely gravitational deposition of gold grains by mechanical reworking during lateritization processes.
Large amounts of gold grains were collected from the stream sediments of the studied area. More than 6000 particles were studied, and it is evident that they share many physical and compositional features with the lateritic gold, such as size distribution, irregular outline, rugged and corroded surface due to pitting, abundance of embayment and limolitic coatings, among others. These common features suggest that the active erosion in the area disintegrates the lateritic formations on the hills and ridges and contributes to the release of the gold particles, which then are collected by artisanal miners in drainages. For the grains sampled in the stream headwaters, the short transport distance is usually not enough to imprint the typical changes associated with transportation. Nevertheless, these morphological features evolve in the first 500 m from the source, showing progressive increments in flatness, folding and surface smoothing.
Alluvial gold grains collected from the headwaters seem to have inherited most of the lateritic gold features, such as high fineness, large size, branched outlines, limonitic coatings and superficial corrosion. Although some grains exhibit primary textures, for most of the studied grains the origin is associated with the erosion and disaggregation of the iron crusts and the rest of weathered horizons. These morphological features evolve in the first 500 m from the source displaying a progressive increment in flatness, sphericity, folding and surface smoothing.
Grains from iron crust, soil and saprolite horizons reveal the highest fineness of gold, while the highest variability of the Au–Ag alloy was found in the alluvial and pisolitic gravels, both of which represent transported materials and therefore comprise a mix of populations from different sources. Although the Archean deposits are characterized by a high and consistent average fineness and limited fineness range (Guindon & Nichols, Reference Guindon, Nichol and Pye1982; Von Gehlen, Reference Von Gehlen1983; Morrison et al. Reference Morrison, Rose and Jaireth1991; Chapman et al. Reference Chapman, Leake, Moles, Earls, Cooper, Harrington and Berzins2000), the low content (or even the total absence) of silver, found in many grains across the Minvoul weathered profile, strongly suggests a supergene origin for a large portion of the analysed grains.
6. Conclusions
The proposed quantification procedure of gold particles through OIA represents an efficient and reproducible approach in the identification and automated measurement of particles. The application of this technique allowed us to identify variations across the weathered profile. Regarding the grain size, there is a clear and progressive increase towards the surface from the relict particles of the saprolite to the coarse grains found in the duricrust. Gold is generally dissolved, as demonstrated by corrosion features on the surface of the particles. The dissolution is more intense in the saprolite and mottled zone, also proven by the perimeter/area morphological parameter which diminishes from bottom to top. Gold grains collected from the streams of the studied area share many physical and compositional features with the lateritic gold, such as size distribution.
Based on morphological criteria (i.e. size distribution, sorting, shape) and on field-scale structural relationships observed in pits and trenches, the soils and pisolitic gravel horizons were interpreted as an accumulation of transported materials (colluvial and/or alluvial).
The microchemical analyses yielded a native gold composition, with low Ag and Cu contents. In iron duricrust, high fineness (> 995 in average) together with the size and textural relationship between gold and the neoformed hematite and limonite suggests a strong contribution of secondary gold.
Acknowledgements
This publication was authorized by the management of Craton del Congo Exploraciones, SARL. The samples used in the present study were collected as part of the exploration activities carried out in the G9-580 Minvoul Permit of the aforementioned company during 2015 and 2016. Special thanks are due to the National Directorate of Mines and Geology of the Ministry of Industry and Mines of Gabon and to Javier Riera Táboas, José Antonio Espí, Ricardo Castroviejo, Ambroise Edou-Minko, Begoña Amandi, Laura Gonzalez Acebrón and Carlos Pérez Garrido for their valuable personal, technical and scientific support. We also would like to thank the editorial office of the Geological Magazine and Elaine Rowan for the editorial handling and the two reviewers (anonymous and Dennis Thiéblemont) for their constructive comments and corrections.