1. Introduction
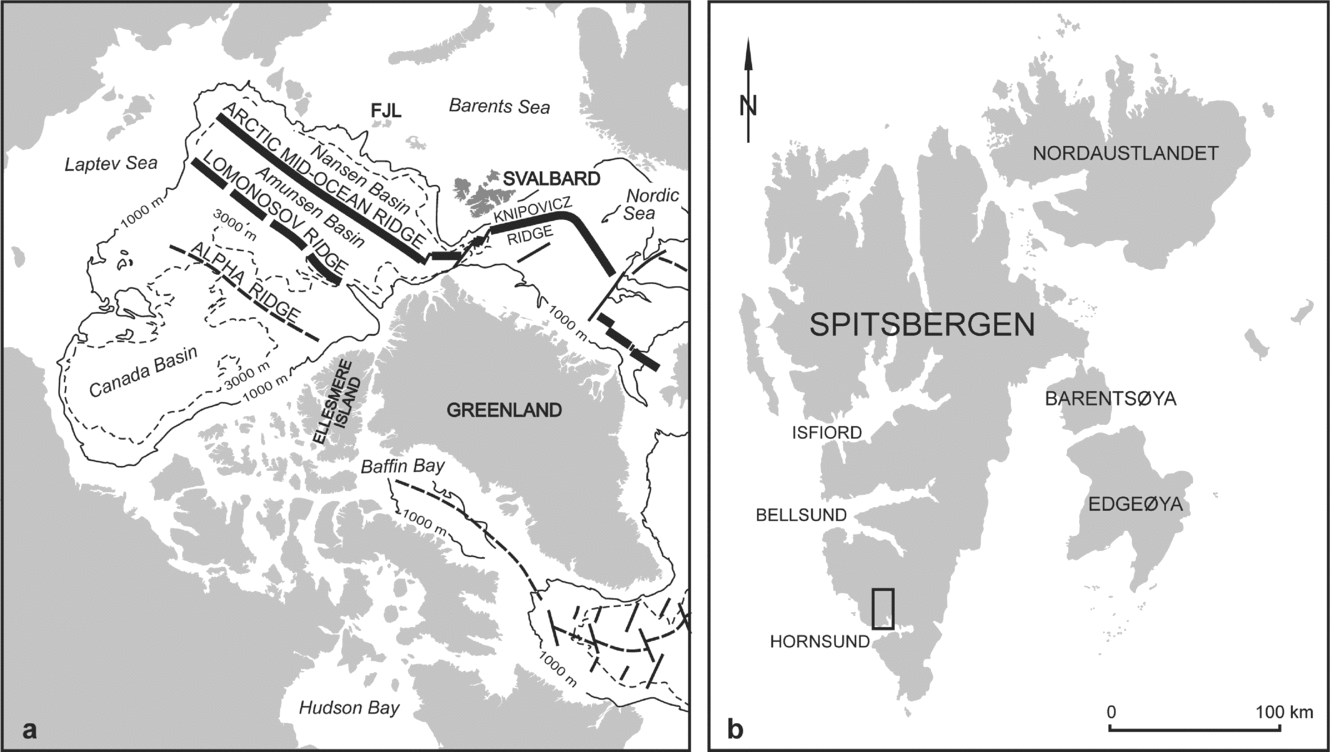
The Svalbard Archipelago, which lies on the northwestern corner of the Barents Sea–East European Platform (Fig. 1), has a pre-Caledonian basement that consists of a mosaic of crustal blocks or ‘terranes’ that differ significantly in their lithological, tectonic and metamorphic characteristics (e.g. Harland, Reference Harland1997; Gee & Tebenkov, Reference Gee, Tebenkov, Gee and Pease2004). These crustal blocks are separated by major, N–S-trending fault zones that are commonly taken to represent the terrane boundaries (Harland & Wright, Reference Harland and Wright1979; Harland, Reference Harland1997; Mazur et al. Reference Mazur, Czerny, Majka, Manecki, Holm, Smyrak and Wypych2009). Although much has been done to correlate the lithologies and tectonothermal events exhibited by the Svalbard terranes with those found in similar aged rocks in the Laurentian and Baltican plates, the Early Palaeozoic positions of the Svalbard terranes and the timing of their final amalgamation remains controversial (e.g. Birkenmajer, Reference Birkenmajer1975; Harland & Wright, Reference Harland and Wright1979; Harland, Reference Harland1997; Lyberis & Manby, Reference Lyberis and Manby1999; Gee & Tebenkov, Reference Gee, Tebenkov, Gee and Pease2004).
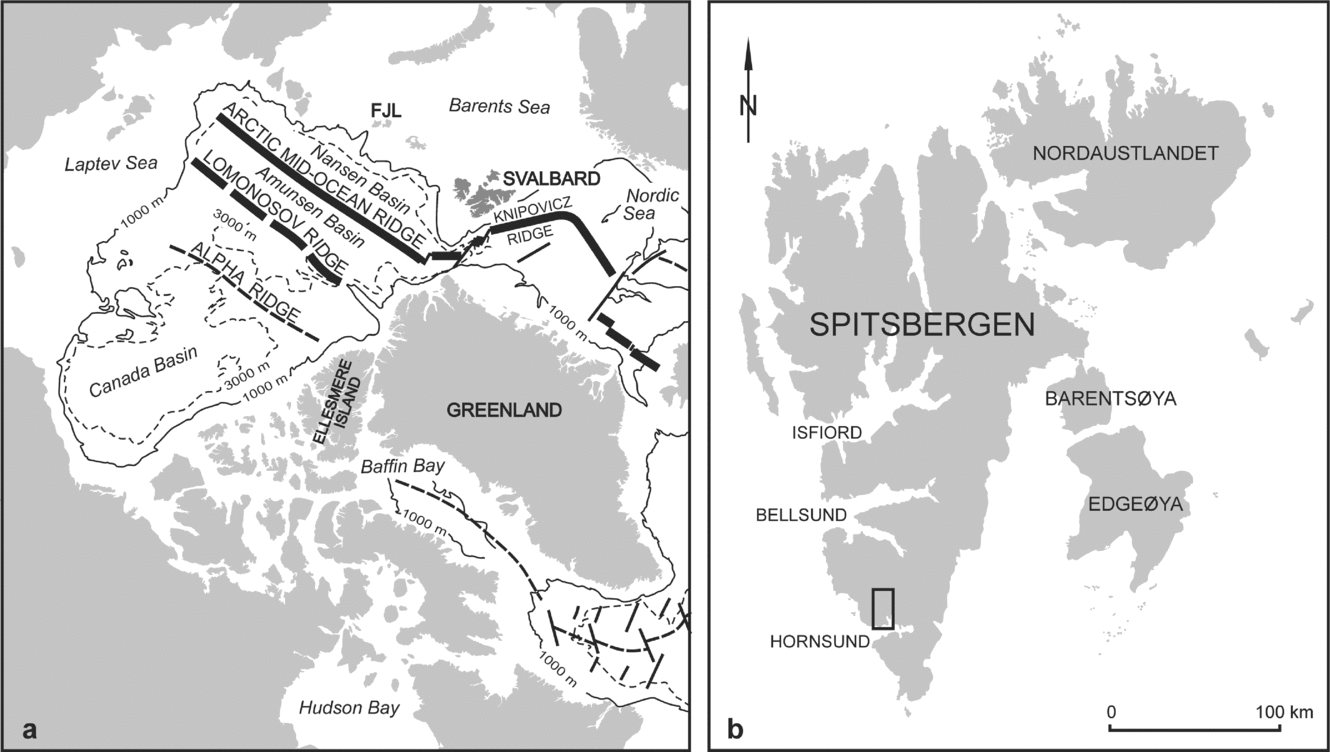
Figure 1. (a) Location of Svalbard in the present Northern Atlantic/Arctic geotectonic system (map after Srivastava, Reference Srivastava1985); FJL – Franz Joseph Land. (b) Contour map of the Svalbard Archipelago; the area of investigation is marked by a square.
According to Harland & Wright (Reference Harland and Wright1979) and Harland (Reference Harland1997) the major terranes of Svalbard occupied widely disparate positions along the eastern and northeastern margins of Greenland until Late Devonian times (Fig. 2a). The amalgamation of these terranes was accommodated by large-scale (c. 1000 km) sinistral strike slip motion along the bounding fault zones after the main collision between Baltica and Laurentia. Gee & Page (Reference Gee and Page1994), Lyberis & Manby (Reference Lyberis and Manby1999) and Gee & Tebenkov (Reference Gee, Tebenkov, Gee and Pease2004) have suggested, alternatively, that most of the Svalbard terranes were already amalgamated by Late Silurian time off the NE Greenland margin. The tectonic escape-like motions along the bounding faults and final assembly of the Svalbard terranes are interpreted to be a consequence of the oblique Baltica–Laurentia collision (Gee & Page, Reference Gee and Page1994; Lyberis & Manby, Reference Lyberis and Manby1999).
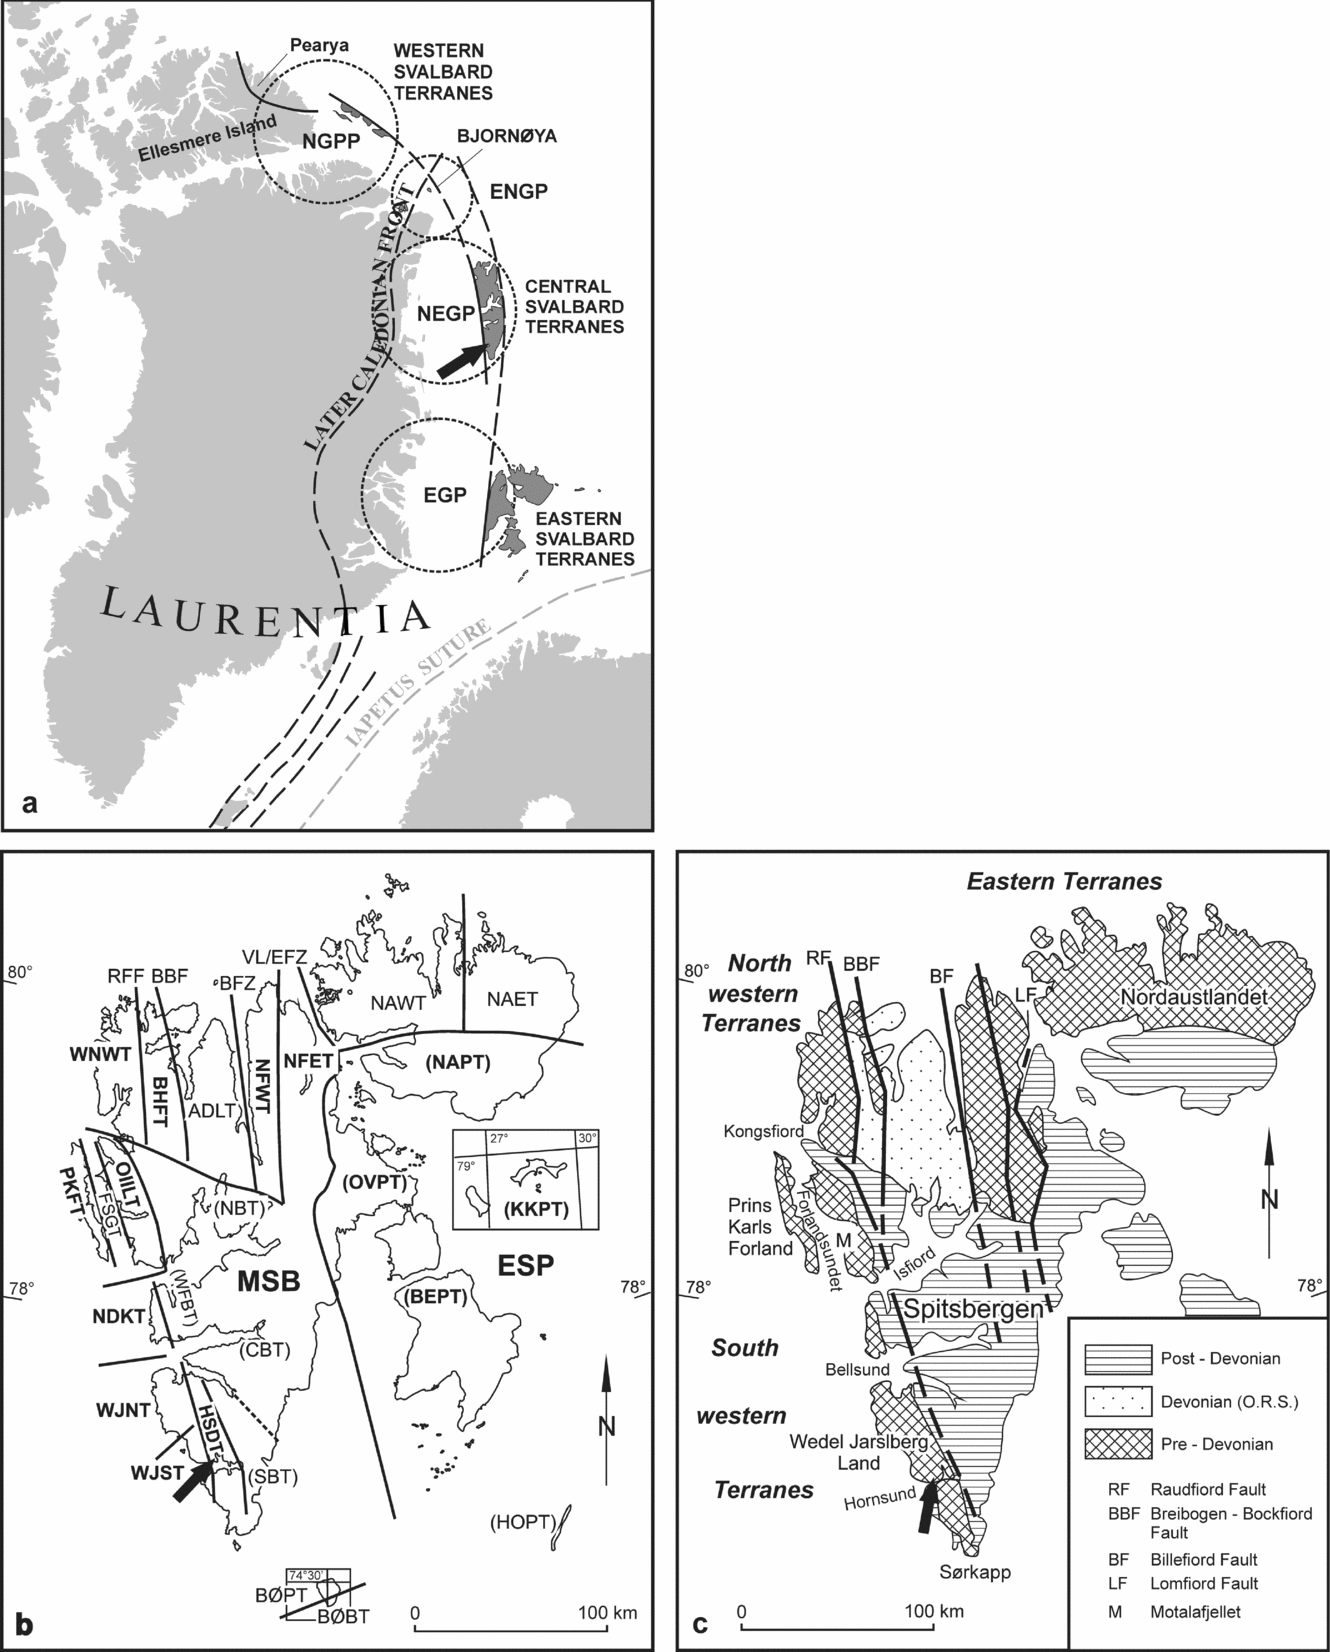
Figure 2. (a) Dispersion of Svalbard terranes along the margins of Greenland in Silurian times (after Harland, Reference Harland1997); provinces are encircled: EGP – East Greenland Province; NEGP – Northeast Greenland Province; ENGP – Eastern North Greenland Province; NGPP – North Greenland–Pearya Province. (b) Terranes of Svalbard; division after Harland (Reference Harland1997); abbreviations: Eastern basement terranes: NAET – Nordaustlandet Eastern Terrane; NAWT – Nordaustlandet Western Terrane; NFET – Ny Friesland (including Olav V Land) Eastern Terrane; NFWT – Ny Friesland Western Terrane. Central basement terranes: ADLT – Andrèe Land-Dickson Land Terrane; BHFT – Biskayerfonna–Holtedahlfonna Terrane; WNWT – Northwest Spitsbergen Terrane; HSDT – Hornsund Terrane. Western basement terranes: PKFT – Prins Karls Forland Terrane; FSGT – Forlandsundet Graben Terrane; OIILT – Oscar II Land Terrane; NDKT – Nordenskiöldkysten–Nordenskiöld Land Terrane; WJNT – NW Wedel Jarlsberg–North of Torellbreen Terrane; WJST – SW Wedel Jarlsberg Land–South of Torellbreen Terrane. Southern basement terrane: BØBT – Bjørnøya Basement Terrane. Cover terranes: (post-Devonian sequences): CBT – Central Basin Terrane; NBT – North Basin Terrane; WFBT – Western Fold Belt/Basin Terrane; SBT – Southern Basin Terrane; NAPT – Nordaustlandet Platform Terrane; OVPT – Olav V Land Platform Terrane; BEPT – Barentsøya and Edgeøya Platform Terrane; KKPT – Kong Karls Land Platform Terrane; HOPT – Hopen Platform Terrane; BØPT – Bjørnøya Platform Terrane; MSB – Main Spitsbergen Basin; ESP – Eastern Svalbard Platform. Fault Zones: RFF – Raudfjorden; BBF – Breibogen; BFZ – Billefjorden; VL/EFZ – Veteranen Line (name after Harland, Reference Harland1997)/Eolussletta Fault Zone (name after Lyberis & Manby, Reference Lyberis and Manby1999). (c) Terranes of Svalbard; division after Gee & Teben'kov (Reference Gee and Page2004); in all three presented maps the sampled area is indicated by arrows.
While most reconstructions consider the Svalbard terranes to have been distributed along the eastern margin of Laurentia until Late Palaeozoic time, the timing of their incorporation into Baltica remains unresolved (Roberts, Reference Roberts2003; Torsvik & Cocks, Reference Torsvik and Cocks2005; Cocks & Torsvik, Reference Cocks and Torsvik2005). The location of the Baltica–Laurentia suture also remains controversial, with some authors suggesting that it cuts the Svalbard block at depth beneath the Billefjorden Fault Zone (BFZ; Breivik et al. Reference Breivik, Mjelde, Grogan, Shimamura, Murai, Nishimura and Kuwano2002, Reference Breivik, Mjelde, Grogan, Shimamura, Murai and Nishimura2003) or that it was situated on the Barents Shelf between Scandinavia, Svalbard and Franz Joseph Land (e.g. Harland & Gayer, Reference Harland and Gayer1972; Gee & Tebenkov, Reference Gee, Tebenkov, Gee and Pease2004). The presence of meta-igneous complexes with destructive plate margin affinities such as the Vestgötabreen blueschists (Horsfield, Reference Horsfield1972; Manby, Reference Manby1978; Ohta, Reference Ohta1979; Hirajima et al. Reference Hirajima, Banno, Hiroy and Ohta1988) of Central Western Svalbard, while clearly representing a subduction zone fragment, do little to inform us as to the position of the suture because of subsequent tectonism. Offshore seismic reflection profiling (Breivik et al. Reference Breivik, Mjelde, Grogan, Shimamura, Murai and Nishimura2005; Barrére, Ebbing & Gernigon, Reference Barrère, Ebbing and Gernigon2009) on the Barents Shelf to the south of Svalbard and the aeromagnetic studies (Skilbrei, Reference Skilbrei1992) have also failed to confirm, unequivocally, the geographic position of the suture. What is certain is that Svalbard is traversed by major N–S-trending fault zones that are associated with abundant evidence of ductile to brittle sinistral shearing, and retrogression of higher grade metamorphic mineral assemblages imposed, without exception, in Caledonian time (sensu lato; see Manby, Reference Manby1990; Lyberis & Manby, Reference Lyberis and Manby1999).
Since palaeomagnetism is the only method capable of quantifying the past coordinates of crustal blocks, it would appear, therefore, to present an ideal means to test the various hypotheses concerning the Late Precambrian–Palaeozoic palaeogeography of Svalbard. There is, however, an important limitation to this method in that the Caledonian metamorphism and deformation has extensively altered the relevant rocks’ materials throughout Svalbard. As the palaeomagnetic record is based on the rule of ‘closure process’, taking place at the critical temperature below which the system of magnetic domains became stable (e.g. Butler, Reference Butler1992, pp. 56–64; Tauxe, Reference Tauxe1996, pp. 57–8; Dunlop & Özdemir, Reference Dunlop and Özdemir1997, pp. 201–62), the characteristic remanent magnetization (ChRM) components which were magnetized before Caledonian heating and deformation events could be overprinted by younger directions. Although there may be some Lower Palaeozoic sequences still carrying the primary ChRM components, it is likely that the primary pre-Caledonian directions have been re-magnetized completely. Nonetheless, even in these places secondary components, related to Caledonian thermal events, can still provide some important constraints on the reconstructions, when they are supported by robust isotopic age determinations.
In this contribution new palaeomagnetic data are presented from Cambrian rocks of the Hornsund region of SW Svalbard (Fig. 1b) that focus, for the first time, on the Lower Palaeozoic palaeomagnetic record of Svalbard in the context of the major Caledonian metamorphic and tectonic events. Investigations of the natural remanent magnetization (NRM) vectors have been supported by detailed rock magnetic, optical microscope, scanning electron microscope (SEM) and electron-probe microanalyses.
The results of 40Ar–39Ar isotope analyses from mylonites developed along the BFZ are discussed here together with additional field and published palaeomagnetic data from Ny Friesland (Eastern Terrane), which lies between Baltica and the Hornsund region (Central Terrane), as they will shed further light on the timing of movement along the BFZ and the amalgamation of the Central and Eastern Terranes of Svalbard.
This study is part of an on-going project that seeks to reconstruct the changing positions of the major terranes of Svalbard in the Late Precambrian–Late Palaeozoic interval.
2. Tectonic setting and structure
The main target area for the present study is located in the southeastern part of Wedel Jarlsberg Land, north of Hornsund, Southern Spitsbergen (Fig. 1b). Tectonostratigraphically, the Lower Palaeozoic rocks of this region belong to the Hornsund Terrane (HSDT; see Harland, Reference Harland1997), which constitutes part of the Central Terrane of Svalbard (CTS; Harland & Wright, Reference Harland and Wright1979; Fig. 2b). Following Harland (Reference Harland1997), the western boundary of the HSDT is defined by the NNW–SSE-trending Kongsfjord–Hansbreen Fault Zone (KHFZ). West of this fault is the Wedel Jarlsberg Land–South of Torellbreen Terrane (WJST), which forms part of the Western Terrane of Svalbard (WTS; Harland & Wright, Reference Harland and Wright1979). Gee & Tebenkov (Reference Gee, Tebenkov, Gee and Pease2004) do not consider, however, the KHFZ to be an important structure, but regard the pre-Devonian sequences of Central and SW Spitsbergen to constitute the Southwestern Terrane (Fig. 2c). Although the eastern boundary of the Palaeozoic HSDT (or Central Terrane) is buried beneath the Upper Palaeozoic–Mesozoic rocks in SW Spitsbergen, it is exposed to the north as the BFZ; this is described further in a later section.
Lithostratigraphically, the Lower Palaeozoic succession of Hornsund has been divided into the Cambrian (Sofiekammen Group) and the Ordovician (Sörkapp Land Group), which are separated by the Hornsundian unconformity (Birkenmajer, Reference Birkenmajer1978). The youngest Lower Palaeozoic rocks in the area are the Lower Ordovician Hornsundtinden limestones. Upper Ordovician and Silurian sequences are not preserved, and were probably eroded after the Caledonian uplift (Birkenmajer, Reference Birkenmajer1990; Ohta & Dallman, Reference Ohta and Dallmann1994). Trilobite fauna, showing Laurentian affinity and belonging to the Bonnia–Olenellus Zone (Birkenmajer & Orłowski, Reference Birkenmajer and Orłowski1977), have been found in scree from the exposures of the Slaklidalen Formation, suggesting late Early Cambrian deposition (Harland, Reference Harland1997).
The limestones of the Slaklidalen Formation (Sofiekammen Group), which were sampled for palaeomagnetic analysis (Fig. 3), are exposed on the opposite limbs of the Sofiekammen syncline (Birkenmajer, Reference Birkenmajer1978). The Sofiekammen syncline (Figs 3, 4a, b), in common with all of the major Caledonian fold structures of the Sofiekammen Group in Wedel Jarlsberg Land, is overturned with an eastward vergence.

Figure 3. Geological map of southwestern Wedel Jarlsberg Land (after Birkenmajer, Reference Birkenmajer1978); open circles indicate the locations where the pilot palaeomagnetic samples were collected in 1999–2000; palaeomagnetic sites collected in 2002 and 2004, situated on the opposite limbs of the Sofiekammen syncline, are marked by dots.

Figure 4. (a) Cross-section through the Sofiekammen syncline (after Birkenmajer, Reference Birkenmajer1978). (b) Photograph of the Sofiekammen syncline exposed on south slopes of Gnålberget, Hornsund; note that the syncline is overturned indicating tectonic transport to the east; on both cross-section and photograph palaeomagnetic sites KAMB 1, 2 and 5 are marked by dots.
Structurally, the Sofiekammen syncline, an F1 Caledonian fold, appears to have formed initially by a flexural slip mechanism modified by flattening and shearing as the fold ‘locked-up’ (Fig. 4b). In thin-section, the limestones exhibit a pervasive syntectonic, metamorphically driven, recrystallization of the matrix carbonate and ferromagnetic phases to produce a strong dimensional preferred orientation that defines the S1 axial planar foliation to this fold (Fig. 5). The sampled KAMB KAL A (Fig. 5) carbonate segregations, which lie in the S1 foliation, are rotated, flattened and sheared tension gashes that formed at an early (flexural slip) stage in the formation of the fold. The S1 cleavage is also affected by some weak kink-like centimetre-scale folding (Fig. 5d).

Figure 5. Textures of Slaklidalen Formation samples. (a) Early S1 parallel veins which may indicate high pore fluid pressures during their formation. KAMB KAL B veins that cut S1 at a high angle are themselves truncated by S1 suggesting a late D1 origin (macro section). (b) Limestone with synsedimentary breccia fabric. The S1 foliation and numerous early vein fillings wrap around the breccia fragments (macro section). (c) Early D1–F1 extensional veins rotated and flattened. The later veins cut the S1 foliation at a high angle but are themselves truncated by S1 in places indicating that deformation continued after these veins formed (macro section). (d) KAMB KAL A is seen as recrystallized, boudinaged, slightly folded and sheared relics of sigmoidal tension gashes that most likely originated early in the formation of the F1 Sofiekammen syncline. Also visible are traces of minor intrafolial F1 folds defined by concentrations of opaque iron ore minerals. The entire F1 axial planar foliation (S1) is mylonitic in character and the KAMB KAL A infillings have been rotated in near parallelism with the S1 foliation, which also exhibits some weak crenulation-like (F2) folds. These folds may simply be the result of the shearing process rather than a separate and later fold phase. All of this deformation would have coincided with the main Caledonian (M1) metamorphic event as the fold was progressively deformed (thin-section, Olympus binocular, transparent light). (e) KAMB KAL A is S1 parallel as in (d) while KAMB KAL B clearly cuts the S1 foliation. The KAMB KAL B veins, however, have been recrystallized and they are displaced by the S1. The KAMB KAL B veins are also cut by stylolitic surfaces indicating that they are late D1–F1–S1 and were emplaced before the S1 fabric was fully developed. The thinner high-angle veins that truncate the S1, which are themselves cut by KAMB KAL B veins, show small-scale crenulations that were certainly formed as a result of S1 parallel shearing combined with pressure solution generated volume loss. All of these structures reflect the continuing and progressive deformation of the Sofekammen syncline, which formed during the synkinematic Caledonian metamorphism (thin-section, Olympus binocular, transparent light).
The later KAMB KAL B sampled veins (Fig. 5), which cut the S1 axial planar cleavage surfaces, including the crenulation folds, are seen to be traversed occasionally by shear and pressure solution (stylolitic) surfaces, suggesting that these features formed at some late stage in the development of the S1 foliation. These veins are particularly concentrated on the shallow eastern limb of the Sofiekammen syncline. The rocks dip shallowly to the west, and the vein arrays reflect extension (Fig. 5c), possibly induced by nappe stacking and flattening of this fold limb. The high angle, with respect to the shallow S1, extensional fractures generated by the flattening became sites of the KAMB KAL B type carbonate-ferromagnetic mineral precipitation (Fig. 5a, e).
The limestones have recrystallized and they often exhibit sedimentary and tectonically induced brecciation that pre-dates the final development of the S1 foliation. Microscopic and microprobe observations reveal that these tectonized zones are enriched in silica, clay minerals, organic matter, dolomites, Fe sulphides and Fe, Ti oxides (Fig. 6c).

Figure 6. Ferromagnetic minerals distribution in Slaklidalen Fm samples. (a) Grains of magnetite (GEN A) in recrystallized carbonate matrix (thin-section, NIKON ore microscope, reflected light). (b) Grains of magnetite (GEN C) within calcite veins KAMB KAL B. The calcite has clearly recrystallized. The ferromagnetic grains have remained in situ and appear to have been enclosed by the recrystallized calcite with little or no re-orientation (thin-section, NIKON ore microscope, reflected light). (c) Fe, Ti oxides and Fe sulphides (GEN B) in the tectonized and brecciated fragments of sampled limestones (thin-section, BSE microprobe image; chemical composition of selected grains has been estimated by EDS analyses).
Subsequent post-Caledonian deformation events have affected much of the western and northern part of Svalbard including the rocks of the target area. The first deformation event is referred to as the Svalbardian folding or diastrophism and it is well recorded in the Devonian basin fill of Northern Svalbard (e.g. Manby & Lyberis, Reference Manby and Lyberis1992; Harland, Reference Harland1997). Devonian (Emsian) rocks, affected by deformation attributed to the Svalbardian event, are also found in SW Spitsbergen (Birkenmajer, Reference Birkenmajer1964), where they occupy a much smaller area than those to the north.
The Late Cretaceous–Early Paleocene West Spitsbergen Fold Belt (WSFB) deformation event was much more intense than that of Svalbardian age. It produced typical foreland fold-and-thrust belt structures, developed in the Upper Palaeozoic to Mesozoic rocks to the east of the study area. The effect of the WSFB deformation on the target rocks in the study area appears to have been confined largely to rigid block movements accommodated, at least in part, by the reactivation of pre-existing faults.
No thermally induced recrystallization or neomineralization (i.e. metamorphism) has been reported in the literature from any of the Upper Palaeozoic–Mesozoic rocks affected by the Svalbardian or the WSFB deformation events. Tessensohn, Henes-Kunst & Krumm (Reference Tessensohn, Henes-Kunst, Krumm and Tessensohn2001), using K/Ar techniques, concluded that the rocks of the WSFB, including SW Spitsbergen, and the Central Tertiary Basin never reached temperatures sufficient to cause any detectable recrystallization/neomineralization during their deformation.
A number of thermal events have occurred, however, within the Svalbard Archipelago at various intervals since Caledonian time. These events include Late Caledonian–Devonian granite plutons intruded into the Proterozoic rocks of NW Spitsbergen, Ny Friesland and Nordaustlandet, intrusion of Late Jurassic–Early Cretaceous basaltic dykes and sills at Hinlopenstretet (Halvorsen, Reference Halvorsen1989), Central (Vincenz et al. Reference Vincenz, Jeleńska, Aiinehsazian and Birkemajer1984) and Southern Spitsbergen (Vincenz et al. Reference Vincenz, Cossack, Duda, Birkenmajer, Jeleńska, Kądziołko-Hofmokl and Kruczyk1981) and eruption of Neogene lavas exposed in Andree Land (Harland, Reference Harland1997). Of these events, only the Late Caledonian (sensu lato) granite intrusions and associated migmatites of NW Spitsbergen (Harland, Reference Harland1997 and references therein) were associated with any extensive tectonothermal activity, albeit restricted to that terrane. The other igneous events are associated with only limited or no recognizable recystallization in the host rocks.
3. Sampling and laboratory procedures
3.a. Sampling and preparation for palaeomagnetic analyses
Field investigations in the area of Hornsund were undertaken in three stages. During the 1999–2000 season, 30 non-oriented pilot samples from five Lower Palaeozoic carbonate formations (Blåstertoppen Fm, Nordstetinden Fm, Slaklidalen Fm, Luciapynten Fm and Dusken Fm) were collected. The locations of the sampling sites in the Hornsund Terrane are shown in Figure 3. To select the most useful rocks for palaeomagnetic procedures, the following elements were investigated: (1) the intensity and structure of NRM; (2) changes of the magnetic susceptibility in the course of the thermal demagnetization process; and (3) the magnitude of the P′ parameter (corrected anisotropy degree after Jelinek, Reference Jelinek1977).
The limestones of the Slaklidalen Fm appeared to be the most promising for further analyses for the following reasons:
(i) The NRM components could be defined with high precision (in 90% of samples angular standard deviation (ASD) < 5°), up to the final stages of the demagnetization process, when the intensity of NRM decreased below 5*10−3 μA/m.
(ii) There was no significant change in the bulk susceptibility during thermal demagnetization suggesting that during heating the ferromagnetic mineral assemblages remained unchanged.
(iii) Of the samples investigated, 70% revealed a susceptibility signal below 10*10−6 SI that resulted in large errors of anisotropy parameters. In the remaining 30% of the samples with the susceptibility signal around 50–100*10−6 SI the P′ parameter was below 1.05, suggesting that the stress factor had only a minor, if any, influence on the alignment of the ferromagnetic fabric (Tarling & Hrouda, Reference Tarling and Hrouda1993).
Fieldwork in 2002 and 2004 concentrated on sampling the Slaklidalen Fm from the Caledonian Sofiekammen syncline (Figs 3, 4) with two sites on the steep overturned western limb and four sites on the shallow un-inverted eastern limb (Fig. 4). Each of the sites was 5–10 m in diameter and included three to five beds. A total of 41 palaeomagnetic rock samples with the minimum dimension of 15 cm2 were independently oriented using a magnetic compass and retrieved from the fresh rock using a geological hammer (6–7 block samples from each site).
Cylindrical samples for further analyses were prepared in the Department of Geomagnetism Laboratory of Palaeomagnetism, at the Institute of Geophysics, Polish Academy of Science (IGF PAS). From each of 41 oriented blocks up to five cylindrical cores 2.4 cm in diameter and 2.2 cm in length were drilled for the Lowrie test (sensu Lowrie, Reference Lowrie1990) and demagnetization experiments. From each site additional small cylindrical cores (6 × 8 mm) and irregular samples up to 1 mm in diameter were prepared for rock magnetic study.
3.b. Identification of magnetic minerals
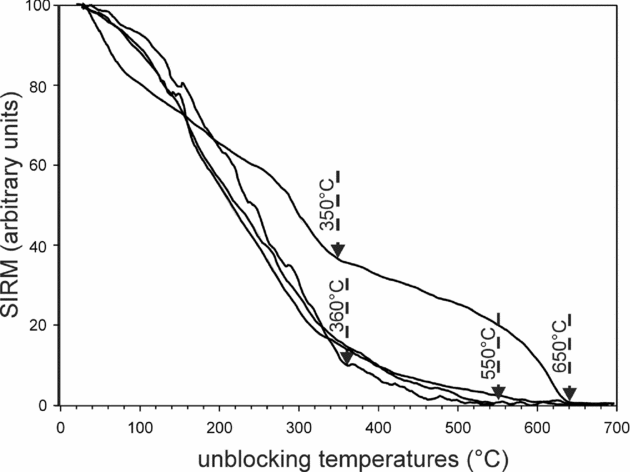
An initial evaluation of maximum unblocking temperatures (Tub max) of ferromagnetic minerals was based on SIRM (saturation isothermal remanent magnetization) decay curves (procedure after Kądziałko-Hofmokl & Kruczyk, Reference Kądziołko-Hofmokl and Kruczyk1976). Small cylindrical cores (6 × 8 mm) were magnetized in a 7 T field using a MMPM–10 (magnetic measurements pulse magnetizer). The cores were subsequently heated in the furnace combined with a spinner magnetometer up to 700°C in a field-free space. The decay of the initial magnetic signal during heating and identification of the Tub max of particular magnetic minerals found in the samples could be observed on the thermal demagnetization curves (Fig. 7).
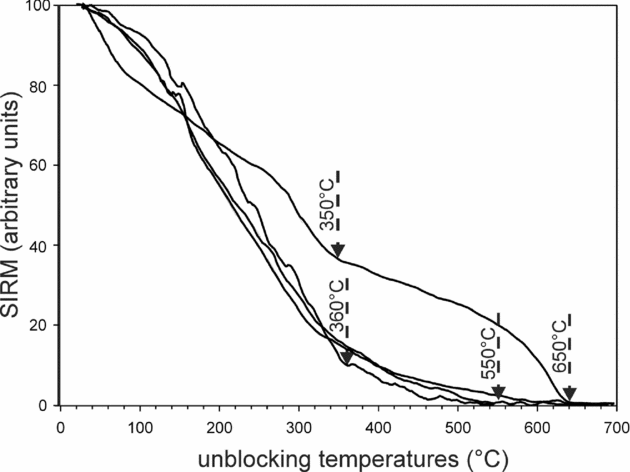
Figure 7. Examples of SIRM (saturation isothermal magnetization) analyses of the Slaklidalen Fm samples. Characteristic temperatures on demagnetization curves reflecting unblocking temperatures of ferromagnetic minerals existing in the samples are indicated by arrows.
A more detailed determination of Tub max and coercivity spectra of ferromagnetic minerals was based on the three-component IRM (isothermal remanent magnetization) procedure described by Lowrie (Reference Lowrie1990). At first, 21 cylindrical cores (2.4 × 2.2 cm) representing all six sites were subjected to gradual magnetization along the z-axis at room temperature up to 2.9 T (limit of the coercivity of hard magnetic phases like haematite) using the MMPM–10 magnetometer. After each magnetization step the IRM of the samples was measured on the Superconducting Quantum Interference Device (SQUID, 2G Enterprise model 755, USA) with a residual internal field of below 3 nT and a noise level of about 5 μA/m. The induced IRM versus increasing applied field diagrams (Fig. 8) provided the first estimation of coercivities of the samples.

Figure 8. Examples of IRM (isothermal remanent magnetization) analysis of Slaklidalen Fm samples. Dotted lines represent samples that were not saturated in the maximum applied field (H = 2.9 T).
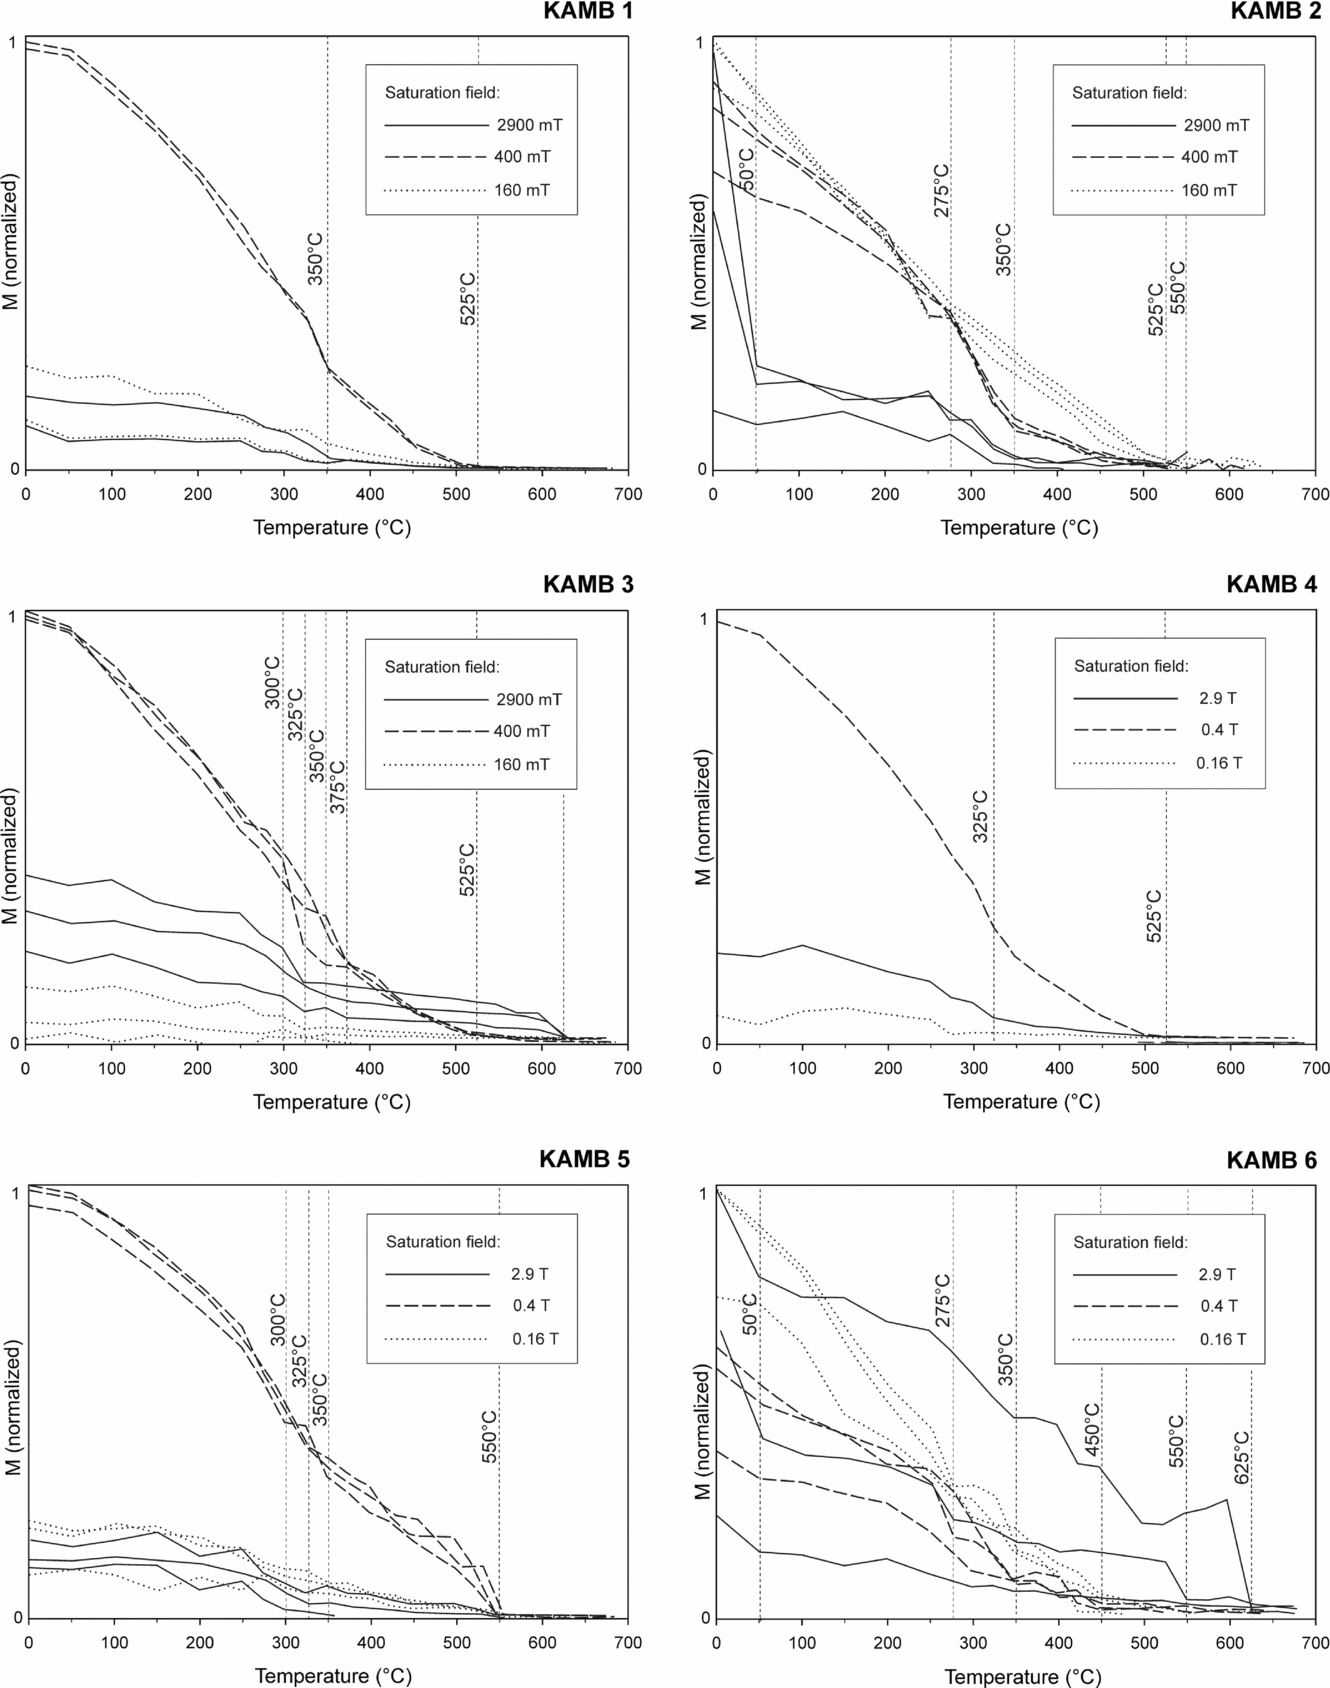
The cores were then magnetized along two mutual perpendicular axes in fields of 0.4 T along the y-axis and 0.12 T (limit of the coercivity of soft magnetic phases like magnetite) along the x-axis. In the final stage of the experiment samples were subjected to a stepwise thermal demagnetization in a field-free magnetic furnace MMTD1 (Magnetic Measurements Thermal Demagnetizer of Great Britain). After each demagnetization step the magnetic signal of each of the samples was measured on the SQUID. The thermal demagnetization of the three orthogonal components of the composite SIRM provided an estimate of the relative quantities and unblocking temperature spectra of the magnetic phases present (Fig. 9).
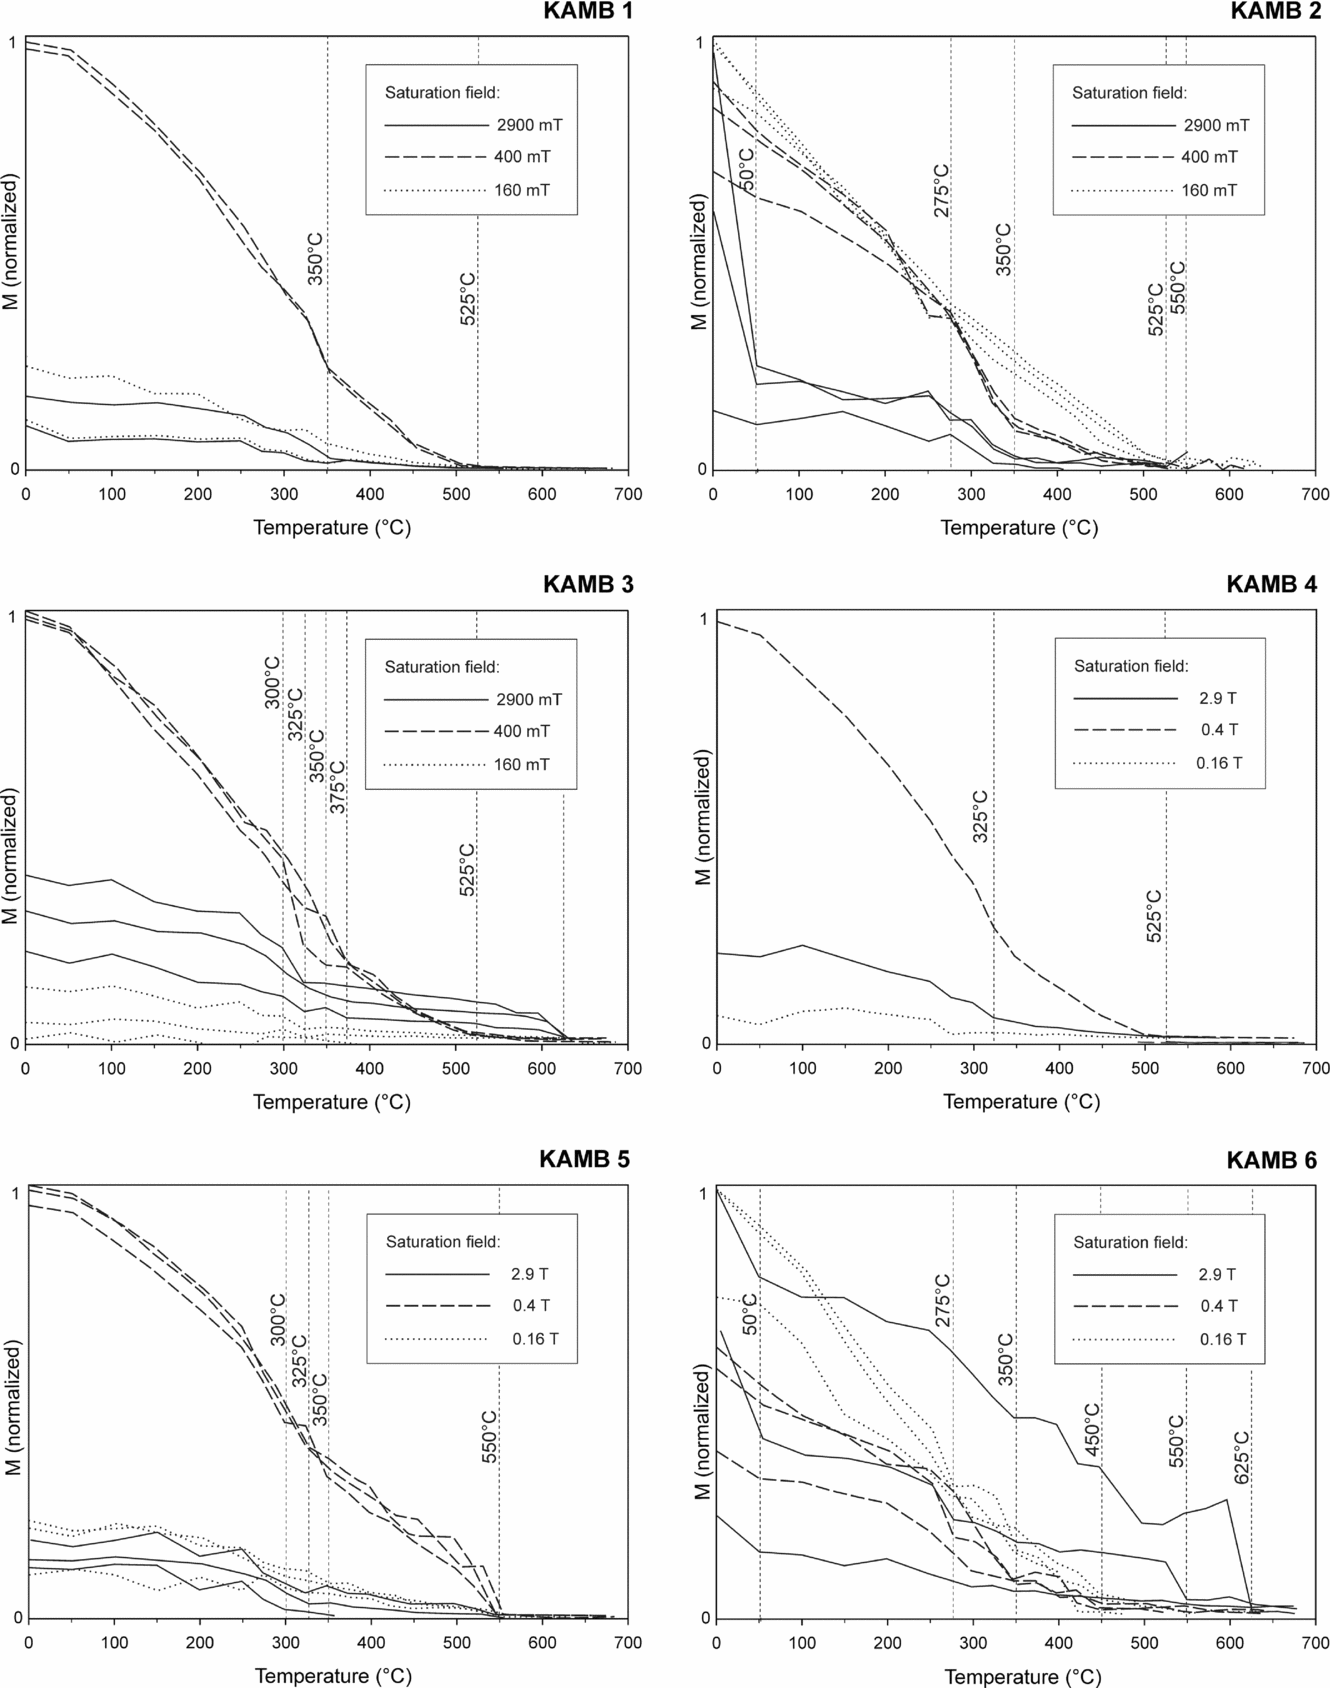
Figure 9. Results of three-component IRM acquisition curves (Lowrie, Reference Lowrie1990) analyses conducted in particular palaeomagnetic sites of the Slaklidalen Formation. Changes of slope on demagnetization curves are marked by dotted lines and the temperatures of these points are given. Particular curves show demagnetization of different coercivity fractions existing in the samples: solid lines – ferromagnetic particles saturate between 400 mT and 2900 mT; dashed lines – those saturated between 160 mT and 400 mT; dotted lines – those saturated below 160 mT. M – normalized magnetization of the samples. The tests were performed on different numbers of samples in particular sites from 1 to 3.
Magnetic analyses were supported by observations of the rock microstructures, and the ferromagnetic minerals were identified using an optical microscope, SEM and electron microprobe techniques in the Department of Geology, University of Warsaw and in the Institute of Geological Sciences at the Polish Academy of Sciences. EDS (energy dispersive spectroscopy) and WDS (wavelength dispersive spectroscopy) microprobe analyses were also conducted on polished sections and the magnetic residuum of sampled rocks. To prepare the residuum, the limestones were dissolved in 10% ethanoic acid (acetic acid). The Fe particles were then separated using a neodymium magnet.
3.c. Palaeomagnetic procedures
A total of 101 cylindrical cores (diameter: 2.2 cm; height: 2.6 cm) representing all six palaeomagnetic sites (16–17 cores from each site) were subjected to stepwise demagnetization. At first 18 cores representing four sites were subjected to stepwise alternating field (AF) demagnetization in the fields from 0 up to 40 mT. Then all cores were demagnetized thermally in the MMTD1 furnace. The specimens were heated in steps of 20–50°C up to 500°C, and after each step cooled to the room temperature in a zero magnetic field. After each demagnetization step the residual magnetic remanence was measured using the SQUID.
The thermal demagnetization process, together with the magnetic susceptibility (κ) of the cores, was monitored using a Czech low-field KLY-2 susceptibility bridge, since changes of the κ parameter reflect changes in magnetic mineral assemblages of the samples during heating.
To plot the demagnetization data and for calculating the ChRM components for particular samples, Palaeomagnetic Data Analysis software by Lewandowski, Werner & Nowożyński (Reference Lewandowski, Werner and Nowożyński1997), employing principal component analysis (PCA) after Kirschvink, (Reference Kirschvink1980), was used. The ChRM components were determined on Zijderveld diagrams as a direction of best fit line to a minimum of three points, with an ASD not exceeding 15° and, in 90% of the analyses, not exceeding 10°. The ChRM directions were extracted on orthogonal Zijderveld diagrams using ‘free line fit’ and in the case of the high-temperature components ‘anchored line fit’ methods (see Butler, Reference Butler1992, pp. 121–2). The mean directions were calculated using Spheristat ver. 2.2 software employing a standard Fisher (Reference Fisher1953) test. The ChRM directions were calculated from the site means. The site mean directions were obtained as an average of the independently oriented rock sample directions from a particular site, while every sample direction was the mean of its cylindrical specimen's directions derived from the PCA.
To calculate the ChRM components and describe relations between the ages of the identified ChRM components and the stages of deformation in the sampled rocks, the inclination only test of Enkin & Watson (Reference Enkin and Watson1996), using Enkin's (Reference Enkin1994) program, was applied. Additionally, the graphs presenting the κ precision parameter of the population of the site means in particular stages of the unfolding procedure were plotted. A second procedure, which considers both declination and inclination parameters, was carried out using Spheristat (ver. 2.2) with a 10% step of unfolding. The palaeopoles were calculated and compared with the APWP (apparent polar wander path) curves for Baltica and Laurentia using the GMAP 2002, 2003 software. The Baltica and Laurentia reference palaeopole paths and palaeointensity curves were compiled from Van der Voo (Reference Van der Voo1993), Torsvik et al. (Reference Torsvik, Smethurst, Meert, Van der Voo, McKerrow, Brasier, Sturt and Walderhaug1996) and internal GMAP 2002, 2003 palaeopole libraries as well as the Early Palaeozoic palaeomagnetic data from Baltica of Torsvik & Rehnström (Reference Torsvik and Rehnström2001) and Lewandowski & Abrahamsen (Reference Lewandowski and Abrahamsen2003).
4. Ferromagnetic minerals identification
Detailed optical and microprobe EDS observations have aided the identification of the ferromagnetic minerals and definition of their geometric relation with the host rock microstructures. From the oldest to the youngest the following generations (GEN) of the ferromagnetic minerals were recognized:
GEN. A. Consists of grains of magnetite lying in the foliated and recrystallized carbonate matrix. In thin-section (Fig. 6a) strings of iron ore grains (ferromagnetic grains?) can be seen to define clear intrafolial and sheared F1–S1 folds. It is not known whether these iron ore grains grew as primary (diagenetic?) phases or as a result of the pre- to syntectonic low-grade Caledonian metamorphism that is recorded in similar aged rocks throughout Western Svalbard (e.g. Ohta, Reference Ohta1979).
GEN. B. (Fe, Ti)-oxides and Fe sulphides, found in the tectonized and brecciated fragments of the limestones belong to this category (Fig. 6c). These ferromagnetic grains would have been subject to the same events as GEN A. The majority of Fe sulphides are framboidal pyrite with distinct Fe oxides or hydroxide aureoles.
GEN. C. These are grains of magnetite found within the calcite veins labelled KAMB KAL B cutting B generation grains (Fig. 6b). This generation of veins cuts the sheared S1 foliation, which is seen on occasions to be affected by small-scale kink-like folds mentioned in Section 2 (Fig. 5). As noted above, the KAMB KAL B veins reflect a late S1 extension phase which post-dates the kink folds. The ferromagnetic grains in these veins are interpreted to have precipitated at the same time as the calcite but the latter has subsequently recrystallized (Figs 5a, e, 6b).
The above observations strongly suggest that the ferromagnetic fabrics recorded in the Slaklidalen Formation limestones were imposed at different stages in the development of the S1 foliation, and any primary depositional remanent magnetization (DRM) was overprinted by a secondary magnetization acquired during Caledonian times.
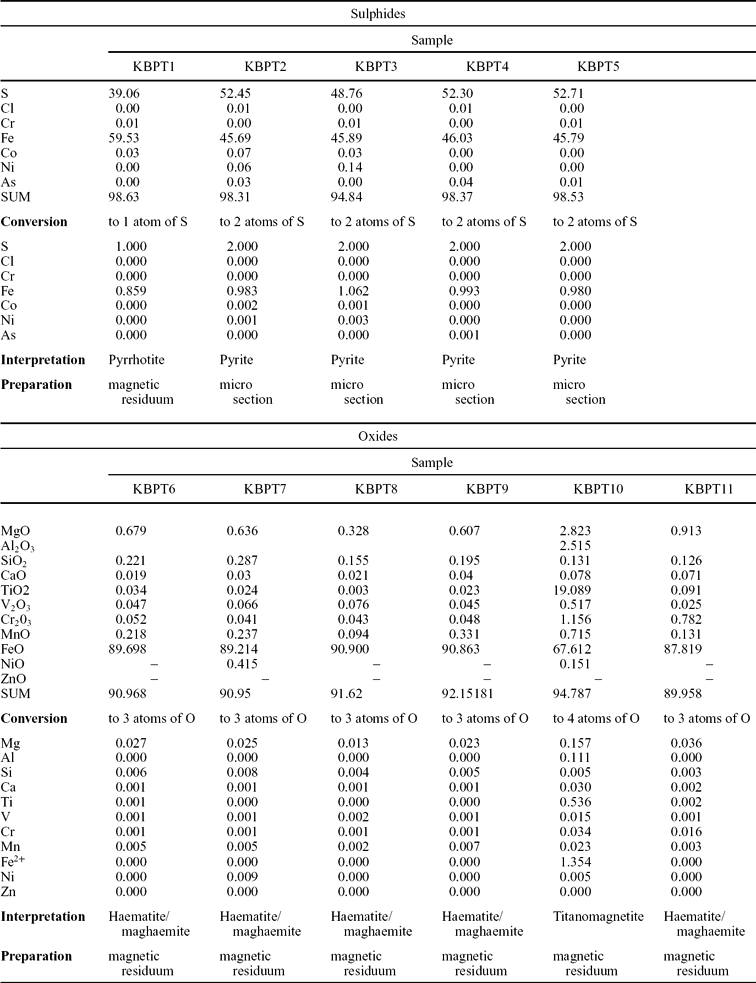
Unfortunately, the small size of the ferromagnetic grains (below 3 μm) observed in the polished sections prepared for microprobe studies excluded in situ WDS analyses. Grains large enough (size above 5 μm) for WDS composition determinations were found only in magnetic residuum of the dissolved limestones, so assignment of identified grains to particular microstructural elements was not possible. The results of WDS analyses are presented in Table 1. The ferromagnetic phases (Fig. 10) that were identified include haematite or maghaemite (5 grains), titanomagnetite (1 grain) and pyrrhotite (1 grain).
Table 1. Ferromagnetic minerals identified in the Slaklidalen Fm by WDS microprobe

Sample numbers correspond to those in Figure 10.
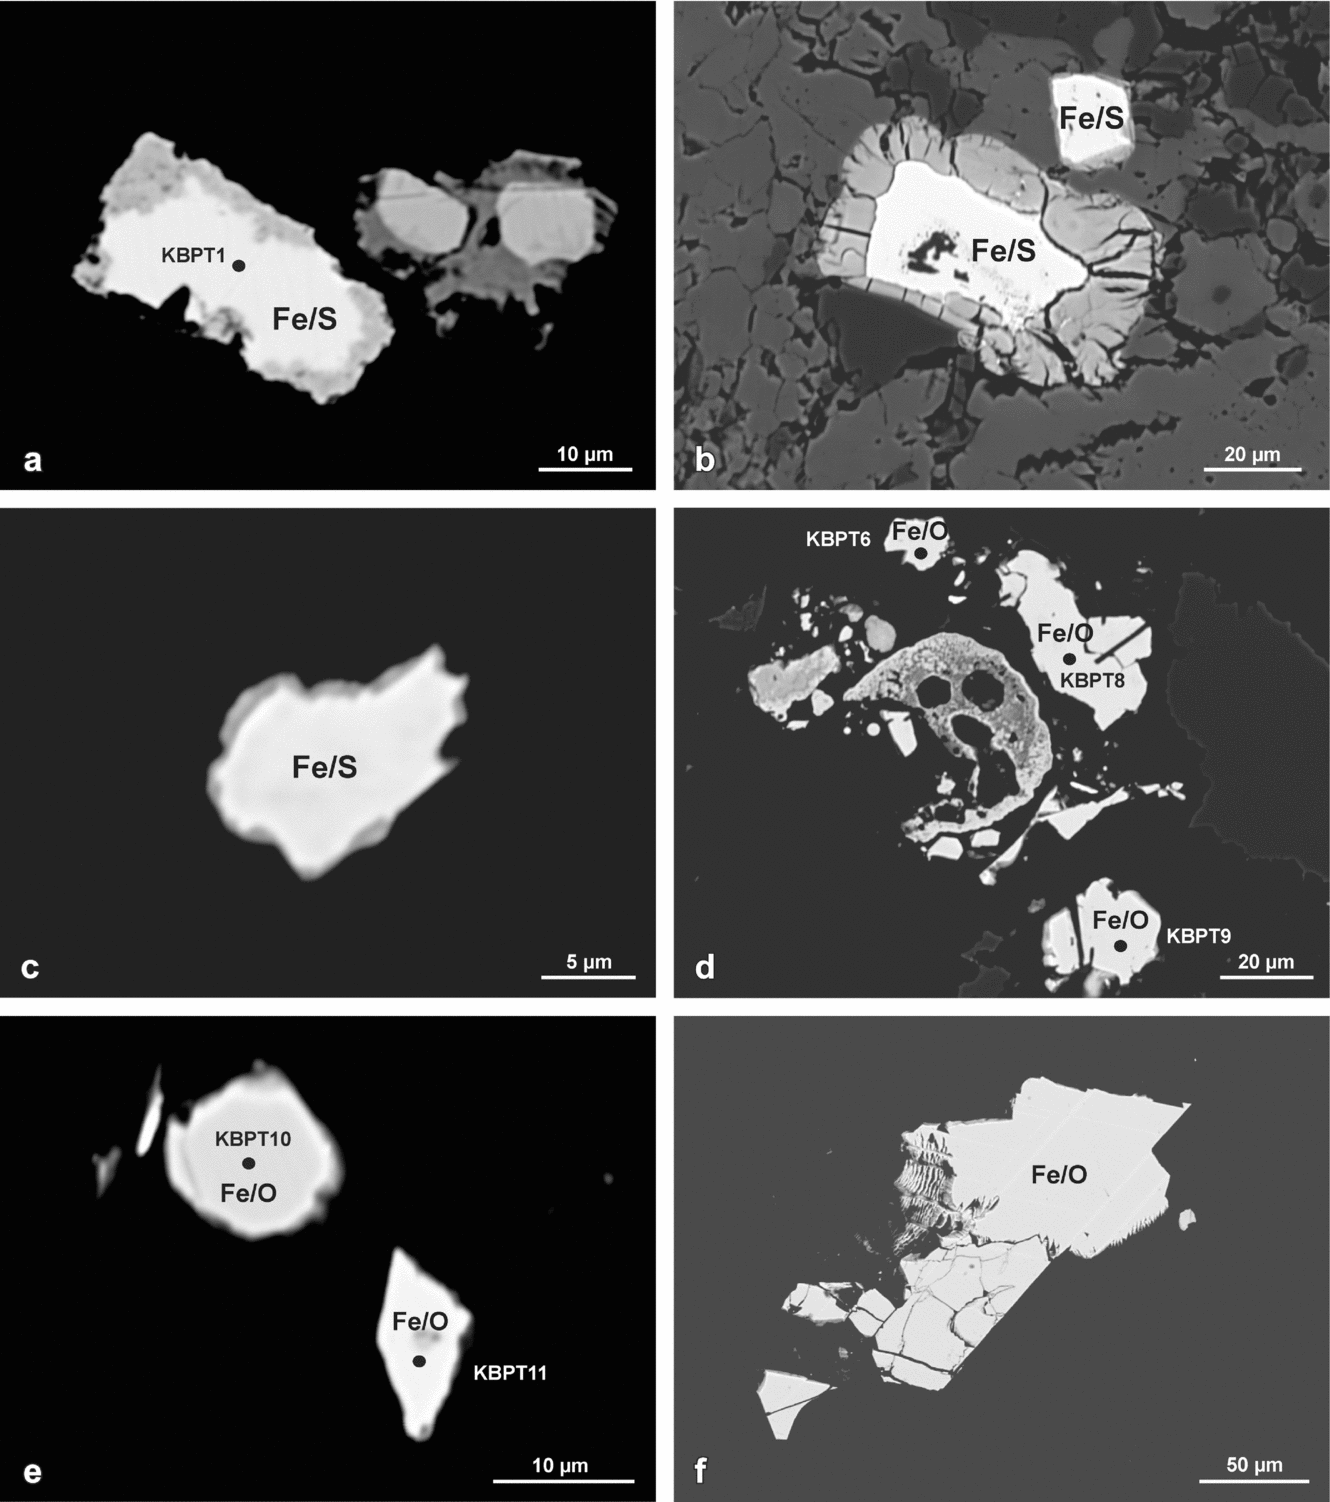
Figure 10. Identification of minerals with Fe content in Slaklidalen Fm samples; sample numbers on the grains correspond to the WDS analyses in Table 1. (a–c) Fe sulphides. (d–f) Fe oxides (a, c–f: magnetic residuum, b: thin-section; BSE microprobe images; chemical composition of selected grains has been defined by WDS analyses).
5. Rock magnetic experiments
Rock magnetic studies have revealed that the investigated Slaklidalen Formation contains a mixture of different ferromagnetic (sensu lato) phases. The majority of the SIRM decay curves possess the characteristics of titanomagnetite grains with maximum unblocking temperatures of about 540–550°C (Kądziałko-Hofmokl & Kruczyk, Reference Kądziołko-Hofmokl and Kruczyk1976; Dunlop & Özdemir, Reference Dunlop and Özdemir1997, pp. 61–7; Fig. 7). In one specimen (site KAMB 6) a higher maximum unblocking temperature range of 630–650°C, close to the Tub max of haematite, was identified. In most specimens a notable change in the shape of SIRM curves was observed about points 330–350°C (Fig. 7).
IRM acquisition curves reveal a dominance of a soft–medium coercivity fraction saturated in 0.2–0.4 T (Fig. 8). Some of the samples from sites KAMB 2, 3 and 6 do not, however, saturate in the maximum applied field of 2.9 T, suggesting an influence of high coercivity minerals (Fig. 8).
Thermal demagnetization curves of the three-component IRM acquisition experiments indicate that in most sites the medium coercivity fraction (0.12–0.4 T) dominates with distinct ranges of unblocking temperatures around 330–360°C and 525–550°C (Fig. 9). The points around 330–360°C are close to the Tub max of pyrrhotite or maghaemite (Dunlop & Özdemir, Reference Dunlop and Özdemir1997, pp. 66–9, 76–9). The appearance of the latter in the Slaklidalen Fm is suggested by Mössbauer investigations (Szlachta et al. Reference Szlachta, Michalski, Brzózka, Górka and Gałązka-Friedman2008). Temperatures of 525–550°C are close to the Tub max of the moderate to low Ti titanomagnetite (Dunlop & Özdemir, Reference Dunlop and Özdemir1997, pp. 61–6). Soft (<0.12 T) and hard (>0.4 T) coercivity fractions play a more important role only in sites KAMB 2 and KAMB 6 (Fig. 9). In these locations the soft fraction curves imitate the shape of the medium curves and probably represent the same ferromagnetic minerals: pyrrhotite/maghaemite and titanomagnetite. The hard coercivity fraction curves of sites KAMB 2 and KAMB 6 record distinct unblocking temperatures of about 50°C and 625°C, which suggests significant increase of goethite and haematite (Dunlop & Özdemir, Reference Dunlop and Özdemir1997, p. 51) in these locations.
6. ChRM components
In 90% of the Slaklidalen Formation specimens the NRM intensities were low and ranged between 0.2 and 0.5 mA/m. Only in the site KAMB 5 did they occasionally reach 3 mA/m.
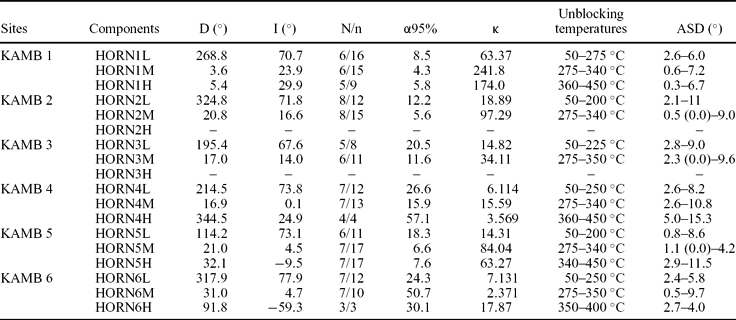
The initial AF demagnetization of 18 specimens up to 40 mT did not resolve a consistent palaeomagnetic remanent magnetization direction. The thermal demagnetization was the most efficient method of extracting the NRM components. In the course of this treatment three ChRM directions were identified and, according to their unblocking temperatures, spectra in the low, middle and high ranges were labelled as the HORNL, HORNM and HORNH components, respectively. The parameters of the Fisher statistics of site means of particular ChRM directions are presented in Table 2.
Table 2. Statistical parameters of the ChRM means calculated from particular palaeomagnetic sites of the Sofiekammen syncline
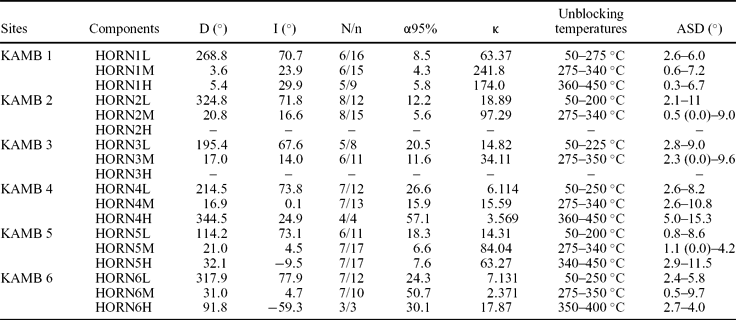
Abbreviations: D – declination, I – inclination, N – number of independently oriented hand samples, n – number of measured cylindrical specimens used for Fisher statistics, α95% – half angle of a cone of 95% confidence, κ – Fisherian precision parameter, ASD – angular standard deviation parameter describing precision of ChRM components definition on Zijderveld demagnetization diagrams.
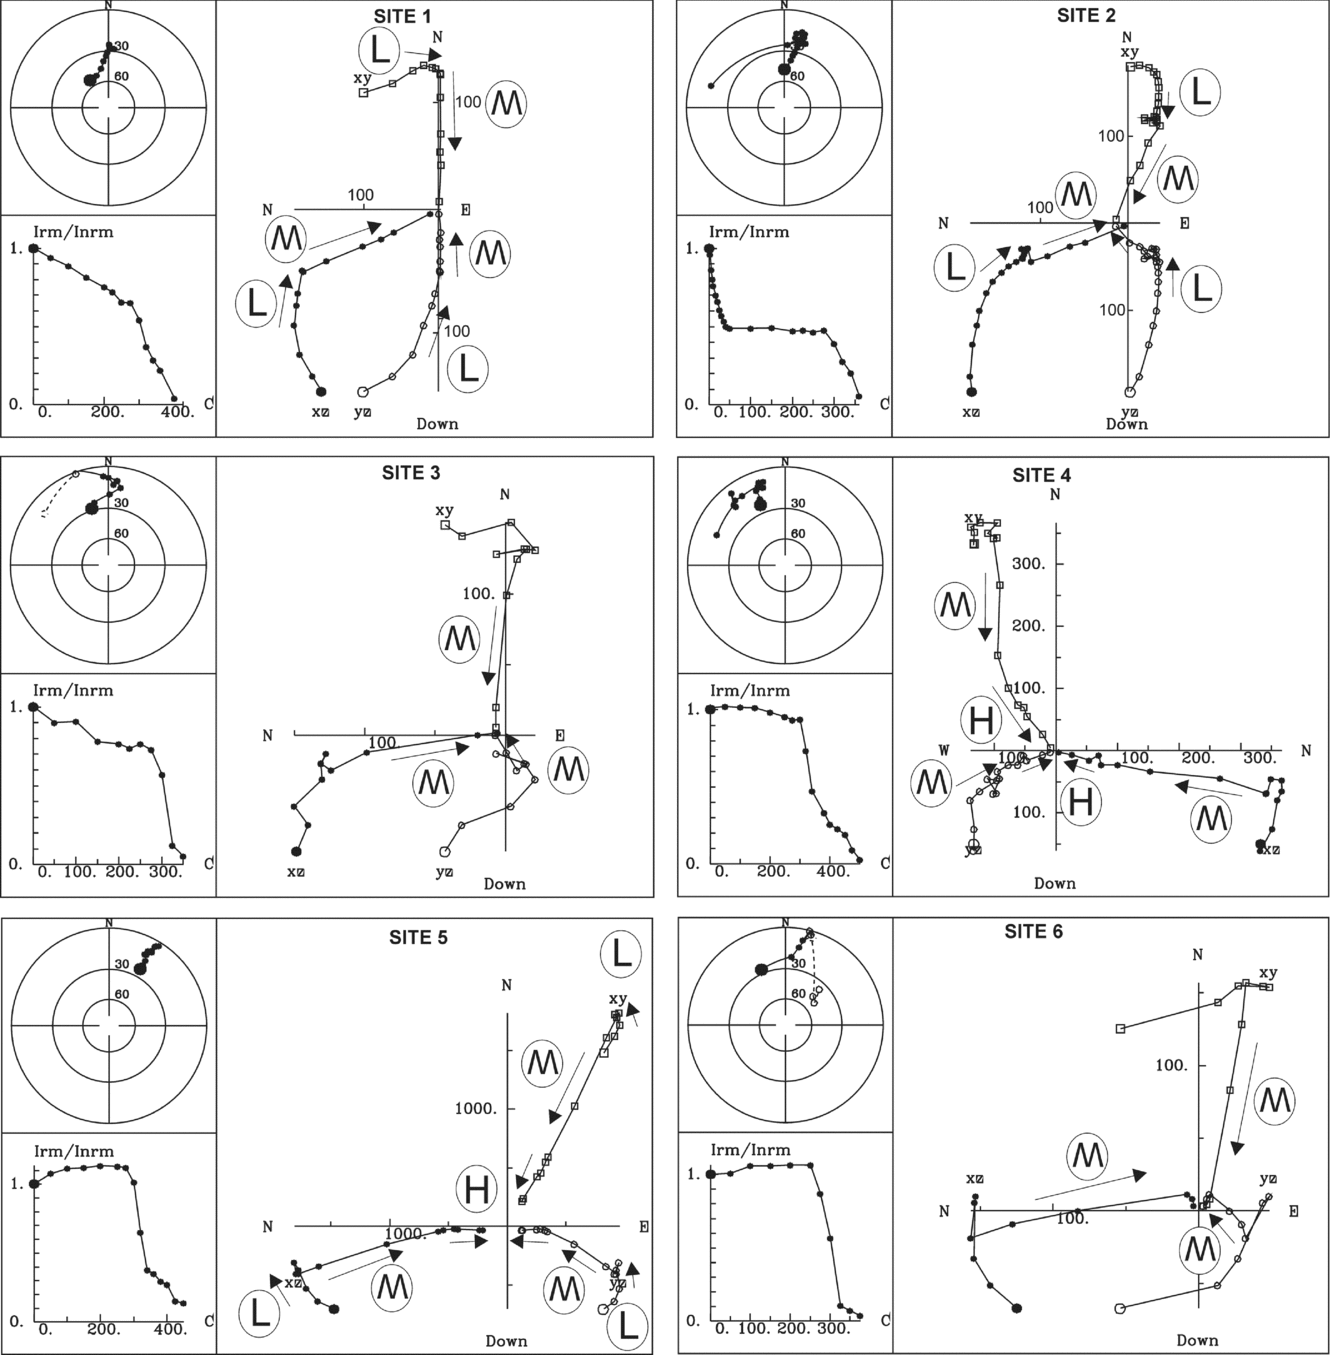
In all sites samples revealed a similar demagnetization behaviour of NRM (Fig. 11). Up to 250°C the HORNL soft component is demagnetized with variable declinations and very steep downward inclination that probably reflects the influence of the present-day magnetic field. Between 275–350°C the HORNM component is identified in all six sites characterized by N- to NNE-directed declination and shallow downward inclination. Demagnetization of HORNM in the samples exhibits as much as an 80% decrease in the intensity of their initial NRM signal. In five sites HORNM was extracted from Zijderveld diagrams with high precision (in the majority of specimens ASD <6°) and its mean directions, calculated at the level of palaeomagnetic sites, were very well defined with small 95% confidence level cones and high precision parameters κ (Table 2). The mean HORNM of site KAMB 6 was an exception, which, with a high α95% of 50.7 and a very low κ of 2.37, was thus rejected from further consideration.
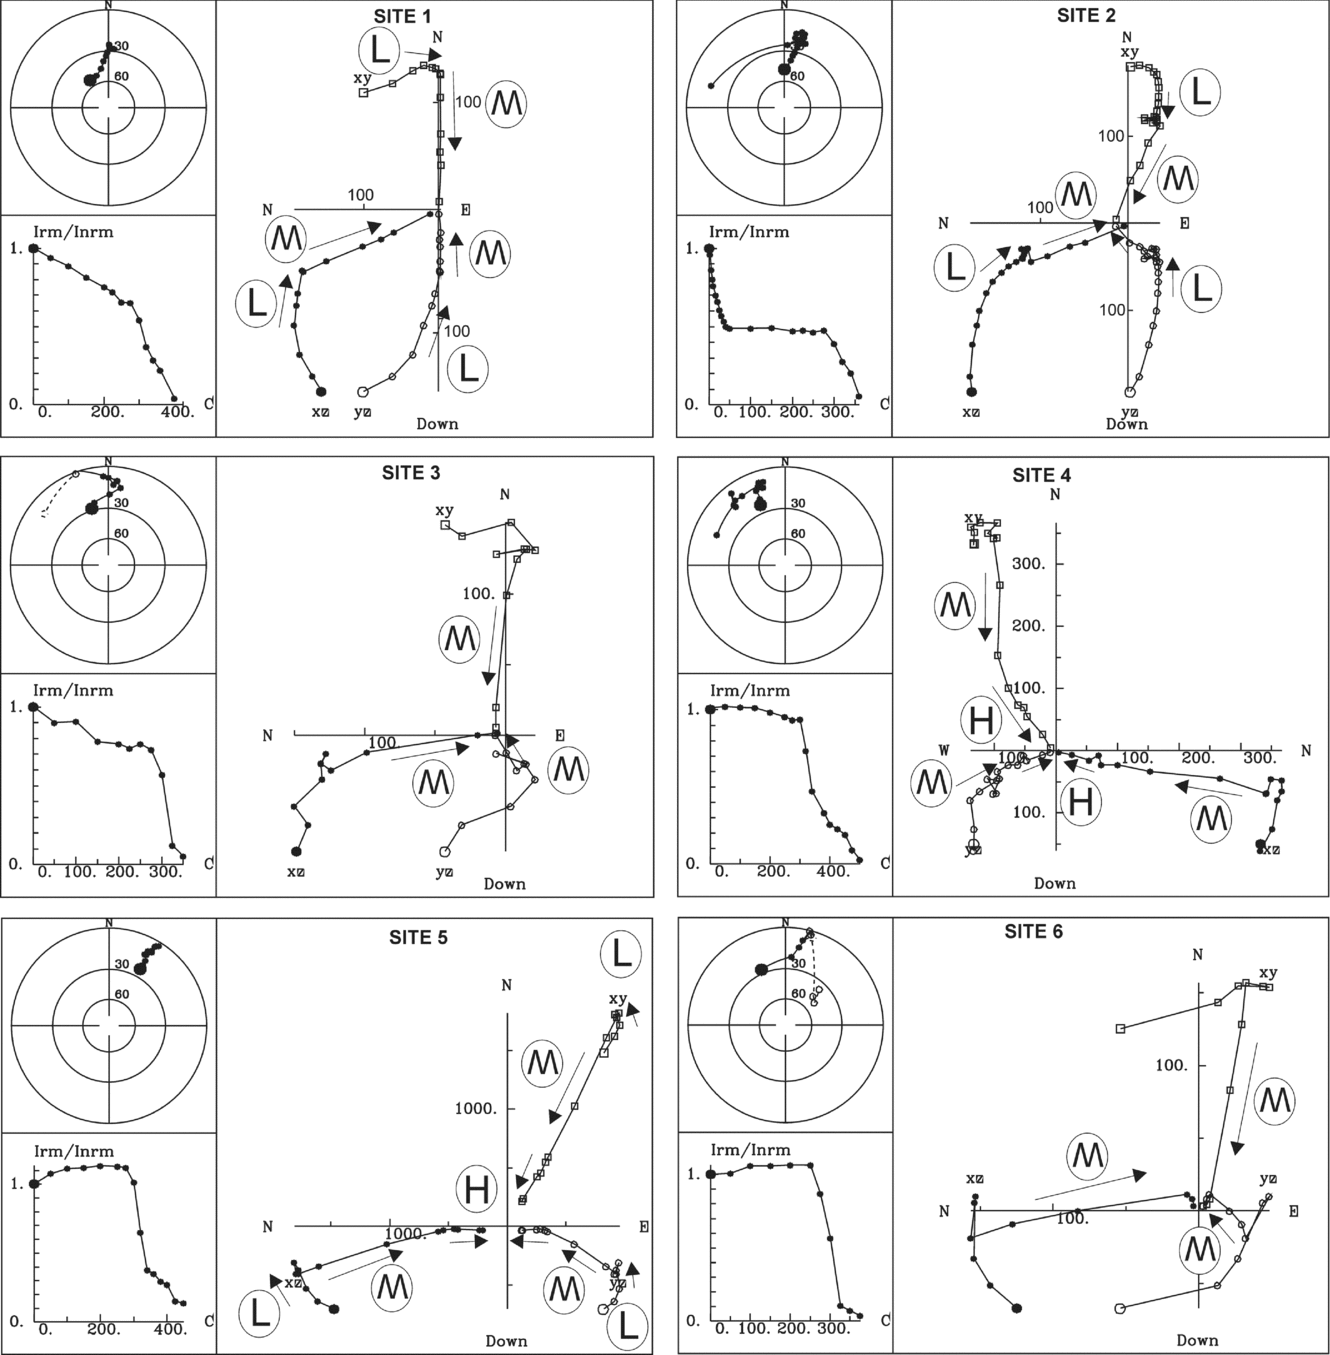
Figure 11. Equal area, orthogonal (Zijderveld) projections and normalized intensity decay plots of natural remanent magnetization of Slaklidalen Fm samples in the course of the thermal demagnetization process, representing all six palaeomagnetic sites situated in the Sofiekammen syncline; projections are presented for in situ orientation; open/full symbols represent upper/lower hemisphere; squares/circles denote projections onto horizontal/vertical planes; units on the orthogonal plots are in uA/m; ChRM components identified in particular specimens are marked on orthogonal projections by arrows with labels L, M, H representing HORNL, HORNM and HORNH directions, respectively.
The hard component HORNH was identified in the temperature range of 340–450°C (Fig. 11). This component has been found in four palaeomagnetic sites and the site means were calculated with varying precision (Table 2). Two of the most precisely defined qualified for further analyses while the HORNH means of sites KAMB 4 (α95% = 57.1, κ = 3.57) and KAMB 6 (α95% = 30.1, κ = 17.87) were excluded.
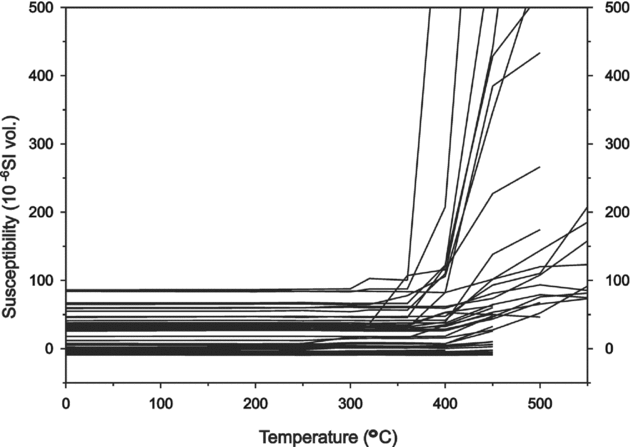
In the course of the thermal demagnetization, the low-field magnetic susceptibility of the specimens was monitored. All specimens were characterized by a low initial susceptibility ranging from 10−4 to 10−5 SI. In most specimens there was no significant increase in susceptibility during their thermal cleaning (Fig. 12). In 30% of specimens a substantial increase in susceptibility in the 450–500°C range was noted. These temperatures were higher than the maximum unblocking temperatures of HORNH. The results of the susceptibility experiments suggest that possible chemical changes, which appeared during thermal demagnetization, did not disturb the original remanence directions in the Slaklidalen Formation.
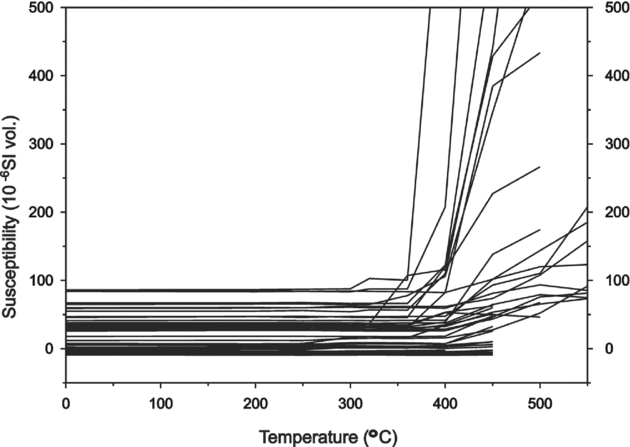
Figure 12. Changes of magnetic susceptibility of the 41 Slakidalen Fm specimens in the course of the thermal demagnetization process. Specimens represent all six palaeomagnetic sites sampled.
7. Fold tests
The fold tests allowed determination of two ChRM directions (Graham, Reference Graham1949; Cox & Doell, Reference Cox and Doell1960). In these tests, statistical parameters for site mean vector distribution were calculated during stepwise unfolding until the Fisherian parameter κ reached its maximum (inclination only test; Enkin & Watson, Reference Enkin and Watson1996), or maximum κ and minimum α95% was obtained using the test offered by the Spheristat software (ver. 2.2). The overall means for the best grouping direction were calculated and used for the purpose of a tectonic interpretation (Table 3).
Table 3. Results of palaeomagnetic fold tests

ChRM component parameters have been presented for in situ position and after 100% tectonic correction; other abbreviations are as in Table 2.
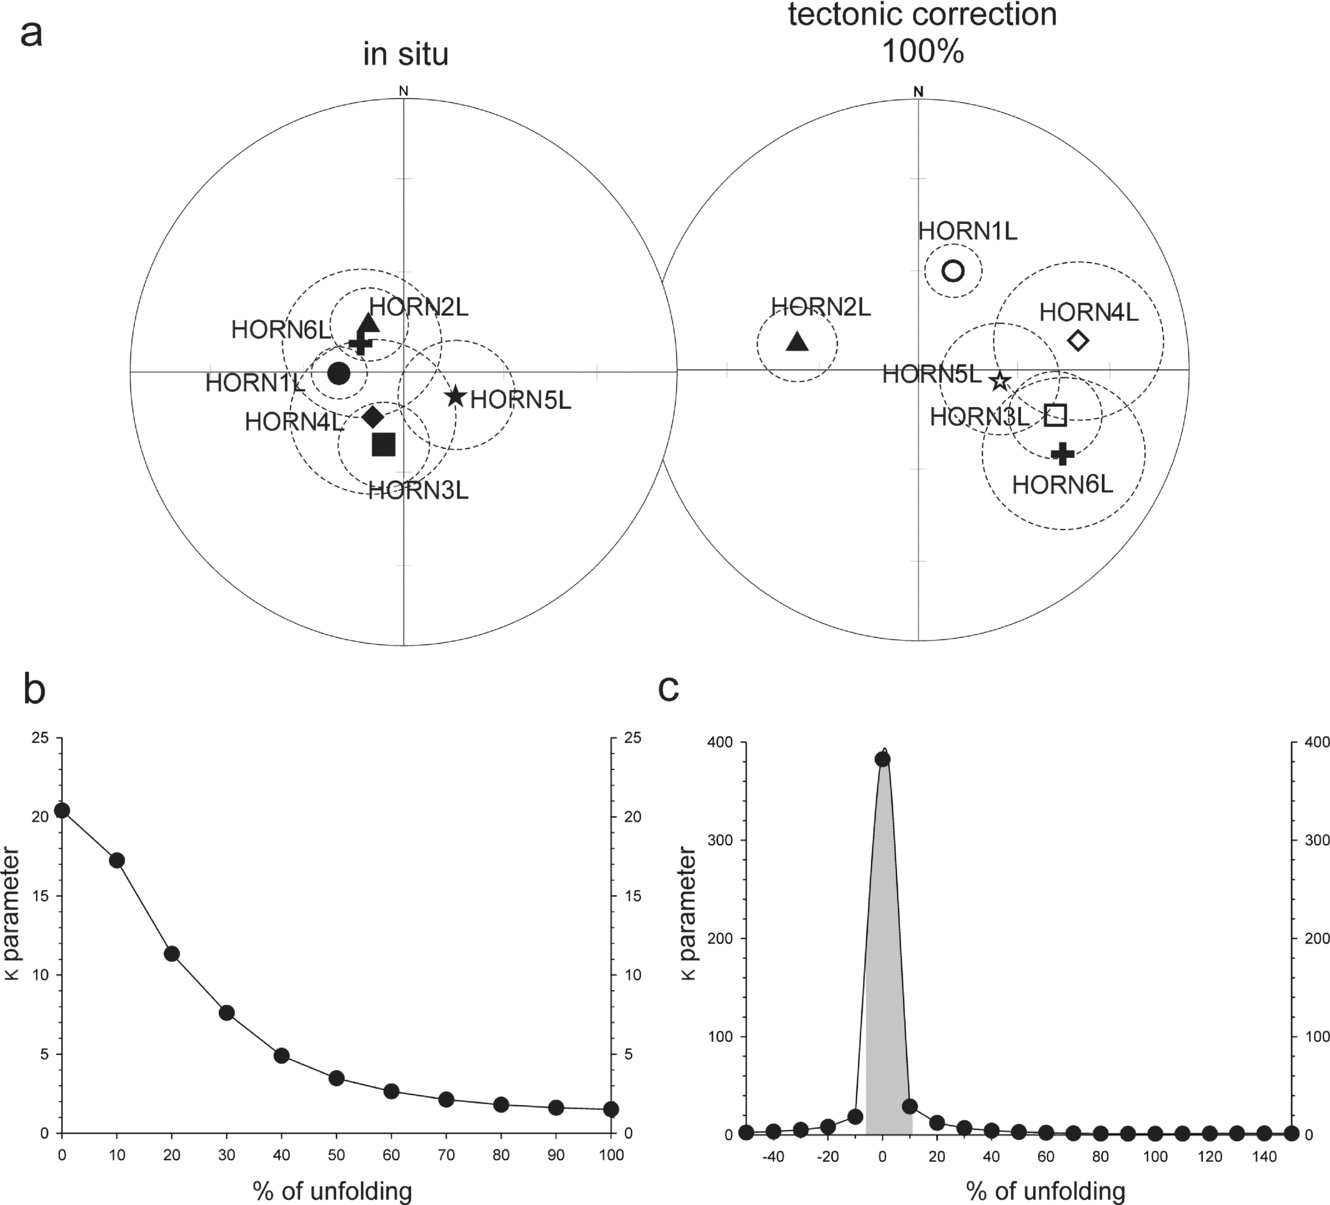
The soft component HORNL showed the best statistical grouping before tectonic correction (Fig. 13):

Figure 13. (a) Equal area projections of HORNL site means in in situ and after 100% tectonic correction positions; open/full symbols represent upper/lower hemisphere, site means are presented with their cones of α95% confidence. (b) Graph presenting changes of the κ precision parameter of the population of the HORNL site means in the course of the unfolding procedure. (c) Inclination only test for HORNL site means according to the procedure of Enkin & Watson (Reference Enkin and Watson1996); the grey bar represents 95% confidence level.
(i) The inclination only test gave a maximum κ at 1.5% of unfolding with a confidence level between −6.6% and +11.1% of unfolding;
(ii) The Spheristat (ver. 2.2) test gave a maximum κ = 20.4 and a minimum α95% = 15.2° at 0% of unfolding.
The scatter of the HORNL on the stereogram is probably owing to a complex origin of this direction, which may be composed of at least two vectors.
The fold tests for the component HORNM show the following results (Fig. 14):
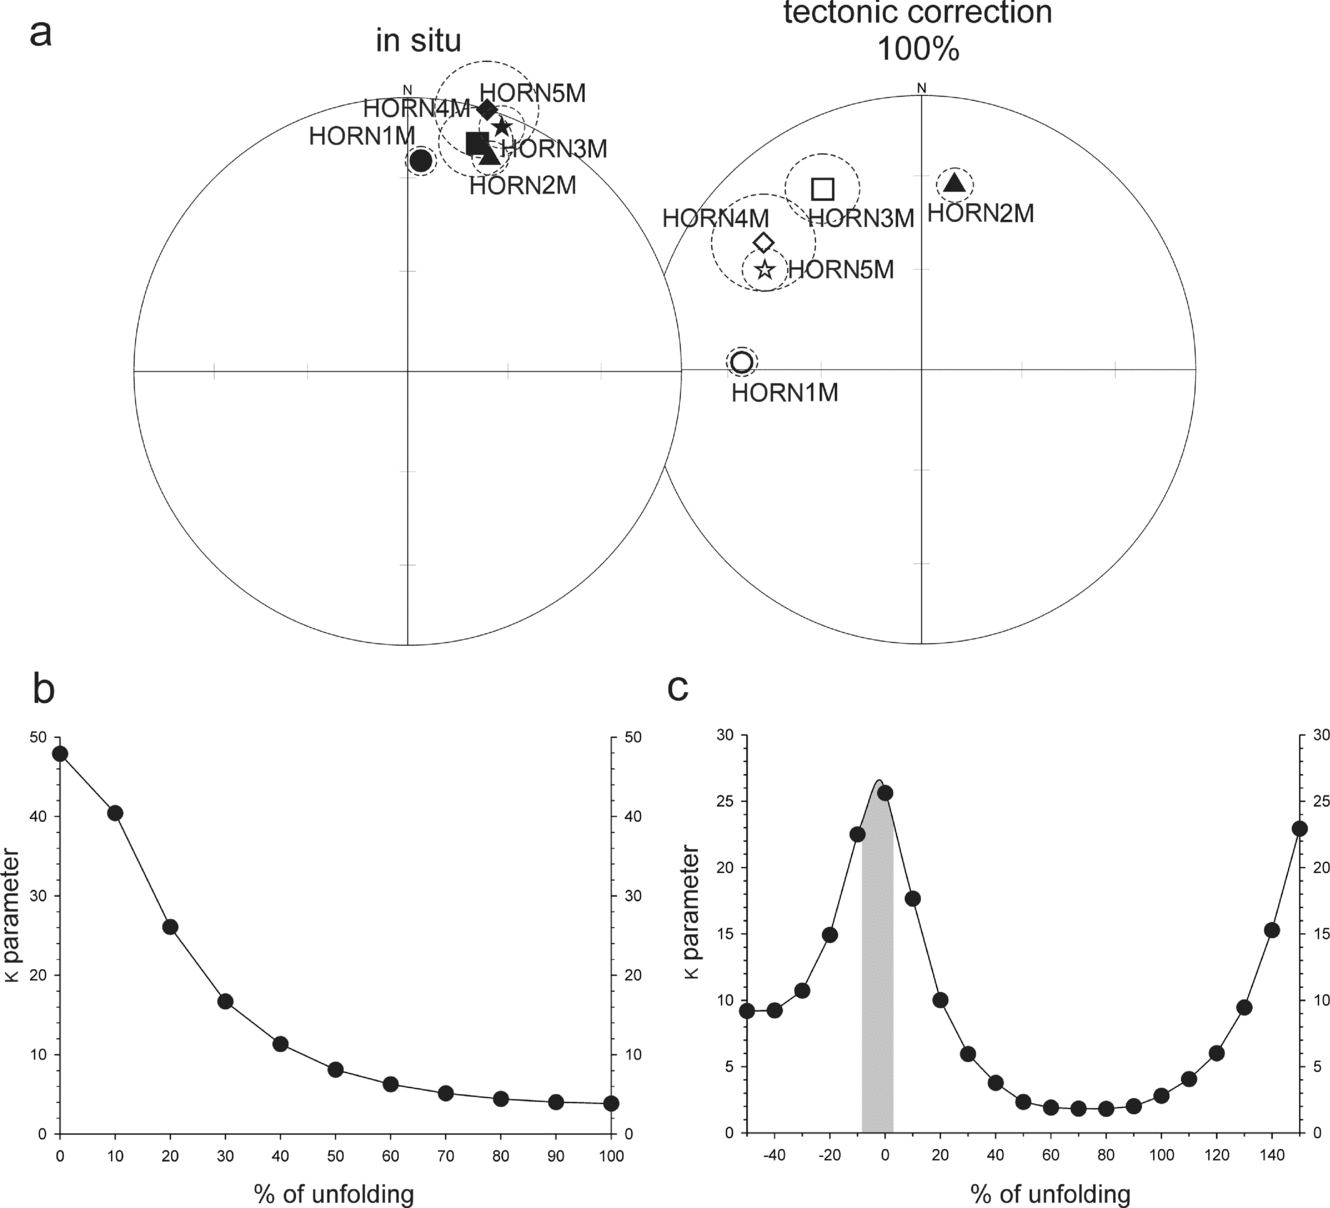
Figure 14. (a) Equal area projections of HORNM site means in in situ and after 100% tectonic correction positions. (b) Graph presenting changes of the κ precision parameter of the population of the HORNM site means in the course of the unfolding procedure. (c) Inclination only test for HORNM site means according to the procedure of Enkin & Watson (Reference Enkin and Watson1996); other explanations as in Figure 13.
(i) The inclination only test gave a maximum κ at −2.1% of unfolding with a confidence level between −8.4% and 2.7% of unfolding;
(ii) The Spheristat (ver. 2.2) test gave a maximum κ = 47.91 and a minimum α95% = 11.2° at 0% of unfolding.
As indicated by fold tests, both HORNL and the HORNM directions were acquired after folding. In terms of their quality, they pass the reliability criteria of Van der Voo (Reference Van der Voo1993, p. 67; N > 24, k ≥ 10 and α95% ≤16°; Table 3).
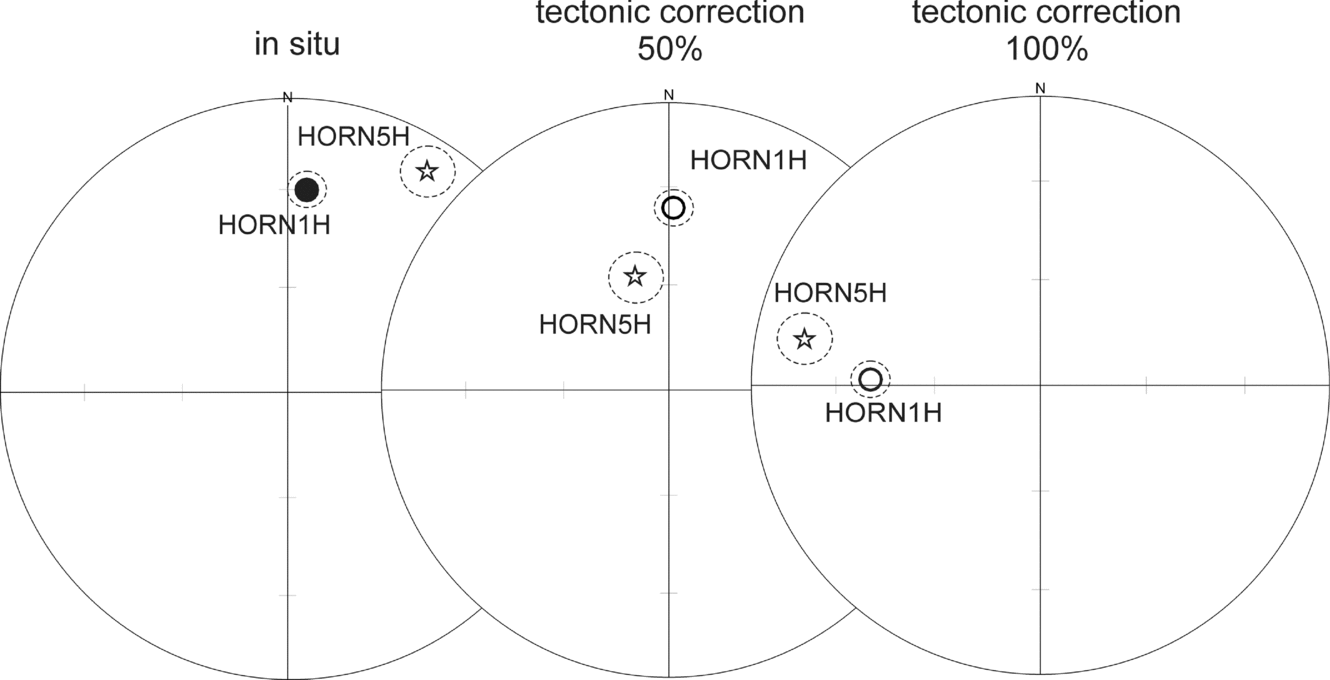
For the purpose of the fold tests HORNH site means have been qualified from only two sites. As both sites are situated on the eastern limb of the Sofiekammen syncline, with similarly orientated beds, reliable fold tests for the HORNH component were not possible. However, HORNH site means have been presented in stereograms in the in situ position, after 50% and 100% of unfolding (Fig. 15; Table 3). No overlap was found in any of the three positions. It should be noted, however, that in the in situ position HORNH site means are situated very close to the HORNM post-folding component (Fig. 14).

Figure 15. (a) Equal area projections of HORNH site means in in situ, after 50% and after 100% tectonic correction positions; other explanations as in Figure 13.
None of the sites passed the fold test. The post-folding development of the components identified in the Slaklidalen Formation reflects, therefore, a secondary magnetization and that any primary magnetization has been overprinted during syntectonic metamorphism responsible for the formation of the S1 foliation.
8. Age of identified magnetic components and geotectonic implications
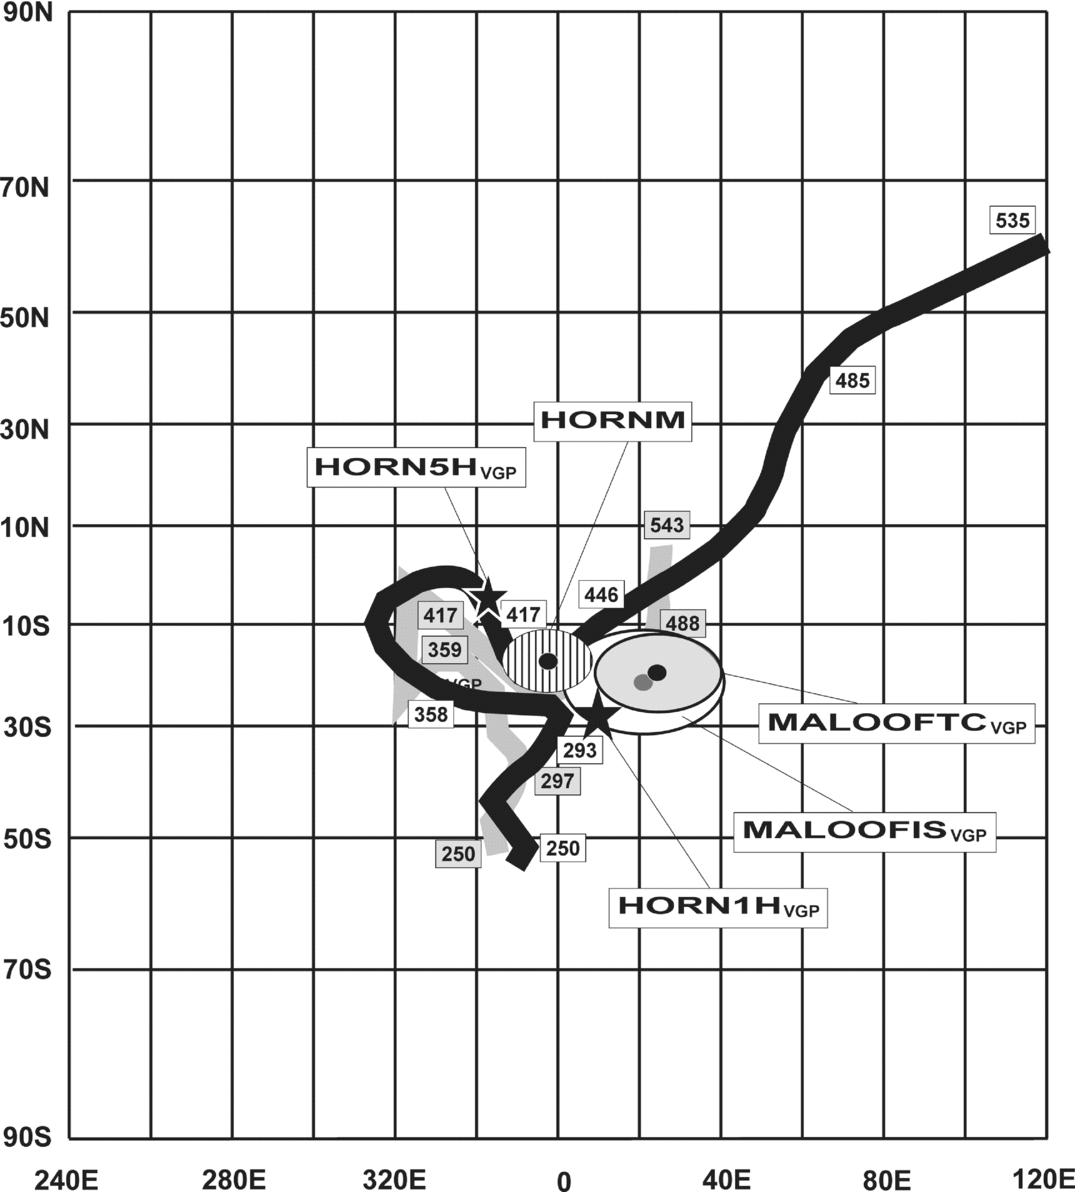
The ages of the HORNL, HORNM and HORNH components have been evaluated using APWPs of Baltica and Laurentia that were adjacent to Svalbard in Palaeozoic time (Figs 16, 17). The results have been compared with the isotopic record of the tectonothermal events of Hornsund (Birkenmajer, Reference Birkenmajer1978, Reference Birkenmajer1990; Manecki et al. Reference Manecki, Holm, Czerny and Lux1998).
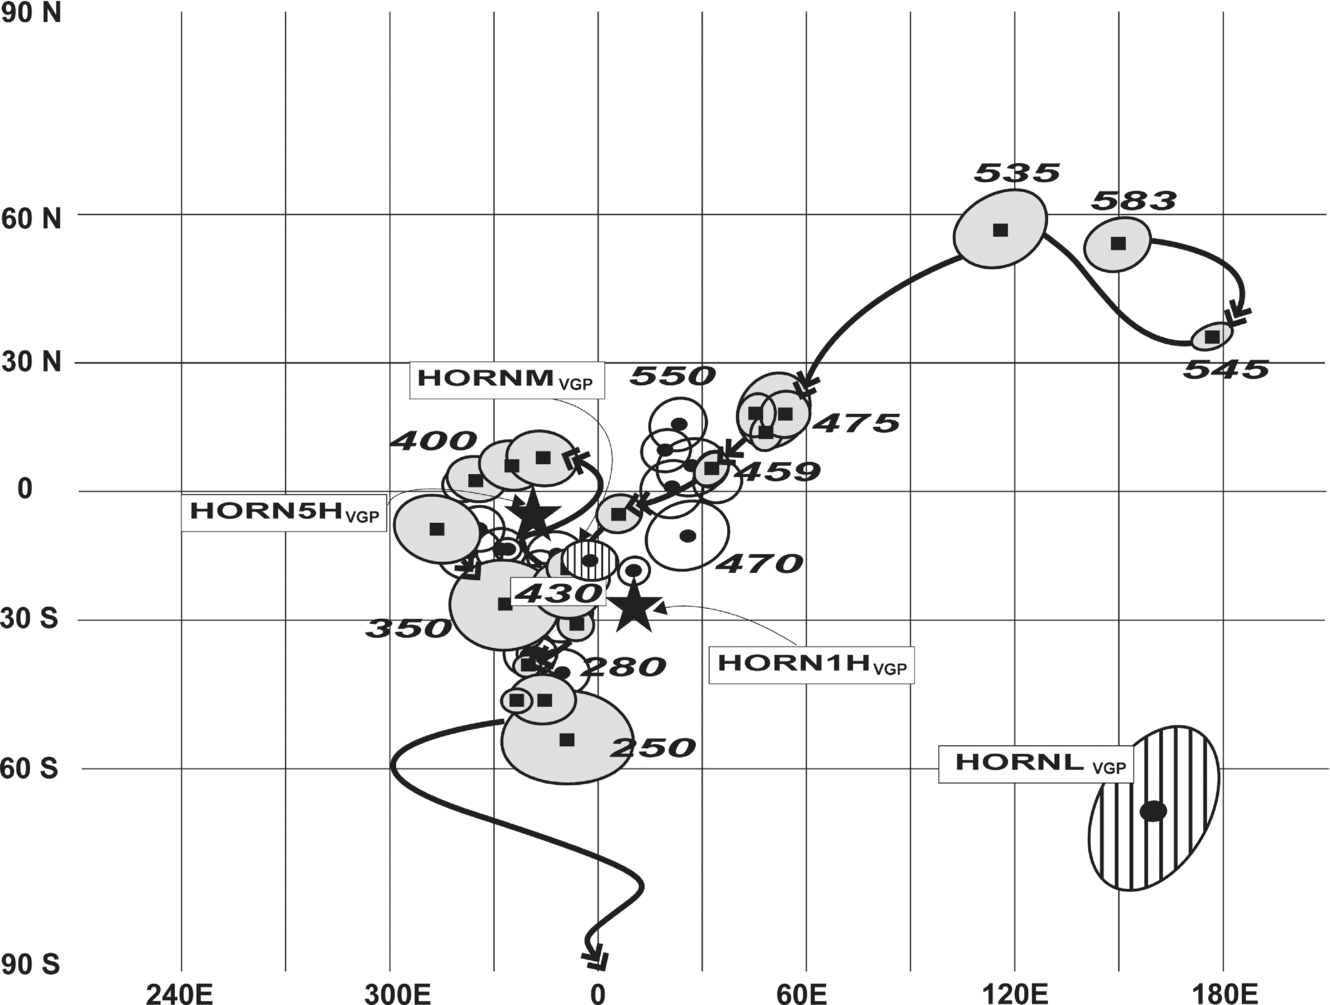
Figure 16. The positions of palaeopoles obtained from the Cambrian Slaklidalen Fm relative to the APWPs of Baltica and Laurentia; palaeopoles of Baltica (grey ovals) and Laurentia (white ovals) are presented with their Dp/Dm ovals of 95% confidence; the age of the sectors of reference paths is given; palaeopoles for Baltica and Laurentia have been selected from Van der Voo (Reference Van der Voo1993), Torsvik et al. (Reference Torsvik, Smethurst, Meert, Van der Voo, McKerrow, Brasier, Sturt and Walderhaug1996), internal GMAP 2002, 2003 palaeopole libraries and additional Early Palaeozoic palaeomagnetic data from Baltica from Torsvik & Rehnström (Reference Torsvik and Rehnström2001) and Lewandowski & Abrahamsen (Reference Lewandowski and Abrahamsen2003); HORNMVGP and HORNLVGP palaeopoles (striped ovals) are presented with their Dp/Dm ovals of 95% confidence; the positions of HORN1HVGP and HORN5HVGP palaeopoles are marked by black stars.
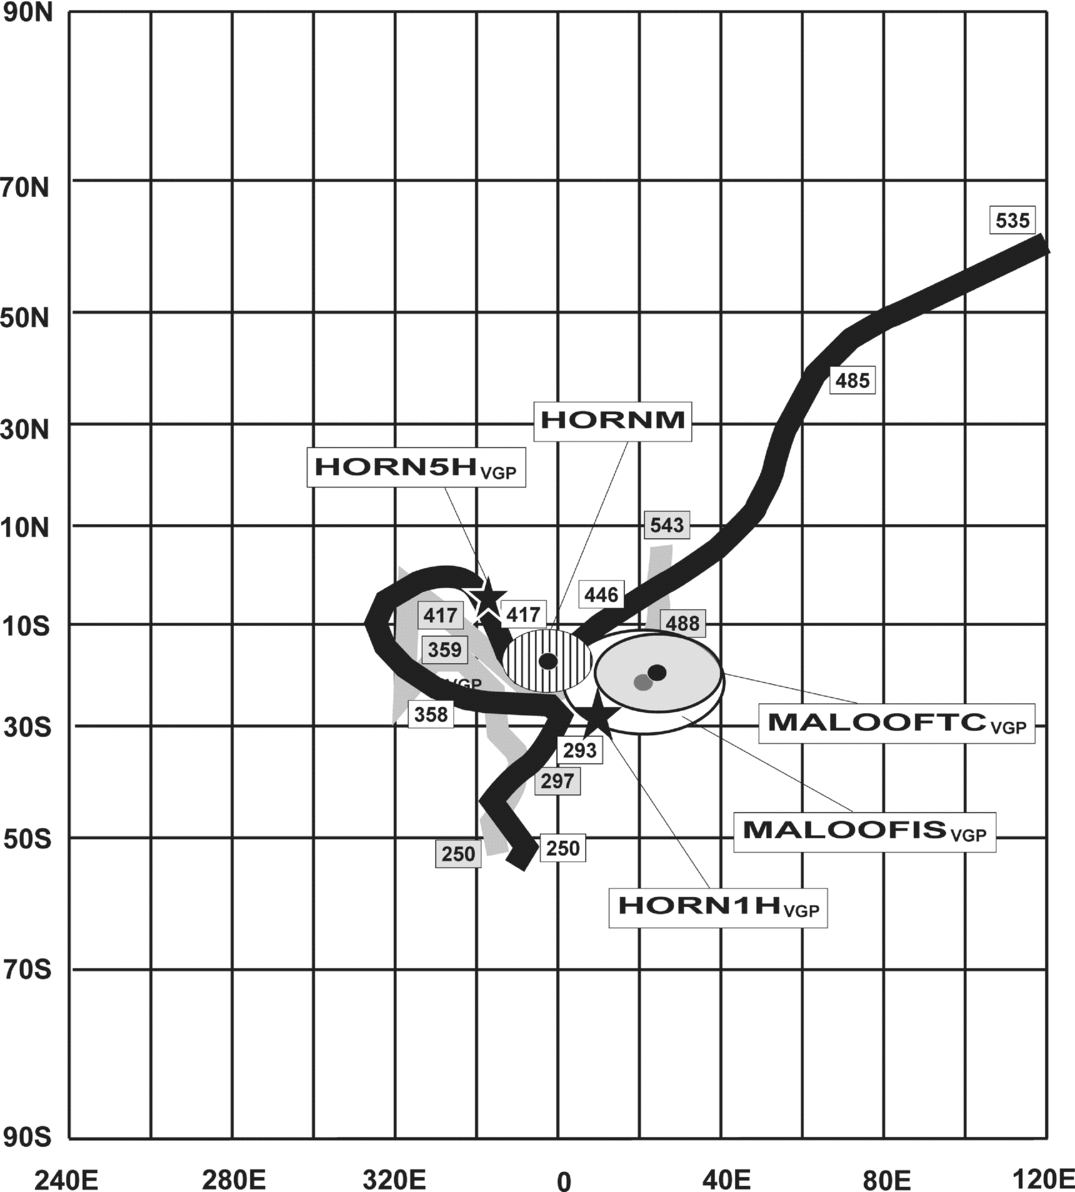
Figure 17. The relative positions of palaeopoles obtained from Central Svalbard Terranes (Hornsund Terrane, this study) and Eastern Svalbard Terranes (Maloof et al. Reference Maloof, Halverson, Kirschwink, Schrag, Weiss and Hoffman2006; division of Svalbard into geotectonic provinces after Harland, Reference Harland1997) to the reference paths of Baltica (black) and Laurentia (grey) mathematically smoothed by the spline method (paths of Baltica and Laurentia are taken from internal GMAP 2002, 2003 libraries). Abbreviations: MALOOFTCVGP – tectonically corrected Lower Grusdievbreen Fm palaeopole of Maloof et al. (Reference Maloof, Halverson, Kirschwink, Schrag, Weiss and Hoffman2006); MALOOFISVGP – Lower Grusdievbreen Fm palaeopole of Maloof et al. (Reference Maloof, Halverson, Kirschwink, Schrag, Weiss and Hoffman2006) in in situ position; other abbreviations are as in Figure 16.
The Early Palaeozoic reference paths of Laurentia and Baltica differ significantly. While Laurentia was located in near-equatorial palaeolatitudes throughout Early Palaeozoic times, Baltica continued its drift away from the moderate southern palaeolatitudes it occupied in Cambrian time (Figs 16, 17). Following the Baltica–Laurentia collision, which is commonly attributed to the Scandian phase (c. 430 Ma), the two continents show overlapping drift histories from Late Silurian times. Here, the intention is to analyse the pre-Atlantic opening palaeogeography, and the Laurentian poles have been rotated to European coordinates around the Euler pole (lat. = 88°, long. = 27°) of Bullard, Everett & Smith (Reference Bullard, Everett and Smith1965), by an angle of 38°, which has also been adopted in later reconstructions by Torsvik et al. (Reference Torsvik, Smethurst, Meert, Van der Voo, McKerrow, Brasier, Sturt and Walderhaug1996) and Torsvik & Rehnström (Reference Torsvik and Rehnström2001) for the Palaeozoic and Triassic sectors of APWPs. As none of the virtual geomagnetic poles (VGP) for the Laurentian Palaeozoic APWP came from Greenland, correction for the opening of the Labrador Sea was not made. Mesozoic and Cenozoic Baltica–Laurentia APWPs and palaeolatitude paths presented in this paper are based on the palaeomagnetic data from the European and North American plates derived from integral libraries of the GMAP 2002, 2003 software.
The HORNLVGP calculated for the low temperature HORNL component is distant from the APWPs of Baltica and Laurentia (Fig. 16; Table 4). To match the HORNLVGP with any sector of the reference paths a rotation of at least 150° is needed. A rotation of this magnitude would require thousands of kilometres of separation of West Spitsbergen from the European–North American regions in Phanerozoic time. Such a reconstruction is not supported by any up-to-date geological data, and this component is not considered to provide any meaningful palaeogeographic information.
Table 4. Palaeopoles (southern) calculated from ChRM components identified in the Slaklidalen Formation, Hornsund area, southern Spitsbergen (average location of Slakidalen palaeomagnetic sites 77°00′N, 15°50′E)

Abbreviations: S – number of sites from which the ChRM was calculated; P – polarity; Φ – palaeopole latitude; Λ – palaeopole longitude; Dp/Dm – half axes of palaeopole oval of 95% confidence limit; Plat – palaeolatitude; other abbreviations are as in Table 2. HORNH1VGP and HORNH5VGP have been calculated from the site means not from the results of the fold test (for explanation see Sections 7 and 8).
The HORNL direction probably represents a composite vector as the low temperature NRM record up to 250°C is particularly prone to re-magnetization. The high inclination parameter (Figs 11, 13; Tables 2, 3, 4) suggests a strong influence of the recent geomagnetic field.
The HORNMVGP calculated from the post-folding HORNM component matches exactly the Silurian sector of the Baltica–Laurentia APWPs, the first common part of the reference paths of the two continents occurring after the closure of Iapetus (Figs 16, 17). The HORNMVGP Dp/Dm oval overlaps the Baltica palaeopoles around 428–420 Ma derived from Gotland and southern Norway (Claesson, Reference Claesson1979; Douglass, Reference Douglass1988; Trench & Torsvik, Reference Trench and Torsvik1991). Simultaneously, the HORNMVGP exactly matches the 420 Ma Laurentian VGP of the Scottish Peterhead granite (Torsvik, Reference Torsvik1985) and it also overlaps the 455–415 Ma Laurentia VGPs derived from Scotland, Newfoundland and Indiana, USA (Hodych, Reference Hodych1989; Hall & Evans, Reference Hall and Evans1988; Deutsch & Prasad, Reference Deutsch and Prasad1987; Torsvik, Reference Torsvik1984; McCabe et al. Reference Mccabe, Van der Voo, Wilkinson and Devaney1985; Turnell, Reference Turnell1985). The close fit of HORNMVGP with the 455–415 Ma sectors of the two APWPs coincides in time with the 432 ± 7 Ma 40Ar–39Ar age obtained by Manecki et al. (Reference Manecki, Holm, Czerny and Lux1998) from the adjacent Proterozoic Sofiebogen Group, which is interpreted as recording the timing of the syntectonic (D1–F1–S1) Caledonian greenschist-facies metamorphism in the Hornsund region.
This exceptional fit would argue against any large-scale movements between SW Spitsbergen, Laurentia and Baltica after 455 Ma. Moreover, the clearly post-folding origin of the HORNM component implies (Fig. 14) that the geometry of Sofiekammen fold has not been significantly modified by the Svalbardian or the WSFB events, (cf. also Birkenmajer, Reference Birkenmajer1990). It is evident, therefore, that the Sofiekammen syncline, its S1 foliation and related shearing fabrics are entirely Caledonian in origin.
In the majority of the investigated sites the small number of reliable palaeomagnetic directions demagnetized above 340°C prevented determination of the hard component HORNH. The HORNH site means with acceptable κ, and α95% Fisher parameters have been obtained, however, from two sites: KAMB 1 and KAMB 5 (Table 2). Although they are statistically distant from the HORNM site means (Figs 14, 15; Table 2), the HORNHVGP (Figs 16, 17; Table 4) does lie in the vicinity of the HORNMVGP. This coincidence may suggest that at least two pulses of magnetization occurred during Caledonian tectogenesis. The above mineral-fabric relations demonstrate that these magnetization events occurred before the final development of the S1 foliation.
Since the palaeomagnetic age of the HORNM and HORNH components coincides with the c. 432 Ma age for the greenschist-facies metamorphism determined on the basis of 40Ar–39Ar dating by Manecki et al. (Reference Manecki, Holm, Czerny and Lux1998), these components are interpreted to be the result of the Caledonian thermal magnetization, acquired during the syntectonic metamorphism, subsequent exhumation and cooling.
9. Central and Eastern terranes relations
New 40Ar–39Ar dating results from mylonites developed along the BFZ in Ny Friesland are presented here, which shed new light on the spatial relationships of the Central and Eastern terranes in the Silurian–Devonian interval. To better determine the possible relative geographical positions of the Caledonian terranes of Svalbard in Early Palaeozoic time, palaeomagnetic data from pre-Devonian rock formations from different parts of the Svalbard Archipelago are needed. Currently, the only other published palaeomagnetic data concerning the pre-Devonian rocks of Svalbard are that of Maloof et al. (Reference Maloof, Halverson, Kirschwink, Schrag, Weiss and Hoffman2006), which are concerned with the Neoproterozoic rocks of Ny Friesland (Eastern Terrane). The palaeomagnetic results of Maloof et al. (Reference Maloof, Halverson, Kirschwink, Schrag, Weiss and Hoffman2006) from the Eastern Terrane are discussed in the light of the Caledonian re-magnetization of the Cambrian Slaklidalen Fm rocks of Hornsund (SW Terrane). To further this discussion, however, some consideration of the Caledonian deformation and metamorphism that has affected the Eastern Terrane (Ny Friesland) is needed.
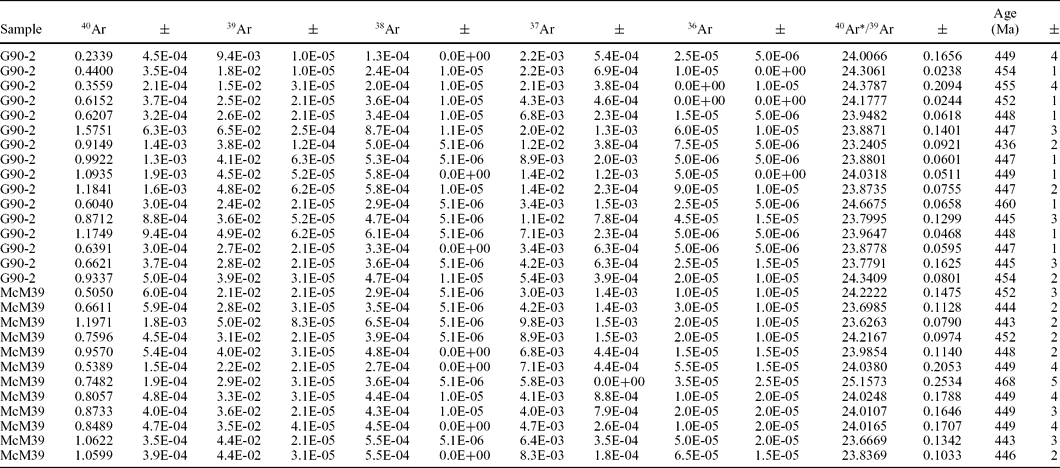
It is widely accepted that the N–S-trending BFZ, which forms the boundary between the Eastern and Central terranes of Svalbard (Harland & Wright, Reference Harland and Wright1979), also constitutes the eastern border of the Devonian Basin of Northern Svalbard (e.g. Manby & Lyberis, Reference Manby and Lyberis1992; Manby et al. Reference Manby, Lyberis, Chorowicz and Theidig1994). While no large-scale Devonian Basin controlling brittle fault is exposed onshore in Ny Friesland a number of N–S-trending, W-dipping, small-scale (of limited throw and lateral extent) faults are noticeable along the west coast of Ny Friesland. In Central Svalbard, however, larger expressions of the BFZ can be observed to juxtapose the Devonian–Carboniferous rocks and the sheared high-grade gneisses (see Harland, Reference Harland1997). Along the western margin of Ny Friesland the high-grade gneisses are retrograded to greenschist-facies assemblages over a 2–3 km wide zone with abundant microstructures demonstrating sinistral and E-vergent shear (cf. Manby, Reference Manby1990; fig. 6a, b in Lyberis & Manby, Reference Lyberis and Manby1999). This shear zone is taken here to represent the deeper ductile component of the BFZ which facilitated the assembly of the Eastern and Central terranes. The timing of these movements is controversial but recently acquired 40Ar–39Ar ages obtained from various white mica fractions separated from quartz-mica mylonites within the ductile shear zone give an average age of 450 Ma (Table 5), suggesting that significant ductile deformation ceased at this time along the BFZ. Nevertheless, this fault zone was active as a brittle structure during the filling of the Devonian Basin and its subsequent inversion (Manby & Lyberis, Reference Manby and Lyberis1992; Manby et al. Reference Manby, Lyberis, Chorowicz and Theidig1994). Seismic reflection profiles across the northern offshore margin of Svalbard show that the BFZ can be traced several kilometres offshore, north of the mainland (Eiken & Austegard, Reference Eiken and Austegard1987), where it is seen as a W-dipping extensional structure displacing undeformed post-Devonian sediments. The displacement of these rocks along the BFZ may have been the product of the post-Eocene extension of the western margin of Svalbard during the accretion of the Knipovitch Ridge (Eiken & Austegard, Reference Eiken and Austegard1987). The preservation of the 450 Ma 40Ar–39Ar ages from the ductile shear zone suggests that the later brittle movements were either located offshore or that their effects were so localized they did not disturb the isotope systematics in the sampled mylonites.
Table 5. 40Ar/39Ar analyses of hand picked muscovite fractions extracted from the Billefjorden Fault Zone quartz-mica mylonites of Western Ny Friesland (analyses performed at the Open University, UK)
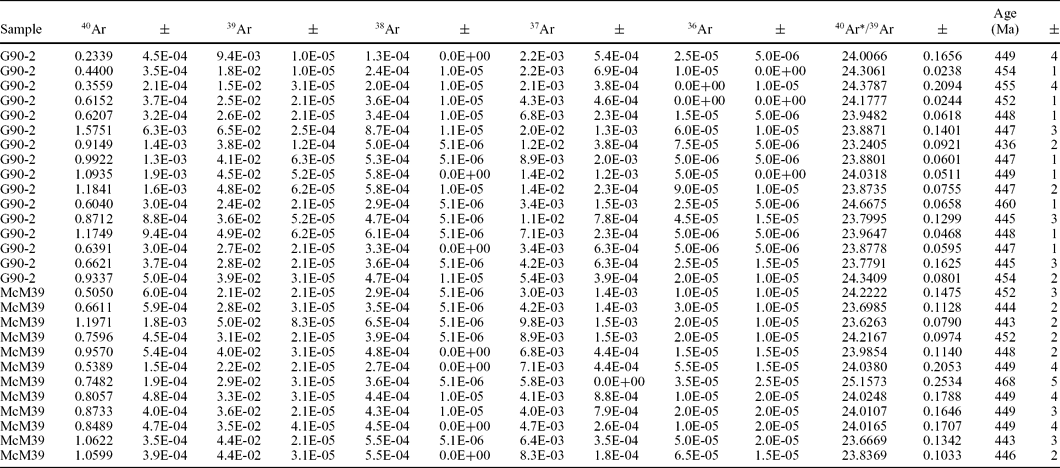
Statistical Mean Age = 450.6 ± 1.6 Ma (0.36%) 95% confidence. Weighted by data point errors only, 0 of 28 rejected. Mean Square Weighted Deviation = 9.2, probability = 0.000.
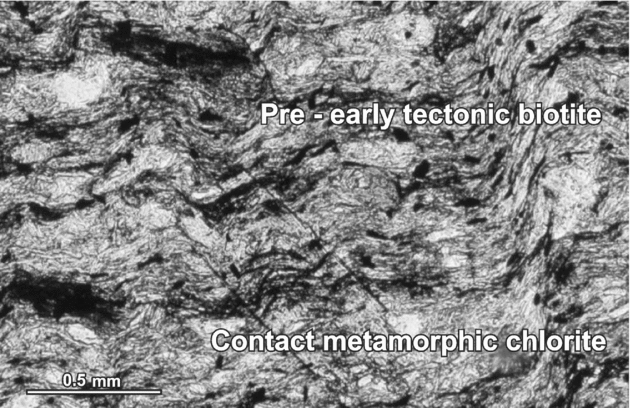
In the context of the effects of the Caledonian events it is notable that the Mid-Proterozoic Veteranen and Akademikerbreen (cf. Harland, Reference Harland1997) rocks of eastern Ny Friesland (the Eastern Terrane) described by Maloof et al. (Reference Maloof, Halverson, Kirschwink, Schrag, Weiss and Hoffman2006) are affected by large-scale, fault propagation, periclinal (D1/F1) folds with strong cleavage (S1) development in pelitic rocks. Low-grade regional metamorphism has accompanied this deformation with chlorite and/or biotite often seen as early to syntectonic phases lying in the S1 foliation in pelitic rocks. Other Veteranen Group (Harland, Reference Harland1997) pelites to the northwest of one of their (Raudberget) study areas, for example, are characterized by the presence of a regional metamorphic, early to pre-tectonic (with respect to the D1 deformation) biotite. A later contact metamorphic overprint, imposed by the intrusion of the Late Orogenic Chydeniusbreen Granite (Lyberis & Manby, Reference Lyberis and Manby1999), followed the development of the D2 crenulation folding (cf. Fig. 18). The presence of early tectonic (Caledonian) biotite has also been observed (by G. M. Manby) in some of the semipelitic rocks associated with the tillite-bearing Polarisbreen Group rocks collected from the Backlundtoppen area by Hambrey (Reference Hambrey1982). To the west of their (Maloof et al. Reference Maloof, Halverson, Kirschwink, Schrag, Weiss and Hoffman2006) study area, the Middle Proterozoic succession (Lomfjorden Super Group, Harland, Reference Harland1997) of Eastern Svalbard is juxtaposed against the high-grade schists and gneisses of the Early Proterozoic (Studendorfbreen Super Group, Harland, Reference Harland1997) of Ny Friesland. The relationship between these two successions is controversial, with some authors (e.g. Harland, Reference Harland1997) suggesting that the entire succession is effectively continuous. Others, however, (Manby, Reference Manby1990; Lyberis & Manby, Reference Lyberis and Manby1999) have drawn attention to the presence of a wide mylonite zone (Eolussletta Shear Zone, Fig. 2) separating the two successions. In northern Ny Friesland this shear zone is steeply inclined with numerous sinistral kinematic indicators (see Lyberis & Manby, Reference Lyberis and Manby1999, fig. 6) while in Central Ny Friesland (G. M. Manby, unpub. data) the younger and lower greenschist-facies rocks to the east are overthrust from the west by the upper amphibolite-facies schists and gneisses. Whatever the initial relations of these two rock sequences were, it is clear that the Caledonian events have assembled them into a single tectonic unit. To confirm the unity of these two successions and the amalgamation of the Eastern and Central terranes by 450 Ma, the Caledonian palaeomagnetic record together with supporting isotopic age determinations from the various blocks are needed.
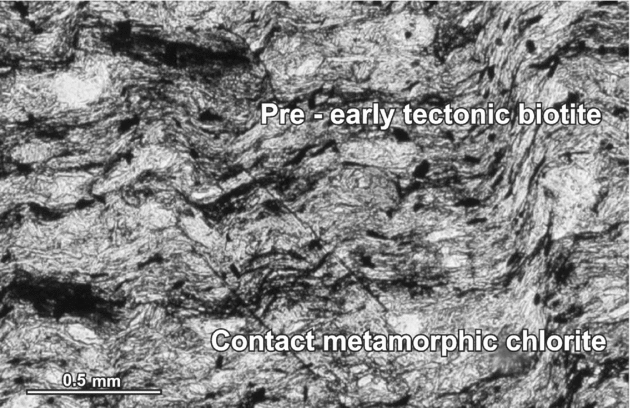
Figure 18. Thin-section of a semi-pelite from the Lower Veteranen Group, south Glasgowbreen, Ny Friesland. This shows a pre-early S1 biotite wrapped by the S1 foliation with small pressure shadows. The larger almost transparent chlorite that overgrows the S1 foliation and the later crenulation folds is a contact metamorphic phase related to the intrusion of the Chydenius Granite a few kilometres to the east.
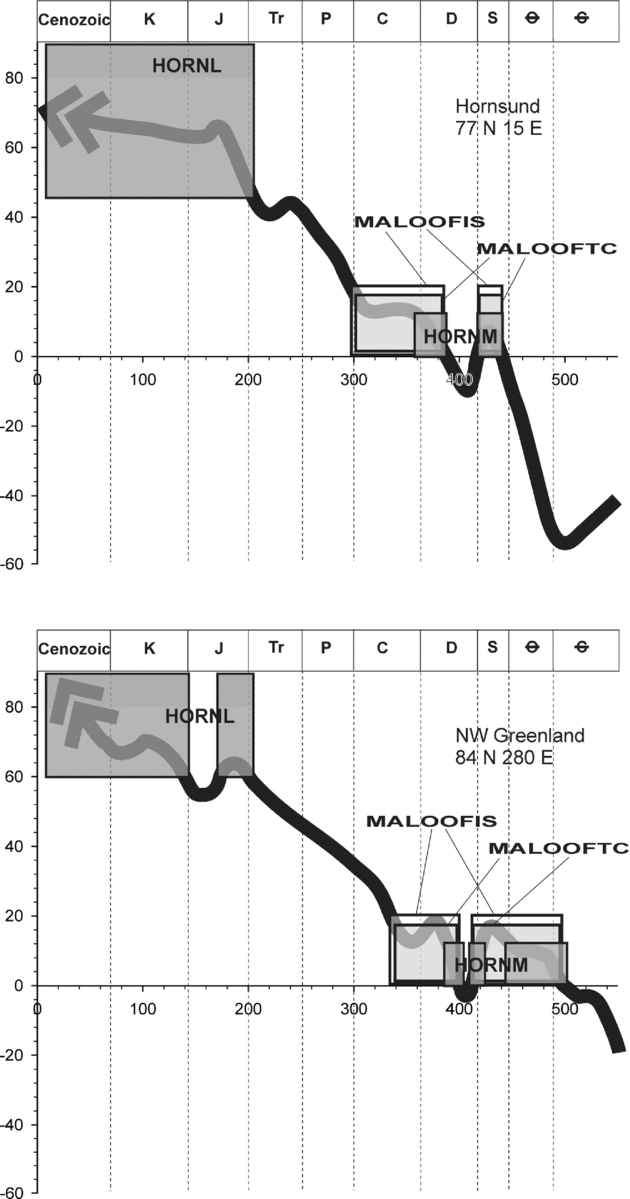
Despite the above observations concerning the expressions of Caledonian metamorphism and deformation in Ny Friesland, Maloof et al. (Reference Maloof, Halverson, Kirschwink, Schrag, Weiss and Hoffman2006) maintain that there is no sign of Caledonian re-magnetization within their investigated rocks and all three high-temperature components recognized in three sampled formations are primary. Taking into account the results from Hornsund and after careful recalculation of the data presented by Maloof et al. (Reference Maloof, Halverson, Kirschwink, Schrag, Weiss and Hoffman2006), we suggest that their lGfm ChRM derived from the Middle Proterozoic Lower Grusdievbreen Fm (lGfm) of the Ny Friesland Eastern Terrane (NFET of Harland, Reference Harland1997), which they interpret to be primary, may equally be a product of Caledonian re-magnetization. The lGfmVGP of Maloof et al. (Reference Maloof, Halverson, Kirschwink, Schrag, Weiss and Hoffman2006) lies close to HORNMVGP (Φ = −18.5°, Λ = 359°, Dp/Dm = 5.8°/11.4°, Plat = 6°; Fig. 17). None of the tests derived by Maloof et al. (Reference Maloof, Halverson, Kirschwink, Schrag, Weiss and Hoffman2006) prove, unequivocally, the primary character of the lGfmVGP. Their lGfm ChRM is generally sub-parallel to the strike of regional folds (Maloof et al. Reference Maloof, Halverson, Kirschwink, Schrag, Weiss and Hoffman2006), and tectonic corrections applied by Maloof et al. (Reference Maloof, Halverson, Kirschwink, Schrag, Weiss and Hoffman2006) do not change, significantly, its direction. The mean directions of the lGfm component calculated on the level of the sections before and after 100% tectonic correction fall within the α95% circles of each other and are not distinct at the 5% significance level (see Maloof et al. Reference Maloof, Halverson, Kirschwink, Schrag, Weiss and Hoffman2006, their table 1). The fit of our HORNMVGP with their lGfmVGP is improved further if the Grusdievbreen Fm ChRM is regarded as post-folding secondary magnetic overprint and if its VGP is recalculated for the lGfm in situ position, without any tectonic correction (D = 357.9°E, I = 19.2°N, α95% = 18.8°, Φ = −20.4°, Λ = 20.4°, Dp/Dm = 10.2°/19.6°, Plat = 9.9°; Fig. 17). For this recalculation the average location, 79°27′N, 18°12′E, of the Maloof et al. (Reference Maloof, Halverson, Kirschwink, Schrag, Weiss and Hoffman2006) sampling sites (see their table 1) was used here. The McFadden & McElhinny (Reference McFadden and McElhinny1990) reversal tests are also inconclusive for the lGfm because the collection of the samples with reversed polarity recognized in the sampled sections is too small (Maloof et al. Reference Maloof, Halverson, Kirschwink, Schrag, Weiss and Hoffman2006). They may equally be a product of selective demagnetization during another pulse of the Caledonian magnetic event.
It would appear that the widespread low-grade metamorphism exhibited by rocks of pelitic composition in eastern Ny Friesland has not been given due consideration by Maloof et al. (Reference Maloof, Halverson, Kirschwink, Schrag, Weiss and Hoffman2006). Consequently, their general conclusion, that the region was not affected by any significant thermal or deformation events in the Late Proterozoic–Silurian interval, is questionable.
The position of the HORNMVGP on the Baltica–Laurentia reference paths together with the lack of significant post 450 Ma lateral displacement along the BFZ that separates the two terranes provides convincing evidence for their amalgamation by Late Silurian time. The similarity of the palaeolatitudes in which the HORNM and the lGfm (Fig. 19) components were magnetized, together with the overlap of the VGP ovals from the Central and Eastern terranes (Fig. 17) suggests that both were subjected to the metamorphically induced Caledonian re-magnetization event.
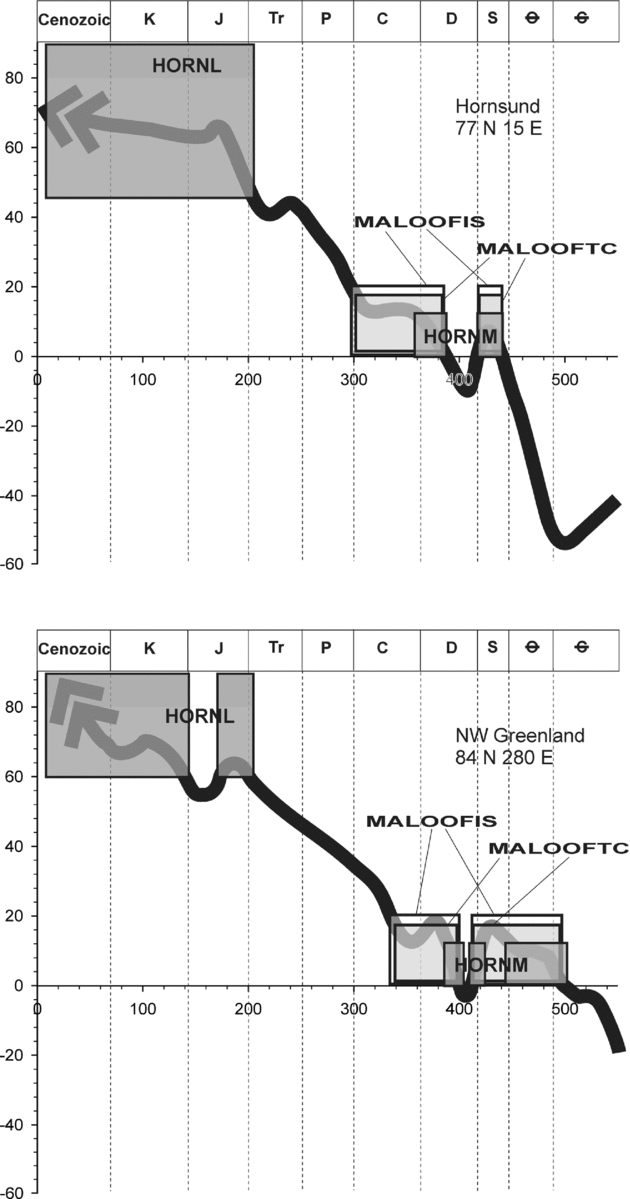
Figure 19. Palaeolatitudes of Central and Eastern terranes during magnetizations of palaeomagnetic directions from the Slaklidalen Fm (this study) and Grusdievbreen Fm (Maloof et al. Reference Maloof, Halverson, Kirschwink, Schrag, Weiss and Hoffman2006) with comparison to palaeolatitude curves of Hornsund and Northeastern Greenland. Palaeolatitude curves for Hornsund and Northeastern Greenland have been calculated, respectively, from Baltica and Laurentia APWPs, taken from GMAP 2002, 2003 palaeopole libraries. Palaeolatitudes of Central and Eastern terranes have been presented with confidence limits defined by Dp parameters; other abbreviations are as in Figure 16.
10. Conclusions
In conclusion it should be stressed that although our palaeomagnetic results from the Cambrian Slaklidalen Fm of Hornsund generally stabilize the position of Svalbard relative to Laurentia and Baltica from Late Silurian time, Late Palaeozoic, Mesozoic and Cenozoic crustal movements in the target area cannot be completely excluded. The Silurian VGP from Hornsund was obtained with defined precision, which in this particular case can be assessed to within ±6° along the meridian and ±11.5° along the parallel (Figs 16, 17, 19; Table 4). Precise reconstructions of Svalbard's pre-Caledonian terranes relative to their proposed counterparts in East and Northeast Greenland are not yet possible, primarily because reliable palaeomagnetic data from the latter areas are lacking. Further, the Palaeozoic to Mesozoic positions of Greenland relative to North America are imprecisely known. The uncertainty in any Palaeozoic reconstructions of the Arctic Caledonides is added to by the unknown scale of the crustal extension that occurred across the Barents and Northeast Greenland shelves during the opening of the North Atlantic and Arctic Ocean basins (Mosar et al. Reference Mosar, Torsvik and Eide2002).
The present study has shown that at least two of the major terranes of Svalbard as defined by previous authors occupied similar geographical locations by Silurian time and the large-scale Late Devonian left lateral displacements previously proposed are not confirmed. To test the terrane models for other regions of Svalbard, which invoke large-scale left-lateral displacements on their bounding faults, it is evident that further palaeomagnetic studies, combined with better constrained isotopic ages of Caledonian tectonothermal events, are required from the various Svalbard terranes as well as their proposed counterparts in Greenland.
Acknowledgements
This work was supported by the research project NO 3 P04D 037 25 of the Polish State Committee for Scientific Research. We are grateful to Dr Maciej Zalewski, Dr Piotr Głowacki and members of the XXII, XXV and XXVII expeditions to Polish Polar Station in Hornsund for the logistic support of palaeomagnetic field investigation during Arctic seasons 1999–2000, summer 2002 and summer 2004. We are also thankful to Dr Rafał Szaniawski and Dr Jacek Bednarek for field assistance during field investigations in Hornsund in seasons 2002 and 2004. We would like to express our thanks to Aleksandra Hołda-Michalska (Institute of Palaeobiology, Polish Academy of Sciences, Warszawa) for preparation of maps and figures. We would also like to thank the reviewers, Dr Michael S. Petronis, Dr Niels Abrahamsen and Dr Phil Leat for suggesting improvements to the original manuscript.


