


1. Introduction
The eastern shore of Georgian Bay, Ontario, comprises one of the best geological transects across the Central Gneiss Belt of the Grenville Province, with nearly 200 km of almost continuous bedrock outcrop (Fig. 1). One feature of particular interest is a 40 km along-strike exposure of the principal Grenvillian structural boundary of the gneiss belt, the Allochthon Boundary Thrust (ABT), which separates largely in situ ‘parautochthonous’ crust to the northwest from far-travelled allochthonous rocks to the southeast (Rivers et al. Reference Rivers, Martignole, Gower and Davidson1989). It should be noted however that in its accepted usage in a Grenvillian context (e.g. Culshaw et al. Reference Culshaw, Jamieson, Ketchum, Wodicka, Corrigan and Reynolds1997), the term ‘allochthonous’ does not mean that these rocks are exotic to Laurentia.
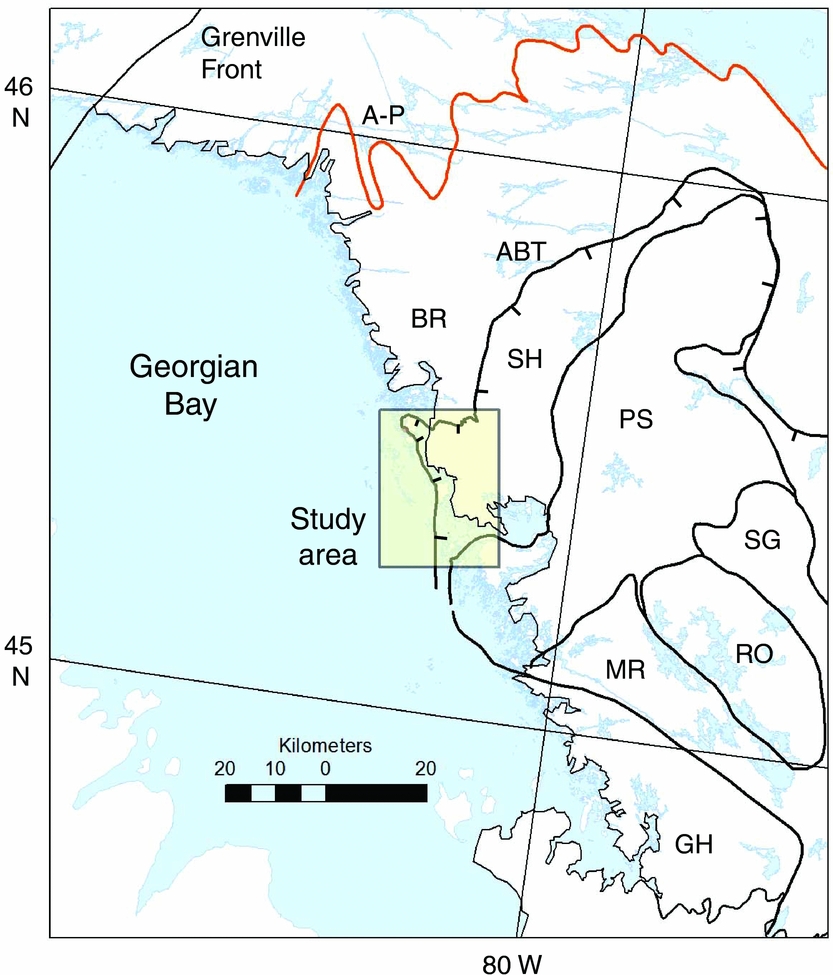
Figure 1. Map of the Georgian Bay (Lake Huron) showing Grenvillian lithotectonic domains after Culshaw et al. (Reference Culshaw, Jamieson, Ketchum, Wodicka, Corrigan and Reynolds1997). BR – Britt; SH – Shawanaga; PS – Parry Sound; GH – Go Home; MR – Moon River; RO – Rosseau; SG – Seguin; ABT – Allochthon Boundary Thrust (ticks indicate local dip direction); A-P – Archaean–Proterozoic suture. Boxed area shows extent of present study area (Fig. 2).
In the earliest detailed report of modern geological mapping on the eastern shore of Georgian Bay, Davidson, Culshaw & Nadeau (Reference Davidson, Culshaw and Nadeau1982) recognized two major shear zones. The more prominent marked the northwestern limit of the lithologically distinctive Parry Sound allochthon, hence called the Parry Sound Shear Zone (PSSZ). However, another major tectonite zone, which appeared to contain meta-eclogite nodules, was also observed further north.
When mapping the location of the ABT on a province-wide basis, Rivers et al. (Reference Rivers, Martignole, Gower and Davidson1989) identified the PSSZ as the probable local expression of the ABT. Therefore, the tectonite further north within the Britt domain was named the Central Britt Shear Zone (CBSZ) by Jamieson et al. (Reference Jamieson, Culshaw, Wodicka, Corrigan and Ketchum1992). The latter authors also identified the PSSZ as the local expression of the ABT. However, seismic reflection studies (White et al. Reference White, Easton, Culshaw, Milkereit, Forsyth, Carr, Green and Davidson1994) implied that the sole thrust of the allochthonous belt was more closely identified with the structurally lower CBSZ than the PSSZ. Since a lithotectonic domain should not straddle a major tectonic boundary, the crust south of the allochthon boundary was subsequently renamed the Shawanaga domain, and the CBSZ was renamed as the Shawanaga Shear Zone (SSZ) (Culshaw et al. Reference Culshaw, Jamieson, Ketchum, Wodicka, Corrigan and Reynolds1997). The SSZ was formally identified as the local manifestation of the ABT by Ketchum et al. (Reference Ketchum, Heaman, Krogh, Culshaw and Jamieson1998).
Although Culshaw et al. (Reference Culshaw, Ketchum, Wodicka and Wallace1994) did not formally identify the CBSZ as the location of the ABT, they did recognize distinct ‘gneiss assemblages’ on either side of the boundary. These assemblages were distinguished by their different geological histories, including the presence of distinct metabasic rock suites. This concept was extended by Ketchum et al. (Reference Ketchum, Heaman, Krogh, Culshaw and Jamieson1998) and Ketchum & Davidson (Reference Ketchum and Davidson2000), who argued that the presence of two distinct suites of metabasic rocks on either side of the ABT implied significant NW-directed movement across the boundary, juxtaposing crustal segments with distinct geological histories that were once widely separated. Consistent with this observation, it was also shown by Dickin (Reference Dickin2000) that the ABT separates crust with distinct Nd model ages, typically > 1.8 Ga to the north and < 1.8 Ga to the south.
In a detailed Nd isotope study of the ABT boundary between Parry Sound and Burk's Falls Ontario, Dickin, Moretton & North (Reference Dickin, Moretton and North2008) argued that the reason for these distinct model age signatures on either side of the ABT was that the Laurentian margin was progressively reworked by a continental margin arc through much of late Palaeoproterozoic and early Mesoproterozoic time, as earlier proposed by Dickin & McNutt (Reference Dickin, McNutt, Gower, Rivers and Ryan1990). This caused Nd model ages to young to the south, so that when the margin was telescoped by Grenvillian tectonism during the Ottawan event, rocks with mixed Palaeoproterozoic–Mesoproterozoic isotope signatures in the south were juxtaposed against the less magmatically reworked Palaeoproterozoic margin to the north.
In addition to the two suites of metabasic rocks noted above, petrological studies (Ketchum & Davidson, Reference Ketchum and Davidson2000) also revealed that rocks interpreted as retrogressed eclogites were found in close proximity to the ABT, attributed elsewhere to exhumation of mafic lower crustal rocks on a crust-scale ramp (Rivers, van Gool & Connelly, Reference Rivers, van Gool and Connelly1993; Indares & Dunning, Reference Indares and Dunning1997). Several of these eclogitic bodies are exposed along the Georgian Bay segment of the ABT examined in the present study, and these provide additional constraints on the location of the boundary, making this area particularly significant as a case study.
Detailed Nd isotope mapping has been carried out on several other segments of the ABT in Ontario and western Quebec (see references in Dickin et al. Reference Dickin, Cooper, Guo, Hutton, Martin, Sharma and Zelek2012). However, the Georgian Bay segment is of special interest as the most southerly exposed segment in a geologically well-studied area, beyond which its trajectory is presently unclear. Therefore, study of this section was undertaken in the hope that it would shed light on the character and trajectory of the boundary at its southernmost end.
2. Sampling and analytical techniques
Since the objective of this study was to characterize the protolith age of the crust as an estimate of its regional crustal formation age, sampling was limited to granitoid orthogneisses that are believed to form by anatexis of more mafic arc crust. Previous studies have shown that granitoids of this type have Nd isotope signatures that are consistent and predictable, allowing reliable estimates to be determined of the formation age of the crust using the depleted mantle model of DePaolo (Reference DePaolo1981).
Tonalite–trondhjemite–granodiorite (TTG-type) gneisses were sampled where possible, since these are believed to be the best examples of the rock types that form primitive arc crust. More granitic samples were used as a second choice, since these may have a more complex geological evolution, but usually still preserve the original formation age of arc crust. For example, a well-developed lithology in the present study area is the Pointe au-Baril Complex of Culshaw et al. (Reference Culshaw, Corrigan, Drage and Wallace1988), characterized by a distinctive megacrystic granitoid lithology. This c. 1450 Ma plutonic suite was sampled in some parts of the study area (asterisked samples in Table 1) where older country-rock grey gneisses were not available. North of the present study area, the Britt pluton, with similar age and petrology, has a Nd isotope signature indicative of a regional crustal melt (Dickin, McNutt & Clifford, Reference Dickin, McNutt and Clifford1990). Hence, it was inferred that samples of the Point au-Baril suite would likewise preserve the regional crustal Nd isotope signature in the present study area. This issue will be discussed further below.
Table 1. Nd isotope data

Note: megacrystic sample (map) numbers indicated by (*); other late granites indicated by (^).
In contrast to granitoid rocks, sampling of mafic gneisses was avoided as far as possible, because of the increased likelihood of a younger mantle-derived component in these rock types. Metasedimentary gneisses were also excluded because of their uncertain sedimentary provenance.
On average, 1 kg of rock was crushed, after the removal of any weathered, veined or migmatized material, and careful attention was given to obtain a fine powder that was representative of the whole rock. Major-element analyses were performed by Activation Laboratories, Ancaster, Ontario, using Li-borate fusion inductively coupled plasma (ICP) analysis. The accuracy of Actlabs data is ensured by the inclusion of many international reference standards as part of the analytical protocol.
Sm–Nd analysis followed our established procedures. After a four-day dissolution at 125°C using HF and HNO3, samples were converted to the chloride form before splitting and spiking. Standard cation and reverse phase column separation methods were used. Nd isotope analyses were performed on a VG isomass 354 mass spectrometer at McMaster University using double filaments and a 4 collector peak switching algorithm, and were normalized to a 146Nd/144Nd ratio of 0.7219. Average within-run precision on the samples was ± 0.000013 (2 sigma), and an average value of 0.51185 ± 2 (2 sigma population) was determined for the La Jolla Nd standard during this work. The reproducibility of 147Sm/144Nd and 143Nd/144Nd is estimated at 0.1% and 0.002% (1 sigma), respectively, leading to an analytical uncertainty on each model age of c. 20 Ma (2 sigma), based on empirical experience over several years of analysing duplicate dissolutions.
3. Nd isotope results
Nearly 50 new Nd isotope analyses in the general vicinity of the ABT in the study area are presented in Table 1. New sample localities are shown by numbered points in Figure 2, along with published data north of latitude 45.5N (Dickin, Moretton & North, Reference Dickin, Moretton and North2008). Localities are coloured according to TDM model age, with blue circles indicating TDM ages over 1.8 Ga, previously argued to represent the parautochthon. However, unlike our previous work, samples from the allochthon (with one exception, #41) have TDM ages less than 1.65 Ga (pink squares). Hence, the ABT is drawn between these two suites as a solid line in Figure 2.
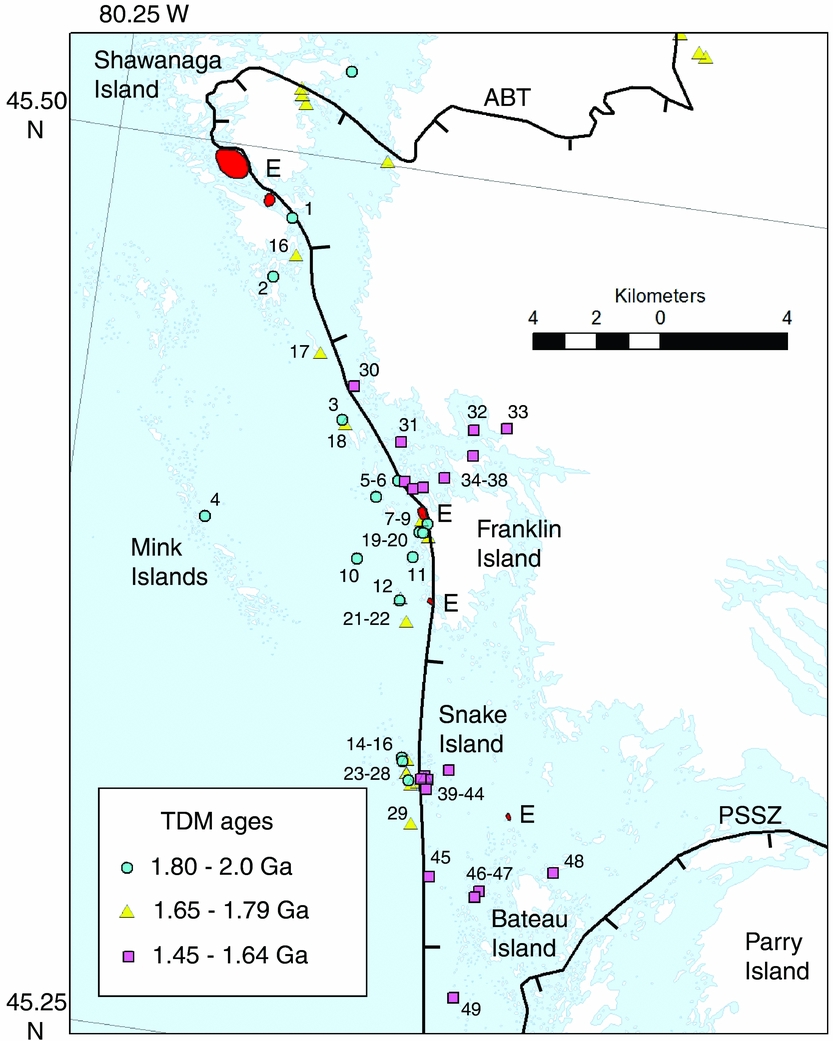
Figure 2. Map of the Shawanaga area showing analysed sample localities numbered in Table 1, along with a trajectory of the ABT based on a TDM age cut-off of 1.65 Ga. Red shading – retrogressed eclogite (E); PSSZ – Parry Sound Shear Zone (ticks show local dip direction).
In the interval between Shawanaga Island and Franklin Island, the trajectory of the ABT based on Nd isotope mapping agrees with the location proposed in several published works (e.g. Culshaw et al. Reference Culshaw, Ketchum, Wodicka and Wallace1994, Reference Culshaw, Corrigan, Ketchum, Wallace and Wodicka2004a ; Ketchum & Davidson, Reference Ketchum and Davidson2000). This trajectory is supported by the location of several pods of retrogressed eclogite in the immediate vicinity of the boundary (red shading, E, in Fig. 2). However, to the northeast, eclogites are lacking, whereas to the south the evidence is equivocal; hence, there is less agreement about the location of the boundary in these areas.
This problem will be discussed further below. However, it is first necessary to discuss a third suite of samples in the study area with intermediate TDM ages (1.65–1.8 Ga) that was found at scattered localities to the west of the agreed location of the ABT, within the parautochthon. These younger ages are attributed to magmatic reworking of the parautochthon by younger plutonism, in contrast to more ‘pristine’ samples of the parautochthon with TDM ages > 1.8 Ga. However, it is important to note here that the distinction between magmatically reworked and more pristine Nd isotope signatures does not correspond to the distinction between c. 1450 Ma megacrystic granitoids (Point au-Baril Complex) and their older grey-gneiss country rocks. As shown in Table 1, samples recognized as megacrystic granitoids plot in both of the isotopically defined suites. Furthermore, it was already demonstrated by Dickin, McNutt & Clifford (Reference Dickin, McNutt and Clifford1990) that the 1450 Ma Britt granite preserves the isotopic signature of the crust from which it was derived. Therefore, it is inferred that the samples with intermediate (1.65–1.8 Ga) model ages resulted from pre-1450 Ma ensialic arc plutonism on the Laurentian margin, as proposed by Dickin & McNutt (Reference Dickin, McNutt, Gower, Rivers and Ryan1990).
To compare the isotopic signatures of the more pristine and magmatically reworked sample suites, they are plotted on a Sm–Nd isochron diagram in Figure 3, along with published reference lines for the parautochthon and allochthon (Dickin, Moretton & North, Reference Dickin, Moretton and North2008; Dickin et al. Reference Dickin, Herrell, Moore, Cooper and Pearson2014). Localities argued to represent relatively pristine samples of the parautochthon in the present study area (blue circles) fall close to the Palaeoproterozoic array of Dickin, Moretton & North (Reference Dickin, Moretton and North2008), attributed to a juvenile arc that was accreted to the Archaean nucleus of Laurentia (Dickin & McNutt, Reference Dickin and McNutt1989). On the other hand, samples from east of the agreed trajectory of the ABT in the study area (pink squares) fall close to a best-fit regression through Mesoproterozoic gneisses from allochthonous klippen analysed by Dickin et al. (Reference Dickin, Herrell, Moore, Cooper and Pearson2014). Finally, samples from west of the ABT trajectory with TDM ages less than 1.8 Ga fall between the juvenile Palaeoproterozoic array and the regression line through the allochthonous klippen. These samples (yellow triangles) show evidence of mixing between Palaeoproterozoic and Mesoproterozoic Nd, a model that will be tested below.

Figure 3. Sm–Nd isochron diagram showing rocks from the Shawanaga area relative to other suites from the SW Grenville Province. Solid reference line and crosses – Palaeoproterozoic parautochthon (Dickin, Moretton & North, Reference Dickin, Moretton and North2008); dashed line – best-fit regression to allochthonous klippen (Dickin et al. Reference Dickin, Herrell, Moore, Cooper and Pearson2014).
As noted in the introduction, we previously argued that a TDM age cut-off of 1.8 Ga could be used to distinguish between rocks of the allochthon and parautochthon. We also showed that this tool generally agreed with the discriminant tool based on metabasic rocks developed by Ketchum & Davidson (Reference Ketchum and Davidson2000). Nevertheless, it must be recognized that the Nd isotope discriminant is based on the geological history of the crustal segment under investigation, and is therefore subject to geological complexity, just like any other discriminant tool.
Specifically, the discriminant is based on the premise that areas of crust involved in lateral convergence during the Ottawan (Grenvillian) orogeny had distinct ranges of Nd model ages because they were once more widely separated segments of a single continental margin. Thus, the parautochthon consists of either Archaean crust that represents a southward continuation of the Superior Province, or Palaeoproterozoic crust that was accreted to the Archaean craton as a juvenile Palaeoproterozoic arc (Dickin & McNutt, Reference Dickin and McNutt1989; Dickin, Reference Dickin1998). On the other hand, isotopic signatures in the allochthonous belt were attributed by Dickin, Moretton & North (Reference Dickin, Moretton and North2008) to a long-lived Mesoproterozoic ensialic arc established on the older margin.
In areas where we have used the Nd isotope discriminant thus far, these two crustal regions have been resolved with extremely few contradictions (see Moore & Dickin, Reference Moore and Dickin2011). However, it must be recognized that as one goes further to the south in the parautochthon, one will eventually reach the region of the ensialic Mesoproterozoic arc that was established on the older margin. This is what we believe to be happening in the present study area.
Examination of the distribution of the three suites identified above shows that rocks interpreted as ‘pristine parautochthon’ and those attributed to magmatic reworking are spatially intermingled on the west side of the boundary. There is no evidence from their distribution that the samples attributed to magmatic reworking represent tectonic mixing along the boundary. On the contrary, pristine Palaeoproterozoic model ages (TDM > 1.8 Ga) are often found immediately to the west of the ABT boundary. Therefore, to test the model that magmatic mixing processes gave rise to the intermediate model ages, the geochemistry of the sample suites will now be examined.
4. Petrochemical data
In order to characterize the petrology of the analysed suites, major-element data were used to generate bivariate and discriminant plots (Figs 4, 5). On these plots, the subset of samples identified as megacrystic granitoids are also distinguished. Figure 4 presents a variation diagram of MgO against silica, with the Kohistan arc of the Himalayas (Jagoutz et al. Reference Jagoutz, Burg, Hussain, Dawood, Pettke, Iizuka and Maruyama2009) plotted for reference. This arc is used as a representative of a mature oceanic arc, for comparison with the present study area.

Figure 4. Variation diagram for isotopic suites recognized from the present study area, compared with the Kohistan arc. MC – megacrystic plutons.
The degree of scatter seen in this plot is what is expected for suites of granitoids emplaced within a single tectonic context but not directly linked by magmatic processes. However, this plot does not resolve differences in tectonomagmatic context. Hence, the data are plotted in Figure 5 on the Q (Quartz)–P (Plagioclase) diagram of Debon & LeFort (Reference Debon and LeFort1983), which uses whole-rock major-element chemistry to generate a chemical version of the Streckeisen (Reference Streckeisen1973) classification of granitoid rocks.
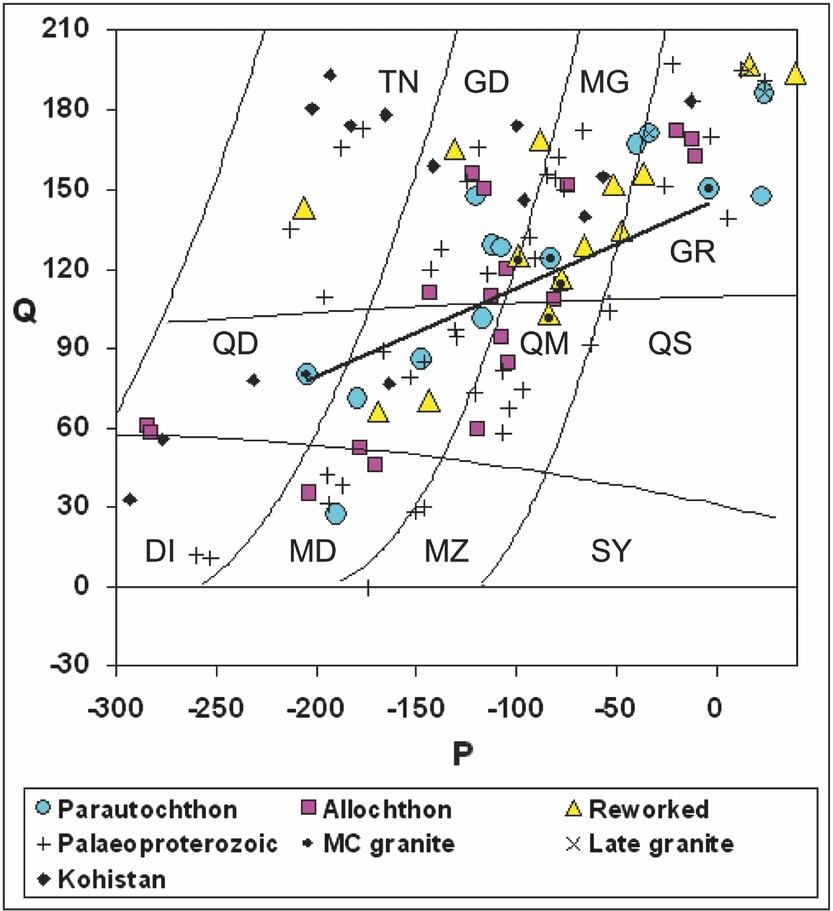
Figure 5. Q–P diagram of Debon & LeFort (Reference Debon and LeFort1983), which generates an empirical Streckeisen diagram. TN – tonalite; GD – granodiorite; MG – monzogranite; GR – granite; QD – quartz diorite; QMD – quartz monzodiorite; QMZ – quartz monzonite; QSY – quartz syenite; DI – diorite; MD – monzodiorite; MZ – monzonite; SY – syenites; heavy line – trend of megacrystic granitoids.
On this plot, samples of the Kohistan arc (Jagoutz et al. Reference Jagoutz, Burg, Hussain, Dawood, Pettke, Iizuka and Maruyama2009) trend along the left and upper edge of the diagram, characteristic of oceanic arcs. In contrast, most samples in the present study trend across the middle of the diagram, characteristic of ensialic arcs (Martin & Dickin, Reference Martin and Dickin2005). This includes samples from west of the ABT interpreted above as ‘pristine’ Palaeoproterozoic crust. However, it was argued by Dickin & McNutt (Reference Dickin, McNutt, Gower, Rivers and Ryan1990) that after the accretion of a Palaeoproterozoic arc terrane, a subduction flip caused the newly accreted margin to be heavily reworked in the Palaeoproterozoic Killarnian ensialic arc. This would have significantly affected the geochemistry of the samples, but barely affected their isotopes, since the ensialic arc was only a few tens of Ma younger than the accreted arc. However, the younger Nd model ages attributed to magmatic reworking of the parautochthon in the present study imply a much longer-lived ensialic arc system.
A younger limit for this arc is given by the 1450 Ma megacrystic granite suite, which trends across the middle of the Q–P diagram with a concentration of points near the quartz monzonite – monzogranite boundary. The Britt granite, which has similar petrology (Dickin, McNutt & Clifford, Reference Dickin, McNutt and Clifford1990), was attributed to back-arc magmatism behind the Muskoka continental margin arc (Dickin, McNutt & Clifford, Reference Dickin, McNutt and Clifford1990; Slagstad et al. Reference Slagstad, Culshaw, Daly and Jamieson2009). However, since isotopic mixing is observed in plutonic orthogneisses that form older country rocks to the megacrystic suite, it is inferred that the isotopic mixing occurred in an older ensialic arc over the period from c. 1.7 to 1.5 Ga. The duration of this event is not well established, but a 1622 Ma U–Pb age claimed from north of the ABT near Shawanaga would be representative of such activity (unpub. U–Pb age cited by Nadeau & van Breemen, Reference Nadeau and van Breemen1998).
The mixing process proposed during magmatic reworking can be further examined on a plot of epsilon Nd against Nd concentration (Fig. 6). Epsilon (t) values are calculated at 1.45 Ga because this is the principal age of Mesoproterozoic magmatism revealed by U–Pb dating (van Breemen, Reference van Breemen, Moore, Davidson and Baer1986; Corrigan, Culshaw & Mortensen, Reference Corrigan, Culshaw and Mortensen1994; Ketchum et al. Reference Ketchum, Jamieson, Heaman, Culshaw and Krogh1994). However, in view of the relatively limited range of Sm/Nd ratios in the sample suites, Nd isotope compositions would have evolved along sub-parallel isotopic growth lines, so that the precise value of t is unimportant, so long as the same value is used for all samples.
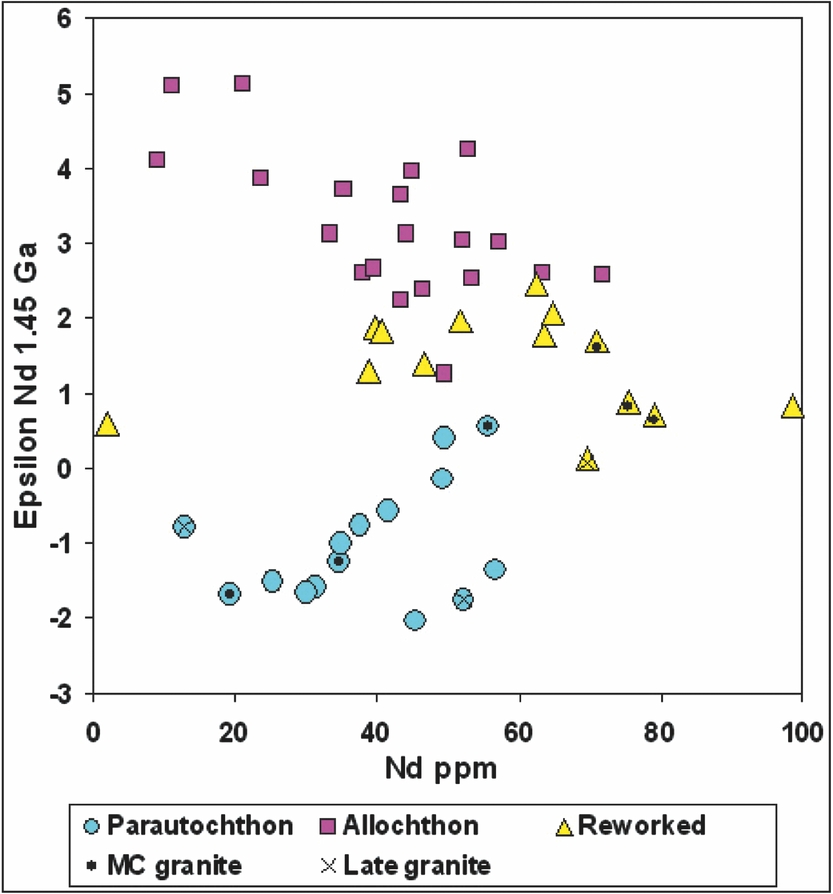
Figure 6. Plot of epsilon Nd at 1.45 Ga against Nd concentration for analysed samples.
The suite attributed to plutonic reworking has intermediate epsilon Nd values, as expected, but it also has generally higher Nd concentrations. The one exception (#16 = SH5) also has an abnormal composition on the Q–P plot (Fig. 5). The higher Nd contents in most of the isotopically mixed samples are attributed to additional magmatic differentiation during re-melting and magma mixing events.
Since this is the most southerly development of well-characterized parautochthonous rocks seen in the Grenville Province, we believe it was subjected to more intense Mesoproterozoic magmatic reworking than the parautochthonous crust further north. Specifically, we suggest that the northern end of the present study area represents the approximate northwesterly limit of intensive introduction of early Mesoproterozoic mantle-derived material into the crust. However, as a magmatic front rather than a terrane boundary, this limit is irregular.
5. Discussion
It is important to compare the ABT trajectory based on our Nd isotope data with that shown on published geological maps. This is done using detailed maps of the northerly and southerly parts of the study area (Figs 7, 8). Figure 7 shows Nd isotope localities relative to alternative trajectories for the ABT boundary in the northerly area. As noted above, all proposals coincide for the segment south of Shawanaga Island, where two pods of retrogressed eclogite are observed in the immediate footwall of the ABT. Their presence in the footwall may seem surprising, since such bodies were presumably exhumed up a crustal-scale ramp (Rivers, van Gool & Connelly, Reference Rivers, van Gool and Connelly1993) as part of the hangingwall. However, the ABT is also known as a zone of extensional shearing, and such motions could have ‘buried’ the denser eclogite pods in the footwall during plastic deformation in the deep crust. However, the fact that the ABT deformation zone, the TDM age boundary and the location of eclogite pods all closely coincide is evidence that between Shawanaga Island and Franklin Island, extensional motions followed almost exactly along the older thrust boundary.
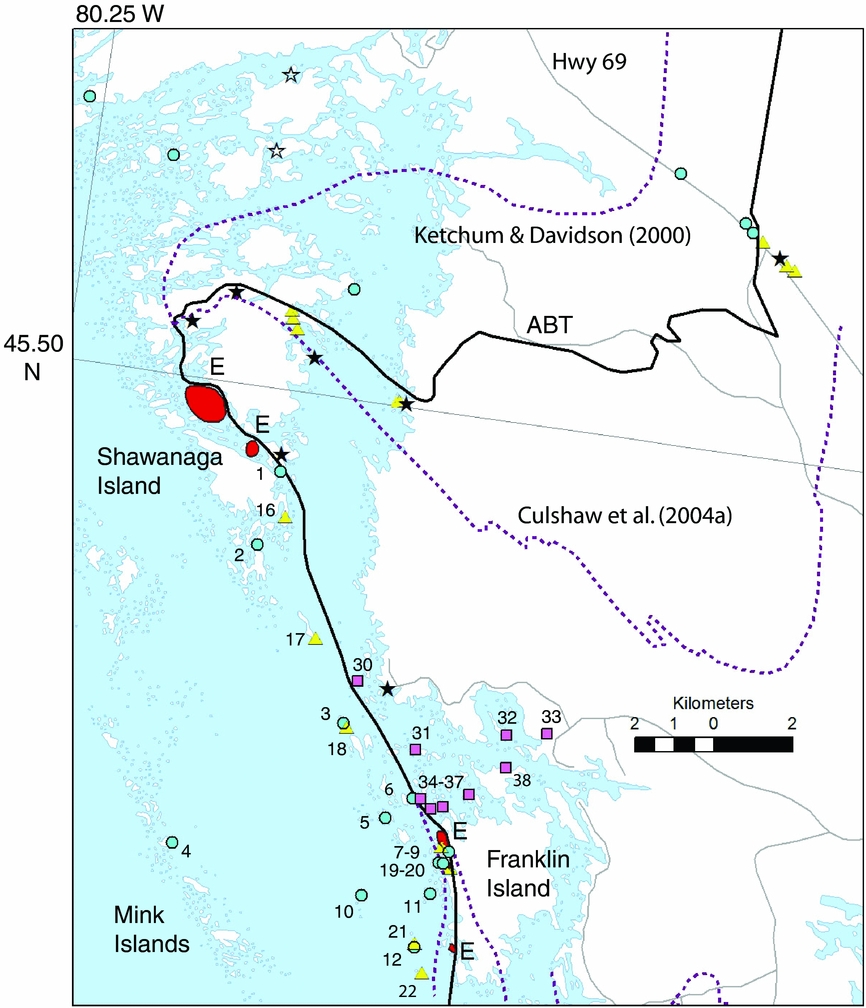
Figure 7. Map of the northern part of the study area showing Nd sample localities (symbols as in Fig. 2) along with metabasic suites. Open stars – equivalents to 1.24 Ga Sudbury diabase; solid stars – 1.165 Ga coronitic metagabbro (sample on Highway 69 dated); dotted lines – alternative locations of the ABT in published work.
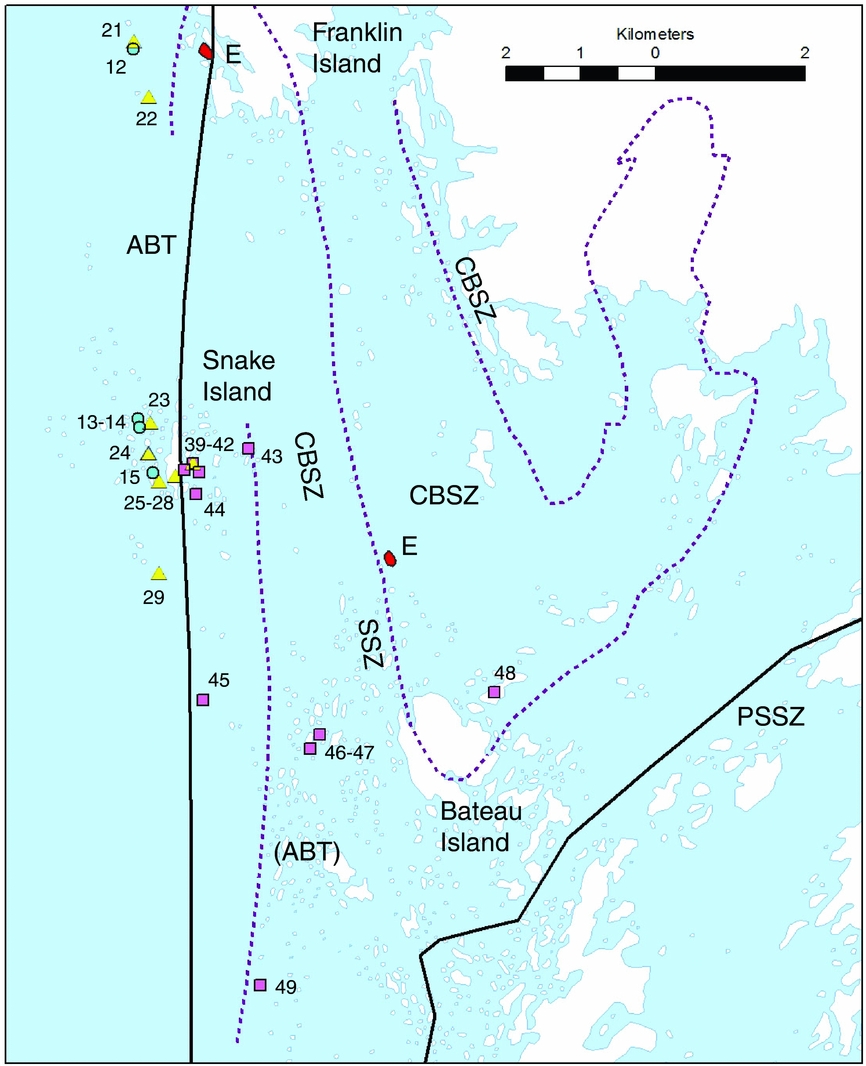
Figure 8. Map of the study area between Franklin Island and Snake Island showing ABT trajectory from Nd isotope mapping (solid line) compared with alternative published trajectories of various boundaries (dashed lines). CBSZ – Culshaw et al. (Reference Culshaw, Ketchum, Wodicka and Wallace1994); (ABT) – Culshaw et al. (Reference Culshaw, Corrigan, Ketchum, Wallace and Wodicka2004a ); SSZ – Culshaw et al. (Reference Culshaw, Gerbi and Marsh2010). Other symbols as in Figure 2.
North of Shawanaga, our prediction of the ABT boundary location differs from published work, but there are good reasons for this. The more northerly location proposed by Ketchum & Davidson (Reference Ketchum and Davidson2000) was constrained between outcrops of distinct metabasic rock types. These are shown in Figure 7 as open stars (Sudbury diabase) and solid stars (coronitic metagabbro). These localities have been corrected for inaccuracies in the original sketch map of Ketchum & Davidson using precise localities given for some of the samples by Culshaw et al. (Reference Culshaw, Corrigan, Ketchum, Wallace and Wodicka2004b ). It can be seen in Figure 7 that the boundary based on isotope mapping (Dickin, Moretton & North, Reference Dickin, Moretton and North2008) is also consistent with the metabasic suites, but the isotopic line is more precisely constrained between more closely spaced sample points. On the other hand, the line of Ketchum & Davidson is from a regional map of the whole SW Grenville Province, and is therefore only approximate.
The more southerly dotted trajectory comes from the 1:50000 scale map of the Ontario Geological Survey (OGS), referenced here as Culshaw et al. (Reference Culshaw, Corrigan, Ketchum, Wallace and Wodicka2004a ). While detailed, this trajectory was apparently drawn erroneously, owing to a drafting error on the final published map (N. G. Culshaw, pers comm.). The metabasic outcrops are also misidentified on the published map. Thus, the localities shown here by solid stars were all identified on the OGS map as unit 48, shown elsewhere as equivalent to the Sudbury diabase suite. However, these same localities were proposed as 1165 Ma coronitic olivine metagabbro by Culshaw et al. (Reference Culshaw, Ketchum, Wodicka and Wallace1994), and the one on Highway 69 was confirmed as part of this suite by U–Pb dating (Ketchum & Davidson, Reference Ketchum and Davidson2000). Hence, these localities should all have been identified as unit 53, with a probable age of 1165 Ma, on the OGS map. It is therefore concluded that the boundary based on Nd isotope mapping is consistent with the evidence from metabasic rocks, and in fact approximately follows the line of the CBSZ originally proposed by Culshaw et al. (Reference Culshaw, Ketchum, Wodicka and Wallace1994) but abandoned in favour of a location south of the Shawanaga pluton by Culshaw et al. (Reference Culshaw, Jamieson, Ketchum, Wodicka, Corrigan and Reynolds1997).
In the southerly part of the study area, the overprinting effects of extensional shearing have also caused confusion about the location of the ABT. For example, Culshaw et al. (Reference Culshaw, Ketchum, Wodicka and Wallace1994) observed that ‘The largest extensional shear zone, the CBSZ, is approximately 3 km thick and contains the boundary between the Bayfield–Nadeau Island assemblage and the Ojiway–Sand Bay assemblage’ (the B1 and B2 gneiss assemblages, separated by the ABT). While this is apparently true between Shawanaga Island and Franklin Island, the two structures appear to diverge in the southern part of the study area (Fig. 8).
The ABT location of Culshaw et al. (Reference Culshaw, Corrigan, Ketchum, Wallace and Wodicka2004a ) follows the earlier ‘cryptic thrust surface’ of Culshaw et al. (Reference Culshaw, Ketchum, Wodicka and Wallace1994) between the B1 and B2 gneiss assemblages. On the other hand, the CBSZ of Culshaw et al. (Reference Culshaw, Ketchum, Wodicka and Wallace1994) diverges into the allochthonous hangingwall between Franklin Island and Bateau Island (Fig. 8). This divergence between the original thrust and later extensional shear zone may explain the location of an eclogite body north of Bateau Island (Fig. 8). However, the divergence of the CBSZ from the ABT in this area may be a local effect caused by later movement of the overlying Parry Sound domain (e.g. Culshaw, Gerbi & Marsh, Reference Culshaw, Gerbi and Marsh2010).
In contrast to the difficulties of identifying shear zones of different ages in the field, the clear objective of Nd isotope mapping is to delineate the original thrust boundary that juxtaposed once widely separated crustal terranes. Hence, our detailed sampling strategy between Bateau Island and Snake Island, which constrains the ABT within a unit previously labelled as ‘unclassified paragneiss’ (Culshaw et al. Reference Culshaw, Corrigan, Ketchum, Wallace and Wodicka2004a ), immediately east of Snake Island (Fig. 8). Our samples from this unit have the same range of chemistry as our other samples, and we are confident that they are orthogneissic. Hence, we argue that this unit should be termed ‘unclassified gneiss’ rather than paragneiss.
To clarify the location of the boundary, we present the data from this area in the form of a transect of TDM ages against E–W distance (Fig. 9). These data confirm the relative sharpness of the age boundary, and show that there is only one exception to the 1.65 Ga age cut-off established above, namely sample #41 (SH19) with a TDM age of 1.68 Ga, which lies only 100 m from the boundary line.
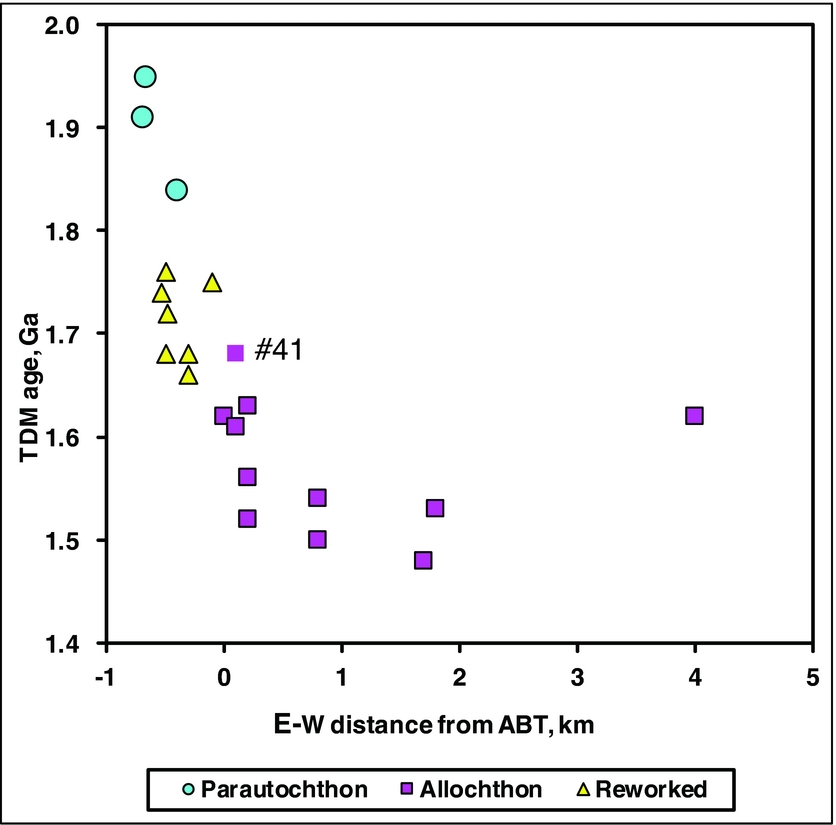
Figure 9. Plot of TDM model age against E–W distance in the vicinity of Snake Island.
To place the new Nd data in a regional perspective, they are shown on a map of the SW segment of the Central Gneiss Belt in Figure 10, with symbols as in Figure 2, except that TDM ages below 1.55 Ga are indicated by blue squares, while pink squares signify TDM ages of 1.55 to 1.64 Ga. Metabasic rock types (Sudbury diabase and retrogressed eclogite) are also marked. These are localities that were originally proposed by Ketchum & Davidson (Reference Ketchum and Davidson2000) and have subsequently been confirmed by Davidson, Nadeau & Culshaw (Reference Davidson, Nadeau and Culshaw2012). Coronitic metagabbro is omitted because its distribution is less definitively established.
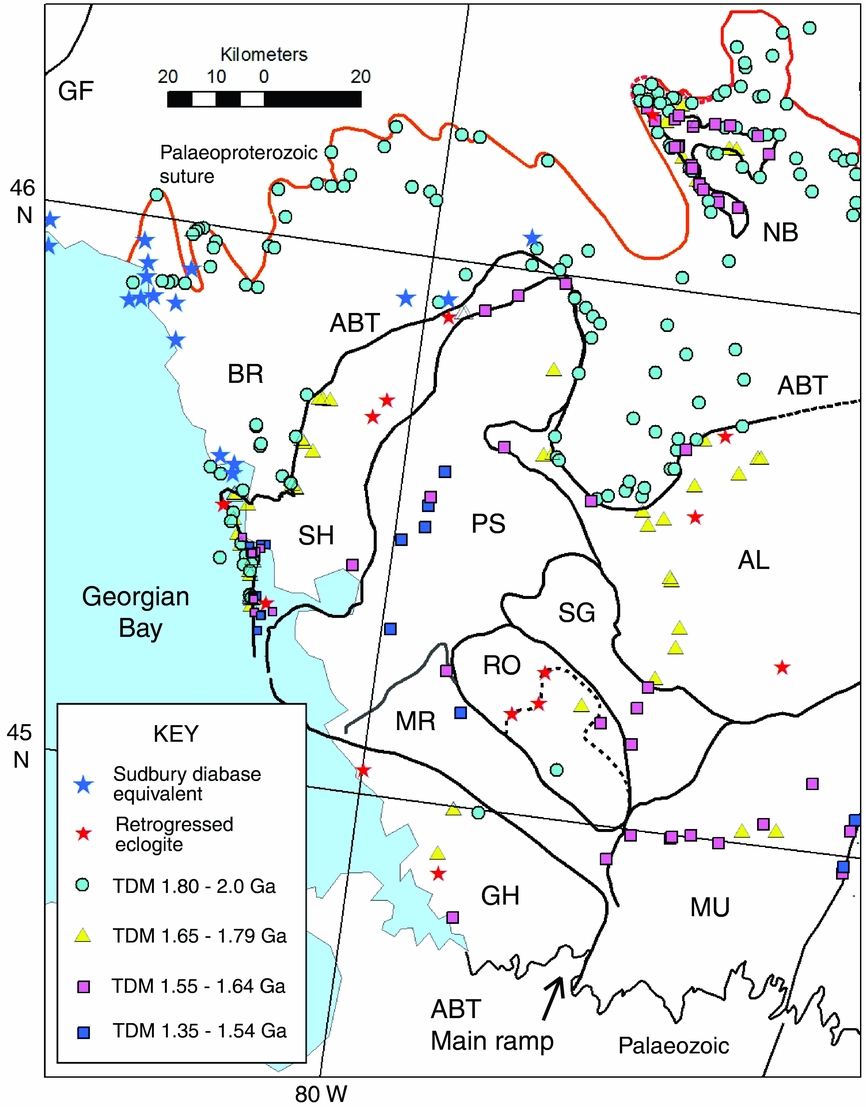
Figure 10. Map of the Central Gneiss Belt in the Georgian Bay area showing localities for TDM ages and metabasic suites relative to mapped domain boundaries from Figure 1. Ticks indicate local dip direction on shear zones interpreted as segments of the ABT. Lithotectonic domains as in Figure 1, but in addition, NB – North Bay; AL – Algonquin; MU – Muskoka.
The results show the consistency of the results from metabasic rock distributions and our previously published Nd isotope mapping. However, because parautochthonous rocks south of Shawanaga Island are now recognized as more reworked than those further north, the younger TDM ages in the parautochthon (as low as 1.66 Ga; Table 1) now partially overlap with those in the allochthonous Algonquin Terrane (average TDM age of samples in Figure 10 = 1.69 Ga, from Dickin & McNutt, Reference Dickin, McNutt, Gower, Rivers and Ryan1990 and Dickin, Moretton & North, Reference Dickin, Moretton and North2008).
Nevertheless, the presence of retrogressed eclogite in the Algonquin Terrane demonstrates conclusively that this is part of the allochthon, just as the parautochthonous affinity of the western part of the present study area is universally agreed. Therefore, these overlapping TDM age distributions are not a problem when correctly understood in the context of the geology. Our use of a TDM age cut-off of 1.8 Ga for the ABT north of Shawanaga Island was correct and reliable. However, because we have crossed a plutonic front in the parautochthon as we travel southwards from Shawanaga Island, different age criteria apply in the south, namely that the ABT coincides with a TDM age boundary of 1.65 Ga.
It may be noted that the allochthon south of Shawanaga Island also shows lower TDM ages (average = 1.56 Ga in Table 1), relative to the Algonquin Terrane (1.69 Ga quoted above). However, models for the stacking of thrust sheets in the Central Gneiss Belt consistently show the Algonquin Terrane as forming a lower deck relative to the Shawanaga domain, and hence as having originated further north (e.g. Ketchum & Davidson, Reference Ketchum and Davidson2000; Culshaw et al. Reference Culshaw, Slagstad, Raistrick and Dostal2013). Thus, all of these Grenvillian structural units were derived from a reworked continental margin whose TDM age decreased gradually to the southeast. The stacking of allochthonous crustal slices in the hangingwall of the ABT is seen in a condensed section south of Algonquin Park, where TDM ages decrease by c. 200 Ma over a distance of only 50 km (Zelek & Dickin, Reference Zelek and Dickin2013). However, this 50 km crustal section may originally have occupied over 200 km, based on how far the allochthon was thrust over the parautochthon in western Quebec (e.g. Jamieson et al. Reference Jamieson, Beaumont, Nguyen and Culshaw2007).
Recognition that the parautochthon south of Shawanaga Island underwent intensive magmatic reworking has major implications for the interpretation of TDM ages from the Go Home domain (Fig. 10). This domain has long been recognized as consisting of two separate decks, forming the Lower and Upper Go Home domains (Jamieson et al. Reference Jamieson, Culshaw, Wodicka, Corrigan and Ketchum1992; Culshaw et al. Reference Culshaw, Jamieson, Ketchum, Wodicka, Corrigan and Reynolds1997). The upper deck, seen near the Georgian Bay coast, yielded a TDM age of 1.56 Ga (Dickin & McNutt, Reference Dickin, McNutt, Gower, Rivers and Ryan1990). In contrast, the lower deck, seen inland, yielded TDM ages of 1.68, 1.72, 1.77 and 1.87 Ga (Dickin & McNutt, Reference Dickin, McNutt, Gower, Rivers and Ryan1990), with an average value of 1.76 Ga, which is only slightly younger than the parautochthon south of Shawanaga Island (average = 1.80 Ga; Table 1). There is a concentration of anorthosite bodies along the boundary between these crustal units, which is also characterized by occasional retrogressed eclogite bodies (Ketchum & Davidson, Reference Ketchum and Davidson2000; Culshaw & Dostal, Reference Culshaw and Dostal2002). Hence, this boundary may represent a local expression of the ABT.
If the Lower Go Home domain is part of the parautochthon, this supports the suggestion of Dickin et al. (Reference Dickin, Herrell, Moore, Cooper and Pearson2014) that an Ottawan-age crustal-scale ramp is located somewhere near the SE-dipping footwall of the Muskoka domain (Fig. 10). In fact this location for the ABT ramp was originally proposed by Culshaw & Dostal (Reference Culshaw and Dostal2002), although abandoned in their more recent papers (Jamieson et al. Reference Jamieson, Beaumont, Nguyen and Culshaw2007; Slagstad et al. Reference Slagstad, Culshaw, Daly and Jamieson2009; Rivers et al. Reference Rivers, Culshaw, Hynes, Indares, Jamieson, Martignole, Percival, Cook and Clowes2012; Culshaw et al. Reference Culshaw, Slagstad, Raistrick and Dostal2013). The new evidence also suggests that the structurally lower part of the Rosseau domain may likewise be parautochthonous, rather than equivalent to the allochthonous Algonquin Terrane (Jamieson et al. Reference Jamieson, Beaumont, Nguyen and Culshaw2007). Hence, the dotted line within the Rosseau domain that is characterized by a few retrogressed eclogite localities (Ketchum & Davidson, Reference Ketchum and Davidson2000) would also represent the ABT, enclosing a tectonic window to the parautochthon (Fig. 10).
This reinterpretation of the tectonic structure of the SW Grenville Province is summarized in Figure 11 in order to show the new proposed trajectory of the main ramp of the ABT. This crustal-scale shear zone is seen on seismic lines that cross the Baskatong ramp and the Algonquin ramp, as summarized by Dickin et al. (Reference Dickin, Herrell, Moore, Cooper and Pearson2014). The Go Home ramp has not been imaged seismically, but its southern extension (Fig. 11) is believed to correlate with the Hamilton – Lake Erie lineament (HLEL) in the subsurface (Boyce & Morris, Reference Boyce and Morris2002).
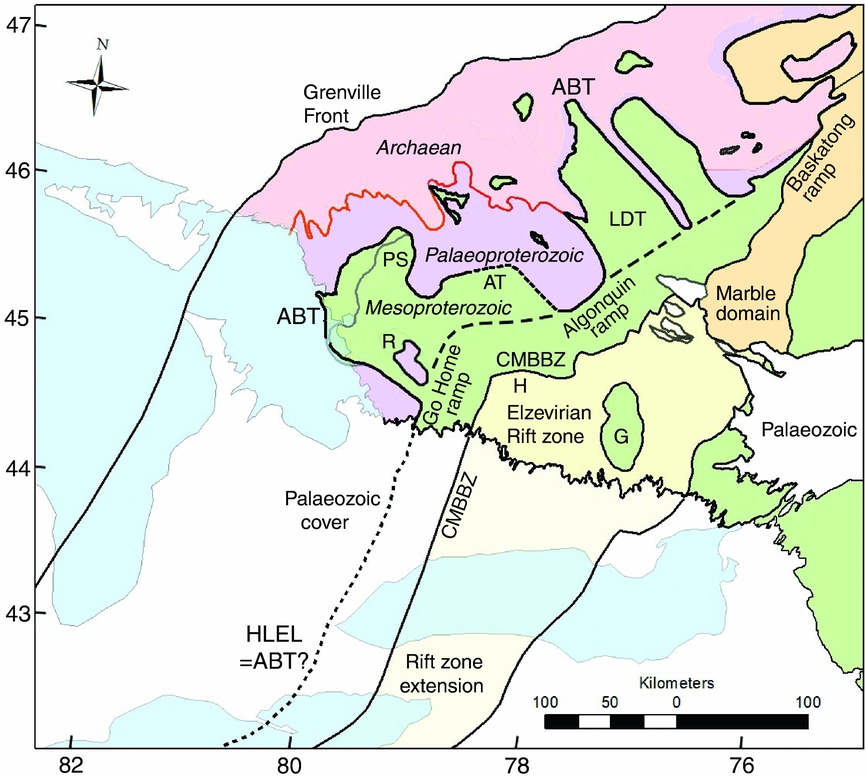
Figure 11. Tectonic map of the SW Grenville Province showing the three main structural belts: Archaean–Palaeoproterozoic Parautochthon (pink-violet); Allochthonous Polycyclic Belt (green) and Allochthonous Monocyclic Belt (yellow-orange = Elzevirian rift zone). The ABT defines three crustal-scale ramps, interspersed with blind ramps (dashed lines). Hamilton Lake Erie lineament (HLEL) – probable ABT extension in the subsurface; AT – Algonquin Terrane; LDT – Lac Dumoine Terrane; PS – Parry Sound domain; G – Grimsthorpe domain; R – Rosseau domain; H – town of Halliburton; CMBBZ – Central Metasedimentary Belt boundary thrust zone.
In between the segments where the main ramp of the ABT is believed to reach the surface, the allochthonous belt projects to the NW in the form of sub-horizontal nappes, represented by the Algonquin Terrane (including Parry Sound domain) and the Lac Dumoine Terrane. Hence the main ramp of the ABT presumably continues under these thrust sheets in the form of blind ramps (dashed lines in Fig. 11).
If the trajectory of this crustal-scale ramp is traced across the map, it appears to make a tight (approximately 60-degree) turn just NE of the Rosseau domain (R in Fig. 11). It can also be seen that this trajectory is sub-parallel to the trace of the Central Metasedimentary Belt boundary thrust zone (CMBBZ), which was argued by Dickin & McNutt (Reference Dickin and McNutt2007) to reactivate the older margin of an Elzevirian rift zone. This rift zone was argued to consist of en échelon segments, such that the approximately 90-degree bend west of Halliburton (H) represents the end of a rift segment. Significantly, the Grenville Front to the NW also displays a similar bend, but with more gentle curvature (Fig. 11).
It is notable that the sharpness of the structural bending is correlated with the age of these structures, since the CMBBZ is of Shawinigan age (c. 1190 Ma), the ABT is Ottawan (c. 1070 Ma) and the Grenville Front is of Rigolet age (c. 980 Ma; Rivers et al. Reference Rivers, Culshaw, Hynes, Indares, Jamieson, Martignole, Percival, Cook and Clowes2012). Therefore, we argue that the Elzevirian rift zone controlled Shawinigan tectonism on the CMBBZ, which in turn influenced the trajectory of the Ottawan-age ABT, and this also influenced the trajectory of the Rigolet-age Grenville Front. This suggests that the ‘big bend’ in the Ontario Grenville Province (Schwerdtner, Lu & Landa, Reference Schwerdtner, Lu, Landa, Tollo, Bartholomew, Hibbard and Karabinos2010) is not an orocline (an orogenic belt bent by later tectonism, Marshak, Reference Marshak and McClay2004) but a rarer example of a curved orogenic front controlled by older structural features.
Acknowledgements
We acknowledge the Natural Science and Engineering Research Council of Canada for support of fieldwork, and McMaster University for scholarship support. Comments from Fried Schwerdtner and two anonymous reviewers significantly improved the manuscript.


