


1. Introduction
Cambrian trilobites show higher levels of intraspecific variation than those documented in Ordovician–Permian taxa (Foote, Reference Foote1991; Hughes, Reference Hughes1991, Reference Hughes1994; Jell & Hughes, Reference Jell and Hughes1997; Webster, Reference Webster2007). In some cases, such as the correlation of the Cambrian Series 2–3 (or ‘lower–middle Cambrian’) boundary in the western Mediterranean region, the lack of biometrical analyses constraining the limits of diagnostic characters is preventing their application in biostratigraphy. If the diagnosis of new species is based on few specimens, the taxonomic validity can be highly uncertain. One solution to these problems is the splitting of trilobite taxonomy (see criticism in Rasetti, Reference Rasetti1948; Hughes, Reference Hughes1994), but the lack of consideration of intraspecific variation is leading to the erection of parallel chronostratigraphic charts bearing similar species only distinguishable by overlapping mosaics of characters (Geyer & Vincent, Reference Geyer and Vincent2014).
The paradoxidid trilobites represent one exemplary case of taxonomic splitting in Gondwana, Baltica and the Siberian Platform. Although the number of species has continued to increase in recent years and c. 150 species and subspecies have so far been erected (updated from Geyer & Landing, Reference Geyer and Landing2001, p. 124), few studies deal with their intraspecific variation (Bergström & Levi-Setti, Reference Bergström and Levi-Setti1978; Esteve, Reference Esteve2014). The criteria followed to erect species, lack of biometrical analysis and detailed comparisons in the paradoxidids directly affect the validity of correlation of the traditional ‘lower–middle Cambrian’ (or Cambrian Series 2–3) transition in West Gondwana.
In the 1880s, the paradigm to recognize the lower–middle Cambrian boundary was mainly based on Brøgger's trilobite-based chronostratigraphic sketch (Brøgger, Reference Brøgger1879, pp. 35–6; Reference Brøgger1886), in which the olenellids were overlain by the paradoxidids with no overlapping. This sketch was based on Scandinavian evidence and was challenged by Hupé (Reference Hupé1953), who pointed out the co-occurrence of olenellids and paradoxidids in the same strata of the central Anti-Atlas. A part of the regional ‘Aguilizian’ Stage (Hupé, Reference Hupé1960) and the ‘Ouriken n'Ourmast horizon’ (Choubert, Reference Choubert1963) was marked by a stratigraphic level, 50–60 m thick, with contemporaneous olenellids, protolenids and paradoxidids, resting with slight angular discordance on the basement (representing at present the Asrir/Brèche à Micmacca lithostratigraphic contact; see Álvaro et al. Reference Álvaro, Benziane, Thomas, Walsh and Yazidi2014). Hupé’s basal horizon of the traditional middle Cambrian (Acadian) was located at the co-occurrence of these three trilobite families.
In the Iberian Chains of NE Iberia, Lotze (Reference Lotze1961) characterized the 16–18 Band and Sdzuy (Reference Sdzuy1961, Reference Sdzuy1971a,Reference Sdzuyb) the Bilbilian Stage as a latest early Cambrian trilobite assemblage of protolenids, ellipsocephalids and redlichiids (without olenellids), found above a sandstone package (Daroca Formation) similar to the Moroccan Asrir Formation and below the first occurrence of paradoxidids. The Iberian lower–middle Cambrian boundary was tentatively located across a fossiliferous shale-dominated unit, named informally the ‘Ci/m’ (lower–middle Cambrian transitional series) zone, with its base marked by the first appearance datum (FAD) of the trilobite Acadoparadoxides mureroensis. Sdzuy (Reference Sdzuy1971a) correlated the Bilbilian with the uppermost Tasousekht substage (with doubts) and the Aguiliz substage of Morocco (Hupé, Reference Hupé1953, Reference Hupé1960). Neither Hupé nor Sdzuy rejected the possible diachronism on the FAD of paradoxidid trilobites throughout the Acado-Baltic Province (sensu Sdzuy, Reference Sdzuy1972) and suggested an unavoidable diachroneity of the FAD of their involved species. When Sdzuy (Reference Sdzuy1971b) tentatively placed the FAD of A. mureroensis as a possible base for the middle Cambrian, he even assumed that this boundary could change in the near future.
During the last 30 years, the regional lower–middle Cambrian boundaries in Iberia and Morocco have evolved differently. In Iberia, the FAD of A. mureroensis has been maintained as the basal horizon of the middle Cambrian, whereas in Morocco another Cambrian chronostratigraphic subdivision has been proposed to replace Hupé’s (Reference Hupé1953, pp. 79–83) chart (Geyer, Reference Geyer1990; Geyer & Landing, Reference Geyer and Landing1995, Reference Geyer and Landing2004), and the new regional boundary is placed at the FAD of the genus Hupeolenus in the Asrir Formation.
Recently, Geyer & Vincent (Reference Geyer and Vincent2014) described the earliest paradoxidid trilobites that characterize Hupé’s basal middle Cambrian mixture of olenellids, protolenids and paradoxidids in the Brèche à Micmacca Member. The authors proposed: (1) the record of eight paradoxidine species showing partial overlapping stratigraphic ranges in 12 m of the Tarhoucht quarries in the central Anti-Atlas; and (2) to refer the Iberian material of A. mureroensis (excepting the holotype) to A. cf. mureroensis on account of the poor preservation of the holotype (a cranidium described by Sdzuy, Reference Sdzuy1958). However, some of the species erected by Geyer & Vincent (Reference Geyer and Vincent2014) (i.e. A. levisettii, A. ovatopyge and A. pampalius) co-occurred in a single horizon of the Brèche à Micmacca at the Assemame quarry in the central Anti-Atlas (Zamora et al. Reference Zamora, Álvaro, Clausen, Esteve, Devaere, Clausen and Álvaro2014), which raised the question whether their supposed taxonomic distinctions are merely a matter of variation in a single species and questioned the correlation of their stratigraphic ranges throughout the Anti-Atlas. As the earliest paradoxidids from the Iberian Chains are characterized by a broad morphological variation and were grouped in a single species (A. mureroensis), which contrasts with the lack of morphological variation recognized within the Moroccan species by Geyer & Vincent (Reference Geyer and Vincent2014), a comparison between the Moroccan and Spanish species based on similar biometrical tests seems necessary to solve this taxonomic puzzle. The use of morphometrics in the analysis of those specimens provides an opportunity to quantify the intraspecific and biogeographical variation displayed by the earliest paradoxidine trilobites throughout the western Mediterranean region. This will allow a clear distinction among the diagnostic characters that differentiate these chronostratigraphic markers of the regional lower–middle Cambrian boundary intervals in Iberia and Morocco.
2. Geological setting and stratigraphy
Relics of the Cambrian in West Gondwana are disconnected throughout the western Mediterranean region and enclosed within Variscan and Alpine ranges, such as the Iberian Chains in Spain and the Anti-Atlas ranges in Morocco (Fig. 1). Recent palaeogeographic reconstructions point to the onset of a major Cambrian rifting axis connecting the Atlas and Ossa-Morena Rifts, flanked by a broad area subjected to extension that behaved like passive-margin platforms (e.g. the Cantabro-Iberian Basin where the Iberian Platform lies; for a recent synthesis; see Álvaro et al. Reference Álvaro, Benziane, Thomas, Walsh and Yazidi2014).
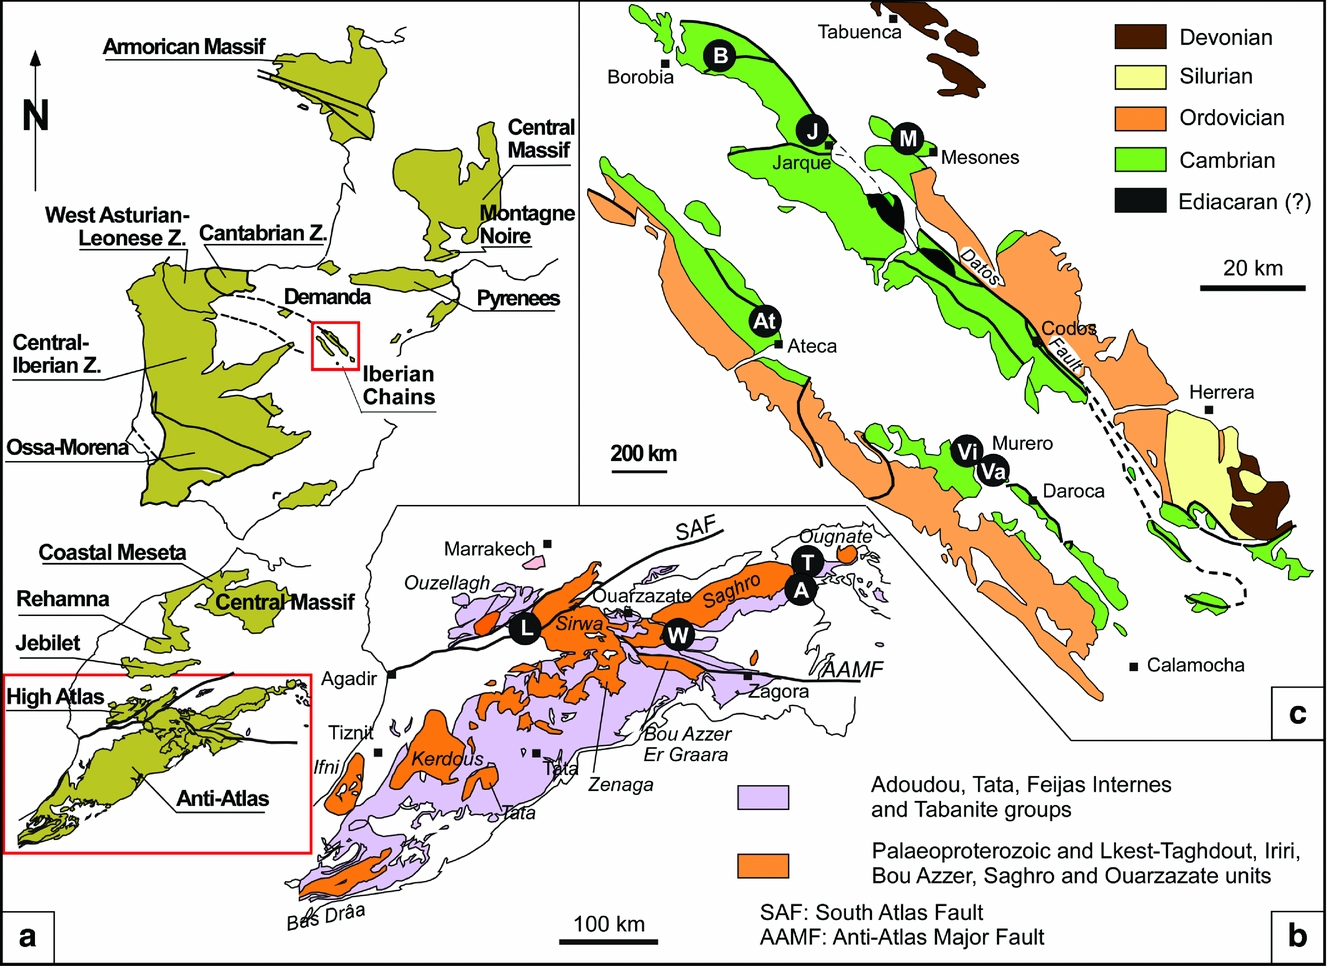
Figure 1. Geological and stratigraphic framework. (a) Pre-Variscan exposures of SW Europe and NW Africa, with detail of boxed areas in (b) High Atlas and Anti-Atlas Ranges, Morocco, and (c) Iberian Chains, NE Spain. Abbreviations of sections reported in the text: A – Assemame quarry; At – Ateca; B – Borobia; J – Jarque; L – Lemdad valley; M – Mesones; S – San Martín; T – Tarhoucht quarries; Va – Valdemiedes (Murero); Vi – Villafeliche; W – Ourika Wawrmast; and Z.– Zone.
In the western Mediterranean region the immigration of paradoxidids is a key palaeoecological event that has been traditionally used for chronostratigraphic purposes (Álvaro et al. Reference Álvaro, Gozalo, Liñán and Sdzuy1993, Reference Álvaro, Elicki, Geyer, Rushton and Shergold2003; Liñán, Perejón & Sdzuy, Reference Liñán, Perejón and Sdzuy1993; Geyer & Vincent, Reference Geyer and Vincent2014). In the Anti-Atlas, this immigration event is recognized in the Morocconus notabilis Zone (Geyer & Landing, Reference Geyer and Landing1995, pp. 37–40; Morocconus after Özdikmen, Reference Özdikmen2009) of the Brèche à Micmacca Member, which forms the lower part of the Jbel Wawrmast Formation (Destombes, Hollard & Willefert, Reference Destombes, Hollard, Willefert and Holland1985), a senior synonym of the Tamanart Formation sensu Geyer (Reference Geyer1989). The formation is up to 300 m thick and classically subdivided into the Brèche à Micmacca and Tarhoucht members (Bondon & Neltner, Reference Bondon and Neltner1933; Geyer & Landing, Reference Geyer and Landing2006). The former, up to 60 m thick, is composed of variegated volcano-bioclastic limestones, shales and subsidiary conglomerates. K-bentonites, lava flows and volcanosedimentary aprons form the base of the member in some areas of the Jbel Saghro region. The stratotype of the member is situated at Ourika Wawrmast. In the vicinity of Alnif (Assemame quarry; see below), a ‘hot spot’ of fossil echinoderm diversity has been reported (Smith, Zamora & Álvaro, Reference Smith, Zamora and Álvaro2013; Clausen, Álvaro & Zamora, Reference Clausen, Álvaro and Zamora2014), which includes other skeletal remains, such as trilobites, brachiopods, skeletonized microfossils, hyoliths, molluscs, chancelloriids and reworked archaeocyaths (Buggisch, Marzela & Hügel, Reference Buggisch, Marzela and Hügel1978; Geyer & Landing, Reference Geyer and Landing1995, pp. 47–120; Álvaro & Clausen, Reference Álvaro and Clausen2005, Reference Álvaro and Clausen2006, Reference Álvaro, Clausen, Pratt and Holmden2008; Clausen & Smith, Reference Clausen and Smith2008). The mélange of fossils from different biozones (including reworked archaeocyaths), displaying different diagenetic processes and the microstratigraphic subdivision of the carbonates punctuated by microbial crusts, led Álvaro & Clausen (Reference Álvaro and Clausen2005, Reference Álvaro and Clausen2006, Reference Álvaro, Clausen, Pratt and Holmden2008), Álvaro (Reference Álvaro2014) and Álvaro et al. (Reference Álvaro, Ezzouhairi, Clausen, Ribeiro and Solá2015) to recognize these volcano-bioclastic limestone interbeds as hiatal shell accumulations including allochems from different biozones. These condensed limestone interbeds are therefore inadequate for detailed biostratigraphic analysis, which contrasts with the continuous (unconformity-free) sedimentation recorded in the shale background deposition of the member. Despite some distinct diachroneities marking the base and top of the member, its sedimentation broadly took place in the Morocconus notabilis Zone. Finally, the 100–300 m thick Tarhoucht Member (traditional ‘Schistes à Paradoxides’) is a coarsening-upward shale-dominated unit punctuated by whitish bioclastic limestones and ash levels, the latter giving a variegated aspect to the host shale. The top of the member ranges from the Morocconus notabilis Zone to, at least, the Kymataspis arenosa Zone (Geyer & Landing, Reference Geyer and Landing1995, pp. 37–40).
In the Iberian Peninsula, the immigration of paradoxidids marks the Bilbilian–Leonian boundary (Gozalo et al. Reference Gozalo, Liñán, Dies Álvarez, Gámez Vintaned, Mayoral, Linnemann, Nance, Kraft and Zulauf2007). This lies in the Valdemiedes Formation, which consists of an alternation of green marly shales and carbonates, 20–150 m thick. The carbonate interbeds, both stromatolitic and bioclastic in character, comprise several facies associations, e.g. peritidal stromatolitic carbonate/shale couplets, shallow subtidal sponge-rich limestone/shale couplets, storm-induced bioclastic limestones, and open-platform offshore-dominated shales (Álvaro & Vennin, Reference Álvaro and Vennin1997). In the Villafeliche graben (where the Valdemiedes stratotype lies), this interval is composed of offshore-dominated shales; the palaeogeographic position of this graben (surrounded by shallower deposits) suggests that the sea floor was becoming differentiated into a mosaic of topographic highs and lows. The sedimentation of the Valdemiedes Formation was controlled by the interplay of two variable factors: an episodic tectonic activity (Álvaro & Vennin, Reference Álvaro and Vennin1996) and a cyclic Milankovitch-like orbital forcing (Álvaro et al. Reference Álvaro, Vennin, Muñoz, Sánchez-Valverde and Ojeda2000). A quantitative analysis of the tectonically induced subsidence recorded in the Iberian platform revealed a distinct tectonic disturbance at the Bilbilian–Leonian boundary associated with further minor pulses. The successive tectonically induced disturbances produced a major rearrangement in the intraplatform patterns of differential subsidence, in which the so-called Villafeliche graben can be considered as the hinge point of geodynamic rearrangement. The FAD of A. mureroensis marks the top of the so-called Valdemiedes event, which was interpreted by Álvaro & Vennin (Reference Álvaro and Vennin1997) and Clausen & Álvaro (Reference Clausen and Álvaro2002) as the end of one shallowing-upward cycle (0.4–3.4 m thick) and a community turnover or replacement, recorded in mixed substrates of the Iberian platform (Álvaro et al. Reference Álvaro, Vennin, Muñoz, Sánchez-Valverde and Ojeda2000). This shallowing was recorded under shoreface conditions in central parts of the platform (e.g. Jarque and Mesones sections), offshore conditions under clayey sedimentation in the Villafeliche graben (Valdemiedes section) and condensed, amalgamated, tempestite accumulations in distal parts of the platform (Ateca section; Fig. 1). The top of the event is capped by flooding conditions (marking the beginning of the following shallowing-upward cycle) that recorded the immigration of new trilobite families (e.g. paradoxidids in the A. mureroensis Zone). Successive cycles recorded in the Valdemiedes Formation allowed a stepwise immigration of new invaders (including conocoryphids and acrocephalitids), leading to a progressive increase in biodiversity.
3. Material and methods
A new sampling of trilobites across the Iberian concept of the lower–middle Cambrian boundary interval was necessary in the Anti-Atlas controlling the stratigraphic ranges of each trilobite species. We selected the Assemame open quarry (property of Moujan family, Ksar Timrzite in Alnif, Morocco), in the vicinity of Alnif (31° 17.292′ N, 4° 59.156′ W), central Anti-Atlas, because the quarry comprises a complete section of the Asrir and Jbel Wawrmast formations. The Brèche à Micmacca Member, c. 35 m thick, is extremely fossiliferous, and its shale interbeds have yielded a rich fauna of complete and partly disarticulated echinoderms, trilobites, brachiopods and molluscs (Figs 2, 3). The ‘telesto level’ is commonly used by amateur palaeontologists to recognize a kind of ‘acmé level’ of Cambropallas telesto Geyer, Reference Geyer1993. The level is currently recognized in the Morocconus notabilis Zone. The interest of the Assemame quarry is threefold: (i) sampling of slightly deformed trilobites in shales allowing a taxonomic comparison with moderately to strongly deformed specimens from the type locality in the Iberian Chains; (ii) a biogeographical comparison with other known fossiliferous logs of the Anti-Atlas (e.g. the Tarhoucht open quarry; Geyer & Vincent, Reference Geyer and Vincent2014) and the Iberian Chains (e.g. Murero; Liñán & Gozalo, Reference Liñán and Gozalo1986); and (iii) identification of the FAD of paradoxidids different from the classical ones, such as the Ourika Wawrmast stratotype (Hupé, Reference Hupé1953) and the Tarhoucht quarries (Geyer & Vincent, Reference Geyer and Vincent2014). The lower 10 m of the Brèche à Micmacca Member offers a key section of fossiliferous shale interbeds in non-condensed, offshore-dominated, clayey substrates representative of the middle part of the M. notabilis Zone. Most of the sampled trilobites and echinoderms are complete or with low degree of disarticulation, and suggest that the fauna from the shale interbeds of the Assemame quarry represents autochthonous and parautochthonous fossil assemblages. The material described below has been sampled by the authors in a shale interbed (30 cm thick) of the Brèche à Micmacca Member exposed in the Assemame open quarry, central Anti-Atlas (see log and stratigraphic ranges of reported fossils in Fig. 3).
Figure 2. Stratigraphic logs of the regional lower–middle Cambrian transition in the Anti-Atlas and Iberian Chains; modified from Álvaro (1994) and Álvaro et al. (Reference Álvaro, Gozalo, Liñán and Sdzuy1993, Reference Álvaro, Benziane, Thomas, Walsh and Yazidi2014). Localities from the Iberian Chains are At – Ateca, J – Jarque, M – Mesones and S – San Martín (see their geographical setting in Fig. 1).
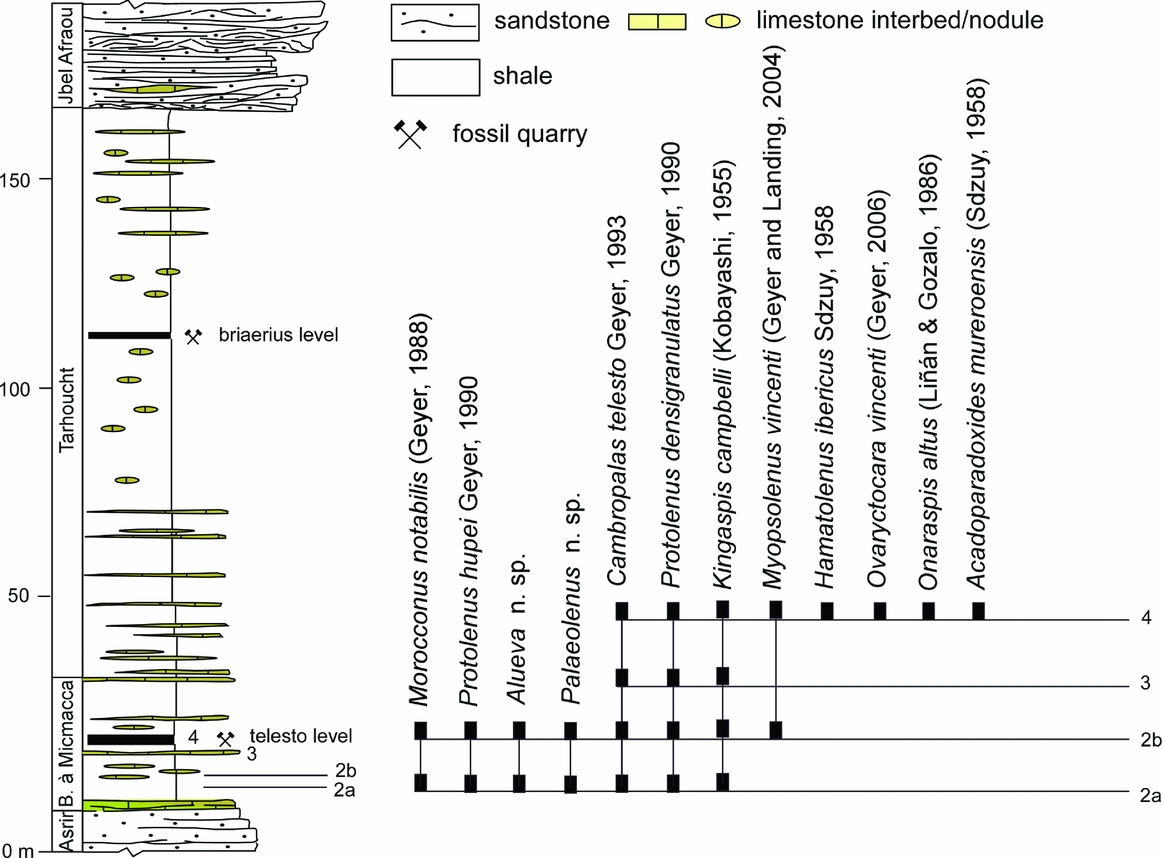
Figure 3. Stratigraphic ranges of trilobites described in the text from the Assemame quarry, central Anti-Atlas; modified from Zamora et al. (Reference Zamora, Álvaro, Clausen, Esteve, Devaere, Clausen and Álvaro2014).
The morphometric analyses documented below are based on: (1) 16 pygidia and 13 cranidia sampled in the Assemame quarry by the authors; (2) 6 cranidia and 10 pygidia of A. cf. mureroensis, 9 cranidia and 13 pygidia of A. pampalius, 23 cranidia and 20 pygidia of A. levisettii, 1 cranidium and 4 pygidia of A. nobilis, and 7 cranidia and 8 pygidia of A. ovatopyge from the Tarhoucht quarries of the central Anti-Atlas (MMUW, Naturmuseum Senckenberg, Frankfurt), reported by Geyer & Vincent (Reference Geyer and Vincent2014); and (3) the type material of A. mureroensis (Sdzuy, Reference Sdzuy1958; PIW, Naturmuseum Senckenberg, Frankfurt) supplemented by 13 cranidia and 7 pygidia of the same species from the type locality (MPZ, Museo de Ciencias Naturales of the Zaragoza University).
Figure 4 and Table 1 show the linear measurements and abbreviations used for cranidial and pygidial statistical analysis. Linear measurements were made using ImageJ software (Abràmoff, Magalhães & Ram, Reference Abràmoff, Magalhães and Ram2004), which allows measurements of continuous variables, such as the palpebral lobe or preglabellar field lengths. Bivariate analyses were calculated using the reduced major axis (RMA) approach based on log10 transformations of original linear dimensions. The analyses were carried out using the PAST software package (Hammer & Harper, Reference Hammer and Harper2006). This software provides error estimates that can be calculated with two methods: standard linear regression approximations and bootstrapping over cases. The bootstrap resampling was completed 1000 times in each case to permit the calculation of confidence intervals for both the slope and interception in each RMA. For a synoptic view of some results obtained with RMA, a principal component analysis (PCA) was performed using the PAST software package. PCA also helps to examine the effects of deformation in specimens from a single bed (=same population) (Hughes & Jell, Reference Hughes and Jell1992; Esteve, Reference Esteve2014).

Figure 4. Reconstruction of Acadoparadoxides mureroensis (Sdzuy, Reference Sdzuy1958) with abbreviations used in the text, statistical analyses, landmark (black circles) and semi-landmark (white circles) configuration. (a) Cranidium (see abbreviations in Table 1). (b) Superimposition plot of cranidial landmark data. (c) Pygidium (see abbreviations in Table 1). (d) Superimposition plot of pygidial semi-landmark data.
Table 1. Abbreviations used in the text for trilobite sclerite dimensions

Taking into consideration the subtle differences in the cranidial and pygidial shapes of these trilobites, characterized by a simple Bauplan, some morphological differences cannot be recovered by simple bivariate and multivariate analyses. Therefore, a complementary quantification of morphological variation was assessed using geometric morphometric methods (Bookstein, Reference Bookstein1991; Zelditch et al. Reference Zelditch, Swiderski, Sheets and Fink2012). Landmarks and semi-landmarks were digitized from pictures using the software TpsDig v.2.16 (Rohlf, Reference Rohlf, Rohlf and Bookstein1990). A total of 30 landmarks (four along the sagittal axis and 13 pairs on either side of the axis) were chosen to represent the overall shape of the cranidium (Fig. 4a, b), and 11 landmarks (five along the sagittal axis and three pairs on either side of the axis) and 150 semi-landmarks were selected to represent the overall shape of the pygidium (Fig. 4c, d). As the trilobites have bilateral symmetry, we selected half of the landmarks and semi-landmarks from one side (left or right). This procedure allowed analysis of more specimens because even some incomplete specimens could be used for morphometric analysis. The landmarks and semi-landmarks of each specimen were used for statistical analysis and graphic illustration. The data were exported directly to IMP software (Sheets, Reference Sheets2014) for statistical treatment of a set of landmark coordinates (x, y). In order to standardize the size, orientation and position of each specimen (and thus the alignment of each landmark), a Procrustes superimposition of data was applied before analytical processing (the resulting coordinates are named, after fitting, Procrustes coordinates). Coordinates of semi-landmarks were calculated from the outline data in SemiLand8 (Sheets, Reference Sheets2014) using the minimized Procrustes distance method to optimize their location along the outline. All statistical analyses were performed using warp scores, which are derived from thin-plate spline decomposition (Rohlf, Reference Rohlf, Rohlf and Bookstein1990; Bookstein, Reference Bookstein1991; Zelditch et al. Reference Zelditch, Swiderski, Sheets and Fink2012). Variation within and between samples was visually compared using PCA of the warp scores. An analysis of canonical variates of the warp scores and a bootstrapped F-test of Procrustes coordinates were used to test the significant morphological differences between samples (Webster & Sheets, Reference Webster, Sheets, Alroy and Hunt2010; Zelditch et al. Reference Zelditch, Swiderski, Sheets and Fink2012). We used a bootstrapped F-test because it does not assume any isotropic normal distribution of landmarks around the mean; visual inspection of the variation around each landmark after Procrustes superimposition (Fig. 4b, d) indicates that such an assumption is not reached by these data. In order to compensate for the multiple comparisons made using the bootstrapped F-test, we applied a Bonferroni correction to the critical p-value. The degree of variation in each sample was measured as within-group variance in Procrustes distance away from the group mean. In order to test the difference of all multivariate samples, we also carried out a multivariate analysis of variance (MANOVA) and a canonical variates analysis (CVA). The latter provide a scatter plot of specimens along the two first (the more representative; Mardia, Kent & Bibbly, Reference Mardia, Kent and Bibbly1994) canonical axes, producing maximal and second to maximal separation between all groups (multigroup discriminant analysis).
3.a. Retrodeformation techniques
The Moroccan and Iberian specimens show different degrees of flattening and tectonic distortion. The specimens from the Spanish-type locality (Murero) commonly display higher degrees of deformation (Liñán & Gozalo, Reference Liñán and Gozalo1986) than the Moroccan ones, and this has been used to question the validity of Acadoparadoxides mureroensis (Geyer & Vincent, Reference Geyer and Vincent2014). Many techniques have been described for the restoration of deformed fossils, especially in trilobites: e.g. Sdzuy (Reference Sdzuy1966), Cooper (Reference Cooper1970), Briggs & Williams (Reference Briggs and Williams1981), Jefferies, Lewis & Donovan, (Reference Jefferies, Lewis and Donovan1987), Cooper (Reference Cooper1990), Hughes & Rushton (Reference Hughes and Rushton1990) and Hughes & Jell (Reference Hughes and Jell1992). Some of them reconstruct the strain ellipse based on either deformed right angles of several specimens preserved on the same slab or orientating the specimens in relation to the direction of greatest stress (Cooper, Reference Cooper1990), whereas others restore the vertical component of deformation after comparing with putatively undeformed specimens from other outcrops (Kim, Sheets & Mitchell, Reference Kim, Sheets and Mitchell2009). In our case study, due to the lack of several specimens lying on a single slab and displaying different orientations, and the absence of distinct traces of penetrative cleavage associated with the analysed specimens, we follow Hughes & Jell (Reference Hughes and Jell1992) and Srivastava & Shah's (Reference Srivastava and Shah2006) method based on the manipulation of digital images with Adobe Photoshop CS5: rotating the image until the posterior margin of the cranidium is horizontal and then skewing the image horizontally to restore bilateral symmetry, bringing the sagittal axis to vertical. All the analysed specimens represent mature forms.
The distortion of the specimens analysed in this work was assessed with the above-reported bivariate and multivariate methods, whereas the geometric morphometric method assessed the overall intraspecific variation in cranidia and pygidia. The correlation coefficients of perpendicular linear measurements obtained with RMA provide useful insights about the variation controlled by distortion: lower correlation coefficients (r < 0.7; see below) suggest high dispersion patterns of data reflecting the influence of both compaction and shearing, whereas higher correlation coefficents (r > 0.8) suggest a negligible influence in the shape. As documented below, some bivariate plots show greater dispersions of data when comparing length-to-width ratios than length-to-length ratios, but r is always >0.9, so isometric/allometric growths cannot be biased by deformation in our analyses. In addition, wide scatters also indicate that some characters have more flexible growth controls than others (Labandeira & Hughes, Reference Labandeira and Hughes1994, p. 493); as a result, these controls are tested with PCA scores. The results show that, despite tectonic distortion, the general shape of the whole sample and the ratios of parallel measurements are maintained.
4. Former diagnostic characters of Acadoparadoxides species from the Mediterranean region
Acadoparadoxides mureroensis, whose FAD traditionally marks the base of the regional middle Cambrian (Leonian Stage) in Spain, has been (and still is) a source of controversy. It has been reported from Spain, Morocco, Turkey, Sardinia and Poland. Based on disputed synonymies, Gozalo et al. (Reference Gozalo, Dies Álvarez, Gámez Vintaned, Zhuravlev, Bauluz, Subías, Chirivella Martorell, Mayoral, Gursky, Andrés and Liñán2013, p. 147) also reported this taxon in Siberia (= A. eopinus) and Avalonia (= A. harlani). Geyer & Vincent (Reference Geyer and Vincent2014, pp. 47–8) considered the type cranidium as too distorted to be properly identified outside the type locality and referred similar material from the rest of Spain and Morocco to A. cf. mureroensis. However, despite the obvious compaction- and tectonic-related deformation of the Iberian material, many studies (e.g. Hughes & Rushton, Reference Hughes and Rushton1990; Hughes & Jell, Reference Hughes and Jell1992, Reference Hughes, Jell, Macfarlane, Sorkhabi and Quade1999; Jell & Hughes, Reference Jell and Hughes1997; Webster & Hughes, Reference Webster and Hughes1999; Peng et al. Reference Peng, Babcock, Zhu, Ahlberg, Terfelt and Dai2015) have demonstrated that, having a large set of specimens from the same interval, the preservation of trilobites does not preclude confident determinations. Based on material from the Tarhoucht quarries, Geyer & Vincent (Reference Geyer and Vincent2014) proposed a phylogenetic scenario with overlapping replacement of several species of Acadoparadoxides throughout the lowest few metres of the Brèche à Micmacca Member. However, this phylogenetic hypothesis focused on pygidial modifications was not supported by biometrical analyses. The authors found a stratigraphic succession of species exhibiting slight changes in the pygidium, such as the anterior and posterior widths and the relative length of the axis (Geyer & Vincent, Reference Geyer and Vincent2014, fig. 13). When Zamora et al. (Reference Zamora, Álvaro, Clausen, Esteve, Devaere, Clausen and Álvaro2014) reported many of Geyer and Vincent's species from a single horizon of the neighbouring Assemame quarry, this phylogenetic hypothesis was called into question and opened new options, e.g. does Acadoparadoxides display such a morphological variation in the beginning of the mid Cambrian? Or do Geyer and Vincent's species represent a single species with infraspecific variants grading into each other? Similar changes in the pygidium of A. mureroensis and other paradoxidid trilobites from Spain were reported by Gozalo, Liñán & Díes (Reference Gozalo, Liñán and Díes2003), but their interpretation exclusively dealt with intraspecific dimorphism, a hypothesis that is checked below. Esteve (Reference Esteve2014) documented how such variations in the pygidium of other paradoxinines (i.e. Eccaparadoxides pradoanus) show a continuous spectrum, as a result of which intraspecific variation is related to morphological (size-dependent vs not size-dependent) rather than dimorphic variation.
The erection of new Moroccan and Turkish species of Acadoparadoxides close to the Iberian lower–middle Cambrian boundary interval in the Mediterranean region has been based on the following characters:
(1) Paradoxides (Acadoparadoxides) nobilis Geyer, Reference Geyer1998 (p. 387) was originally distinguished from A. mureroensis by ‘a flattened surface of both anterior and anterolateral borders and also of the central areas of the palpebral lobes’ (vs slightly convex in the latter); ‘the posterior margin of the hypostome is curved’ (vs an almost straight median part); ‘pygidium with a slightly longitudinal triangular shape with rounded posterolateral corners and a faintly indented posterior border’ (vs a relatively rounded posterior margin, which may at best attain a nearly straight posterior medium part of this margin); ‘pygidial rachis is less clearly defined [in A. mureroensis], which also has one quite well-defined axial ring’; ‘the true axis ranges between 60–75 % of the pygidial length’ (vs 72–82 %). However, the cranidia illustrated by Geyer (Reference Geyer1998) offered some doubts, as neither the holotype (pl. 1, fig. 6) nor the figured paratypes (pl. 1, figs 11–12; pl. 3, fig. 5 was a juvenile and incomplete specimen) are complete, as a result of which the total length of the cranidium and the relative longitudinal proportions of other characters were necessarily estimated and not directly measured. The relative convexity of the anterior and anterolateral borders does not differ from other Spanish specimens also preserved in shales, but distinctly differs from specimens preserved in limestones (Álvaro, Reference Álvaro2007, fig. 4k). No complete specimens were illustrated, so both the hypostoma and pygidia should be considered as tentatively assigned to this species.
Subsequently, Geyer & Vincent (Reference Geyer and Vincent2014) offered another mosaic of characters to differentiate both species although, as in the previous paper, complete specimens were still absent and their cranidia fragmented: specimens illustrated in their fig. 25a, b, d show cranidia with broken anterior borders, and their fig. 25n is the only cranidium that allows a complete biometry. Its table summary (fig. 12) offered some slight differences between mureroensis and nobilis, such as a frontal lobe of the glabella 1.27–1.44 vs 1.36–1.44 times (so overlapping ranges) the width of the occipital ring, respectively; eye lobes 35–43 % vs 38–44 % of cranidial length (also overlapping values); anterior margin ‘evenly curved to subarcuate’ vs ‘evenly curved’ (partly coinciding shapes); dorsal face of anterior border ‘convex’ vs ‘distinctly flattened’ (a character strongly controlled by taphonomic conditions; see discussion below); a pygidial outline with posterior margin ‘slightly rounded to almost straight’ vs ‘indented’ and rachis 72–82 % (but 67 % in their fig. j) vs 62–74 % of pygidial length (again overlapping values; this latter character was used by Gozalo, Liñán & Díes (Reference Gozalo, Liñán and Díes2003) to differentiate two morphotypes of mureroensis). In their discussion, the authors offered some ‘significant criteria to unequivocally distinguish nobilis from cf. mureroensis’, which are: (1) ‘dorsal surface of the anterior border flattened rather than low and evenly convex’, a character not reliable when comparing material preserved in shales (Geyer & Vincent, Reference Geyer and Vincent2014, fig. 22e, g); (2) ‘eye lobes bilobate, with flattened median dorsal surface’, a character unseen both in the holotype of nobilis, due to its state of preservation, and the paratypes (Geyer, Reference Geyer1998, pl. 1, figs 6, 12–13), and only preserved in the right palpebral lobe of fig. 25d and the left one of fig. 25n (Geyer & Vincent, Reference Geyer and Vincent2014); (3) ‘posterior margin of hypostome gently curved rather than with faint curvature’, a character that offers no distinct differences; (4) ‘a pygidial outline longitudinally triangular with gently curved posterolateral corners’, a character shared by both species; and (5) a posterior margin of pygidium with slight median indentation rather than flat to slightly convex. A priori, this latter difference should be distinct enough to distinguish mureroensis from nobilis.
(2) A. pampalius Geyer & Vincent, Reference Geyer and Vincent2014 and A. levisettii Geyer & Vincent, Reference Geyer and Vincent2014 are two species erected in the Bou Tiouit section. Their cranidial differences are: (1) the width of the frontal lobe in comparison with the occipital ring: 1.33–1.45 in pampalius, 1.26–1.41 in levisettii and 1.27–1.44 in cf. mureroensis (an overlapping value); and (2) the cranidial (tr.) ‘width between the suture at the anterior border, which equals the transverse width across the eye lobes or is slightly smaller in pampalius, whereas the anterolateral corners in levisettii project beyond the level of the visual suture’ (a character not shared by the cranidia of pampalius illustrated in fig. 14h–j and by those of levisettii in figs 18o and 19f, m). Their pygidial differences are: (1) pygidium sub-rounded to slightly subhexagonal in pampalius, subhexagonal to subtriangular in levisettii and subtriangular in mureroensis, so displaying gradual transitions; (2) rachis 55–60 % (but 64 % in the holotype; fig. 16a), 60–68 % and 72–82 % of pygidial length, respectively; and (3) terminal axial piece narrowly rounded in the two former and subacute in the latter (another character showing broad gradation). As a result, the only difference between pampalius/levisettii and mureroensis is the concave base of the pygidial pleurae and posteroaxial area forming a slight bowl-shaped depression, whereas in mureroensis this area would be broadly flat.
(3) A. ovatopyge Geyer & Vincent, Reference Geyer and Vincent2014 was another species erected from the Bou Tiouit section. According to the authors, the cranidium of this species differs from A. cf. mureroensis: (1) in the glabellar shape, subparallel vs slightly expanding at L1–L2 (a character not distinguishable when comparing populations of A. ovatopyge and A. mureroensis); (2) glabellar frontal lobe, 1.27–1.44 vs 1.34–1.45 times (overlapping values) the width of the occipital ring; (3) relative length of the palpebral lobe, 35–43 % vs 34–41 % of cranidial length (overlapping values); (4) anterior margin of the cranidium, evenly curved to subarcuate vs slightly subarcuate (partly coinciding); and (5) anterior border convex vs flattened (a character potentially masked by taphonomy), respectively. The only significant difference yielded by Geyer & Vincent is offered by comparisons of the pygidia: mureroensis would differ from ovatopyge in (1) the subtriangular (posterior margin slightly rounded to almost straight) vs ovate (occasionally slightly truncated); and (2) the 72–82 % vs 66–72 % of the relative (sag.) length of the rachis (again, Gozalo et al.’s character to distinguish two morphotypes of mureroensis), but see ovatopyge fig. 28b (Geyer & Vincent, Reference Geyer and Vincent2014) with a ratio of 77 %. As stated by the authors (p. 56), the ‘pygidia of A. ovatopyge are often also similar to those of A. cf. mureroensis and occasionally difficult to distinguish. However, differences in those similarly developed pygidia exist in the more subovate outline of the A. ovatopyge pygidium rather than a subelongate shape as in A. cf. mureroensis, and a slightly less raised and less clearly defined platform of the rachis, which extends closer to the posterior margin’, both characters already discussed above. Therefore, differentiation between A. ovatopyge and A. mureroensis was very tenuous, and a statistical analysis seems necessary to assess these differences (see below).
(4) Acadoparadoxides deani Geyer & Vincent, Reference Geyer and Vincent2014 (pp. 57–8) was erected to accommodate some paradoxidine specimens from SW Turkey assigned by Dean & Özgül (Reference Dean and Özgul1994) to A. mureroensis. Geyer & Vincent (Reference Geyer and Vincent2014) differentiated the Turkish specimens from their A. mureroensis concept in having smaller size; slightly expanded glabella at L2, and slightly wider (1.35 times); glabellar frontal lobe less curved; wider (tr.) eye lobes of c. 11 % of cranidial width; narrow fixigenae of c. 16–18 % of cranidial width; S2 deep, slightly curved, more or less transverse lateral sections and a relatively short (tr.) and shallow median section; a faintly subarcuate anterior margin; an anterior border with uniformly low convexity; a fairly narrow (tr.) occipital ring (c. 49–51 % max. cranidial width) that extends considerably beyond the posterior border; a small occipital node located slightly posterior to mid-length of the occipital ring; a fairly elongate shape of the pygidium (width/length ratio c. 0.82); a slender rachis of c. 78 % of pygidial length; a fairly wide (tr.) articulating half-ring of the pygidium.
In our statistical analysis, we include all the above-reported species except A. deani, because the cranidia of the latter are incomplete and the specimens illustrated by Dean & Özgül (Reference Dean and Özgul1994) cannot reliably be measured. The erection of A. deani seems premature because the incomplete cephala from Turkey share the diagnostic characters of A. mureoensis, and pygidia are poorly preserved. Complete and well-preserved specimens from Turkey are necessary before taking a definitive decision about the status of A. deani.
5. Morphological analysis
In order to assess whether A. mureroensis may be identified outside its type area (the Iberian Chains) and whether the species shows intraspecific dimorphism or high levels of variation, we carried out a morphological analysis based on all the specimens illustrated from Spain (including the type material), Geyer & Vincent's (Reference Geyer and Vincent2014) illustrated specimens from the Anti-Atlas, and new ones collected by us from the Assemame quarry. Although the specimens sampled in a single bed of the Assemame quarry can be assigned to various of Geyer & Vincent's species (see Zamora et al. Reference Zamora, Álvaro, Clausen, Esteve, Devaere, Clausen and Álvaro2014), we analyse them below as a single population. The aim of this method is to assess whether the Assemame population falls within the morphospace of a single Moroccan species or, on the contrary, its morphospace is shared by other species.
5.a. Cranidia
When comparing the species of Acadoparadoxides, many differences deal with some cranidial characters, such as the width of the glabellar frontal lobe (Wa in Fig. 4) vs the width of the occipital ring (Wp); and the width of the anterior border vs the width across the eye lobes, and the length of the palpebral lobe. Other differences between the species of Acadoparadoxides are also related to the general shape of the glabella. The discrimination of these morphological characters and recognition of allometric trends in such characters can be assessed using bivariate and multivariate analyses. As stated above, the cranidial and pygidial shapes of this genus display subtle morphological variations, difficult to quantify with few variables. In order to improve the quantification of the Acadoparadoxides shape, we combine below the multivariate analyses with geometric morphometric methods. Measurements are summarized in Table 1.
(1) Bivariate analysis (RMA). The morphological differences of eight cranidial variables have been assessed with respect to a standard measure for cranidial size. The latter has been chosen as Lg because its axial features are relatively constant in trilobites (see Palmer, Reference Palmer1957; Hughes, Reference Hughes1994). Eight linear variables have been selected: four length measurements parallel to the sagittal axis, and four width measures orthogonal to it.
Length of anterior border (Lab). Figure 5a shows the relationship between Lab and Lg in all analysed specimens. RMA shows that the growth of Lab is negatively allometric with respect to Lg at the 95 % confidence level (n = 70, a = 0.78, b = –0.63, r = 0.92, p < 0.0001). Within the sample, the increase in Lab shows a considerable variation. This result suggests that Lab allometry is very strong.
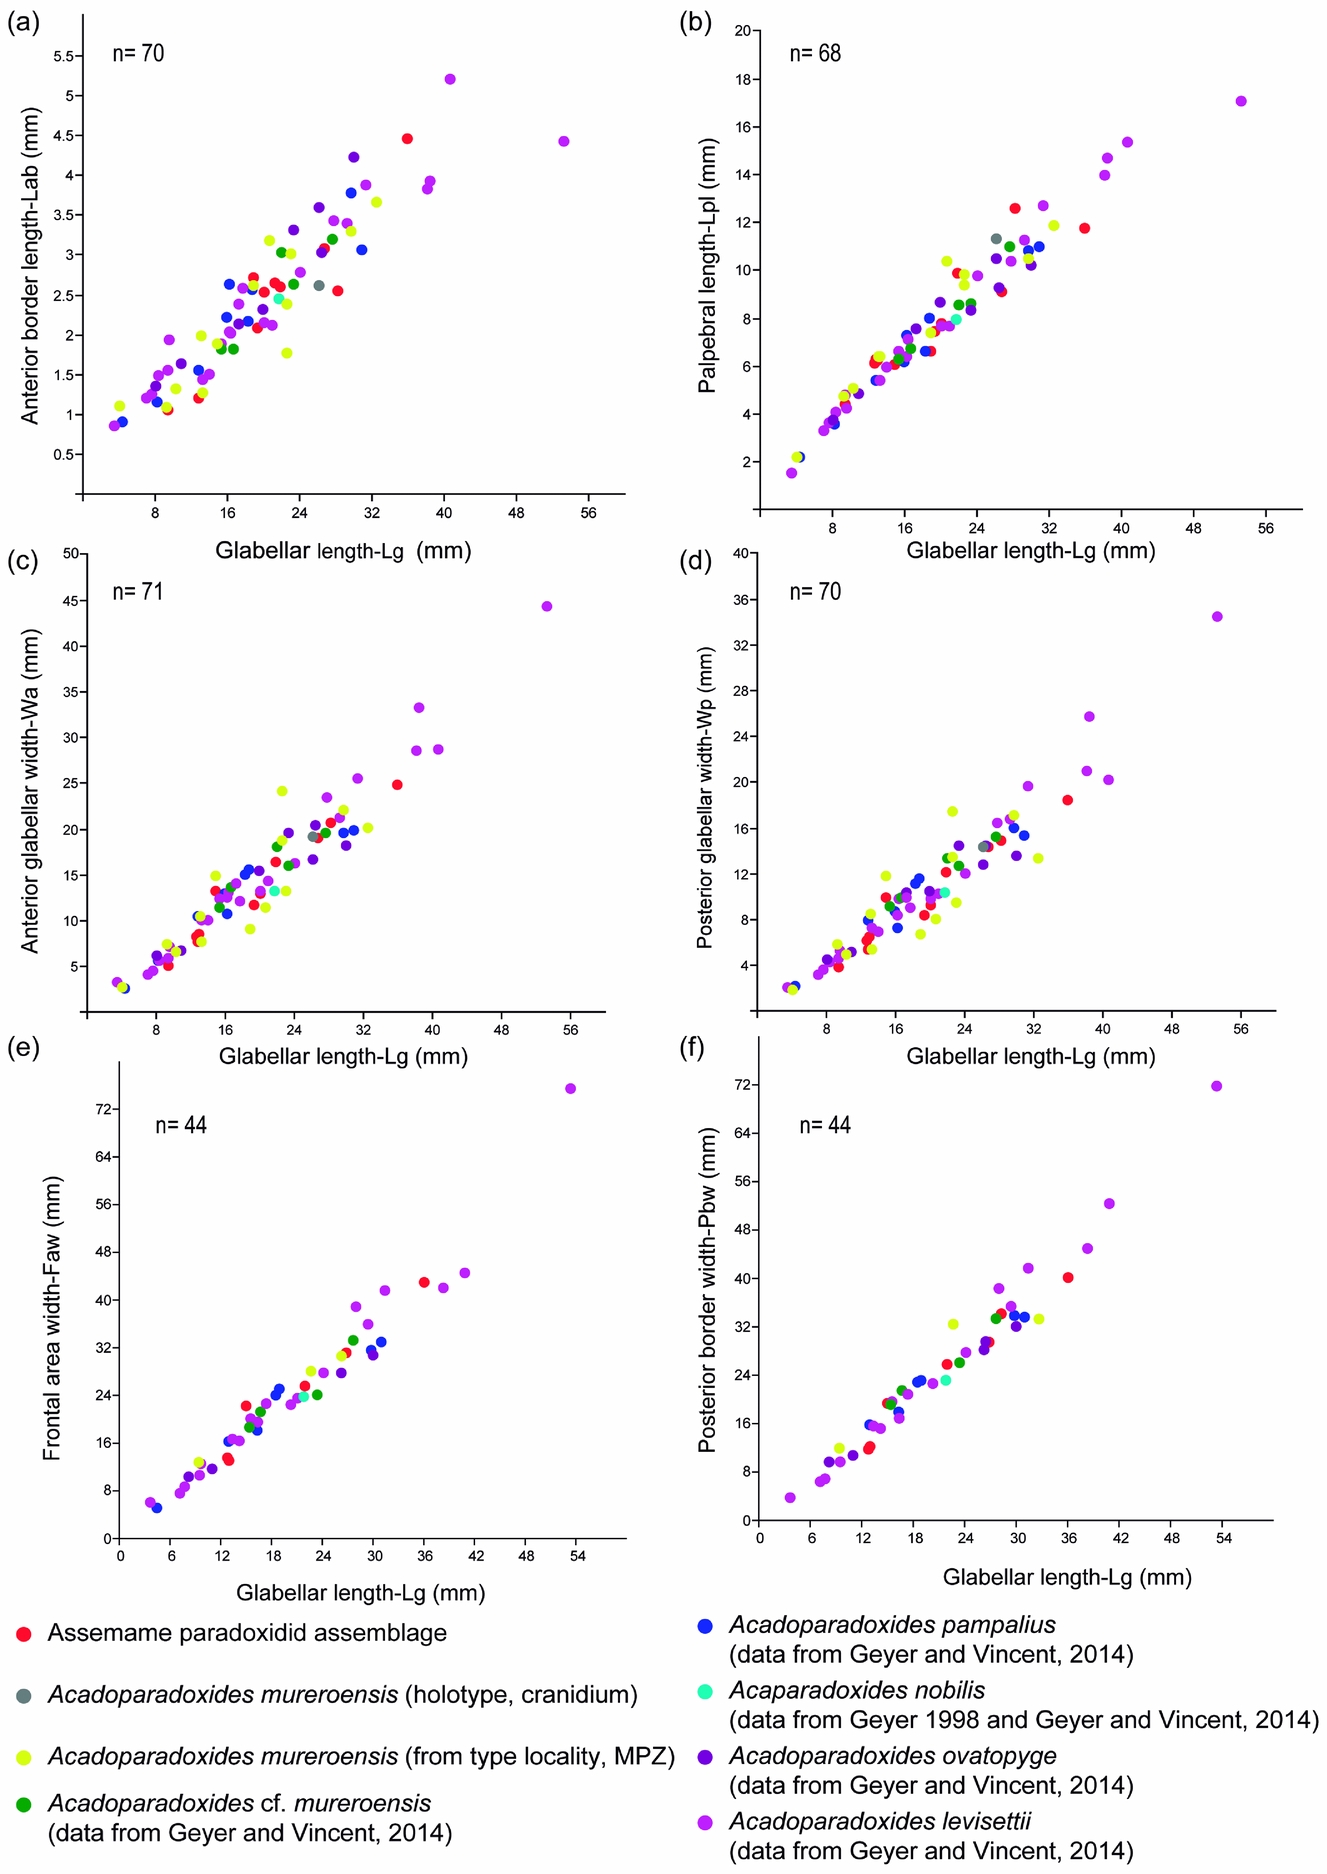
Figure 5. Bivariate plots showing relationship between glabellar length and anterior border length (a), palpebral lobe length (b), anterior glabellar width (c), posterior glabellar width (d), frontal area width (e) and posterior border width (f).
Length of palpebral lobe (Lpl). Figure 5b shows the relationship between Lpl and Lg in all analysed specimens. The growth of Lpl with respect to Lg is negatively allometric at the 95 % confidence level (n = 68, a = 0.85, b = –0.211, r = 0.98, p < 0.0001).
Posterior and anterior glabellar widths (tr.) (Wp–Wa). The maximum Wp and Wa both vary with respect to Lg, indicating an isometric growth at the 95 % confidence level (Wp: n = 71, a = 1.094, b = –0.399, r = 0.96, p < 0.0001, Fig. 5c; Wa: n = 70, a = 1.0875, b = –0.26, r = 0.96, p < 0.0001, Fig. 5d). However, the bivariate plot shows a slight variation in both variables within the sample, especially among larger specimens. Although the standard error is quite small (std error at 0.034 for a and 0.032 for b), the 95 % bootstrapped confidence interval (N = 1999) is quite wide (a: 1.04, 1.151 and b: 1.024, 1.153). Because the specimens display tectonic deformation, in particular those from Murero, the widely dispersed values may reflect distortion, notably in the glabella, which is commonly flattened. Wp has also been assessed with reference to Pbw and shows an isometric growth at the 95 % confidence level (n = 36, a = 1.061, b = 0.266, r = 0.99, p < 0.0001). To check these results, a comparison between the regression coefficients of these variables was carried out based on a MANOVA (Wilk's lambda: 0.07006, df1: 2: df2: 64; F: 424.8; p < 0.00001). These results suggest that there is no significant variation in Wa and Wp within the sample.
Frontal area and posterior border widths (Faw –Pbw). Both widths vary with respect to Lg, indicating slight allometric growth patterns at the 95 % confidence level for the frontal area (n = 44, a = 0.98, b = 0.097, r = 0.97, p < 0.0001; Fig. 5e) and the posterior border (n = 43, a = 1.1068, b = –0.07, r = 0.98, p < 0.0001; Fig. 5f). There is a high variation in both variables within the sample. There is a strong correlation between the frontal area and Lg (r = 0.97, n = 44), and RMA shows an isometric growth in the sample at the 95 % confidence level. The correlation between the breadth of the posterior border and Lg is slightly higher (r = 0.98, n = 43) and RMA also shows isometric growth in the sample at the 95 % confidence level.
RMA shows that variations of some cranidial characters are size-independent. Growth patterns indicate that Lab and Lpl developed strongly allometrically, and the frontal area and posterior border widths developed more or less clearly allometrically. Only the posterior glabellar and maximum glabellar widths show an isometric growth. These allometric growths are responsible for changes in the general morphology of the cranidium. Appreciation of both allometric and isometric growths and of size-independent changes is important, as they show that the morphological variation within the sample suggests conspecific relationships. Although some morphological variations may be related to compaction-related deformation, the correlation of coefficients linking perpendicular linear measurements is high (r > 0.96). The Spanish specimens display more deformation features and their correlation coefficients are slightly lower for perpendicular measurements (r ~ 0.9). In any case, their compaction- and tectonic-related deformation does not preclude the correct identification of their general shape. Therefore, although the types from Murero are broadly distorted, this does not lead to taxonomic confusion and our material can be distinctly assigned, as well as the rest of the species studied here, to A. mureroensis.
(2) Multivariate analysis (PCA) of the cranidium. Although the bivariate analysis suggests that all the involved species belong to a single morphospecies, it is possible that (if viewed synoptically) multiple measurements could reveal the presence of separate clusters. Thus, a PCA was employed to test this possibility.
The analysis (n = 53) included five characters, three axial lengths (Lg, Lab and Lpl) and two transverse widths (Wp and Wa). In the second PCA (n = 35), we added two parameters: the frontal area and posterior border widths.
The eigenvalues (Table 2) show the degree of variation accounted for by each principal component. The contributions of each variable to each principal component have also been calculated as the eigenweights or scores (Table 2). The first and second components account for most of the variation within the sample in using correlation and variance–covariance matrixes (94.008 % and 97.494 %, respectively). All variables have positive eigenvalues, and eigenweights are comparable among all variables (Table 2). Similar loadings for the first component suggest that PC1 reflects the overall size of the specimens, which accounts for most of the variation within the sample. However, the proportion of variation is significantly lower in the remaining axes. The absolute eigenweights of Lab are lower than the rest of the longitudinal variables in the first PCA (Table 2) but higher in the second one (Table 3). In contrast, widths show lower scores in the second PCA (Table 3). This fact reflects allometric pattern growths in Lab seen in RMA. Lab, Wc and Faw also show high eigenweights in axis 2. This suggests that the second principal component is strongly associated with variation in these characters and could reflect a slight size-unrelated variability for Lab. The principal components two to five are not correlated with size. Because each principal component has influence on one or more of the variables, after removal of size, variation patterns may be seen. The bivariate plots of the three principal components display the relationships among individuals (Fig. 6a, b, d–f). The spatial distribution shows that all the specimens (including the types of all the involved species) occupy the same morphospace: the nine populations (five species) share the same morphospace, and PCA shows a single morphological group. The scores in the first component show differences in size: higher score values correspond with larger specimens. It is noteworthy that the larger specimens are the holotype and one paratype of A. levisettii, which are far from the main cluster but within the variation expected for larger specimens. The higher scores in the second component correspond with larger anterior borders, whereas the lower scores in this component correspond with Wp and Wa. Lpl shows higher scores in the third PCA. Thus, these characters appear to contain much of the variation of the anterior border and length of the palpebral lobe accommodated on the second and third axes, which explains the variability of these size-independent characters. PC2 shows a contrast between length and width variables, suggesting tectonic deformation of the analysed sample (in fact, these specimens come from different Moroccan and Spanish localities). PCAs from separate localities show (i) the same values for lengths and widths in axis 2 for all the Moroccan material, whereas (ii) these values are covarying in the specimens from the Spanish-type section. This fact suggests higher shape-control patterns in the Spanish material due to deformation. The discriminant function analysis of the five cranidial dimensions shows a single morphospecies within the CV (Fig. 6c) (eigenvalue = 0.2871; Wilk's lambda = 0.6487; p < 0.5197; Pillai trace = 0.3979; p < 0.5102). The discriminant function analysis of the seven cranidial dimensions shows a single morphospecies within the CV (Fig. 6f) (eigenvalue = 0.223; Wilk's lambda = 0.6476; p = 0.896; Pillai trace = 0.4053; p < 0.8814). Tables 4 and 5 document the pairwise comparison between five species (A. nobilis is removed because more than one specimen is needed for this analysis, whereas the holotype and topotypes of A. mureroensis are included). CVA provides no evidence to consider that the six species analysed here represent more than one morphotype: there is a wide overlap among all specimens in the sample. PCA and CVA results are therefore consistent with the outcome obtained by bivariate analyses.
Table 2. Principal component analysis (PCA) of the five cranidial dimensions
Table 3. Principal component analysis (PCA) of the seven cranidial dimensions
Table 4. Pairwise comparisons of the five cranidial dimensions in the Acaparadoxides species showing Hotelling's p-values, uncorrected significance and Bonferroni corrected
Table 5. Pairwise comparisons of the seven cranidial dimensions in the Acaparadoxides species showing Hotelling's p-values, uncorrected significance and Bonferroni corrected

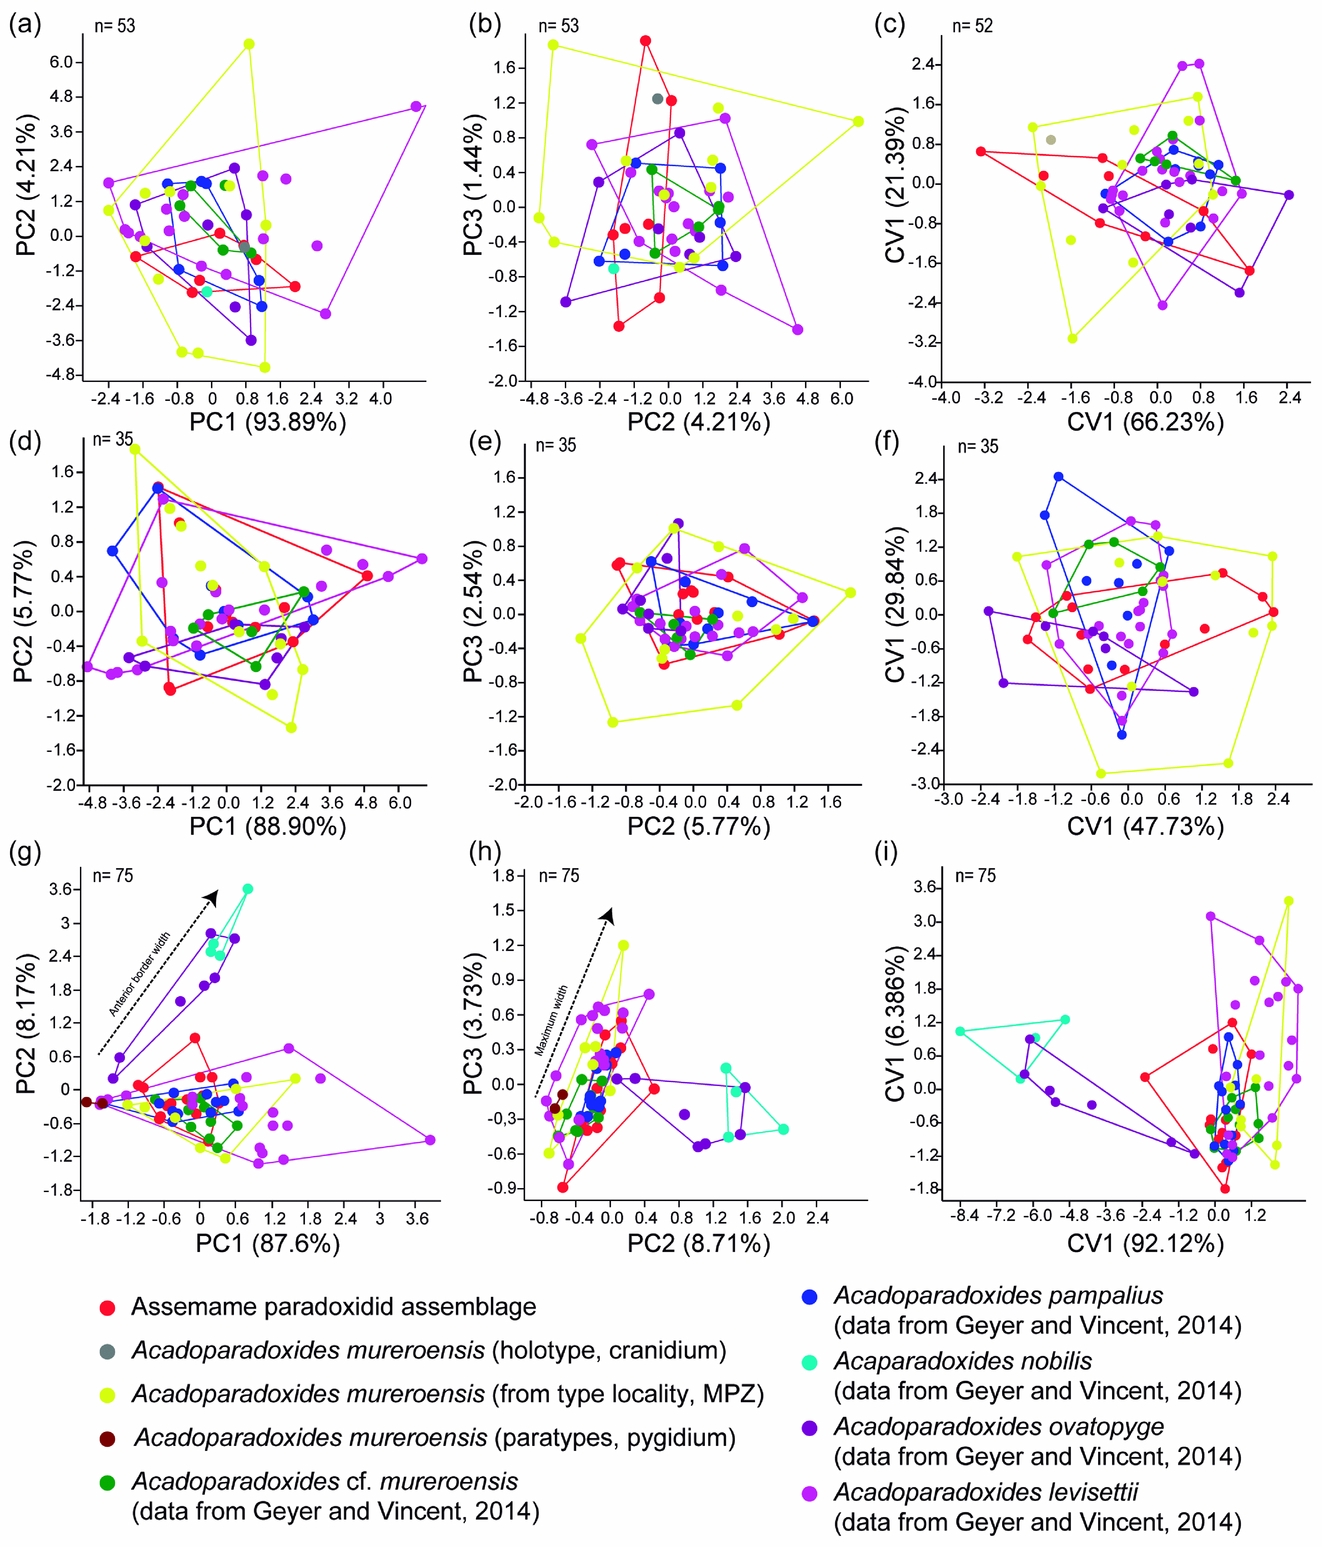
Figure 6. (a, b) Morphospace defined by the first three principal components of PCA related to five glabellar dimensions (see Table 2). (c) Morphospace defined by the first two axes of CVA related to five glabellar dimensions (see Table 2). (d, e) Morphospace defined by the first three principal components of PCA related to seven glabellar dimensions (see Table 3). (f) Morphospace defined by the first two axes of CVA related to seven glabellar dimensions (see Table 3). (g, h) Morphospace defined by the first three principal components of PCA related to four pygidial dimensions (see Table 8). (i) Morphospace defined by the first two axes of CVA related to four pygidial dimensions (see Table 8).
(3) Geometric morphometrics. Figure 7 shows results from PCA of the cranidia from the Assemame paradoxidid assemblage, five Acadoparadoxides species described in Morocco and A. mureroensis from Spain. PC1 accounts for 37.9 % of the total variation and relates primarily to the glabellar length, the palpebral area width (between landmarks 7 and 13), the palpebral area width (between landmarks 2 and 10), and the position of the anterior branch of the facial suture (landmark 2) relative to the rest of the cranidium (Fig. 7b). PC2 accounts for 30.5 % of the total variation and is primarily related to the palpebral area width (between δ after Whittington et al. Reference Whittington, Chatterton, Speyer, Fortey, Owens, Chang, Dean, Jell, Laurie, Palmer, Repina, Rushton, Shergold, Clarkson, Wilmot and Kelly1997, fig. 3, or landmark 7, and the axial furrow) and the palpebral lobe position relative to the rest of the cranidium (Fig. 7d). A smaller proportion of variation between the specimens is due to differences in the orientation of the anterior branch of the facial suture and the palpebral lobe shape (PC3, 6.5 % of total variation). The glabellar shape is rather uniform between the species, with the exception of minor differences in the proportions of the glabellar length and width. The length of the anterior border (landmarks 1 and 9) is uniform. A single canonical variate is a statistically significant discriminator of samples (Bartlett's test: Wilk's lambda = 0.0124, χ2 = 226.0046, df = 180, p = 0.01341, Fig. 8). Despite the substantial overlapping among the samples given in PCA, the mean morphologies of a few samples remain significantly different from one another after the Bonferroni correction (bootstrapped F-test; Table 6). There is a subtle difference between means of A. cf. mureroensis and A. ovatopyge, and between those of A. levisettii and A. mureroensis, but a high overlap among these samples in PC1/PC2 and smaller overlap in morphospace in PC2/PC3 (Fig. 7a, c). The mean morphology of A. mureroensis is well represented by the holotype, which falls in the central part of the Assemame paradoxidid assemblage morphospace. By contrast, the morphological features characterizing the specimens that lie on the outer edges of the occupied morphospace include those with either very wide or very narrow interocular areas, which mostly correspond to A. mureroensis from Spain.
Figure 7. (a, c) Principal component analysis (PCA) of mature Acadoparadoxides cranidia; per cent variation summarized by each axis shown in axis label; shaded area represents the Assemame paradoxid assemblage morphospace, and large cross the holotype of Acadoparadoxides mureroensis. (b, d, e) Thin-plate spline projections of variation along (b) PC1, (d) PC2, (e) PC3 (see Fig. 4a for landmark configuration).

Figure 8. (a, c) Canonical variates analysis (CVA) of mature Acadoparadoxides cranidia; shaded area represents the Assemame paradoxidid assemblage morphospace, and the large cross the holotype of Acadoparadoxides mureroensis. (b, d, e) Thin-plate spline projections of variation along (b) CV1, (d) CV2, (e) CV3 (see Fig. 4a for landmark configuration).
Table 6. Pairwise comparison of Accadoparadoxides species from Spain and Morocco based on dataset from cranidial shape. F- and P-value based on 1600 bootstraps. P-value significant at α = 0.05 in all cases in bold; P-value significant at α = 0.05, after Bonferroni correction, in italics; and P-value significant at α = 0.05, but not after Bonferroni correction, underlined

In summary, no remarkable differences are quantified among the analysed cranidia of A. levisettii, A. mureroensis, A. cf. mureroensis, A. nobilis, A. ovatopyge and A. pampalius.
5.b. Pygidia
As explained above, the pygidial morphology is key to distinguish species in Acadoparadoxides. For the bivariate (RMA) and multivariate (PCA) analyses, four linear variables have been assessed: two axial (Al and Sl) and two transverse (Aw and Mw). The four variables characterize the overall shape of the pygidium and have been used to define several species of Acadoparadoxides. In addition, the geometric morphometric method allows the inclusion of 11 landmarks to improve the overall shape quantification of the pygidium. The posterior width of the pygidia has not been used due to the difficulty of taking accurate measurements.
(1) Bivariate analysis (RMA). The morphological variation of each pygidial character has been assessed with respect to a standard measure for pygidial size. The latter has been chosen as Sl due to axial features being relatively constant in trilobites (see Palmer, Reference Palmer1957; Hughes, Reference Hughes1994).
Al. RMA shows that the growth of Al is isometric with respect to Sl at the 95 % confidence level (n = 78, a = 0.993, b = –0.108, r = 0.99, p < 0.0001, Fig. 9a). Within the sample, the growth of Al shows small variations.
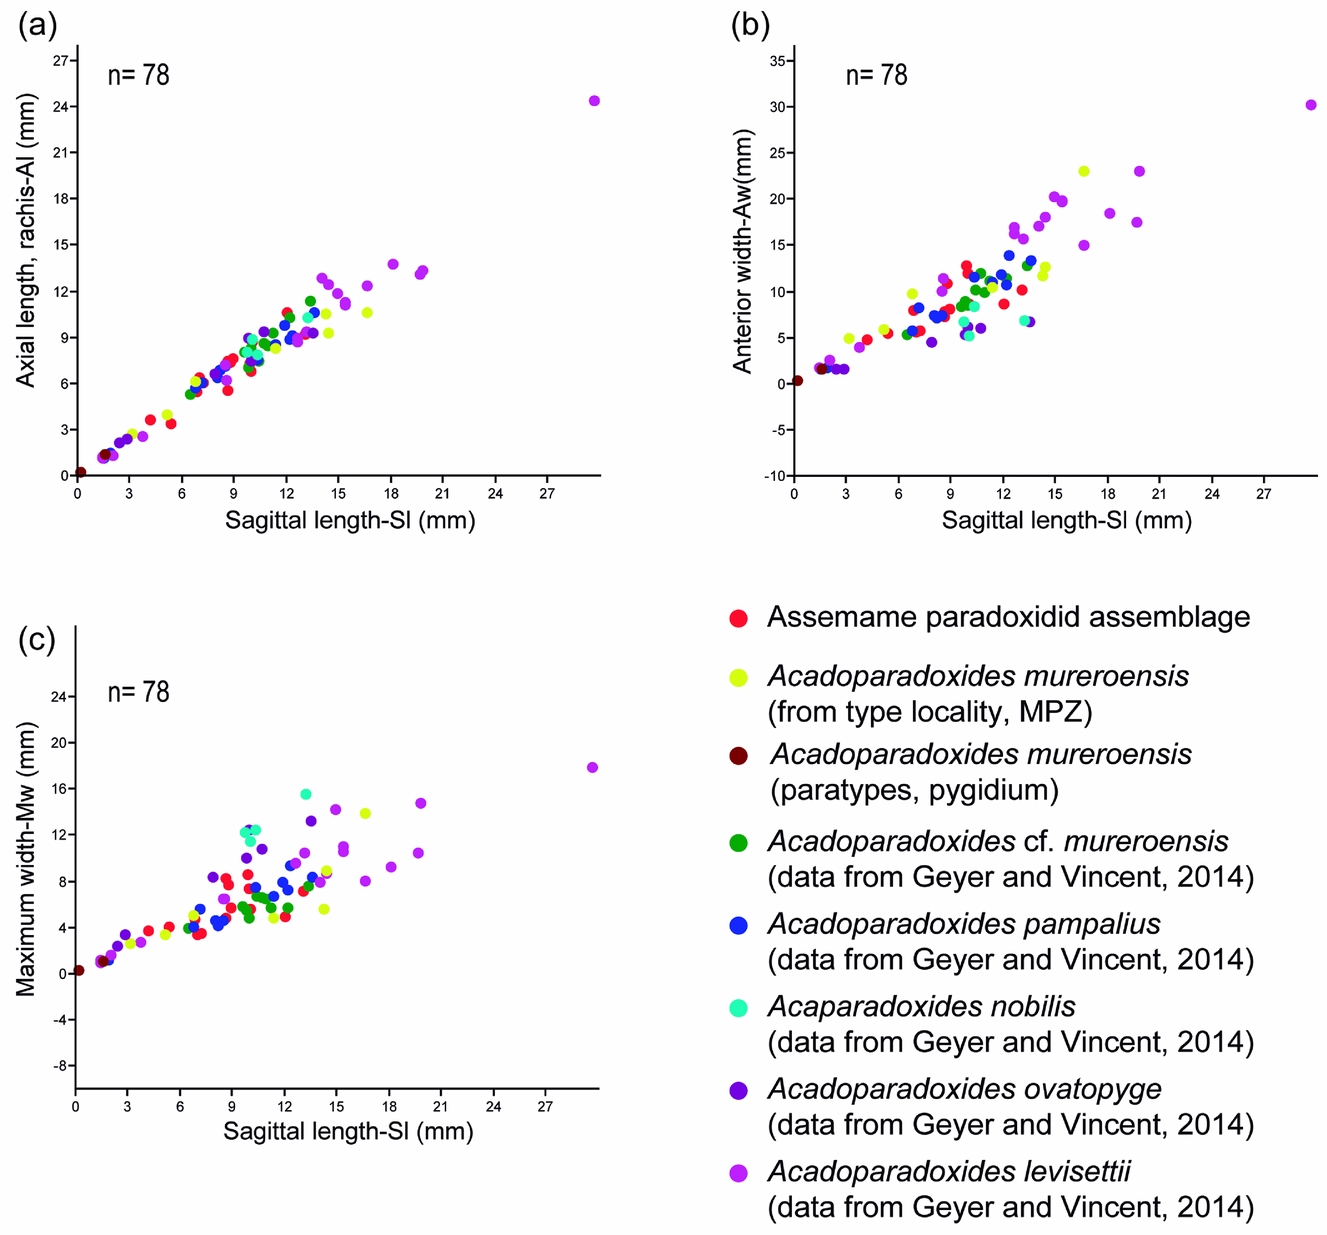
Figure 9. Bivariate plots showing the relationship between the sagittal length and the axial length of the rachis (a), the anterior width (b) and the maximum pygidial width (c).
Aw. RMA shows that the growth of Aw is isometric with respect to Sl at the 95 % confidence level (n = 78, a = 1.059, b = –0.22, r = 0.95, p < 0.0001, Fig. 9b). Within the sample, the growth of Aw shows a considerable variation among the larger specimens (between 9 and 18 mm sagittal length). The bivariate plot shows interpopulational differences, which are observable in the slightly different trends of the regression lines for each population. The populations of A. nobilis and A. ovatopyge seem to have a wider anterior border and show a sloping regression line, so larger specimens of these species have a relatively wider anterior border by comparison with our sample.
Mw. RMA shows that the growth of Mw is isometric with respect to Lg at the 95 % confidence level (n = 78, a = 1.027, b = –0.05, r = 0.95 p < 0.0001, Fig. 9c). Comparison between the regression coefficients of these variables was carried out based on a MANOVA (Wilk's lambda: 0.07988, df1: 3, df2: 71, F: 735.5, p < 0.00001). RMA suggests that all species represent a single morphospecies. However, it is possible (if viewed synoptically) that multiple measurements could reveal the presence of separate clusters.
(2) Multivariate analysis (PCA). The correlation matrix of 75 specimens of Acadoparadoxides mureroensis, A. cf. mureroensis, A. levisettii, A. nobilis, A. ovatopyge and A. pampalius shows relatively low values between the anterior width and the sagittal length, and between both the width and length of the axis, suggesting highly independent size variability in these characters.
The eigenvalues show how much of the variation is accounted for by each principal component, and the PC loadings of each variable to each principal component have also been calculated as the eigenweights (Table 4). The first and second components account for most of the variation within the sample in the analysis (PC1: 87.6 %, PC2: 8.17 %, PC3: 3.73 %; Fig. 6g, h). All variables (on PC1) have positive PC loadings and are roughly similar among all variables, with the exception of Aw (Table 7). These results suggest that the first component is related to the overall size of the specimens, and this accounts for most of the variation within the sample. However, the low eigenweight of the anterior width and the low values of correlation with Sl confirm its size-independent variability. Furthermore, the load of the anterior width in the second axis has a very high value, supporting the idea that the variation of this variable is not related to size. This variability may be associated with intraspecific variation, but its occurrence in axis 2 suggests that these specimens may belong to different taxa. Figure 6g, h shows the bivariate plot of the first three principal components. There, A. nobilis and A. ovatopyge display different trends: the higher scores of component 2 correspond with wider anterior borders. This different trend suggests that these two species are, in fact, different from the rest of the analysed species and they may likely be conspecific. After removing both taxa from PCA, the first and second components account for 98 % of the variation within the sample (PC1: 94.866 %, PC2: 3.953 %). In the second PCA, all variables have positive PC loadings and are similar, showing slightly higher scores for the first axis in Aw and Mw (Table 8). However, Aw and Mw exhibit negative values in the second axis. These characters show an antagonistic behaviour for Sl and Al. PC3 also shows an antagonistic behaviour of Sl and Mw: specimens with larger sagittal lengths display narrower Mw values, and vice versa. Aw also shows a high loading in PC3. Thus, these characters appear to contain much of the variation of the anterior border, sagittal length and maximum widths accommodated on the second and third axes, which explains the variability in these size-independent characters. The results in the first PCA show the same sign for lengths and widths in axis 2, except for Aw for the whole sample (Table 7) and a positive sign in the second PCA (Table 8). PCAs of separate samples show similar values, which suggest some variation controlled by tectonic deformation.
Table 7. Principal component analysis (PCA) of the four pygidial dimensions
Table 8. Principal component analysis of the four pygidial dimensions without A. nobilis and A. ovatopyge

A discriminant function analysis of the four pygidial dimensions shows that the two species recognized within PCA (A. nobilis and A. ovatopyge) are significantly different from the rest of the species (eigenvalue = 4.274; Wilk's lambda = 0.1344; p < 0.0001, Fig. 6i). In addition, A. levisettii seems to be significantly different from the Assemame assemblage. Hotelling's p-values, uncorrected significance and Bonferroni corrected confirm this result (Table 9). These suggest that the pygidial differences, such as shape (subovate, subelongate, sub-rounded and subhexagonal), well-defined platform of the rachis (short rachis with well-defined platform, large rachis with poorly defined platform) or rachis length have a high size-unrelated variability. PCA demonstrates a continuous variation between the analysed species, so that morphotypes cannot be discriminated.
Table 9. Pairwise comparisons of the four pygidial dimensions in the Acaparadoxides species showing Hotelling's p-values, uncorrected significance and Bonferroni corrected, p-value significant at α = 0.05 in bold.

Although A. nobilis and A. ovatopyge might be a priori conspecific, a geometric morphometric analysis seems necessary to better quantify their small differences, not yet evaluated. Similar patterns were documented in the pygidia of Paradoxides davidis by Bergström & Levi-Setti (Reference Bergström and Levi-Setti1978), P. paradoxissimus by Weidner & Nielsen (Reference Weidner and Nielsen2009), Eccaparadoxides pradoanus by Esteve (Reference Esteve2014), and unnamed paradoxidid sclerites from Scandinavia by Weidner & Nielsen (Reference Weidner and Nielsen2014). These studies point out the high variation of the paradoxidid pygidia, which makes for difficult taxonomic assignation based on few specimens.
(3) Geometric morphometrics. Figure 10 shows results from PCA of the pygidia from the Assemame paradoxidid assemblage, five species from Morocco and one from Spain. PC1 accounts for 38.1 % of the total variation and relates primarily to the position and width of the maximum width (landmark 4) to the rest of the pygidium (Fig. 10b). PC2 accounts for 28.6 % of the total variation and is primarily related to the position of the maximum width, length of the axial ring and pygidial anterior border width (landmarks 1–3) to the rest of the pygidium (Fig. 10d). A very small proportion of the variation between specimens is controlled by the platform position (landmark 7), the relative width of the posterior border (landmarks 5 and 6) and the small variation in the position of the maximum anterior width (landmark 4) (PC3, 0.13 % of total variation; Fig. 10e). Unlike the cranidia, the morphological means of more species remain significantly different from one another after Bonferroni correction (bootstrapped F-test; Table 10). For instance, A. ovatopyge and A. pampalius differ significantly from A. cf. mureroensis after Bonferroni correction (bootstrapped F-test). Thus, there is more morphological separation along PC1 in the pygidia than in the cranidia. In fact, all pygidia overlap except A. nobilis. The latter is separated from the rest of the Acadopadoxides species by PC1 and small overlap in PC3 (Fig. 10a, c). Two canonical variates are statistically significant discriminators of samples (Bartlett's test: Wilk's lambda = 0.0462, χ2 = 167.5450, df = 72, p < 0.00001; Wilk's lambda = 0.1656, χ2 = 98.002, df = 55, p < 0.00032302, Fig. 11).
Figure 10. (a, c) Principal component analysis (PCA) of pygidial landmark data in Acadoparadoxides species. Per cent variation summarized by each axis shown in axis label. Shaded area represents Assemame paradoxid assemblage morphospace, large cross represents Acadoparadoxides mureroensis topotype (MPZ2004/59). (b, d, e) Thin-plate spline projections of variation along (b) PC1, (d) PC2, (e) PC3 (see Fig. 4 for landmark configuration).
Table 10. Pairwise comparison of Accadoparadoxides species from Spain and Morocco based on dataset from pygidial shape. F and P-value based on 1600 bootstraps. P-value significant at α = 0.05 in all cases in bold; P-value significant at α = 0.05, after Bonferroni correction, in italics, and P-value significant at α = 0.05, but not after Bonferroni, correction underlined

Figure 11. (a, c) Canonical variates analysis (CVA) of mature Acadoparadoxides pygidia; shaded area represents the Assemame paradoxid assamblage morphospace, and the large cross the topotype of Acadoparadoxides mureroensis. (b, d, e) Thin-plate spline projections of variation along (b) CV1, (d) CV2, (e) CV3 (see Fig. 4c for landmark configuration).
A second analysis was performed after removing A. nobilis. PC1 accounts for 40.4 % and relates to the maximum width (landmark 4), and length of the posterior border (landmarks 5 and 6) to the rest of the pygidial shape. PC2 accounts for 24.5 % of the total variation, and relates to the general position of the maximum width (landmark 4) to the rest of the pygidium. PC3 accounts for 14.8 % of the total variation, and relates to the relative position of the platform with respect to the axial ring (landmarks 7 and 8). In this case, three canonical variates are statistically significant discriminators of samples (Bartlett's test: Wilk's lambda = 0.0740, χ2 = 132.7835, df = 60, p < 0.00001; Wilk's lambda = 0.1870, χ2 = 85.7747, df = 44, p < 0.000166271; Wilk's lambda = 0.4174, χ2 = 44.5554, df = 30, p < 0.0424368).
In order to assess the pygidial and rachis outlines, the above results were evaluated using a second approach through semi-landmarks. Figure 12 shows PCA results of the pygidia from Assemame, five species from Morocco and one from Spain. PC1 accounts for 50.53 % of the total variation and relates primarily to the position and ratio of maximum pygidial width (landmark 4) (Fig. 12a). The relative width ranges from narrower pygidia with wider rachis (Fig. 12a1) to wider pygidia with narrower rachis (Fig. 12a2). PC2 accounts for 10.08 % of the total variation and, as in the case of the landmarks approach, it is primarily related to the relative position of the maximum width, the length of axial ring and the pygidial anterior border width (landmarks 1–3) (Fig. 12a), as well as the relative length and width of the rachis. Thus, the pygidia with larger (sag.) axial rings have longer (sag.) and narrower (tr.) rachis (Fig. 12a3), and the pygidia with shorter (sag.) axial rings have shorter (sag.) and wider (tr.) rachis (Fig. 12a4). PC3 (Fig. 12b) accounts for 10.3 % of the total variation between specimens: it is controlled by the platform position (landmark 7), the relative width (tr.) of the posterior border (landmarks 5 and 6), and the small variation in the position of the maximum anterior width (landmark 4). However, the rachis displays more variation, ranging from very wide (tr.) and relatively long (sag.) rachis with narrower (sag.) posterior border (Fig. 12b5) to very narrow (tr.) and relatively narrow (sag.) rachis with wider (sag.) posterior border (Fig. 12b6).

Figure 12. (a, b) Principal component analysis (PCA) of pygidial semi-landmark data in the species of Acadoparadoxides. Per cent variation summarized by each axis shown in axis label. (1) Thin-plate spline projection of variation in negative axis (score: −0.15) in PC1. (2) Thin-plate spline projection of variation in positive axis (score: 0.10) in PC1. (3) Thin-plate spline projection of variation in positive axis (score: 0.06) in PC2. (4) Thin-plate spline projection of variation in negative axis (score: −0.12) in PC2. (5) Thin-plate spline projection of variation in negative axis (score: −0.20) in PC3. (6) Thin-plate spline projection of variation in positive axis (score: −0.10) in PC3. Shaded area represents the Assemame paradoxidid assemblage morphospace, and the large cross the Acadoparadoxides mureroensis topotype (MPZ2004/59).
The proportion of total shape variance explained by allometry was calculated for each species using Regress8 software (Sheets, Reference Sheets2014). The mean pygidial shape of each population/species was calculated as the consensus of all configurations of that species (Fig. 13). The total shape variance (SStotal) of that species was quantified as the summed squared partial Procrustes distances of all configurations of that species to its mean shape. Partial warp scores were then calculated for each configuration away from the reference configuration of that species, and those scores were regressed in a multivariate regression against lnCS to produce a vector of regression coefficients describing the nature of shape change over the sampled portion of ontogeny for each species. The summed squared residuals (SSresidual) from this regression, also expressed in Procrustes units, represent shape deviations that are not attributable to allometry. The difference between SStotal and SSresidual gives the variance explained by the allometry regression (SSmodel), and the ratio of SSmodel to SStotal gives the proportion of total variance explained by allometry. Non-parametric resampling (1600 bootstraps) determines the statistical significance of the multivariate regression. Using this method, allometry explains 20.2 % of the total shape variation in the sample of the Accaparadoxides population from Assemame, only 3.66 % in A. levisettii, 13.26 % in A. cf. mureroensis, 40.5 % in A. mureroensis, 28.8 % in A. nobilis, 23.3 % in A. ovatopyge, and 17.9 % in A. pampalius (Table 11). The proportion of total shape variance explained by allometry in A. levisettii is smaller (3.66 %) but not representative (P = 0.71). Such a difference in strength of the allometric signal when comparing data from A. levisettii and the remaining species is not surprising, as the population of A. levisettii is biased by large pygidia, which are poorly represented in the other samples.

Figure 13. Thin-plate spline deformation grids depicting the intraspecific shape variation in each species of Acadoparadoxides. Shape variation was calculated by a regression of shape variables against lnCS for each sample; the reference forms in each plot are the three smallest specimens of each population.
Table 11. Percentage of total variance (SStotal, measured as summed squared Procrustes units) explained by allometry in the samples of all analysed species. P-value is based on 1600 bootstraps

In order to assess the difference in the mean pygidial shape, two non-parametric tests were carried out. Parametric tests of difference in mean shape between species are inappropriate because of the incorporation of semi-landmarks in that configuration (affecting the estimate of degrees of freedom). However, statistical tests based on bootstrap resampling, which do not require estimates of degrees of freedom, are appropriate. For each pairwise species comparison, two such non-parametric tests were performed using the TwoGroup8 software (Sheets, Reference Sheets2014). The first non-parametric test demonstrates that the partial Procrustes distance between the mean pygidial shape of each species is not significantly different from zero in all pairwise comparisons with size standardization (confidence limits determined by 1600 bootstraps; Table 12). The second non-parametric test investigates between-sample differences in mean shape using a bootstrap-based approach utilizing Goodall's F-test (Goodall, Reference Goodall1991; Dryden & Mardia, Reference Dryden and Mardia1998) of Procrustes distance between sample means as the test statistic (see Webster & Sheets, Reference Webster, Sheets, Alroy and Hunt2010). The observed F-value is compared to the range of F-values obtained by randomly assigning specimens to samples (1600 replicates). This test yields significant differences in the mean shape between A. levisettii, A. nobilis and the remaining species (Table 12). A. mureroensis, A. cf. mureroensis, A. pampalius, A. ovatopyge and the Assemame population show no remarkable differences in the mean shape.
Table 12. Pairwise non-parametric statistical comparisons of mean cranidial shape between all analysed species. Lower and upper 95 % confidence limits and significance value of Goodall's F-test based on 1600 bootstraps
5.c. Ontogenic control
To explore the overall ontogenetic trends in the above-reported paradoxidid species, we used the Procrustes distance from a reference form. Procrustes distance is the square root of the sum of squared differences between the positions of the landmarks in two optimally superimposed (by least-squares) configurations. A consensus specimen of the three smallest specimens was used as a reference specimen in calculating the Procrustes distances of all specimens (53 cranidia and 75 pygidia), and the Procrustes distances from the reference were plotted against the log of the centroid size. The Procrustes distance broadly increases as size increases, but the studied population shows no significant difference between smaller and larger specimens (p < 0.001) (Fig. 14a). This confirms the isometric trend seen in the pygidia with RMA and suggests a more isometric trend in the cranidia than the observed allometric trend suggested in RMA (see results and discussion above). The morphologically mature specimens show no significant difference in size range of cranidia or pygidia among species, with the exception of a couple of large specimens from Assemame and several pygidia of A. levisettii (Fig. 14b).
Figure 14. (a) Procrustes distance of each specimen from the mean configuration against log centoid size. (b) Range of centroid size for each species and specimens from Assemame open quarry.
6. Discussion
The above-reported morphological analyses (both bivariate and multivariate) demonstrate that A. mureroensis can be identified outside its type locality and that the compaction- and tectonic-related deformation does not prevent a confident identification of its precise morphology.
The analysis of the cranidia shows a single and broad morphospecies within the sample (Zamora et al.’s (Reference Zamora, Álvaro, Clausen, Esteve, Devaere, Clausen and Álvaro2014) ‘mureroensis group’): cranidial features are not considered significant enough to distinguish so many species. However, whereas RMA and PCA analyses of pygidia suggest that A. pampalius, A. levisettii and A. cf. mureroensis share the intraspecific variability of A. mureroensis, in contrast, the pygidia of A. nobilis and A. ovatopyge are morphologically distinct from A. mureroensis, and its specimens seemingly fall into their own trend. Although RMA of the pygidia shows similar trends in the pattern growths and suggests that there is only one morphospecies, the growth of the pygidial anterior margin seems to have a wider posterior border compared with the rest of the populations. PCA confirms a different trend in the growth of this measurement, suggesting that at least A. nobilis (and maybe A. ovatopyge) represents a different (but conspecific) taxon. Thus, based on pygidial differences, A. nobilis is considered here as a valid taxon. The morphological analysis of the pygidia suggests that A. pampalius, A. levisettii and A. cf. mureroensis share the same morphospace and should be considered as junior synonyms of A. mureroensis.
Geometric morphometrics provide further specific information about the shape variation of the sample. Such variation is mainly expressed in the shape, orientation and width of the palpebral lobe, the interocular area width (between δ and axial furrow) and the position of the anterior branch of the facial suture (from divergent forms to more convergent forms) relative to the rest of the cranidium. Less important seems to be the glabellar variation. Higher variation is seen in the pygidial sample and mainly concerns the position of the maximum width, which can be more or less in a rear position. The change of the platform position with respect to the posterior border is also important. These features are distinctive, especially the position of the maximum width that the multivariate analysis did not deal with. But it also confirms the variation seen in the pygidial anterior border width (landmarks 1–3). The bootstrapped F-test shows an important difference between A. nobilis and the rest of the species; removing this taxon, the position of the maximum width reduces its importance in the general shape of the pygidium, although a variation in the pygidial anterior border width is still recognized. The position of the maximum width, contrasting with other Acadoparadoxides species, is in rear position in A. nobilis. On the contrary, A. ovatopyge seems to be closer to the rest of Acadoparadoxides species, sharing most of its morphospace with the rest of the populations.
The cranidial morphology of A. mureroensis from Spain encompasses all the variation expressed by the rest of the species. It is important to emphasize that, in both methods, the holotype falls in the central part of all the morphospace (Figs 6, 7). In addition, A. levisettii encompasses most of the variation of the Moroccan species, and the Assemame assemblage overlap throughout all Moroccan species. By contrast, the mean morphology of a few species remains significantly different from others (Table 6). Most of the species do not encompass all the variation of the pygidia, and the Spanish material overlaps most of the morphospace displayed by the Moroccan species, with the exception of A. nobilis. The mean morphology of many species is significantly different from others (Table 10). Here we face a classical problem: are these species a single one according to our data? If we had only two species with significantly different means and minimal overlap (e.g. A. pampalius and A. levisettii), we would state that those samples represent different species diagnosable by a single range of continuous characters (for a previous example of the same problem, see Hopkins & Webster, Reference Hopkins and Webster2009). Nevertheless, after adding more species and including data by successive pooling of samples, the species cannot be distinguished between them. According to Nixon & Wheeler (Reference Nixon and Wheeler1990), most of these species should not be distinct from each other: e.g. A. nobilis is significantly different from all Acadoparadoxides species, even after bootstrapping. These results do not allow recognition of the newer species: any specimen falling within areas of overlap could not be diagnosed as a member of any particular species. In the Assemame open quarry, all the morphotypes diagnosed as different species, but overlapped morphologically, are found within the same stratigraphic level. Thus, these analyses point to the distinction of only two species (A. mureroensis and A. nobilis) exhibiting some gradual morphological variations in the pygidia, the former including previous species designated to A. cf. mureroensis, A. levisettii, A. ovatopyge and A. pampalius.
In addition, the semi-landmark analysis shows a remarkable resemblance between the mean shapes of the pygidia (Table 12). Once more, the mean shape of A. nobilis is distinct and differentiable, and statistically representative (see Goodall's test), from the rest of the analysed species. The mean pygidial shape of A. levisettii is somewhat statistically differentiable, whereas with the above-reported morphometric analysis it was only significantly different from the Assemame assamblage. This may be a consequence of size bias because the specimens of A. levisettii are represented by a wider range of sizes (Fig. 14). Therefore, allometry may explain most of the variation shown by all the populations with the exception of A. levisettii (Table 11).
In summary, based on the revised diagnostic characters and the 2D biometrical assessment discussed above, A. ovatopyge, A. pampalius and A. cf. mureroensis should be considered as junior species of A. mureroensis, and A. nobilis as a valid species. Both species overlap stratigraphically neither in the Tarhoucht nor Assemame quarries (for the former quarry, see stratigraphic ranges in Geyer & Vincent, Reference Geyer and Vincent2014, fig. 8). Acadoparadoxides nobilis has not yet been reported in the Iberian Chains. Larger specimens of A. ovatopyge, A. pampalius and A. mureroensis are necessary to complete an accurate comparison with A. levisettii, though, based on the overlapping morphospace displayed by this species in the above-reported analyses, we also suggest this species might be a synonym of A. mureroensis.
7. Systematic palaeontology
The morphological terms used below follow Whittington et al. (Reference Whittington, Chatterton, Speyer, Fortey, Owens, Chang, Dean, Jell, Laurie, Palmer, Repina, Rushton, Shergold, Clarkson, Wilmot and Kelly1997) and are illustrated in Figure 4. Illustrated and reported material from Assemame is housed in the IGME Museum, Río Rosas 23, Madrid (acronyms MGM).
Family Paradoxididae Hawle & Corda, Reference Hawle and Corda1847
Subfamily Paradoxidinae Hawle & Corda, Reference Hawle and Corda1847
Genus Acadoparadoxides Šnajdr, Reference Šnajdr1957
Type species. Paradoxides sacheri Barrande, Reference Barrande1852 from the middle Cambrian Jince Formation, Czech Republic (by original designation).
Discussion. The diagnoses of paradoxidinine genera are still a matter of discussion due to the allometric trends displayed during the ontogeny and the morphological variation exhibited by some of their species, which make difficult their subdivision based on the relative proportions of cranidia and pygidia. Consequently, some diagnostic characters of one adult species can occur during different ontogenetic stages in another species (e.g. see recent synonymy of two species sharing diagnostic characters of Acadoparadoxides and Eccaparadoxides by Esteve, Reference Esteve2014). Šnajdr's (Reference Šnajdr1957, Reference Šnajdr1958, Reference Šnajdr1986, Reference Šnajdr1987), Sdzuy's (Reference Sdzuy1967) and Solov'ev's (Reference Solov'ev1980) concept of Acadoparadoxides includes: (1) S1 and S2 glabellar furrows medially (or nearly) connected, (2) palpebral lobes reaching the posterior border furrow, (3) distance between the anterolateral corners of the cranidium with similar width to the greatest width across palpebral lobes, (4) poorly segmented pygidial axis, and (5) a pygidial axis at least 50 % of the pygidial length (for a historical revision of the genus, see Geyer & Vincent, Reference Geyer and Vincent2014). Provisionally, we follow the above-reported five points.
Acadoparadoxides mureroensis (Sdzuy, Reference Sdzuy1958)
Figures 15, 16a–k, 17a–n
New material. Fifteen cranidia, seven pygidia attached to incomplete thoraxes and eight disarticulated pygidia preserved as internal and external moulds in marly shales. Holotype. Sdzuy (Reference Sdzuy1958), pl. 1, fig. 12, cranidium from the Valdemiedes section in Murero, Iberian Chains, NE Spain.

Figure 15. Internal mould in dorsal view of Acadoparadoxides mureroensis selected topotype (pygidium) from the type section in Murero (MPZ2004/59); scale = 2 mm.
Figure 16. Cranidia of Acadoparadoxides mureroensis (Sdzuy, Reference Sdzuy1958) from the Assemame quarry; internal moulds. (a–d) MGM-6794X (a – dorsal view, b – right lateral view, c – left lateral view, d – frontal view), (e–h) MGM-6795X (e – dorsal view, f – left lateral view, g – frontal view, h – right lateral view), (i) MGM-6796X, dorsal view; (j) MGM-6797X, dorsal view; (k) MGM-6798X, dorsal view.
Figure 17. Pygidia of Acadoparadoxides mureroensis (Sdzuy, Reference Sdzuy1958) from the Assemame quarry. (a) MGM-6799X, dorsal view of internal mould; (b–d) MGM-6800X, internal mould (b - dorsal view, c - lateral view, d - posterior view); (e) MGM-6801X, dorsal view of latext cast; (f) MGM-6802X, dorsal view of internal mould; (g) MGM-6803X, internal mould; (h–j) MGM-6804X, internal mould of an articulated pygidium with posterior thoracic segments (h - dorsal view, i - posterior view, j - lateral view); (k) MGM-6805X, dorsal view of internal mould; (l–n) MGM-6806X to 6808X, internal moulds of an articulated pygidium with posterior thoracic segments.
Paratype. Sdzuy (Reference Sdzuy1958), pl. 1, fig. 13, pygidial syntype from the Valdemiedes section in Murero, Iberian Chains, NE Spain (Fig. 14).
Emended diagnosis (in 2D). Species of Acadoparadoxides with width of anterior lobe c. 70 % of glabellar length; posterior glabellar width moderately narrow, c. 50 % of glabellar length; posterior branch of facial suture very short, c. 8 % of glabellar length; ocular lobe c. 40 % (sag.) of glabellar length. Thorax with up to19 segments; pleurae with short horizontal inner portion, fulcra absent in posterior segments; short pleural furrow extending abaxially to edge of doublure piercing slightly doublure of anterior segments; large pleural spines increasing in length anteriorly, from c. 60 % of segment width (tr.) to c. 80 % in posterior part; posteriormost pleural spines flank pygidium and reach beyond level of pygidial edge. Pygidium with variable outline, grading from subtriangular to subhexagonal and subovate; posterior margin with straight section to slightly rounded; rachis subtriangular in outline, 55–80 % of pygidial length, with one axial ring recognizable, and occasionally with a second poorly developed axial ring.
Description. Exoskeleton broadly to elongately oval in outline, evenly rounded anteriorly; largest size (sag.) up to 30 cm. Cephalon semicircular, moderately short, c. 30–45 % (decreasing with growth) of total length. Cranidium as wide as long or slightly wider; anterior margin evenly curved to subarcuate and posterior margin nearly straight (tr.). Glabella clavate in shape, rounded anteriorly; c. 90 % of cranidial length (including occipital ring) and 40 % of cranidial width across centre of palpebral lobes; glabellar frontal lobe c. 1.25–1.45 times width of occipital ring; four glabellar furrows, well marked, with transglabellar S1 and S2, and S3 and S4 not transglabellar, sometimes barely visible; occipital ring short, c. 15 % (sag.) of cephalic length, with some specimens bearing small occipital node; occipital furrow shallow. Anterior border narrow, c. 10 % (sag.) of glabellar length, slightly convex, with narrow anterior border furrow. Preglabellar field very short in late meraspids, c. 5 % of glabellar length, disappearing in holaspids. Palpebral area moderately wide, c. 15–30 % (decreasing with growth) of posterior cranidial width; eye lobes c. 35–45 % of cranidial length; lack of postocular area and very narrow preocular area, with posterolateral projection very short, c. 5 % of cephalic length and 10 % of glabellar width. Palpebral lobe crescentic in outline and moderately long, c. 40 % of glabellar length. Anterior branch of facial suture divergent from palpebral lobes at angle of c. 45° to sagittal line; posterior branch divergent at angle of c. 110° to sagittal line.
Thorax with up to 19 segments; pleural furrow well-defined and deep; anterior and posterior pleural bands well-marked; pleural segments slightly curving progressively backward; posteriormost two to three segments narrowing and curved more strongly backward. Pleural segments gently curved backward, with very long pointed pleural spine.
Pygidium grading from sub-rounded to subhexagonal and subovate in outline, with posterior margin slightly rounded to straight; posterior border flat or evenly curved; base of pygidial pleurae and posteroaxial area broadly flat to slightly depressed; rachis subtriangular in outline, moderately long but highly variable, c. 55–80 % of pygidial length with one axial ring recognizable; occasionally with one or two poorly developed axial rings; terminal piece sub-rounded to subacute in outline.
Comparison. A. mureroensis differs from A. nobilis in its flat and slightly rounded to straight posterior margin of pygidium (which contrasts with the slight median indentation displayed by the latter species), and the position of the horizontal line linking the widest (tr.) points of the pygidium (more posterior in A. nobilis so proportionately longer to the sagittal length).
Despite the absence of 3D morphometrics analysis in this work, necessary to quantify two diagnostic characters of the cranidial and pygidial reliefs stated by Geyer & Vincent (Reference Geyer and Vincent2014) (the relative convexity of the cranidial anterior border and the concave base of the pygidial pleurae and posteroaxial area forming a slight bowl-shaped depression in the pygidium), these 3D characters are not reliable when comparing material preserved in shales (see Geyer & Vincent, Reference Geyer and Vincent2014, fig. 22e, g) and should be statistically checked in order to distinguish A. pampalius and A. levissettii from A. mureroensis. Unfortunately, the preservation in shales of our flattened study material prevents any confident 3D analysis, which should be done in material preserved in silica nodules and/or carbonates.
8. Conclusions
A statistical revision based on bivariate (RMA) and principal component (PCA) analyses and geometric morphometrics (LM and SLM) was performed on the earliest paradoxinine trilobites that mark the diachronous immigration of ‘mid Cambrian’ trilobites in the western Mediterranean region. The latter marks the base of the regional middle Cambrian in Spain and, based on Hupé’s (Reference Hupé1960) chronostratigraphic chart, in Morocco. The morphological analysis has taken into account the different degree of deformation of the Iberian and Moroccan trilobites, which does not preclude a taxonomic comparison of the Iberian and Moroccan species. As a result, the diagnosis of A. mureroensis is emended and a synonymy with A. cf. mureroensis, A. levisettii, A. ovatopyge and A. pampalius is suggested based on 2D morphological characters. The FAD of A. mureroensis in both areas can be provisionally used for regional correlation until homotaxic tests to check its possible diachronism are done.
Acknowledgements
The authors are indebted to the late Mohammed Moujan and his family, and Ksar Timrzite in Alnif (Morocco), for their hospitality, kindness and field support; José I. Canudo (Museo de Ciencias Naturales, Zaragoza University) for kind access to collections in his care; Mohammed Benharref (CAP-Ressources, Casablanca) for obtaining technical support to prevent damage to fossils when crossing the Jabal Tāriq (Gibraltar) strait; and Adrian Rushton and Mark Webster for constructive revision. Trilobite photographs were made by Isabel Pérez, University of Zaragoza. S.Z. is funded by a Ramón y Cajal Grant (RYC-2012-10576) and J.E. by a Juan de la Cierva Grant (FPDI-2013-17337) from the Spanish MINECO. Financial support for this work was provided by project CGL2013-48877-P from Spanish MINECO.


