1. Introduction
Regional contact metamorphism has been related to hot intrusions at different crustal levels (e.g. Clarke et al. Reference Clarke, Fitzherbert, Milan, Daczko and Degeling2010; Craven et al. Reference Craven, Daczko and Halpin2012) and commonly exhibits short-lived steep temperature gradients in metasedimentary rocks (White et al. Reference White, Chappell and Cleaty1974; Vernon et al. Reference Vernon, Clarke, Collins, Ashworth and Brown1990; Collins & Vernon, Reference Collins, Vernon, Fergusson and Glen1992). These rocks provide opportunities to examine the progressive evolution of rocks with different compositions in the same geological setting. Sedimentary rocks of pelitic (aluminium and ferromagnesian rich), semi-pelitic and psammitic (silica rich and aluminium and ferromagnesian poor) compositions experience partial melting at upper-amphibolite to granulite-facies conditions, and silicate liquid produced from such partial melting may segregate and migrate to be a constituent of common granitic bodies (Fyfe, Reference Fyfe1973; Wells, Reference Wells1981; Powell, Reference Powell, Atherton and Gribble1983; Ben Othman et al. Reference Ben Othman, Polvé and Allègre1984; Brown, Reference Brown1994; Brown et al. Reference Brown, Rushmer and Sawyer1995; White & Powell, Reference White and Powell2002; Yardley, Reference Yardley2009).The importance of volatile constituents in the genesis of silicate liquid has been widely acknowledged (Tuttle & Bowen, Reference Tuttle and Bowen1958; Weinberg & Hasalová, Reference Weinberg and Hasalová2015), the presence of water facilitating partial melting at far lower temperatures than for otherwise equivalent anhydrous compositions (Johannes & Holtz, Reference Johannes, Holtz, Ashworth and Brown1990). However, if reactant water comes only from that trapped in porosity or loosely bound to crystal faces at high-grade conditions, the volume of water will be very small (Etheridge et al. Reference Etheridge, Wall and Cox1984; Clemens & Vielzeuf, Reference Clemens and Vielzeuf1987). A prediction consequent to this premise is that only a small proportion of silicate liquid will evolve from H2O-saturated partial melting, in the absence of water ingress (Thompson & Connolly, Reference Thompson and Connolly1995; Yardley & Valley, Reference Yardley and Valley1997, 2000; White et al. Reference White, Powell and Holland2001; Yakymchuk & Brown, Reference Yakymchuk and Brown2014). A related prediction is that H2O-present melting will rapidly evolve to H2O-absent conditions (Clemens & Vielzeuf, Reference Clemens and Vielzeuf1987), and melting will continue via the breakdown of hydrous minerals (White et al. Reference White, Powell and Holland2001; Clemens, Reference Clemens, Brown and Rushmer2006; Brown & Korhonen, Reference Brown, Korhonen, Gupta and Dasgupta2009; Brown, Reference Brown2013). Though partial melting has been mostly considered in terms of either purely fluid-present conditions (e.g. Wickham, Reference Wickham1987; Yardley & Barber, Reference Yardley and Barber1991; Holness & Clemens, Reference Holness and Clemens1999; Ward et al. Reference Ward, Stevens and Kisters2008) or purely fluid-absent conditions (e.g. Braun et al. Reference Braun, Raith and Kumar1996; Kalt et al. Reference Kalt, Berger and Blumel1999; Scrimgeour et al. Reference Scrimgeour, Smith and Raith2001; Droop et al. Reference Droop, Clemens and Dalrymple2003), hybrid behaviour may also occur (e.g. White et al. Reference White, Pomroy and Powell2005; Buick et al. Reference Buick, Stevens and Gibson2004; Droop & Brodie, Reference Droop and Brodie2012). Minor variations in free water can result in a non-negligible impact on melt productivity and composition during partial melting along a given thermal gradient (Holtz & Johannes, Reference Holtz and Johannes1991; Stevens et al. Reference Stevens, Clemens and Droop1997; Droop & Brodie, Reference Droop and Brodie2012; Weinberg & Hasalová, Reference Weinberg and Hasalová2015).
A low-pressure greenschist- to granulite-facies regional aureole of c. 10 km width occurs at Mount Stafford, in the central Australian Arunta Block (Fig. 1) (Vernon et al. Reference Vernon, Clarke, Collins, Ashworth and Brown1990; Greenfield et al. Reference Greenfield, Clarke, Bland and Clark1996, Reference Greenfield, Clarke and White1998; White et al. Reference White, Powell and Clarke2003). Migmatite exposures at Mt Stafford preserve a sequence of metamorphic isograds and provide the opportunity to investigate the partial melting evolution in a suite of common metasedimentary rocks. In particular, metapelitic and metapsammitic layers of ‘bedded migmatite’ (Greenfield et al. Reference Greenfield, Clarke, Bland and Clark1996) have distinct melting histories, apparently as a consequence of subtle changes in bulk composition. Metapelitic layers are interpreted as recording extensive partial melting, whereas metapsammitic layers are mostly inferred to have experienced less extensive melting (Greenfield et al. Reference Greenfield, Clarke, Bland and Clark1996). Building on previous work on the mineral assemblage and textural development (Greenfield et al. Reference Greenfield, Clarke, Bland and Clark1996; White et al. Reference White, Powell and Clarke2003), we investigate: (1) the dependence of melt composition and productivity on the bulk protolith composition and water content of metasedimentary rocks; and (2) the compositional consequence of melt loss from common metasedimentary rocks by integrating petrographical and compositional analyses with the results of phase equilibria modelling.
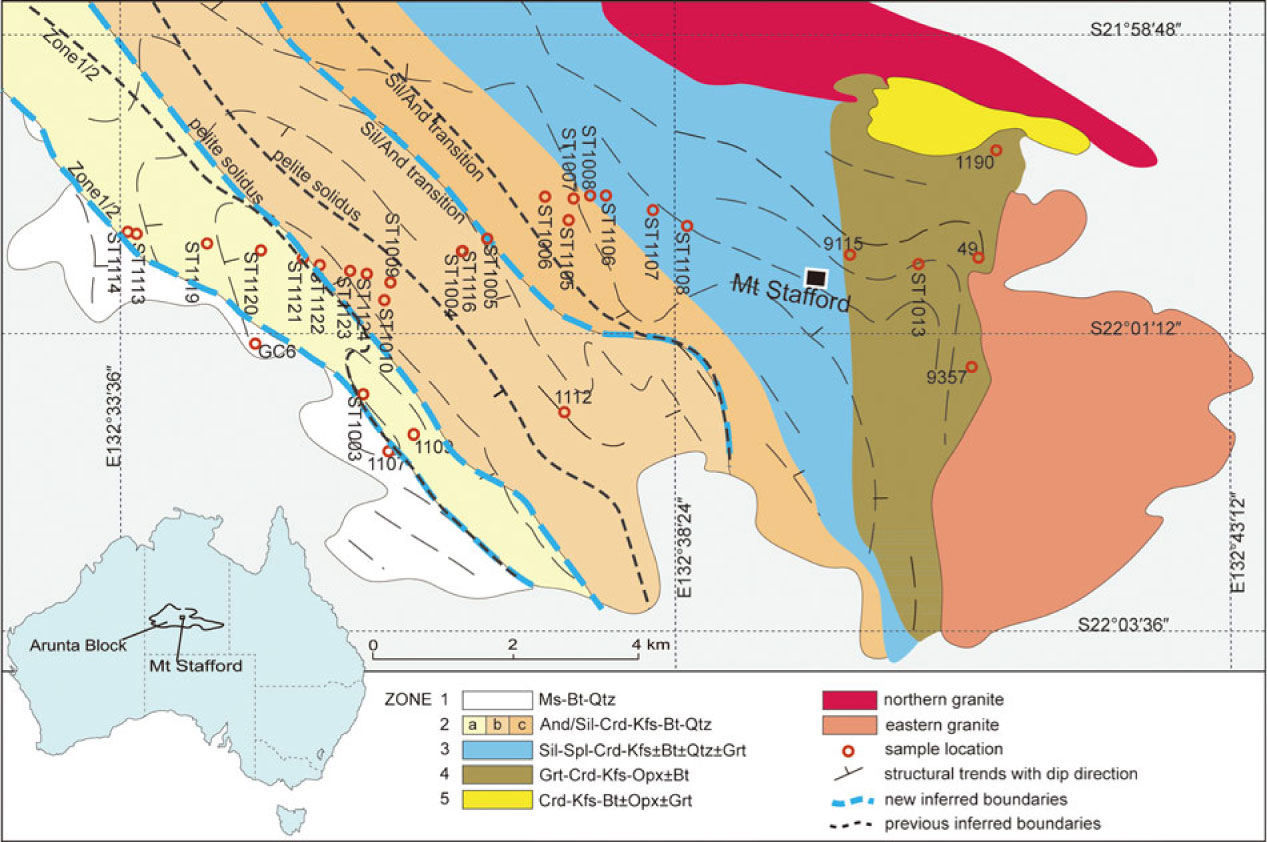
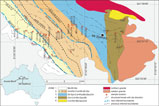
Fig. 1. Geological map of Mt Stafford showing the zone boundaries and sample locations. Representative mineral assemblages for zones from low to high grades are shown in the figure (modified after Greenfield et al. Reference Greenfield, Clarke, Bland and Clark1996, Reference Greenfield, Clarke and White1998; Wang et al. Reference Wang, Dunkley, Clarke and Daczko2014a).
2. Geological setting
Mt Stafford occurs at the northwestern end of the Anmatjira–Reynolds Range, in the Arunta Block, central Australia (Noakes, Reference Noakes and Edwards1953; Stewart, Reference Stewart1981). The Arunta Block is characterized by extensively deformed, low- to high-grade Proterozoic metasedimentary rocks and orthogneiss (Warren, Reference Warren1983; Stewart et al. Reference Stewart, Shaw and Black1984). The Mt Stafford area is dominated by metamorphosed turbidites of the Lander Rock Beds, previously inferred to have been deposited at c. 1870 Ma and metamorphosed at c. 1800 Ma (Blake & Page, Reference Blake and Page1988; Clarke et al. Reference Clarke, Collins and Vernon1990; Compston, Reference Compston1995). However, detrital zircons from the Lander Rock Beds as young as 1838 Ma (Vry et al. Reference Vry, Compston and Cartwright1996) and 1820 Ma (Rubatto et al. Reference Rubatto, Hermann and Buick2006) indicate that the deposition probably occurred shortly before the c. 1800 Ma metamorphic event (Rubatto et al. Reference Rubatto, Hermann and Buick2006).
Delicately interbedded metapelite and metapsammite at Mt Stafford have well-preserved sedimentary structures and are inferred to be components of a turbidite sequence (Stewart et al. Reference Stewart, Shaw and Black1984). Layered rocks dominate outcrop throughout the transition from greenschist- to granulite-facies assemblages, leading to the term ‘bedded migmatite’ in the high-grade rocks (Greenfield et al. Reference Greenfield, Clarke, Bland and Clark1996). The area is unusual for its excellent preservation and exposure of a high-temperature–low-pressure (HT–LP) regional contact aureole (after Hanson & Barton, Reference Hanson and Barton1989). There are only minimal effects of deformation through the regional aureole such that many rocks retain a hornfels texture (Stewart et al. Reference Stewart, Shaw and Black1984).
The regional aureole at Mt Stafford has been divided into five zones (Vernon et al. Reference Vernon, Clarke, Collins, Ashworth and Brown1990; Greenfield et al. Reference Greenfield, Clarke, Bland and Clark1996; Fig. 1). The rocks of Zone 1 comprise poorly exposed schist dominated by muscovite, biotite and quartz, with or without cordierite and andalusite (Vernon et al. Reference Vernon, Clarke, Collins, Ashworth and Brown1990). The transition to Zone 2 is marked by the sub-solidus breakdown of muscovite to andalusite and K-feldspar (Vernon et al. Reference Vernon, Clarke, Collins, Ashworth and Brown1990), with subdivisions of the higher-grade parts of Zone 2 based on the first occurrence of metatexite in metapelitic rocks (Zone 2b) and then the first occurrence of prismatic sillimanite (Zone 2c; Greenfield et al. Reference Greenfield, Clarke, Bland and Clark1996). The first metatexite was inferred by Greenfield et al. (Reference Greenfield, Clarke, Bland and Clark1996) to reflect the onset of water-present partial melting. The lower limit of Zone 3 is defined by the appearance of hercynitic spinel, mostly in intergrowths with cordierite that mantles aluminosilicate. This boundary is accompanied by a marked reduction in biotite mode in all rocks. Zone 4 is distinguished by the appearance of mineral assemblages involving garnet, orthopyroxene and cordierite in metapsammitic rocks (Greenfield et al. Reference Greenfield, Clarke, Bland and Clark1996, Reference Greenfield, Clarke and White1998). Zone 5 includes hybrid diatexite, inferred by Greenfield et al. (Reference Greenfield, Clarke, Bland and Clark1996) to have formed through the injection of granitic magma into high-grade migmatite. Considering the role of whole-rock composition on partial melting, the boundaries of the Zone 2 subdivisions and the Zone 2–3 boundary should reflect a series of high variance reactions between biotite and aluminosilicate and should not be considered as isograds (White et al. Reference White, Powell and Clarke2003). The proposed zonal divisions did not evaluate the effects of changes in whole-rock composition, or account for the development of distinct compositional domains within rocks (White et al. Reference White, Powell and Clarke2003). Nonetheless, they generally reflect a sequence of reactions controlling the greenschist–granulite transition and are used as a convenient spatial and grade framework in this paper.
3. Melting development in the field
Partial melting initiated in the low-grade zones at Mt Stafford. It is seldom straightforward to infer the former presence of silicate liquid in rocks that experienced small degrees of partial melting, and hence identify the true position of solidi in field settings. The grain-scale distribution of liquid in melt-poor crustal rocks is commonly inferred from the presence of cuspate or poikilitic grains with boundaries defining low dihedral angles (e.g. Harte et al. Reference Harte, Pattison, Linklater, Voll, Töpel, Pattison and Seifert1991; Holness & Clemens, Reference Holness and Clemens1999; Holness & Sawyer, Reference Holness and Sawyer2008; Holness et al. Reference Holness, Cesare and Sawyer2011; Wang et al. Reference Wang, Liu, Hu, Li, Zhao, Zhai, Liu, Clarke, Zhang and Qu2014b; Stuart et al. Reference Stuart, Piazolo and Daczko2016, Reference Stuart, Daczko and Piazolo2017). Such grains are indicative of the former presence of melt and have been termed interserts (Rosenberg & Riller, Reference Rosenberg and Riller2000), pseudomorphs after melt (Marchildon & Brown, Reference Marchildon and Brown2002) or melt pseudomorphs (e.g. Harte et al. Reference Harte, Hunter and Kinny1993; Clemens & Holness, Reference Clemens and Holness2000; Brown, Reference Brown2001; Walte et al. Reference Walte, Bons and Passchier2005). Delicate mineral films overgrowing grains and quartz blebs occurring as intergrowths between grains have also been used to infer the former presence of melt (e.g. Guilmette et al. Reference Guilmette, Indares and Hébert2011). Metasedimentary rocks formed in the lower temperature zones at Mt Stafford preserve delicate textures from partial melting that are described in detail below.
Intermittent centimetre-scale lenticular leucosome oriented predominantly normal to bedding in the Zone 2b metapelitic layers of ‘bedded migmatite’ were used by Greenfield et al. (Reference Greenfield, Clarke, Bland and Clark1996) to mark the inferred change to supra-solidus conditions for that rock type. Some transgressive leucocratic segregations in this zone contain euhedral andalusite, consistent with partial melting having initiated in the andalusite field. Large grains of K-feldspar in such segregations commonly have inclusion-rich cores and clear idioblastic rims sometimes mantled by plagioclase (Greenfield et al. Reference Greenfield, Clarke and White1998). In general, leucosome development becomes more extensive as grade increases through and above Zone 2b. Schlieren migmatite (after Mehnert, Reference Mehnert1968) and migmatite with well-developed melanosome and mesosome first appears in Zone 3 rocks. Melanosome development commonly occurs at the compositional boundary of psammitic and pelitic portions of bedded migmatite (Greenfield et al. Reference Greenfield, Clarke and White1998; Wang et al. Reference Wang, Dunkley, Clarke and Daczko2014a). Nebulitic leucosome may compose up to 20% (by volume) of the metapelite layers, commonly centred on aluminosilicate aggregates and forming extensive vein networks (fig. 2c in Greenfield et al. Reference Greenfield, Clarke and White1998). Though Zone 4 metapelitic layers contain abundant diatexite (after Brown, Reference Brown1973), interlayered metapsammite also preserves sedimentary features reflecting low strain and restricted melting in the psammitic layers (Vernon et al. Reference Vernon, Clarke, Collins, Ashworth and Brown1990; Greenfield et al. Reference Greenfield, Clarke, Bland and Clark1996).
4. Petrology at the early stage of partial melting
Samples were collected on an E-trending section (Fig. 1) along Spring Creek, further west than exposures used in the previous detailed studies that mainly focused on high-grade partial melting (e.g. Greenfield et al. Reference Greenfield, Clarke, Bland and Clark1996). Samples representative of the early stage of partial melting are described in detail from the lower temperature side (west) to the higher temperature side (east). Interlayered (semi-) pelitic and psammitic rocks at sites ST1113, ST1114, ST1119 and ST1120 fall in the Zone 1 inferred by Greenfield et al. (Reference Greenfield, Clarke, Bland and Clark1996). However, here we show that their mineral assemblages and textures are consistent with those being part of Zone 2 (Fig. 1). The rocks mostly have a hornfelsic texture defined by random aggregates of biotite, retrogressed cordierite and, in pelitic layers, andalusite in a felsic matrix. Some thin semi-pelitic layers retain a weak biotite foliation (S1), oriented sub-parallel to compositional layering. Pelitic layers consist of andalusite, biotite, muscovite, K-feldspar and quartz with minor plagioclase, tourmaline (∼5%) and ilmenite. Andalusite commonly occurs as larger poikiloblasts with abundant inclusions of K-feldspar and quartz. Symplectites of biotite and fine-grained (commonly <0.2 mm) andalusite are inferred to pseudomorph cordierite. K-feldspar has inclusions of quartz, muscovite and rare biotite. Rare plagioclase occurs as inclusions in K-feldspar. Muscovite is heterogeneously distributed, occurring mostly along compositional boundaries between pelitic and semi-pelitic layers. Minerals forming semi-pelite are smaller (<0.2 mm) than in adjacent pelitic schist. Assemblages involve biotite, andalusite, K-feldspar and quartz with accessory tourmaline and ilmenite. Andalusite grains are smaller (∼0.1 mm) and occur in lower modes (∼7%) than in equivalent pelitic layers. Biotite–andalusite symplectite partially (ST1120) to completely (ST1119) pseudomorphs cordierite. The average grain size in the semi-pelitic schist increases subtly with grade, from ∼0.2 mm at site ST1119 to ∼0.3 mm at ST1120 (Fig. 1). Large, clear grains of quartz (∼0.5 mm) may be of sedimentary origin. Psammitic sample ST1120B contains a mineral assemblage similar to the semi-pelitic sample at that site but has more felsic components. The paired semi-pelite 1107spe and psammite 1107ps samples were collected from the Zone 1–2 boundary (JE Greenfield, unpub. Ph.D. thesis, Univ. Sydney, 1997; White et al. Reference White, Powell and Clarke2003).
Pelitic schist at site ST1121 (Figs 1, 2a) consists of andalusite, biotite, cordierite, K-feldspar, plagioclase and quartz with accessory tourmaline and ilmenite. Abundant symplectite of biotite and andalusite has mostly pseudomorphed cordierite. Some andalusite grains occur as large poikiloblasts. Polygonal cordierite and K-feldspar commonly have abundant inclusions of quartz and (pre-symplectic) biotite, but examples of both also occur with few inclusions. Quartz in low modes occurs as grains of cuspate form and develops web-style textures enclosing biotite (Fig. 3a), consistent with the former presence of melt. Semi-pelitic schist at this site is similar in assemblage and texture, but has less biotite and lacks andalusite. Metapsammitic schist at this site (e.g. bottom layer in Fig. 2a) comprises biotite, K-feldspar, andalusite, muscovite, plagioclase, quartz and accessory ilmenite. It has less biotite (<10%) and much more quartz (>50%) than the pelitic schist at the site. Symplectite of biotite and andalusite is common. Quartz is granular and some grains almost equant; as samples lack cuspate grain shapes they are inferred to have remained at sub-solidus conditions in distinction to adjacent pelitic schists. Muscovite, in low proportions, partially replaces biotite.
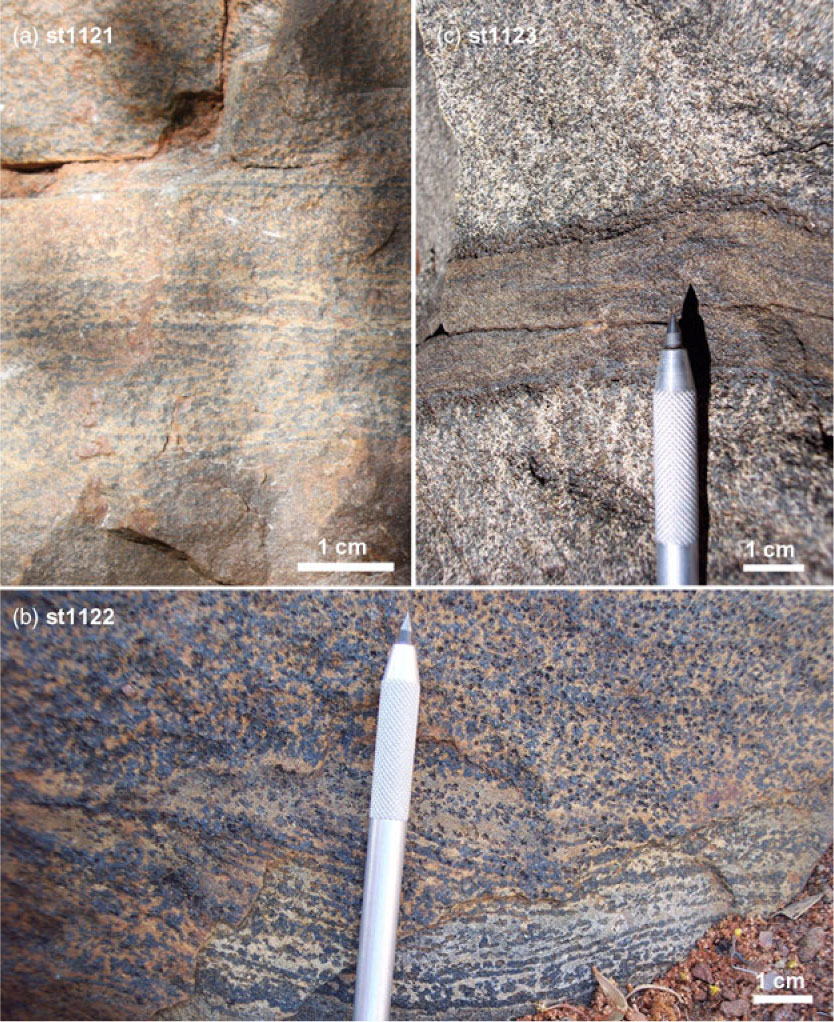
Fig. 2. Field photographs. (a) Interbedded metapelite (middle and upper) and metapsammite (bottom) from location ST1121, original sedimentary layering being well preserved in the metapelite. (b) Metapelite sample with sedimentary bedding from location ST1122. (c) Interbedded metapelite (bottom and upper) and metapsammite (middle) from location ST1123, with metapelite layer showing nebulitic patches of leucosome and dark selvage developing between metapelite and metapsammite.
Grade increases in the upper part of Zone 2a continue to be marked by subtle grain coarsening. The average grain size in pelitic schist at site ST1122 (Fig. 2b) is ∼0.5 mm. Andalusite occurs as both large (∼2 mm) poikiloblasts and small grains in the metapelitic schist. Cordierite occurs as smaller equant grains, extensively pseudomorphed by biotite–andalusite symplectite. Subhedral K-feldspar (microcline) has abundant quartz and biotite inclusions. Features of minerals in the samples suggest the presence of previous melt: quartz interstitial to K-feldspar and cordierite retains cuspate forms (Fig. 3b, c). Film-like quartz also formed around adjacent K-feldspar and/or andalusite (Fig. 3b, c), and occasionally such quartz films were recrystallized to sub-grains in string-of-beads textures (Fig. 3d) (Holness & Clemens, Reference Holness and Clemens1999). The transition to metatexite, evident in the field setting (former Zone 2b), occurs at site ST1123 on the Spring Creek section (Fig. 1), where metapelitic layers include nebulitic migmatite with isolated, patch-style leucosome. Compositional layering is well preserved in psammitic layers, but disrupted by recrystallization and melt segregation in pelitic layers. Metapelitic layers (bottom and upper layers in Fig. 2c) comprise andalusite, biotite, K-feldspar, cordierite, plagioclase and quartz with accessory ilmenite and tourmaline. Grain size is ∼0.5 mm. Andalusite is subhedral to euhedral. Cordierite is extensively pseudomorphed by symplectite of biotite and andalusite, but some well-preserved grains occur with cores rich in inclusions of quartz and biotite and clear rims. K-feldspar and/or perthite commonly occur as subhedral grains. Plagioclase occurs in low modes. Quartz grains commonly have cuspate grain forms. Metapsammitic layers (middle layer in Fig. 2c) comprise biotite, cordierite, quartz and accessory ilmenite. Only minor K-feldspar and plagioclase can be observed. Grain size is small compared with adjacent pelitic layers (<0.2 mm). The first textures typical of partial melting in psammitic rocks occur at site ST1123 and involve poikiloblastic quartz with cuspate boundaries against biotite or plagioclase (Fig. 3e), quartz with cuspate symmetric necks separating quartz and plagioclase (Fig. 3f, g), and rounded quartz blebs with overgrowths of cuspate quartz (Fig. 3g, h). Striking dark selvages developed between pelitic and psammitic layers in bedded migmatite at site ST1123 and persist throughout the rest of Zone 2 and up to Zone 4. They are richer in biotite, cordierite and ilmenite than their hosts.

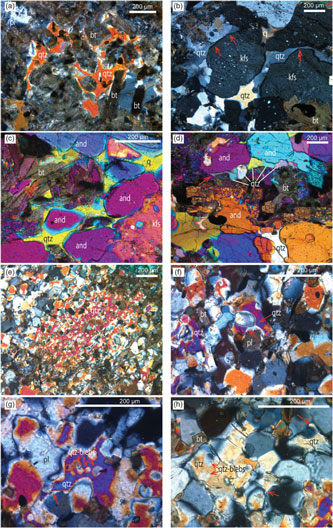
Fig. 3. Photomicrographs showing microstructures indicative of the former presence of melt in metapelite ((a) ST1221, (b–d) ST1122) and metapsammite ((e–h) ST1123). (a) Optically continuous cuspate quartz (qtz) developing web-style textures enclosing biotite (bt), implying a former melt pool (ST1121). Plane-polarized light. (b) Cuspate quartz with very small dihedral angle of boundaries (two arrows on the left) and quartz film around K-feldspar (kfs) (arrow on the right) (ST1122). Cross-polarized light. (c) Interstitial quartz in cuspate shape among andalusite (and), biotite and K-feldspar (ST1122). Cross-polarized light with gypsum plate. (d) String-of-beads of quartz recrystallized from previous melt. Note the quartz bead on the left with a long neck with sharp points (left arrow) (ST1122). Cross-polarized light with gypsum plate. (e) Poikiloblastic quartz with cuspate boundaries against biotite or plagioclase indicating former melt pool (ST1123). Cross-polarized light with gypsum plate. (f) Quartz with cuspate symmetric necks separating quartz and plagioclase (pl) (ST1123). Cross-polarized light. (g) Interstitial quartz with cuspate edge (left arrow) enclosing smaller rounded quartz blebs (ST1123). Cross-polarized light. (h) Quartz grains with tiny neck into plagioclase (right arrow), a symmetric cuspate edge (middle arrow) as well as small blebs (left arrows) (ST1123). Cross-polarized light.
Sillimanite is first developed in pelitic rocks at site ST1005, slightly lower than the previously defined sillimanite/andalusite line, marking the transition to Zone 2c (Fig. 1, after Greenfield et al. Reference Greenfield, Clarke, Bland and Clark1996, Reference Greenfield, Clarke and White1998). The pelitic layers comprise biotite, cordierite, andalusite, K-feldspar, muscovite and tourmaline. Cordierite is partially to completely pseudomorphed by symplectite of biotite and andalusite. Andalusite persists as large porphyroblasts, partially pseudomorphed by prismatic sillimanite. Euhedral K-feldspar (microcline) grains retain straight edges against interstitial quartz. Retrograde muscovite occurs along grain boundaries or in corroded cores of K-feldspar grains. Plagioclase is virtually absent. Tourmaline mode can be as high as ∼5%. Minerals are mostly larger than in lower grade zones.
5. Whole-rock compositions
Whole-rock compositions of 58 metasedimentary samples from Mt Stafford were determined by XRF (X-ray fluorescence) analysis (online Supplementary Material Table S1). Thirty samples represent new data, and 28 samples were drawn from previous work (JE Greenfield, unpub. Ph.D. thesis, Univ. Sydney, 1997). Data are plotted on a series of diagrams illustrating compositional dependencies both between samples within a given zone and spatially across the four main zones (Fig. 4). In binary diagrams involving alumina or silica content as a variable (e.g. Fig. 4a, f), the whole-rock data generally cluster in three groups, corresponding to the pelitic, semi-pelitic and psammitic compositions identified in the field. There is a general first-order relationship between silica and alumina content, alumina content being highest in pelitic samples and silica content highest in psammitic samples (e.g. Fig. 4f). There are also first-order relationships between: (1) ferromagnesian (Fe2O3T + MgO) and alumina or silica contents (Fig. 4a, b); and (2) total alkali (CaO + Na2O + K2O) and alumina contents (Fig. 4c). Breaks in the overall linear trend between pelitic and semi-pelitic rocks, and between semi-pelitic and psammitic rocks (e.g. Fig. 4a) may reflect depositional sorting or a sampling bias. Psammitic samples can be further sub-divided in terms of ferromagnesian content (Fig. 4a), with three samples from zones 1 and 2 having subtly higher ferromagnesian contents and plotting above the general linear trend (Fig. 4a). Some metapelitic layers in the Zone 3 and 4 ‘bedded migmatite’ were referred to as ‘mesosome’ by Greenfield et al. (Reference Greenfield, Clarke, Bland and Clark1996), because a type of melanosome commonly separates psammitic from pelitic and semi-pelitic layers attributing a large-scale leucosome–melanosome–mesosome appearance (terms after Mehnert, Reference Mehnert1968). Such pelitic samples (melanosome/mesosome, outlined in red) have elevated ferromagnesian (Fig. 4a, b, e; samples suffixed with M) and depleted total alkali content (Fig. 4c, d), and are distinct from other metapelitic rocks across the regional aureole.

Fig. 4. Binary plots displaying major element variation for the XRF data compiled in online Supplementary Material Table S1.
6. Phase equilibria modelling
A series of T–X and P–T diagrams were constructed for different metasedimentary rock compositions from the Mt Stafford region in the model system Na2O–CaO–K2O–FeO–MgO–Al2O3–SiO2–H2O–TiO2–O (Fe2O3) (NCKFMASHTO) using the software THERMOCALC (3.33i, Powell et al. Reference Powell, Holland and Worley1998, updated) with the internally consistent thermodynamic dataset 5.5 of Holland & Powell (Reference Holland and Powell1998, updated November 2003). Minerals and activity models used in the construction of the P–T and T–X pseudosections are biotite (bt; White et al. Reference White, Powell and Holland2007), garnet (grt; White et al. Reference White, Powell and Holland2007), muscovite (ms; Coggon & Holland, Reference Coggon and Holland2002), plagioclase (pl; Holland & Powell, Reference Holland and Powell2003), K-feldspar (kfs; Holland & Powell, Reference Holland and Powell2003), ilmenite (ilm; White et al. Reference White, Powell, Holland and Worley2000), spinel (sp; White et al. Reference White, Powell and Clarke2002), orthopyroxene (opx; White et al. Reference White, Powell and Clarke2002), cordierite (crd; Holland & Powell, Reference Holland and Powell1998), magnetite (mag) for sub-solidus (White et al. Reference White, Powell, Holland and Worley2000) and supra-solidus (White et al. Reference White, Powell and Clarke2002) conditions, and silicate melt (liq; White et al. Reference White, Powell and Holland2007). Quartz (qtz), sillimanite (sil), andalusite (and) and water (H2O) were modelled as pure end-member phases. Representative pelitic, semi-pelitic and high- and low-ferromagnesian psammitic rock compositions determined by whole-rock XRF analyses and subsequently converted to molar proportions for the phase equilibria modelling are given in Table 1. The assumption in the ferric–ferrous proportion is 10% of the total iron being ferric (Fe3+), on the basis of mineral chemistry and test modelling to obtain oxide proportions that most closely matched those observed in thin-sections. Samples collected from zones 1 and 2a are taken from rocks that experienced no or insignificant partial melting, and thus give the best available indications of protoliths to the Zone 3 and 4 rocks.
Table 1. Bulk rock compositions used in calculations for pseudosections (mol. %). The compositions of 1107spe and 1107ps are after JE Greenfield (unpub. Ph.D. thesis, Univ. Sydney, 1997) and White et al. (Reference White, Powell and Clarke2003)
6.a. T–X diagrams
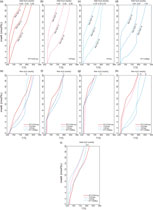
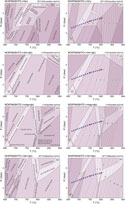
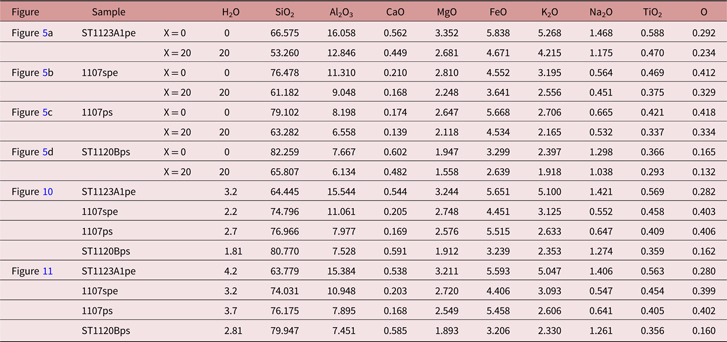
The greenschist- to granulite-facies transition at Mt Stafford was accompanied by a minor increase (<1 kbar) in pressure from ∼3 kbar (White et al. Reference White, Powell and Clarke2003). T–X(H2O) pseudosections were constructed in NCKFMASHTO for representative pelitic, semi-pelitic, high- and low-ferromagnesian psammitic compositions at P = 3 kbar for T = 650–900 °C and H2O = 0–20 mol.% for the purpose of evaluating the dependences of melt fertility on rock composition and water content (Fig. 5). The water content was modelled for the large range 0–20 mol.%, although it is rare for metasedimentary rocks to have extremely low or high water contents (e.g. Yardley, Reference Yardley2009). In the range, the value of the water content in molar per cent corresponds to three to four times that in weight per cent. Molar melt contours are shown as dashed lines in each of the pseudosections. Solidi are highlighted in bold, and equilibria variance is reflected in colour intensity. Equilibria in the T–X(H2O) diagrams indicate a general evolution from low to high variance assemblages with increasing temperature and/or increasing water content. The modelling generally reflects well the observed parageneses involving cordierite, K-feldspar, biotite, sillimanite, ilmenite, magnetite, quartz and liquid, with orthopyroxene also occurring in psammitic compositions. Cordierite occurs in most modelled equilibria except for those formed at low-T water-saturated extremes. Biotite-bearing assemblages are predicted for the pelitic composition ST1123A1 (Fig. 5a) at T <∼700 °C for low H2O contents; biotite stability expands at high T for increasing water content. For the modelled semi-pelitic composition (1107spe), biotite stability is predicted to be more restricted and only stable at T < ∼700 °C independent of water content (Fig. 5b). Biotite is predicted to have a larger stability range at intermediate and low-T conditions for psammitic compositions (1107ps, ST1120Bps; Fig. 5c, d). It is predicted to breakdown to orthopyroxene at T ≈ 800 °C in psammitic compositions across a broad range of H2O contents. Sillimanite is predicted to be present in pelitic and semi-pelitic compositions (Fig. 5a, b) over a wide range of temperature conditions, especially in low H2O conditions. It is predicted to be restricted to T < 690 °C in psammitic compositions (Fig. 5c, d). K-feldspar and plagioclase are predicted to occur over a wide temperature range for low H2O content, but progressively break down as H2O content and T increase. Quartz is predicted to only occur at low water contents in the modelled pelitic compositions (Fig. 5a), but to be stable across almost the full range of modelled X(H2O) conditions for semi-pelitic and psammitic compositions (Fig. 5b, c, d).
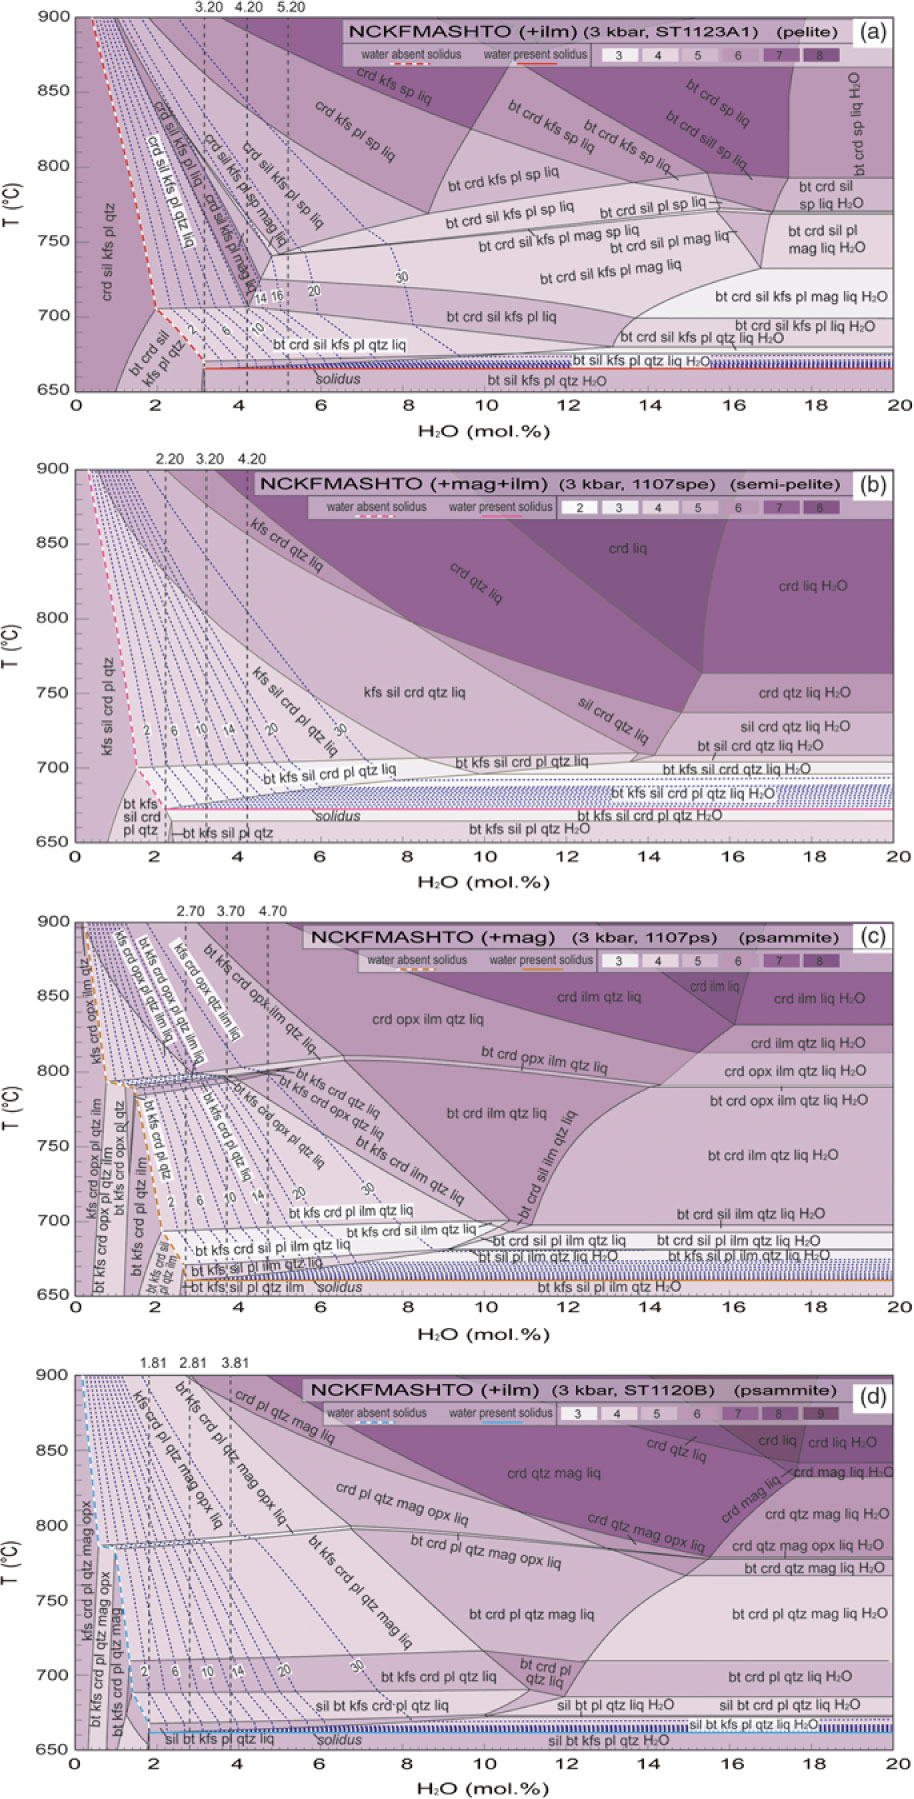
Fig. 5. Calculated T–X(H2O) pseudosections for metasedimentary rocks of varying compositions at 3 kbar. The x-axis shows an increase in H2O content in the system from left to right (mol. %). The value of the water content in molar per cent is approximately three to four times that in weight per cent. Calculated molar mode contours in per cent for melt are shown with dashed lines in each pseudosection. Variance of equilibria in stability fields is indicated in the legend. (a) Pelitic sample ST1123A1. (b) Semi-pelitic sample 1107spe. (c) High-ferromagnesian psammitic sample 1107ps. (d) Psammitic sample ST1120Bps. See the specific compositions used in calculations of the pseudosections in Table 1. The vertical dashed lines in each diagram mark the specific water modes and the evolutionary paths with increasing temperature.
For free-water-absent assemblages, the modelling reflects a general antithetic relationship between solidus T and bound-H2O content. Initial partial melting occurs at the water-saturated solidus if any free water is available. A series of sub-solidus biotite breakdown reactions at T < 790 °C in psammitic compositions (Fig. 5c, d), and at T < 700 °C in pelitic and semi-pelitic compositions (Fig. 5a, b), result in steps in the free-water-absent solidi (Fig. 5). Sillimanite breakdown coupled with the persistence of biotite in psammitic compositions at T ≈ 690 °C (Fig. 5c, d) results in a subtle kink in the relevant solidi for water-absent assemblages. The H2O content required to just saturate low-T assemblages varies with ferromagnesian content of the rock composition (Fig. 5a–d; Table 1). For example, the psammitic sample 1107ps with higher ferromagnesian content (XFeO+MgO ≈ 8.02 wt%) needs ∼2.7 mol.% H2O to become saturated, whereas the semi-pelitic sample 1107spe with lower ferromagnesian content (XFeO+MgO ≈ 7.12 wt%) needs only ∼2.2 mol.%. This is because higher ferromagnesian content increases the modal content of hydrate minerals such as biotite. The high ferromagnesian content tends to retain more bound H2O to the onset of partial melting, even though the rock has less alumina.
The dependence of solidi temperature on compositional spectra between the samples chosen as representative in the T–X diagrams (at fixed P and water saturation) is shown in Figure 6. Partial melting is predicted to occur at slightly varying temperatures for different rock compositions; however, the difference in temperature is minimal.
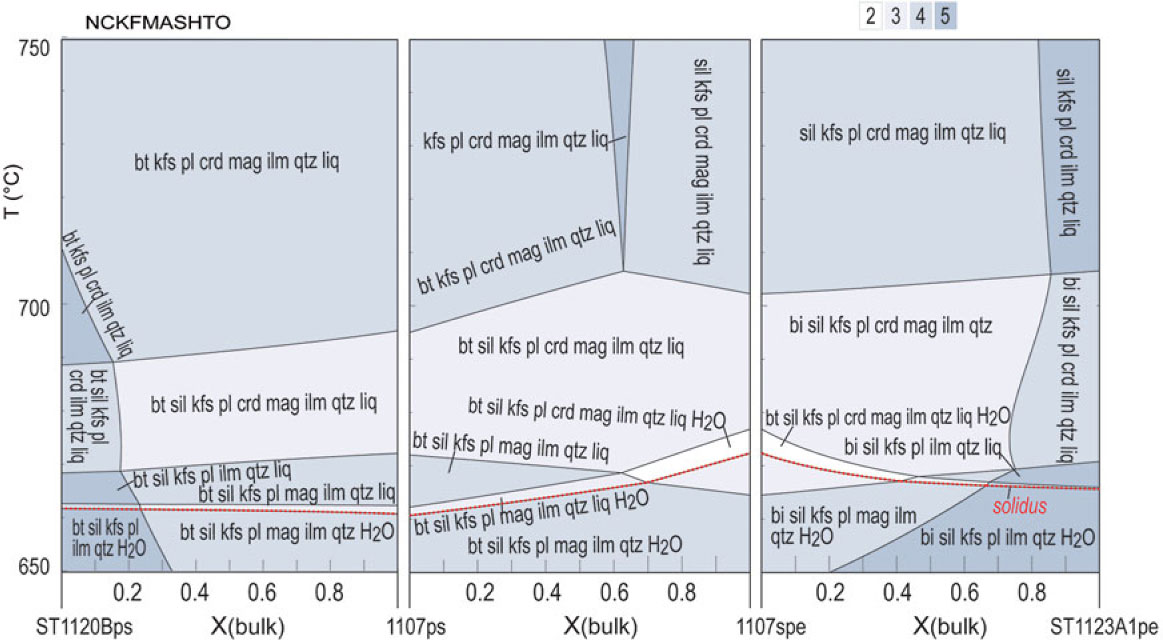
Fig. 6. Calculated T–X(bulk) pseudosections based on the four types of compositions used in Figure 5, showing the influence of bulk composition on the solidus. See the compositions used in Table 1. Water contents were set a bit higher to ensure H2O saturation, which does not affect the water-saturated solidus. The solidus is highlighted by a dotted line at the bottom.
6.b. Modelling melt development at 3 kbar
Melt mode contours (blue dashed lines) on the T–X(H2O) pseudosections (Fig. 5a–d) indicate a general increase in melt mode with T at a given H2O content. For water-saturated conditions, melt mode is predicted to reach 30% at c. 675 °C, 690 °C, 680 °C and 670 °C for pelitic, semi-pelitic and high- and low-ferromagnesian psammitic compositions, respectively. Limited melting occurred at solidus conditions for all metasedimentary rocks at Mt Stafford, based on petrographic relationships including the excellent preservation of depositional features. These relationships also indicate that there was no significant water ingress; otherwise more extensive partial melting would have occurred. On the other hand, prograde sub-solidus metamorphism and the breakdown of hydrous minerals result in the temperature-dependent liberation of bound water and the possibility of water-saturated conditions persisting to the solidus. The amount of water released at the solidus is dependent on the composition of the metasedimentary rocks. Pelitic compositions commonly have higher muscovite contents and thus have the potential to release higher amounts of water. If the temperature increased rapidly from conditions appropriate for muscovite dehydration to the solidus, it is likely that some released water will be retained in the rocks and consequently effect the extent of partial melting. However, differences in the amount of water released by pelitic and psammitic rocks must be small (e.g. Yardley, Reference Yardley2009). We considered different situations with free water of 0, 1 and 2 mol.% at the solidus of the pelitic and psammitic rocks. Melt productivity as a function of temperature, and assuming no melt loss or gain, for the four compositions with various water contents were modelled and compiled in Figure 7.
Fig. 7. Melt production as a function of temperature and water amount calculated at 3 kbar on the basis of the pseudosections in Figure 5. (a) ST1123A1pe. (b) 1107spe. (c) High-ferromagnesian 1107ps. (d) ST1120Bps. The melt production of different samples is compiled at specific water conditions of (e) free H2O = 0; (f) free H2O = 1 mol. %; (g) free H2O = 2 mol. %; and (h) free H2O = 1 mol. % for pelitic samples and 2 mol. % for psammitic samples. (i) Total H2O = 3.5 mol. % for all samples. The water content (total H2O) needed to just saturate the pelitic, semi-pelitic and high- and low-ferromagnesian psammitic compositions at solidus conditions are ˜3.20, 2.20, 2.70 and 1.81 mol. %, respectively.
With low water content (free H2O = 0), the pelitic and semi-pelitic compositions are predicted to have a relatively steep slope of the T versus melt fraction from the solidus to ∼700 °C, and then the slope becomes gentle as a consequence of the exhaustion of biotite (Fig. 7a–e). Isopleths of melt mode retain a consistent gradient for heating at fixed water content to the maximum modelled T of 900 °C, but the isopleths become more closely spaced at elevated temperatures (Fig. 5a, b) as the melt becomes progressively drier (e.g. Johannes & Holtz, Reference Johannes and Holtz1996). The slope of the T versus melt fraction for psammitic compositions is predicted to be gentler than those for either pelitic or semi-pelitic compositions (Fig. 7a–e), but it becomes much steeper from ∼800 °C when the breakdown of biotite and development of orthopyroxene occurs (Fig. 7a–e). Pelitic to semi-pelitic migmatite can thus be predicted to be more fertile than psammitic migmatite for lower temperature granulite-facies conditions, the potential fertility relationships flipping at high-T granulite-facies conditions (see also White et al. Reference White, Powell and Clarke2003).
Minor free water facilitates the melting of the four types of rocks, and ∼5 mol.% melt is expected at just above the solidus for all when there is 1 mol.% free water (Fig. 7a–d, f). In this situation, all rocks have a steep initial slope of T versus melt fraction and obtain a melt volume of 7 mol.% between 680 and 700 °C (Fig. 7f). For the pelitic composition ST1123A, melt amounts to ∼12 mol.% before all biotite is consumed at just above 700 °C, whereas the semi-pelitic and psammitic compositions produce less melt (8–9 mol.%). Between 700 and 800 °C, the pelitic composition is more fertile than the semi-pelitic and psammitic compositions, but the discrepancy in melt production shrinks in comparison with that modelled with low water content (free H2O = 0). After biotite is consumed at ∼790 °C, psammitic compositions obtain a high melt production comparable with that for pelitic compositions (Fig. 7f). If the free water at the solidus is as high as 2 mol.%, both pelitic and psammitic rocks will produce very high volumes of melt of ∼10 mol.% at just above the solidus. The pelitic composition is more fertile than the semi-pelitic and psammitic compositions before it is surpassed by the semi-pelitic (1107spe) and psammitic (1107ps) compositions at 750 °C. At moderate temperatures, the four compositions show no significant difference in melt production, with a highest discrepancy of ∼3 mol.%. In general, the addition of minor free water increases the melt fraction significantly: for example, at 750 °C the addition of 2 mol.% H2O almost doubles the melt fraction for the pelitic composition (Fig. 7a) and nearly trebles it for the semi-pelitic and psammitic compositions (Fig. 7b–d).
The melt and residuum compositions for the representative pelitic, semi-pelitic and high- and low-ferromagnesian psammitic rocks at Mt Stafford were calculated from 700 °C to 850 °C at 3 kbar. The effect of varying conditions of free water (0, 1 and 2 mol.%) at the solidus were evaluated. Melt compositions are listed in Table 2 and shown in Figure 8, whereas the residuum compositions were compiled and illustrated in Table 3 and Figure 9. All melt and residuum calculations were performed in closed-system conditions.
Table 2. The model melt compositions at 3 kbar for the metasedimentary compositions of varying water activities (wt %)
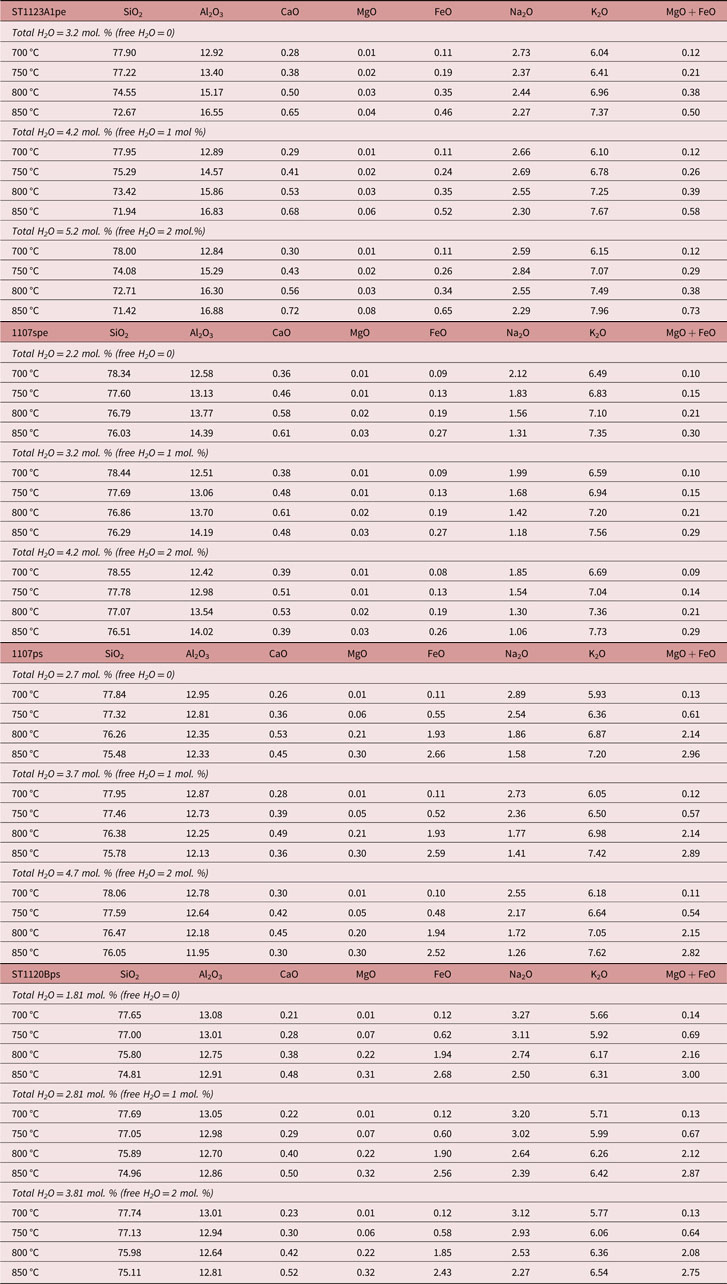
Table 3. The model residuum compositions at 3 kbar for the metasedimentary compositions of varying water activities. The melt mode removed from the system is also shown
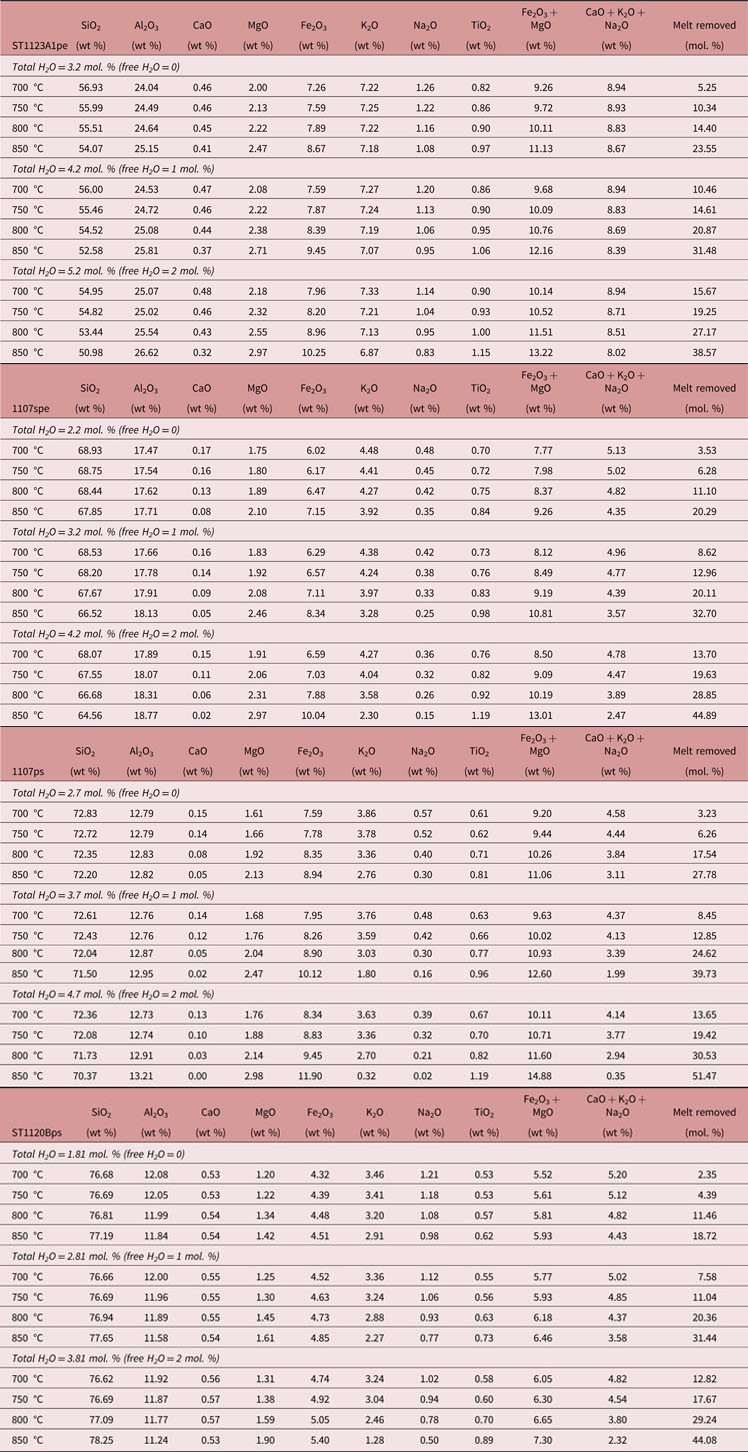
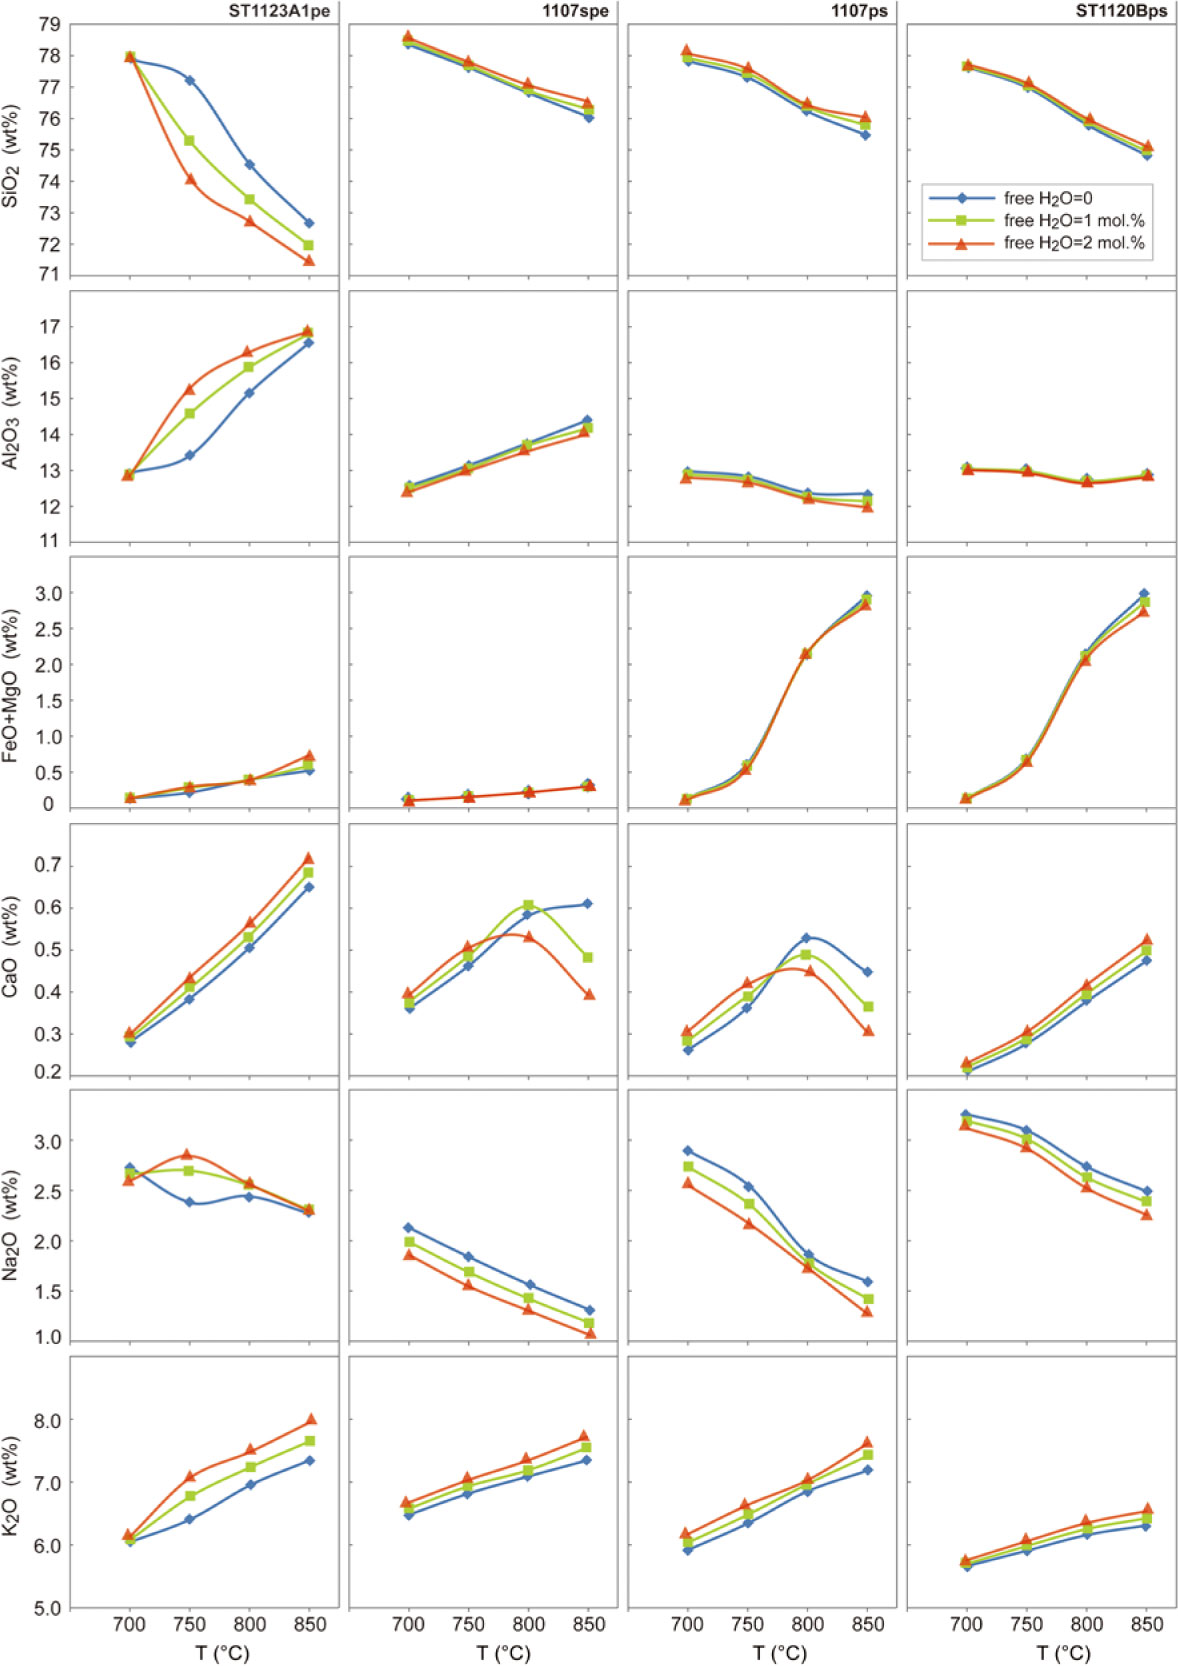
Fig. 8. Melt compositions as a function of temperature and water amount calculated at 3 kbar for the metasedimentary rocks.
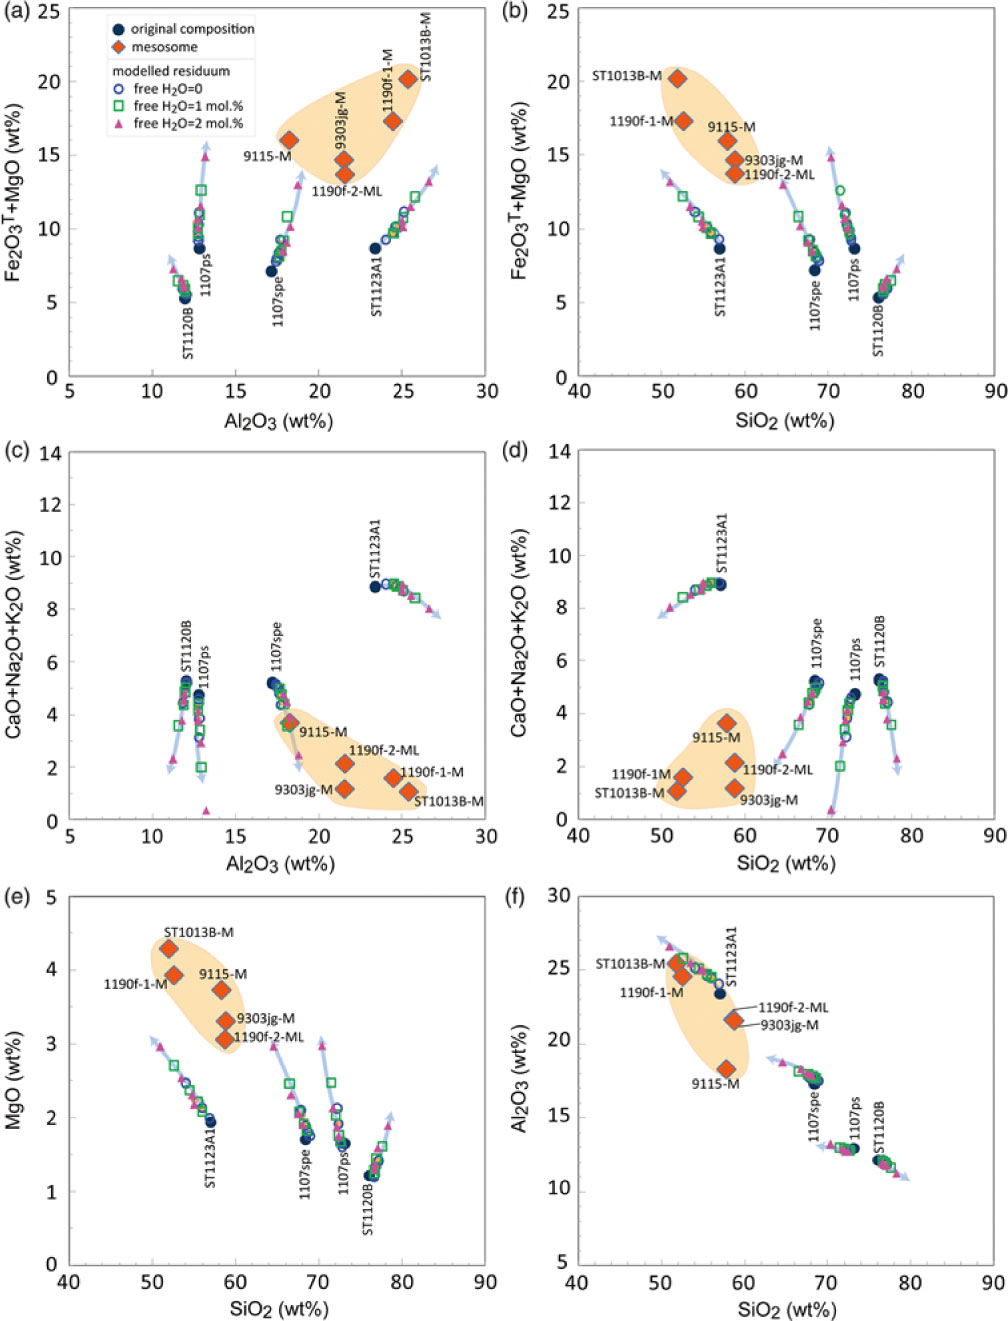
Fig. 9. Residuum compositions as a function of temperature and water amount calculated at 3 kbar for the metasedimentary rocks. The arrows show the direction of temperature increase in steps of 50 °C as in Table 3. The residuum becomes poorer in alkali composition and richer in ferromagnesian composition as temperature increases.
6.c. P–T diagrams
As illustrated by the T–X(H2O) pseudosections (Fig. 5a–d), the water content (total H2O) needed to just saturate the pelitic, semi-pelitic and high- and low-ferromagnesian psammitic compositions at solidus conditions are ∼3.20, 2.20, 2.70 and 1.81 mol.%, respectively. At such conditions, there is virtually no free water (free H2O = 0) in the rocks at the solidus for P ≈ 3 kbar. P–T pseudosections were constructed for the pelitic, semi-pelitic and psammitic compositions at the condition free H2O = 0 for a P–T range of 2.5–4.5 kbar, at 650–900 °C (Fig. 10a–h). As the water-bearing minerals (muscovite) dehydrate just before the solidus, it is likely that the metasedimentary rocks have variable amounts of free water when they just reach their solidus. The situation that each rock system has 1 mol.% free water at the solidus was also considered, and the P–T pseudosections were calculated with total water contents of ∼4.20, 3.20, 3.70 and 2.81 mol.% for the pelitic, semi-pelitic and high- and low- ferromagnesian psammitic compositions, respectively (Fig. 11a–h). The bulk compositions used for the calculations are listed in Table 1.
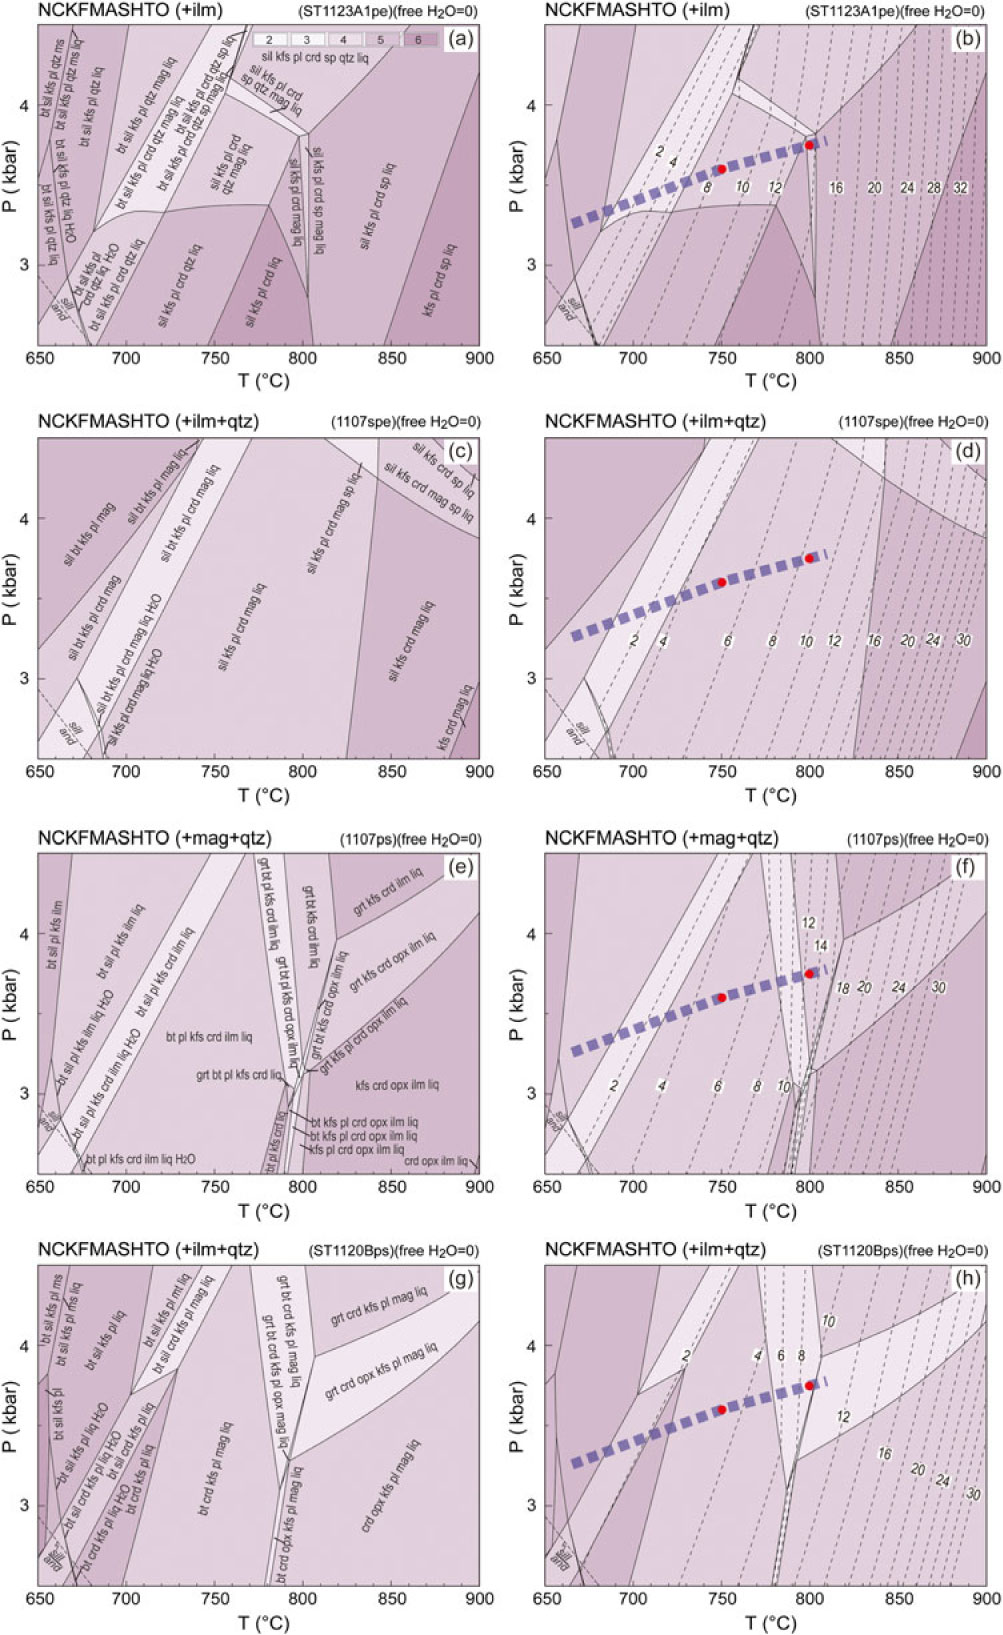
Fig. 10. P–T pseudosections for the representative metasedimentary samples with free H2O = 0 at solidus. Calculated molar mode contours in per cent for melt are shown with dashed lines. Variance of equilibria in stability fields is indicated in the legend (a). (a, b) Pelitic sample ST1123A1. (c, d) Semi-pelitic sample 1107spe. (e, f) High-ferromagnesian psammitic sample 1107ps. (g, h) Psammitic sample ST1120Bps. The compositions used in calculations of the pseudosections are included in Table 1. The thick dashed lines on the figures represent a generalized field array (White et al. Reference White, Powell and Clarke2003). The red dots designate the P–T conditions for calculating melt and residuum compositions (online Supplementary Material Tables S2 and S3).
In general, the topologies of the phase relationships for pelitic, semi-pelitic and high- and low-ferromagnesian psammitic compositions with higher water contents (free H2O = 1 mol.%) are similar to those with lower water contents (free H2O = 0), particularly for the psammitic samples (1107ps and ST1120B). However, the increase in free water in the pelitic sample ST1123A1 shrinks the stability field of quartz and sillimanite to a lower temperature and expands the low-T limit of spinel. The high-T limit of plagioclase for semi-pelitic sample 1107spe was also shifted to a lower temperature by the increase in free water.
6.d. Melt development along the regional metamorphic field gradient
As the progress of melting was principally controlled by temperature, the modelled fixed pressure of 3 kbar reflects well the changes observed along the regional metamorphic field gradient. A minor variation in pressure will not significantly affect melt productivity (Figs 10, 11). Where there is virtually no free water at the solidus, pelitic sample ST1123A1 is predicted to have ∼8 mol.% melt at 750 °C and 3.6 kbar (largely corresponds to Zone 3; White et al. Reference White, Powell and Clarke2003), and ∼14 mol.% at 800 °C and 3.75 kbar (Zone 4). The ingress of minor free water (1 mol.%) will result in an additional ∼6 mol.% melt along the gradient (Figs 10, 11). Both semi-pelitic sample 1107spe and high-ferromagnesian psammitic sample 1107ps are predicted to have ∼5 mol.% melt at 750 °C and 3.6 kbar (Zone 3) but produce ∼9 mol.% and ∼13 mol.% melt, respectively, at 800 °C and 3.75 kbar (Zone 4) when water contents are low. The ingress of 1 mol.% free water to the samples is predicted to be accompanied by an increase of 6–7 mol.% melt at the prevailing conditions. Where there is no free water at solidus in the psammitic sample ST1120B, only ∼3 mol.% melt could be expected at Zone 3 conditions, in contrast to ∼10 mol.% at Zone 4. With slightly more water (free H2O = 1 mol.%), the melt production of ST1120B is predicted to increase by ∼7 mol.%.
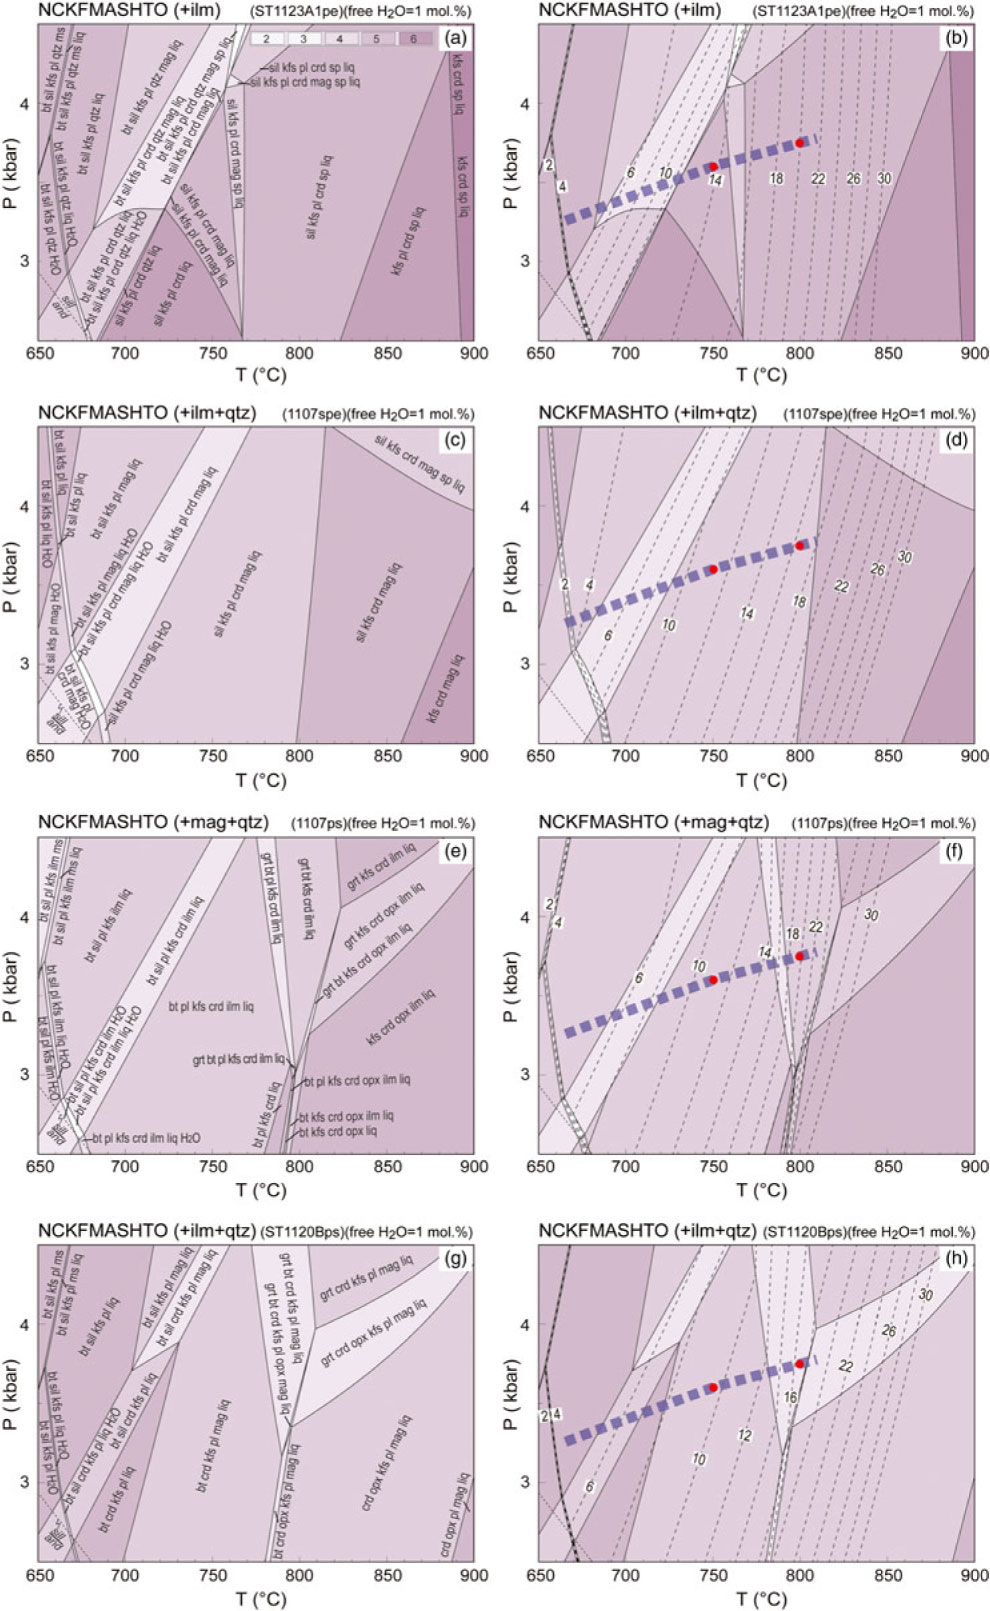
Fig. 11. P–T pseudosections for the representative metasedimentary samples with free H2O = 1 at solidus. Calculated molar mode contours in per cent for melt are shown with dashed lines. Variance of equilibria in stability fields is indicated in the legend in (a). (a, b) Pelitic sample ST1123A1. (c, d) Semi-pelitic sample 1107spe. (e, f) High-ferromagnesian psammitic sample 1107ps. (g, h) Psammitic sample ST1120Bps. See Table 1 for the compositions used for the calculations. The thick dashed lines on the figures represent a generalized field array (also White et al. Reference White, Powell and Clarke2003). The red dots designate the P–T conditions for calculating melt and residuum compositions (online Supplementary Material Tables S2 and S3).
The melt and residuum compositions were calculated for each of the bulk compositions at P–T conditions of 750 °C at 3.60 kbar and 800 °C at 3.75 kbar along the model local gradient, generally corresponding to the Zone 3 and Zone 4 conditions where melt loss could be expected to have occurred (White et al. Reference White, Powell and Clarke2003). The calculated melt and residuum compositions are listed in online Supplementary Material Tables S2 and S3. All melt was assumed to have been lost from the system at these conditions; therefore, the residual compositions reflect extreme values. The calculated compositions are basically similar to those calculated at the fixed pressure of 3 kbar. The slight variation in pressure does not change the model melt and residuum compositions markedly.
7. Discussion
As rocks in the lower to mid-crust contain small volumes of free water because of low porosity, fluid-absent melting is considered to be the dominant partial melting process (e.g. Thompson, Reference Thompson1982; Powell, Reference Powell, Atherton and Gribble1983; Clemens & Vielzeuf, Reference Clemens and Vielzeuf1987). However, the ingress of H2O into high-grade metamorphic rocks can promote additional melting (e.g. Brown, Reference Brown2010, Yakymchuk & Brown, Reference Yakymchuk and Brown2014) in circumstances involving shear zones (Johnson et al. Reference Johnson, Hudson and Droop2001; Slagstad et al. Reference Slagstad, Jamieson and Culshaw2005; Berger et al. Reference Berger, Burri, Alt-Epping and Engi2008; Genier et al. Reference Genier, Bussy, Epard and Baumgartner2008; Sawyer, Reference Sawyer2010; Reichardt & Weinberg, Reference Reichardt and Weinberg2012; Carvalho et al. Reference Carvalho, Sawyer and Janasi2016), extensional fracture systems (e.g. Ward et al. Reference Ward, Stevens and Kisters2008) and contact aureoles (Pattison & Harte, Reference Pattison and Harte1988; Johnson et al. Reference Johnson, Brown and Solar2003, Reference Johnson, White and Brown2011; Droop & Brodie, Reference Droop and Brodie2012). Melting rocks may also obtain additional water from those adjacent rocks that have solidi of higher temperature and are undergoing sub-solidus dehydration (e.g. White et al. Reference White, Pomroy and Powell2005). Even for circumstances involving very small quantities, such water ingress can dramatically influence a variety of physical and chemical properties of geological materials such as melting temperatures, melt production, melt chemistry, viscosity and density, phase equilibria and reaction kinetics (e.g. Weinberg & Hasalová, Reference Weinberg and Hasalová2015). For high-temperature contact metamorphic aureoles, heating to peak temperatures above the solidus can be very rapid, and water ingress could potentially be derived from the preservation of H2O liberated by hydrous mineral breakdown at sub-solidus (e.g. Droop & Brodie, Reference Droop and Brodie2012), the retention of H2O in metastable hydrate minerals to super-solidus conditions (e.g. Buick et al. Reference Buick, Stevens and Gibson2004; Johnson et al. Reference Johnson, White and Brown2011), the addition of H2O from interlayered rocks (e.g. Rigby et al. Reference Rigby, Droop and Bromiley2008) and the transient access to external H2O, such as derived from crystallization of the nearby pluton or from further away. With the possible ingress of water being considered, below we discuss the possible melt evolution and the effect of melt loss for the metasedimentary rocks in the regional contact aureole at Mt Stafford.
7.a. Melt fertility and the effect of minor free water
Metasedimentary rocks similar to those at Mt Stafford have the potential to produce large partial melt fractions, depending on details of the P–T conditions and compositions involved (Le Breton & Thompson, Reference Le Breton and Thompson1988; Puziewicz & Johannes, Reference Puziewicz and Johannes1988; Vielzeuf & Holloway, Reference Vielzeuf and Holloway1988; Holtz & Johannes, Reference Holtz and Johannes1991; Patiño-Douce & Johnson, Reference Patiño-Douce and Johnson1991; Skjerlie & Johnston, Reference Skjerlie and Johnston1992; Vielzeuf & Montel, Reference Vielzeuf and Montel1994; Stevens et al. Reference Stevens, Clemens and Droop1997). The modelling in this study shows that with low water contents (free H2O = 0) there are remarkable differences in the temperature conditions of key melting steps for the pelitic, semi-pelitic and high- and low-ferromagnesian psammitic compositions at Mt Stafford (Fig. 7a–e). In particular, there is a wide range of modelled melt modes, controlled by composition, between 700 and 800 °C. In this temperature range, the pelitic composition (ST1123A1) is predicted to have the highest proportion of melt, and the ferromagnesian-poor psammitic composition (ST1120Bps) predicted to have the lowest proportion, with the largest difference between them being ∼6 mol.% (Fig. 7e). Metapsammite of higher ferromagnesian content (1107ps) is predicted to have ∼2 mol.% more melt than metapsammite of lower ferromagnesian content (ST1120Bps) for the temperature range of common granulite-facies rocks (700–800 °C), and to have higher melt proportions than the modelled semi-pelite (1107spe) at T > 780 °C. These relationships indicate a dependence of melt productivity on whole-rock ferromagnesian content, in assemblages principally controlled by biotite mode (White et al. Reference White, Powell and Clarke2003). At water-undersaturated conditions, the whole-rock composition is the overriding factor controlling melt production (Patiño-Douce & Johnson, Reference Patiño-Douce and Johnson1991), but a minor increase in free water can significantly boost melt production (Fig. 7f, g). A small discrepancy in the volume of free water between otherwise similar layers thus has the potential to significantly expand the range of melt production (Fig. 7h). Along the given field array, the modelling shows the pelitic rocks at Mt Stafford develop much more melt than psammitic compositions, with a larger difference than that modelled with low water content (∼6 mol.% melt when free H2O = 0; Fig. 7e). This distinction has been attributed to the effect of minor elements such as boron, with tourmaline being more abundant in pelitic rocks (Greenfield et al. Reference Greenfield, Clarke, Bland and Clark1996, Reference Greenfield, Clarke and White1998; White et al. Reference White, Powell and Clarke2003). A higher boron content is predicted to displace the temperature of the solidi for the natural Mt Stafford pelitic rock to lower temperature conditions (Chorlton & Martin, Reference Chorlton and Martin1978; Pichavant, Reference Pichavant1981; Bénard et al. Reference Bénard, Moutou and Pichavant1985). However, experiments conducted by EM Spicer (unpub. Ph.D. thesis, Univ. Stellenbosch, 2011) on boron-bearing samples from Mt Stafford would appear to indicate that the presence of tourmaline does not markedly affect fluid-absent incongruent melting reactions. Though the possible impact of some other minor elements cannot be ruled out, variations in retained free water in the rocks undergoing partial melting may play an influential role in expanding the difference in melt production between pelitic and psammitic rocks.
If an interconnected network of grain edge melt channels is developed, melt loss can be expected to occur, especially when the rocks are compacted and/or deformed (e.g. McKenzie, Reference McKenzie1984; Rosenberg & Handy, Reference Rosenberg and Handy2005). Experiments and numerical modelling suggest low thresholds for melt extraction (Laporte et al. Reference Laporte, Rapa, Provost, Bouchez, Hutton and Stephens1997; Rabinowicz & Vigneresse, Reference Rabinowicz and Vigneresse2004). A maximum value for this critical threshold is suggested to be ∼7 vol.%, based on an analysis of deformation experiments on melt-bearing aggregates, corresponding to the point at which more than 80% of grain boundaries become melt bearing (referred to as the melt connectivity transition (MCT); Rosenberg & Handy, Reference Rosenberg and Handy2005; Yakymchuk & Brown, Reference Yakymchuk and Brown2014). Rocks with higher melt proportions may lose melt easily, especially when there is deformation. Obvious centimetre- to decimetre-scale veins may develop at the solid-to-liquid transition (SLT; Rosenberg & Handy, Reference Rosenberg and Handy2005).
Modelling shows that with low water content (free H2O = 0), the melt mode of pelitic sample ST1123A1 will reach 7 mol.% (∼7 vol.%; also Yakymchuk & Brown, Reference Yakymchuk and Brown2014) at ∼715 °C, followed by semi-pelitic sample 1107spe and high-ferromagnesian psammitic sample 1107ps at ∼750 °C (Fig. 7e). The psammitic sample ST1102B does not produce as much melt as 7 mol.% until ∼790 °C when orthopyroxene appears and biotite disappears (Fig. 7e). Addition of minor free water can remarkably facilitate melting just above the solidus. When there is ∼1 mol.% free water at the solidus, all of the rocks will produce as much as 7 mol.% melt from 680 °C to 700 °C (Fig. 7f). The increase in free water to 2 mol.% will decrease the temperature for 7 mol.% melt production by ∼20 °C (Fig. 7g). Minor additional free water will result in significant melting and likely melt loss at high-grade zones.
Along the Mt Stafford metamorphic field gradient, pelitic rocks were observed to have produced remarkably more melt than interlayered psammitic rocks in the field, with leucosome proportions of up to 20% or more in zones 3 and 4, forming extensive vein networks and locally diatexite (Vernon et al. Reference Vernon, Clarke, Collins, Ashworth and Brown1990; Greenfield et al. Reference Greenfield, Clarke, Bland and Clark1996, Reference Greenfield, Clarke and White1998). With low water content (free H2O = 0), the pelitic sample (ST1123A1) could produce melt of ∼10 mol.% at Zone 3 conditions (750 °C) and no more than ∼15 mol.% at Zone 4 conditions (800 °C), lower than the melt volume estimated from corresponding fertile pelitic layers in the field (Fig. 7a–e). A slight increase in free water (e.g. 1 mol.%) can raise the melt production of the pelitic rocks to the level of the field observation (Fig. 7a–f). However, the modelling shows that if there is any, the amount of additional H2O must be limited both at low- and high-grade zones, for example no more than 2 mol.%, otherwise voluminous melt will develop through the field thermal gradient, which is inconsistent with the delicate mineral textures observed in zones 1 and 2 and the melt modes estimated at zones 3 and 4 (Fig. 7a–g). As both the interlayered pelitic and psammitic rocks crossed solidi at the lower temperature side of the aureole, the psammitic layers in the high-grade zones 3 and 4 cannot be the source of free water for the neighbouring pelitic layers, as any H2O from the psammitic layers will enter local melt. Where psammitic rocks have total water contents comparable to that of adjacent pelitic rocks, for example in the situation of an external influx (e.g. Craven et al. Reference Craven, Daczko and Halpin2013), they will not be much less fertile than the pelitic rocks (Fig. 7i). The difference in melt produced between pelitic and psammitic layers rules out the possibility of any significant influx of externally derived H2O into the psammitic layers. The melting processes of rocks within a high-temperature contact aureole may differ remarkably with distance from the heat source (e.g. Kerrick, Reference Kerrick1991; Buick et al. Reference Buick, Stevens and Gibson2004). At the higher-grade zones of a contact aureole, rapid heating could also cause reaction overstepping and metastable persistence of hydrous minerals (e.g. muscovite) to above the solidus, and consequently raise the water contents and corresponding melt mode in the system (Buick et al. Reference Buick, Stevens and Gibson2004; Johnson et al. Reference Johnson, White and Brown2011). These mechanisms may have operated to some extent in the contact aureole at Mt Stafford, particularly for the high-grade zones close to the heat source, where rapid heating could more likely occur. The possible retention of higher water in pelite than in psammite above solidus is also consistent with the estimates of higher bound and pore water in pelite than psammite (e.g. Yardley, Reference Yardley2009).
Though the modelled melt production is evidently affected by variations in free water, mineral assemblages are not always sensitive to water activity at the P–T conditions similar to those at Mt Stafford (Figs 5, 10, 11). For pelitic ST1123A1 and semi-pelitic 1107spe compositions, the mineral stability boundaries below 710 °C are largely parallel to the X(H2O) axis for total H2O ranging from 2 to 8 mol.% (Fig. 5a, b). Above 710 °C, the predicted mineral equilibria are generally bound by lines with negative slopes from higher to lower temperatures. The topologies indicate that for large variations in initial water content, for example from 2 to 8 mol.%, there is relatively little difference in the mineral assemblages developed along heating paths (vertical lines) for systems with different initial water contents. Many mineral assemblages occur over a wide range of water contents, for instance the kfs+sill+crd+qtz+liq+mag+ilm in the quinivariant field of 1107spe can have water contents ranging from ∼1 to ∼14 mol.% (Fig. 5b). For the ferromagnesian-rich psammitic rocks 1107ps and ST1120B, the occurrence of orthopyroxene is always accompanied by the disappearance of biotite at around 800 °C, regardless of any appreciable variation in initial water content (Fig. 5c, d). Like the pelite and semi-pelite, the major mineral assemblages of the psammitic rocks are not markedly affected by water activity. The main difference resultant upon increasing initial water will typically be the increased melt volume, rather than the nature of the paragenesis. Consequently, neither the melting reaction nor the mineral paragenesis alone is a reliable indicator of the volume of added H2O.
7.b. Melt composition at low-pressure conditions
The composition of melt produced by fluid-absent or fluid-present partial melting in deep crustal settings can be examined by petrological melting experiments (Skjerlie et al. Reference Skjerlie, Patiño-Douce and Johnston1993; Patiño-Douce, Reference Patiño-Douce1996; Patiño-Douce & Harris, Reference Patiño-Douce and Harris1998; Koester et al. Reference Koester, Pawley, Fernandes, Porcher and Soiani2002) or forward modelling (e.g. Grant, Reference Grant2009; White et al. Reference White, Stevens and Johnson2011). There are important consistencies in basic compositional trends and phase topologies between the modelling and experimental results, though there remain distinctions between the two approaches (White et al. Reference White, Stevens and Johnson2011). Melt compositions derived from melt inclusions, experiments and thermodynamic modelling can be used as benchmarks to discuss the potential processes involved in the compositional evolution of leucosome and associated migmatite (e.g. Brown et al. Reference Brown, Yakymchuk, Brown, Fanning, Korhonen, Piccoli and Siddoway2016; Acosta-Vigil et al. Reference Acosta-Vigil, London, Morgan, Cesare, Buick, Hermann and Bartoli2017). Melt compositions calculated for the representative rock samples at Mt Stafford indicate strong dependencies on bulk composition and temperature rather than on water activity. With low water content (free H2O = 0), the melts produced by the four metasedimentary samples are granitic (Fig. 12), being enriched in SiO2, Al2O3 and K2O contents (Table 2; Figs 7, 12, 13). Melt in pelitic sample ST1123A1 and semi-pelitic sample 1107spe has a low ferromagnesian content that subtly increases from low to high temperatures, in contrast to a marked step in ferromagnesian content for psammitic samples ST1120B and 1107ps (Figs 7, 14). Compared with the results of relevant experiments conducted at higher pressures, the model melt compositions are enriched in K2O and depleted in CaO (Fig. 12). The silica and soda contents of the melt decrease with temperature increases for all samples, whereas the ferromagnesian and potash contents increase. The calcium content increases with grade until plagioclase is consumed. For silica-rich rocks, the silica component in the melt does not decrease remarkably with increasing temperature, but for low-quartz pelitic samples (ST1123A1), the silica content of the melt drops markedly at high temperature (Table 2; Fig. 13). These variations demonstrate the dependence of the melt compositions on their bulk rock composition and reaction history.

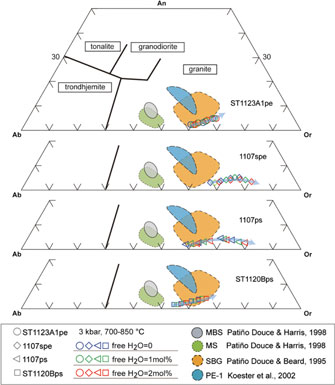
Fig. 12. Normative albite–anorthite–orthoclase (Ab–An–Or) contents of melt calculated at 3 kbar. Classification of silicic melts after Barker (Reference Barker and Barker1979). The experimental glass compositions are included for comparison (Patiño-Douce & Beard, Reference Patiño-Douce and Beard1995; Patiño-Douce & Harris, Reference Patiño-Douce and Harris1998; Koester et al. Reference Koester, Pawley, Fernandes, Porcher and Soiani2002). The melt compositions for different samples are represented by hollow circles (ST1123A1), diamonds (1107spe), triangles (1107ps) and squares (ST1120B), and the colours (blue, green and red) of the symbols are used for designating the water contents. The arrows show the direction of temperature increase.
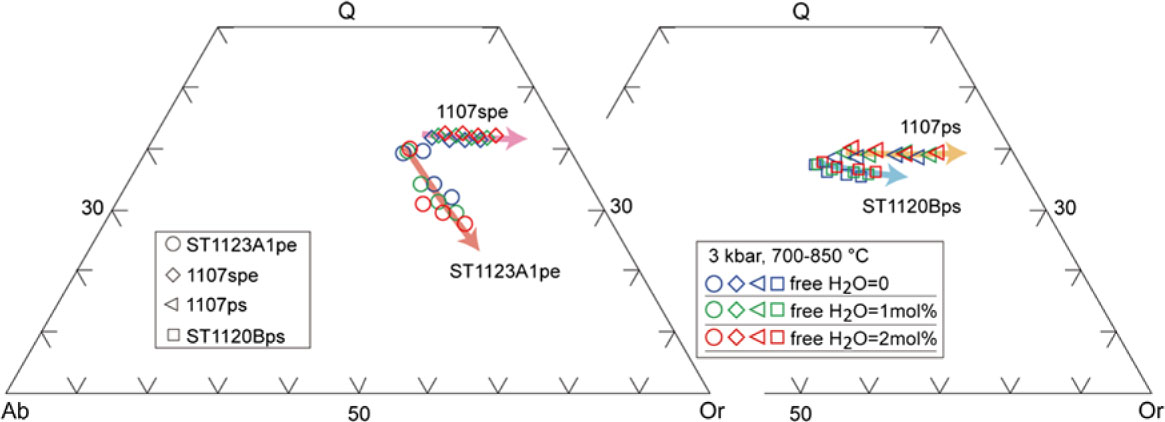
Fig. 13. CIPW normative proportions of quartz (Q), albite (Ab) and orthoclase (Or) for melt compositions at 3 kbar. The melt compositions for different samples are represented by hollow circles (ST1123A1), diamonds (1107spe), triangles (1107ps) and squares (ST1120B), and the colours (blue, green and red) of the symbols are used for designating the water contents. The arrows show the direction of temperature increase.
The addition of free water changes the melt composition of the metasedimentary rocks in several ways. In general, any increase in water content will generate melt of higher potash content for all samples, but lower soda content for all but the pelitic sample ST1123A1. This result is different from the outcomes of higher pressure experiments conducted using pelitic muscovite schist (MS, Patiño-Douce & Harris, Reference Patiño-Douce and Harris1998) and metagreywacke (SBG, Patiño-Douce, Reference Patiño-Douce1996). In those experiments, the addition of water generated melt comparatively enriched in soda and depleted in potash at temperatures lower than the dehydration solidus (Patiño-Douce & McCarthy, Reference Patiño-Douce, McCarthy, Hacker and Liou1998). The opposing trends can be attributed to differences in bulk composition and pressure at which the experiments were run, with and without free water. The ferromagnesian contents of the model melt are not obviously dependent on the volume of free water (Table 2; Fig. 8). Any addition of free water displaces the upper limit of plagioclase-bearing equilibria to a lower temperature, with the consequence that melt produced at a higher temperature than plagioclase stability has progressively less calcium. An increase in free water will result in a subtly higher calcium content when plagioclase is present, and the reverse when plagioclase has been consumed (Fig. 8). At water-rich conditions, the silica content of the melt modelled for pelitic sample ST1123A1 falls as grade increases, particularly at higher temperature conditions, in contrast to a subtle increase with grade for the semi-pelitic and psammitic samples (Fig. 8). The alumina content of the melt modelled at higher temperature conditions increased with the addition of free water for the pelitic sample ST1123A1, but subtly decreased for all other samples. However, in general, a minor increase in free water will have a relatively limited effect on the melt compositions modelled for the samples.
7.c. Effect of melt loss on residual composition
The greenschist- to granulite-facies transition at Mt Stafford is focused over a comparatively narrow ∼5 km distance, and exposes an unusual series of migmatites which developed progressively greater proportions of melt at higher grades. High proportions of melt were most likely present in the highest-grade zones, with schlieren migmatite occurring as a transitional unit between bedded migmatite and metapelite-sourced diatexite (Greenfield et al. Reference Greenfield, Clarke, Bland and Clark1996). Modelling completed in this study predicts that the metasedimentary rocks at Mt Stafford would produce no less than 15% melt at ∼800 °C at ∼3 kbar (Zone 4). Migmatite with such high melt proportions will likely undergo melt loss and thus change the composition of the parent rock. To evaluate the effect of melt loss from the Mt Stafford metasedimentary rocks, residuum compositions were calculated considering different water contents (at 3 kbar) for the pelitic, semi-pelitic and high- and low-ferromagnesian psammitic samples (Table 3).
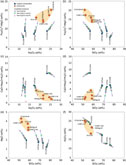
As mass balance is preserved at all scales during melting and melt segregation in the model system, a ternary K–(Na + Ca)–(Fe* + Mg + Ti) plot (Fig. 14) can be used to track melt-residuum evolution (Solar & Brown, Reference Solar and Brown2001). In such a model, the main residuum minerals involving cordierite, orthopyroxene, garnet and biotite lie close to the (Fe* + Mg + Ti) apex or along the (Fe* + Mg + Ti)–K edge of the ternary plot. The (Na + Ca)–K edge of the ternary diagram represents a plagioclase and K-feldspar join, along which melts produced from metasedimentary rocks can be expected to fall. With increasing temperature, the residuum compositions of the samples evolve progressively closer to the (Fe* + Mg + Ti) apex. The trends are enhanced by the addition of minor free water. Residuum compositions have a strong dependence on the starting rock compositions. At the same P–T condition, rocks with high Fe* –Mg–Ti ratios (e.g. 1107ps) are predicted to evolve residuum closer to the (Fe* + Mg + Ti) apex. In the plot, the psammitic sample ST1120B and pelitic sample ST1123A1 have similar Fe*–Mg–Ti ratios, but any addition of free water will shift the residuum of the sample ST1120B towards the (Fe* + Mg + Ti) apex more dramatically than for sample ST1123A1. These trends reflect changes in the ratio of (Fe* + Mg + Ti) to alkali content rather than the ferromagnesian content of the residuum. The residuum compositions predicted for sample ST1120B lie closer to the (Fe* + Mg + Ti) apex than those of sample ST1123A1 and have lower ferromagnesian contents (Figs 9, 14). When contrasted with their starting bulk compositions, the ferromagnesian contents (Fe2O3T + MgO) of the model residuum increase with increasing temperature, whereas the total alkali contents (CaO + Na2O + K2O) decrease. Any added free water will exaggerate the enrichment of the ferromagnesian content and depletion of the alkali content. The alumina content of the pelitic and semi-pelitic residuum increases with temperature, but subtly decreases for the psammitic sample ST1120B (Fig. 9a, c, f). The potash contents of the residuum compositions of the pelitic sample (ST1123A1; with high initial potassium content) is predicted to increase subtly with melt loss, in contrast to the decrease in the potash contents of residua for semi-pelitic and psammitic compositions (Table 3).
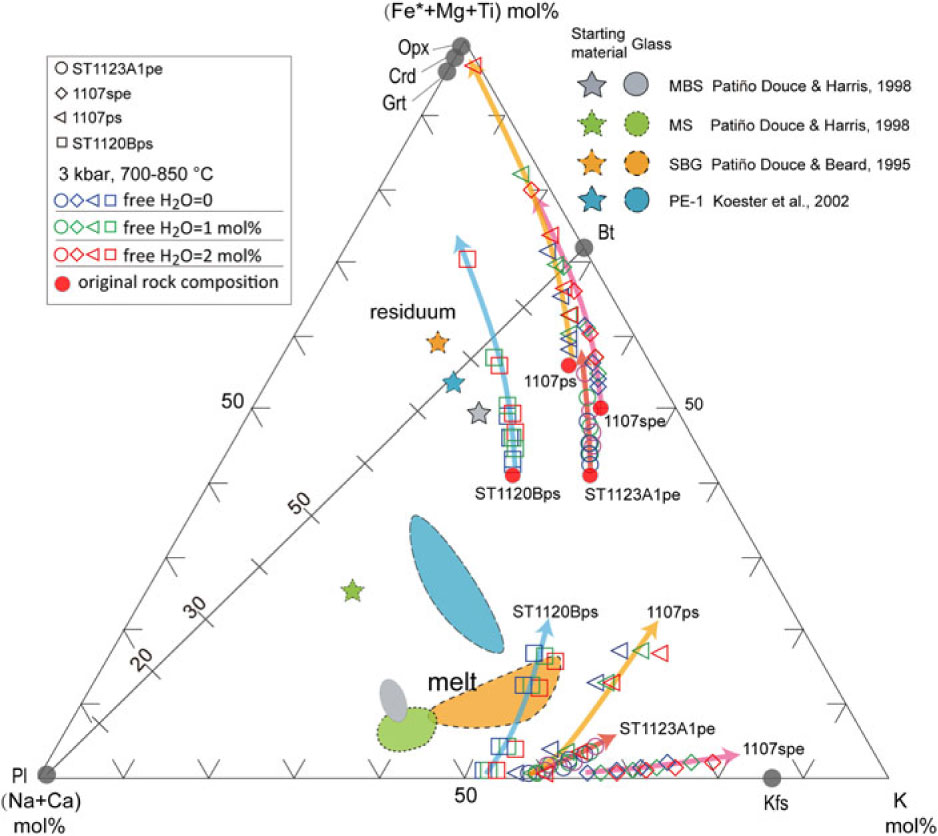
Fig. 14. Ternary (Na+Ca)–(Fe*+Mg+Ti)–K plot (after Solar & Brown, Reference Solar and Brown2001; Brown et al. Reference Brown, Yakymchuk, Brown, Fanning, Korhonen, Piccoli and Siddoway2016) showing the melt and residuum evolution at varying water conditions. The experimental glass compositions were included for comparison (Patiño-Douce & Beard, Reference Patiño-Douce and Beard1995; Patiño-Douce & Harris, Reference Patiño-Douce and Harris1998; Koester et al. Reference Koester, Pawley, Fernandes, Porcher and Soiani2002). The melt and residuum compositions for different samples are represented by hollow circles (ST1123A1), diamonds (1107spe), triangles (1107ps) and squares (ST1120B), and the colours (blue, green and red) of the symbols are used for designating the water contents. The arrows show the direction of temperature increase. The red dots are the original rock compositions for modelling.
A comparison between the modelled residuum compositions and the natural melanosome/mesosome illustrates that melt loss alone from the normal semi- or pelitic compositions as used for modelling cannot directly result in the extremely high ferromagnesian and low alkali compositions observed in the natural rocks. Even if free water content is increased to 2 mol.% – higher than could be expected for the field setting – the predicted residuum compositions do not explain the unusual ferromagnesian-rich, alkali-poor melanosome/mesosome samples (Table 3; Fig. 9). The unusual melanosome/mesosome samples may have originally had relatively high ferromagnesian and low alkali compositions in their protolith, or some other processes like chemical diffusion or metamorphic differentiation may play a role in changing the composition. In general, granulite-facies rocks are enriched in iron, magnesium and titanium and depleted in silica, soda and potash content (e.g. Redler et al. Reference Redler, White and Johnson2013). However, the origin of granulite with extremely high ferromagnesian and low alkali contents cannot always be completely attributed to melt loss. Primary composition has a basic control on the residual granulite composition. Systematic chemical analysis of the rocks from low (sub-solidus) to high grade (granulite facies) and modelling of compositional variation related to melt loss could place crucial constraints on the protolith composition of granulites that occurred in a progressive metamorphic sequence comparable with those exposed at Mt Stafford.
8. Conclusions
The phase equilibrium modelling of pelitic, semi-pelitic and high- and low-ferromagnesian psammitic rocks at Mt Stafford quantitatively illustrates the dependence of the melt productivity and composition on rock composition and water content. Subtle variations in the proportion of free water content can result in appreciable changes in melt mode. At high-temperature zones close to the heat source, the pelitic and psammitic metasedimentary rocks possibly underwent rapid heating and retained various amounts of water to solidus. The potential discrepancy in water retained to super-solidus conditions may have contributed to the different melting histories of pelitic and psammitic rocks in the field. Melt composition depends strongly on protolith composition and, for a given protolith, added water does not significantly change melt composition. The modelling shows that by melt loss alone, normal sedimentary rocks can hardly produce the extremely high ferromagnesian and low alkali compositions of the melanosome/mesosome observed in the field. The special compositions of some melanosome/mesosome may be inherited mainly from their protoliths. The topologies of phase relationships in the P–T space, in the range of compositions investigated, are not very sensitive to composition changes. The major mineral assemblages of the metasedimentary rocks are not markedly affected by water activity. The major difference resulting from increasing initial water will basically be melt production, rather than the nature of the paragenesis. Consequently, neither the melting reaction nor the mineral paragenesis alone is a reliable indicator of the original water content of the rocks.
Supplementary material
To view supplementary material for this article, please visit https://doi.org/10.1017/S001675681800078X.
Acknowledgements
The programme was financially supported by ARC Discovery Project funding (DP160103449) NRD, the University of Sydney and Macquarie University, the National Natural Science Foundation of China (41672062, 41202047, 41502059), and the Fundamental Research Funds of CAGS(JYYWF201819). WW was supported by a University of Sydney International Postgraduate Award. This study used instrumentation funded by ARC LIEF and DEST Systemic Infrastructure Grants, Macquarie University and Industry. This is contribution XXX from the ARC Centre of Excellence for Core to Crust Fluid Systems (www.ccfs.mq.edu.au) and XXX from the GEMOC Key Centre (www.gemoc.mq.edu.au).