


1. Introduction
The Upper Cretaceous Kanguk Formation within the Sverdrup Basin, Arctic Canada (Fig. 1), contains an important record of Late Cretaceous volcanism within the Arctic realm, which can provide insights into the opening of the Arctic Ocean and the tempo of volcanism associated with the late stages of the High Arctic Large Igneous Province (HALIP; e.g. Davis et al. Reference Davis, Schröder-Adams, Galloway, Herrle and Pugh2016). The record is manifest as numerous diagenetically altered volcanic ash layers (bentonites), which have been reported from several localities within the basin (e.g. Pugh et al. Reference Pugh, Schröder-Adams, Carter, Herrle, Galloway, Haggart, Andrews and Hatsukano2014; Schröder-Adams et al. Reference Schröder-Adams, Herrle, Embry, Haggart, Galloway, Pugh and Harwood2014; Davis et al. Reference Davis, Schröder-Adams, Galloway, Herrle and Pugh2016; Davies et al. Reference Davies, Schröder-Adams, Herrle, Hülse, Schneider, Quesnel and Harwood2018). The bentonites are dominated by clay minerals, but also contain trace amounts of volcanic phenocrysts, some of which are amenable to isotopic dating. For example, zircon phenocrysts separated from several Kanguk Formation bentonites sampled from two sections towards the basin centre have been dated recently using the U–Pb chemical abrasion isotope dilution thermal ionization mass spectrometry (CA-ID-TIMS) method (Davis et al. Reference Davis, Schröder-Adams, Galloway, Herrle and Pugh2016; Fig. 1). These yielded precise late Cenomanian to early Campanian ages, constraining the eruption ages of the bentonites and the stratigraphic age range of the enveloping Kanguk Formation.
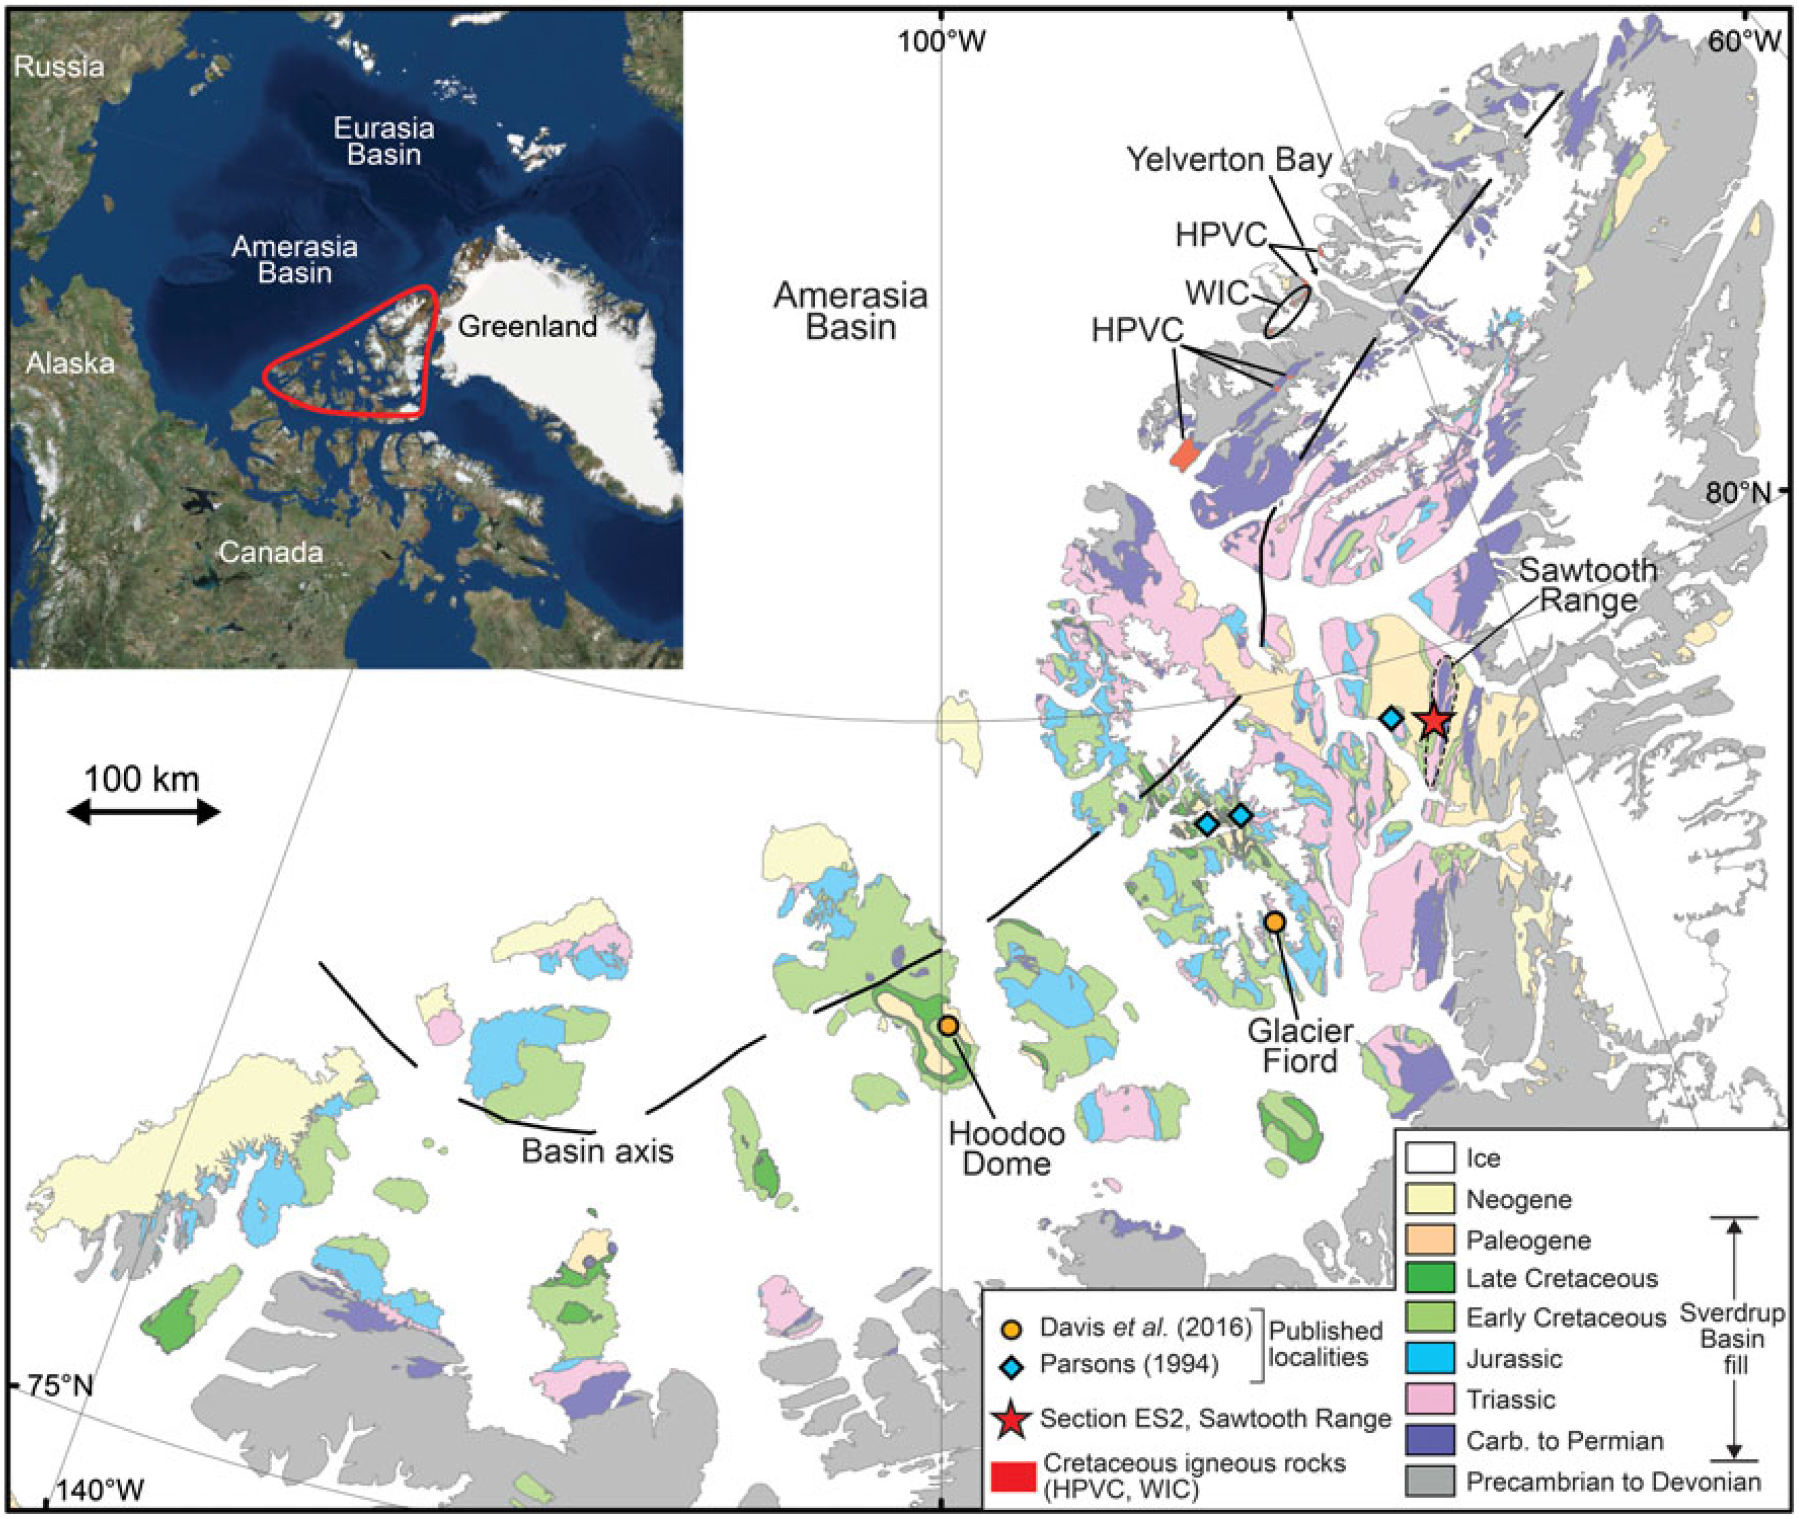
Fig. 1. Geological map of the Sverdrup Basin showing the location of section ES2 within the Sawtooth Range, Ellesmere Island. The map is simplified from Harrison et al. (Reference Harrison, St-Onge, Petrov, Strelnikov, Lopatin, Wilson, Tella, Paul, Lynds, Shokalsky, Hults, Bergman, Jepsen and Solli2011). Basin axis is redrawn from Embry & Beauchamp (Reference Embry, Beauchamp and Miall2008). HPVC – Hansen Point Volcanic Complex; WIC – Wootton Intrusive Complex. The inset map shows the approximate area of the Arctic covered by the main figure.
Whilst the age range of the Kanguk Formation bentonites is comparatively well known, the location of their source volcanoes is more poorly constrained. This is in part because fine-grained tephra from explosive volcanic eruptions can be carried by wind over considerable distances. The extensively altered mineralogy of the bentonites provides little insight into their original volcanic composition, although whole-rock geochemical analysis has been demonstrated in studies of bentonites elsewhere to be more informative (e.g. Huff et al. Reference Huff, Merriman, Morgan and Roberts1993; Parsons, Reference Parsons1994; Christidis et al. Reference Christidis, Scott and Marcopoulos1995; Spears et al. Reference Spears, Kanaris-Sotiriou, Riley and Krause1999). The major elements, which are routinely used to classify fresh or slightly altered volcanic rocks, are of limited use when classifying extensively altered volcanic rocks because several elements, including K and Na, are known to be mobile during weathering and diagenesis (Winchester & Floyd, Reference Winchester and Floyd1977; Floyd & Winchester, Reference Floyd and Winchester1978; Zielinski, Reference Zielinski1982; Christidis, Reference Christidis1998). Instead, the analysis of altered volcanic rocks focuses on trace elements including Ti, Zr, Nb, Hf and Ta, which are generally considered to be immobile during most upper crustal processes and are also indicators of petrogenetic processes (Floyd & Winchester, Reference Floyd and Winchester1978; Huff et al. Reference Huff, Merriman, Morgan and Roberts1993; Kiipli et al. Reference Kiipli, Hints, Kallaste, Verš and Voolma2017). Presently, however, there is a dearth of published geochemical data from the Kanguk Formation bentonites. Parsons (Reference Parsons1994) investigated the geochemistry and petrogenesis of 12 Kanguk Formation bentonites from three outcrop sections (Fig. 1), inferring a volcanic source area along the Sverdrup Rim, on northern Ellesmere Island and/or on northern Greenland. This dataset, however, includes only a small proportion of the total number of bentonites within the formation.
In addition to elucidating Late Cretaceous tectonic and magmatic events within the Arctic region, identifying the source(s) of bentonites within the Kanguk Formation has the potential to help constrain the regional geographic and stratigraphic distribution of volcanic ash. This may aid in the identification of coeval bentonites beyond the Sverdrup Basin. Through geochemical fingerprinting and isotopic dating techniques, bentonites can provide a robust basis for regional stratigraphic correlation (e.g. Inanli et al. Reference Inanli, Huff and Bergström2009; Kiipli et al. Reference Kiipli, Einasto, Kallaste, Nestor, Perens and Siir2011, Reference Kiipli, Kallaste, Kiipli and Radzevičius2013, Reference Kiipli, Dahlqvist, Kallaste, Kiipli and Nõlvak2015; Sell et al. Reference Sell, Samson, Mitchell, McLaughlin, Koenig and Leslie2015). Ultimately, this may lead to more precise regional stratigraphic correlations along the Arctic Alaska–Canada continental margin and offshore within the Amerasia Basin.
To constrain better the volcanic sources of the Kanguk Formation bentonites, whole-rock geochemical analyses were performed on 11 bentonites sampled from an outcrop section in the Sawtooth Range, Fosheim Peninsula, Ellesmere Island (Fig. 1). U–Pb zircon secondary ion mass spectrometry (SIMS) dating of five of these bentonites was also undertaken to provide absolute age constraints on the sampled section and the bentonites investigated.
2. Geological setting
2.a. Sverdrup Basin
The Sverdrup Basin covers an area of ~300,000 km2 and contains up to 13 km of Carboniferous to Eocene sedimentary strata (Embry & Beauchamp, Reference Embry, Beauchamp and Miall2008; Fig. 1). It developed as a rift basin on Siluro-Devonian rocks of the Franklinian Mobile Belt (Hadlari et al. Reference Hadlari, Midwinter, Galloway, Dewing and Durbano2016). The Amerasia Basin borders the basin to the north (Fig. 1). The eastern parts of the Sverdrup Basin, including Ellesmere and Axel Heiberg islands, were deformed during Palaeogene times as part of the Eurekan Orogeny (Piepjohn et al. Reference Piepjohn, Von Gosen and Tessensohn2016).
The stratigraphy of the Sverdrup Basin was divided into eight major depositional phases by Embry & Beauchamp (Reference Embry, Beauchamp and Miall2008). These are characterized by distinct tectonic and depositional regimes, and are bounded by unconformities (Fig. 2). The three youngest phases (six to eight) are relevant to the present study and are summarized below:
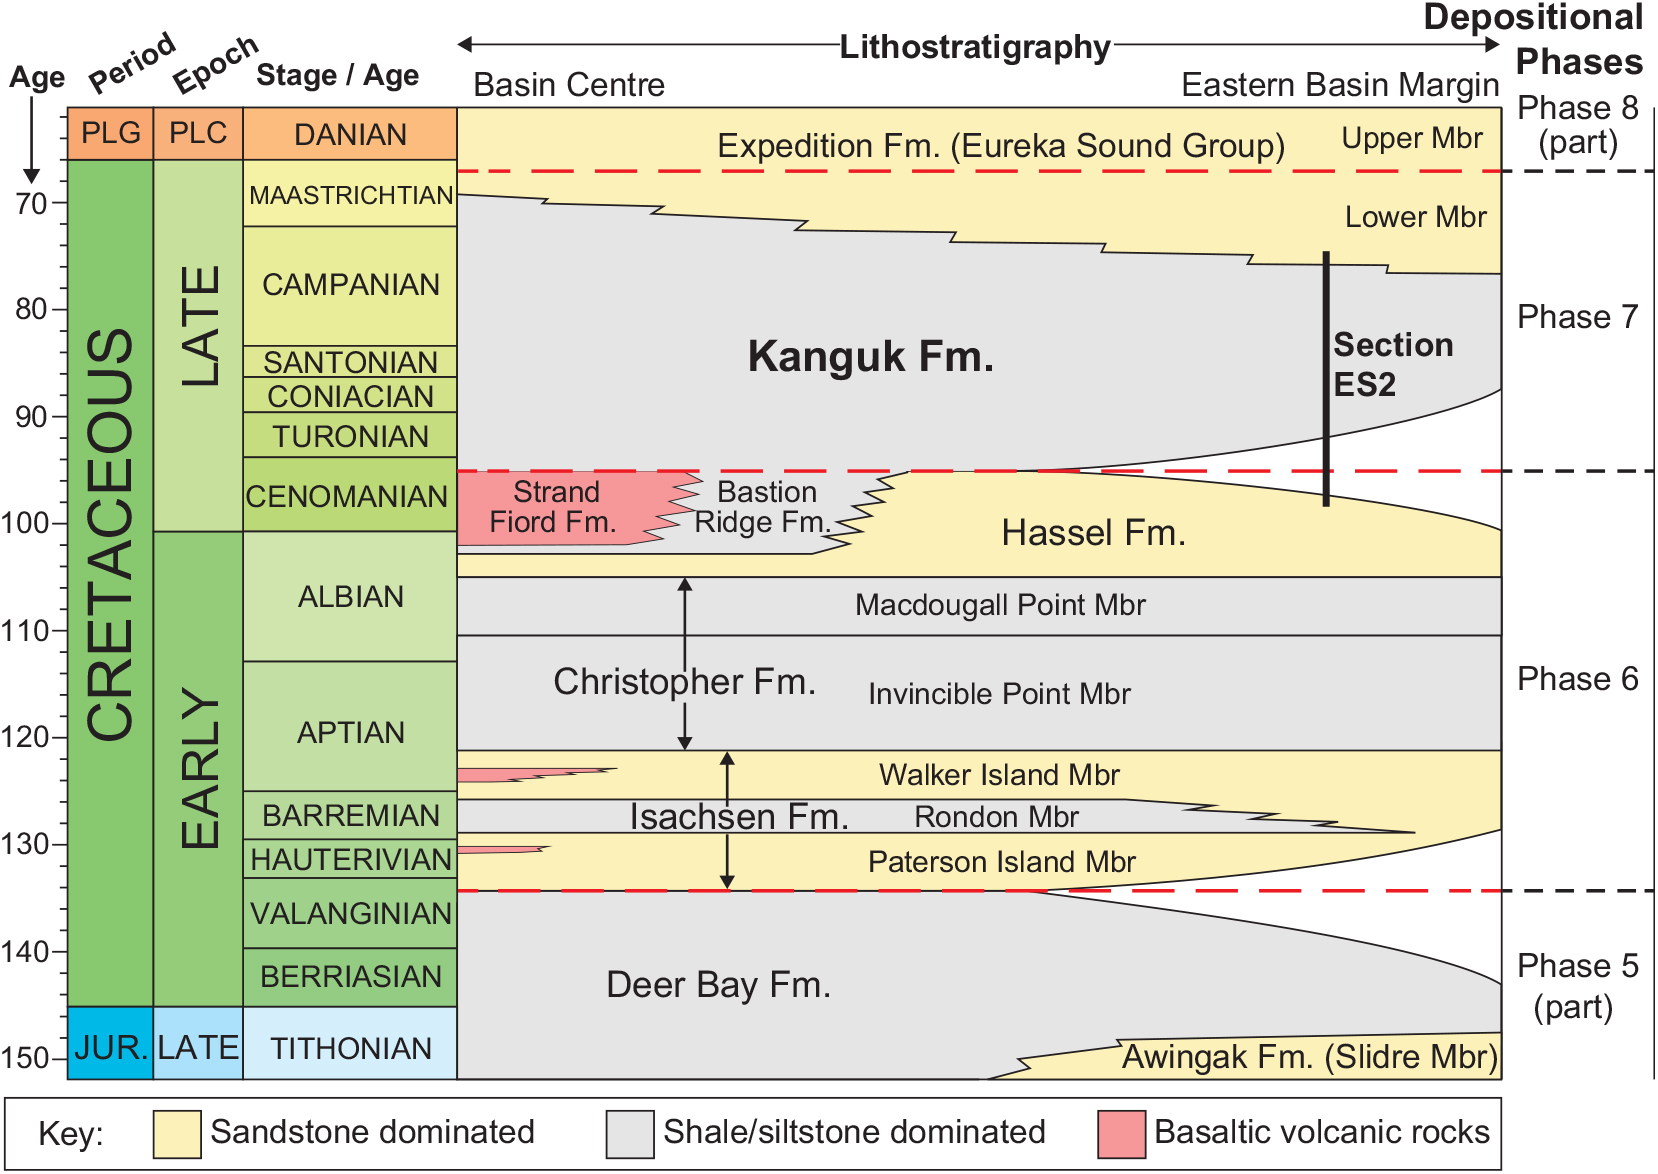
Fig. 2. Cretaceous lithostratigraphic framework of the Sverdrup Basin (after Embry & Osadetz, Reference Embry and Osadetz1988; Embry, Reference Embry and Trettin1991). The top of the Kanguk Formation is drawn according to Ricketts (Reference Ricketts1991). Lithostratigraphic unit abbreviations: Fm. – formation; Mbr – member. The timescale shown follows Cohen et al. (Reference Cohen, Finney, Gibbard and Fan2013). The red dashed lines represent unconformities or paraconformities. Depositional phases are drawn after Embry & Beauchamp (Reference Embry, Beauchamp and Miall2008). PLG – Paleogene; PLC – Paleocene.
Phase six commenced in late Valanginian times with a marked increase in subsidence and sediment supply rates, linked to rifting and extension. Thick, coarse-grained fluvio-deltaic siliciclastic sediments, sourced from the south and east, were deposited across a large area of the basin (Isachsen Formation; Fig. 2; Embry, Reference Embry and Trettin1991; Tullius et al. Reference Tullius, Leier, Galloway, Embry and Pedersen2014). Towards the northeast of the basin, on northern Ellesmere and Axel Heiberg islands, basaltic flows and pyroclastic rocks occur interbedded with these sediments (Fig. 2; Embry & Osadetz, Reference Embry and Osadetz1988; Embry, Reference Embry and Trettin1991). These volcanic deposits thicken northwards (Embry, Reference Embry and Trettin1991). A major transgression in middle Aptian times led to the deposition of marine mudstones and siltstones assigned to the Christopher Formation. Towards the end of phase six (late Albian to Cenomanian) fluvio-deltaic to shallow shelfal sands of the Hassel Formation prograded into the basin. In the basin centre, intense volcanism produced thick, mainly subaerial, tholeiitic basaltic flows that characterize the Strand Fiord Formation (Ricketts et al. Reference Ricketts, Osadetz and Embry1985; Estrada & Henjes-Kunst, Reference Estrada and Henjes-Kunst2004). These have an inferred late Albian to Cenomanian age (Embry, Reference Embry and Trettin1991) based on several whole-rock 40Ar–39Ar dates of 103–95 Ma (Tarduno et al. Reference Tarduno, Brinkman, Renne, Cottrell, Scher and Castillo1998; Villeneuve & Williamson, Reference Villeneuve, Williamson, Scott and Thurston2006; Estrada & Henjes-Kunst, Reference Estrada and Henjes-Kunst2013) and a late Albian palynomorph assemblage recovered from intercalated siliciclastic rocks (Núñez-Betelu et al. Reference Núñez-Betelu, MacRae, Hills, Muecke, Thurston and Fujita1994). Lava flows thicken towards the north and have been inferred to represent the cratonward extension of the Alpha Ridge in the Amerasia Basin (Ricketts et al. Reference Ricketts, Osadetz and Embry1985) and to form part of the HALIP (e.g. Saumur et al. Reference Saumur, Dewing and Williamson2016; Dostal & MacRae, Reference Dostal and MacRae2018; Kingsbury et al. Reference Kingsbury, Kamo, Ernst, Söderlund and Cousens2018).
Phase seven started in late Cenomanian times and was characterized by tectonic quiescence and slow subsidence. Its onset correlates with a major transgression leading to the deposition of the shales and silts of the Kanguk Formation across a large area of the basin (Embry, Reference Embry and Trettin1991; Schröder-Adams et al. Reference Schröder-Adams, Herrle, Embry, Haggart, Galloway, Pugh and Harwood2014). Towards the end of Late Cretaceous times, sediment input rates increased and shoreline to shallow marine sandstones prograded into the basin from the east (Lower Member of the Expedition Formation; Fig. 2). Widespread uplift marked the end of this phase.
Phase eight marked a transition from thermally dominated subsidence to compressional loading caused by convergence between Greenland and Arctic Canada (Eurekan Orogeny). Eastern parts of the basin underwent rapid subsidence and were loci for the deposition of fluvio-deltaic sediments (Upper Member of the Expedition Formation to Iceberg Bay Formation; Ricketts, Reference Ricketts1986, Reference Ricketts1991, Reference Ricketts1994). These are overlain by lower to middle Eocene syn-tectonic conglomerates deposited in more restricted intermontane basins (Buchanan Lake Formation; Ricketts, Reference Ricketts1994). During late Eocene times, Eurekan deformation climaxed, the entire basin was uplifted and deposition within the Sverdrup Basin ended.
2.b. Kanguk Formation
The Kanguk Formation is a mudstone-dominated marine unit containing minor interbedded siltstone, sandstone and bentonite horizons. In the type section, located on Kanguk Peninsula, western Axel Heiberg Island, the base of the Kanguk Formation is defined by a sharp transition from the underlying volcanic rocks of the Strand Fiord Formation (Fig. 2; Souther, Reference Souther and Fortier1963; Tozer, Reference Tozer and Fortier1963). Beyond Axel Heiberg Island, however, the Kanguk Formation usually overlies fluvio-deltaic to marine shelf sandstones of the Hassel Formation with a sharp contact, representing an unconformity or paraconformity (Fig. 2). In the type section, the top of the Kanguk Formation was originally placed beneath the first major sandstone bed. Inconsistent application of this definition prompted Ricketts (Reference Ricketts1991) to revise the top of the Kanguk Formation to the level where sandstone beds make up 40 % of the section. In several areas of the basin, the Kanguk Formation has been subdivided into between two and five informal members (e.g. Fricker, Reference Fricker1963, p. 119; Balkwill & Hopkins, Reference Balkwill and Hopkins1976; Davies et al. Reference Davies, Schröder-Adams, Herrle, Hülse, Schneider, Quesnel and Harwood2018). In the studied section, Davies et al. (Reference Davies, Schröder-Adams, Herrle, Hülse, Schneider, Quesnel and Harwood2018) subdivided the Kanguk Formation into two informal members: a lower member dominated by dark grey shales (with minor silty intervals; 84 m thick) and an upper member comprising rusty-brown to dark grey shales and mudstones with concretions (~65 m exposed, up to 25 m covered; Fig. 3).
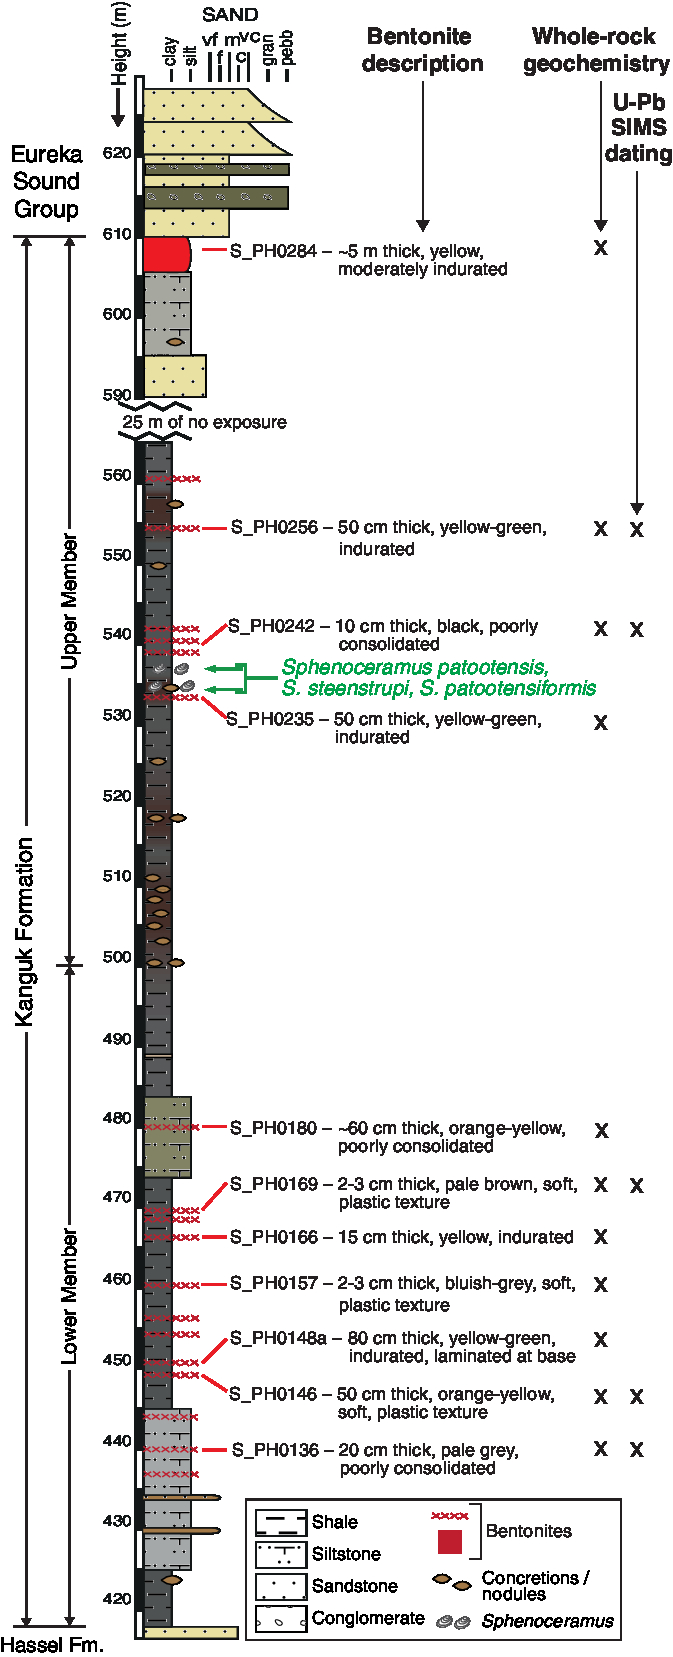
Fig. 3. Lithological log showing the section heights of bentonite samples and analyses undertaken. Bentonite grain size is not drawn to scale. Colour in the sedimentary column approximately reflects rock colour. This is apart from the bentonites whose colours are described in the bentonite descriptions. Note there is a gap of 25 m in the section at 565–590 m. Informal members of the Kanguk Formation are drawn following Davies et al. (Reference Davies, Schröder-Adams, Herrle, Hülse, Schneider, Quesnel and Harwood2018).
Beyond the Sverdrup Basin, the Kanguk Formation has been correlated with the Boundary Creek and Smoking Hills formations in the Mackenzie Delta area, and the Canning Formation, Hue Shale and Seabee Formation in Northern Alaska (Embry & Dixon, Reference Embry and Dixon1990; Pugh et al. Reference Pugh, Schröder-Adams, Carter, Herrle, Galloway, Haggart, Andrews and Hatsukano2014). The Kanguk Formation has also been identified as a potential, albeit thermally immature, regional source rock for hydrocarbons in the Sverdrup Basin (Houseknecht & Bird, Reference Houseknecht, Bird, Spencer, Embry, Gautier, Stoupakova and Sørensen2011).
The thickness of the Kanguk Formation ranges from less than 150 m at the eastern basin margin to more than 750 m at the basin centre (Embry, Reference Embry and Trettin1991). In the type section, a total thickness of ~250 m was reported by Souther (Reference Souther and Fortier1963). In this area, the lower portion of the Kanguk Formation typically consists of black, bituminous, papery shales, interpreted to represent starved, offshore shelf deposits (Embry, Reference Embry and Trettin1991). In general, the shales of the formation become siltier, lighter in colour and less bituminous up stratigraphy; the upper portion of the formation consists mainly of pro-deltaic deposits (Embry, Reference Embry and Trettin1991). In more marginal sections, like the one investigated as part of this study, coarser-grained units (up to medium-grained sand) are observed in the lower part of the formation and are interpreted to represent shallow marine shelf deposits (Embry, Reference Embry and Trettin1991).
The Kanguk Formation has been the focus of intense biostratigraphic investigation, studying various fossil groups including palynomorphs (e.g. Núñez-Betelu et al. Reference Núñez-Betelu, MacRae, Hills, Muecke, Thurston and Fujita1994; Nunez-Betelu & Hills, Reference Nunez-Betelu and Hills1994; Lenniger et al. Reference Lenniger, Nøhr-Hansen, Hills and Bjerrum2014), diatoms (Tapia & Harwood, Reference Tapia and Harwood2002; Witkowski et al. Reference Witkowski, Harwood and Chin2011), radiolarians (Pugh et al. Reference Pugh, Schröder-Adams, Carter, Herrle, Galloway, Haggart, Andrews and Hatsukano2014), foraminifers (Schröder-Adams et al. Reference Schröder-Adams, Herrle, Embry, Haggart, Galloway, Pugh and Harwood2014), ammonites (e.g. Jeletzky, Reference Jeletzky1970) and vertebrates (Tarduno et al. Reference Tarduno, Brinkman, Renne, Cottrell, Scher and Castillo1998; Vavrek et al. Reference Vavrek, Hills and Currie2014; Bono et al. Reference Bono, Clarke, Tarduno and Brinkman2016). Collectively, these suggest a late Cenomanian to Maastrichtian age range for the Kanguk Formation at the basin centre (c. 97–66 Ma; Fig. 2). U–Pb zircon CA-ID-TIMS dates from bentonites within the Kanguk and Bastion Ridge formations (Davis et al. Reference Davis, Schröder-Adams, Galloway, Herrle and Pugh2016) support a late Cenomanian to early Campanian age range for the Kanguk Formation on Axel Heiberg Island. Moreover, chemostratigraphic investigations employing stable carbon isotopes have identified a positive isotopic excursion in the basal Kanguk Formation, which has been interpreted to record the late Cenomanian to early Turonian oceanic anoxic event two (OAE2) in the High Arctic (Lenniger et al. Reference Lenniger, Nøhr-Hansen, Hills and Bjerrum2014; Pugh et al. Reference Pugh, Schröder-Adams, Carter, Herrle, Galloway, Haggart, Andrews and Hatsukano2014; Schröder-Adams et al. Reference Schröder-Adams, Herrle, Embry, Haggart, Galloway, Pugh and Harwood2014; Herrle et al. Reference Herrle, Schröder-Adams, Davis, Pugh, Galloway and Fath2015).
3. Materials and methods
3.a. Bentonite samples
Eleven bentonite samples were collected from a river section in the Sawtooth Range, Fosheim Peninsula, central Ellesmere Island (section ES2; Fig. 1). The section is from near the eastern margin of the basin (Fig. 1). At this locality the Kanguk Formation is ~195 m thick (Fig. 3) and comprises predominantly dark grey to black shales and siltstones (Figs. 3, 4a). In general, the shales are darker and finer grained in the lower part of the succession. Yellow weathering, fine- to coarse-grained, fining upwards sandstone beds are common and typically overlie siltstones or shales with a sharp base. Centimetre to decimetre thick bentonites and volcanic ash beds are intercalated throughout the succession and are heterogeneously distributed: up to 12 horizons were observed in the lower part of the Kanguk Formation and fewer (up to seven) horizons in the middle and upper parts of the formation (Fig. 3). The bentonite horizons vary in thickness; apart from a 5 m thick horizon towards the top of the section (Fig. 3), the bentonites are ~2 to 80 cm thick. They display a range of colours from bluish grey to orange (Figs. 3, 4). Some bentonites are indurated, whereas others are poorly consolidated and possess soft, plastic textures.

Fig. 4. Field photographs of Kanguk Formation bentonites. (a) The lower part of the sampled section. Thicker bentonite horizons can be seen from a distance weathering out of the section (indicated by orange arrows). (b) Bentonite S_PH0152. The marker pen for scale is 13.5 cm long (indicated by a yellow arrow). (c) Bentonite S_PH0169. The hammer for scale is 30 cm long.
X-ray diffraction (XRD) analysis of whole-rock samples reveals that the bentonites have similar bulk mineralogy and that the samples are dominated by poorly crystalline phases (Fig. 5). In most samples there is a prominent mixed-layer clay peak (7–8 °2θ; Fig. 5), although the composition of the mixed-layer clay cannot be determined without further XRD analysis of the clay-sized fraction. In several bentonite samples there is a prominent broad peak at ~22 °2θ, which is characteristic of microcrystalline silica (e.g. S_PH0148a; Fig. 5). The lowest four bentonites analysed (S_PH0136, 0146, 0148a, 0152) all contain a number of tight peaks, which are indicative of highly crystalline phases. Some of these peaks correspond with quartz and feldspar (probably microcline; Fig. 5). These peaks may record the occurrence of relict igneous phenocrysts, as quartz and K-feldspar phenocrysts have been recovered from Kanguk bentonites sampled elsewhere on Ellesmere and Axel Heiberg islands (Parsons, Reference Parsons1994).
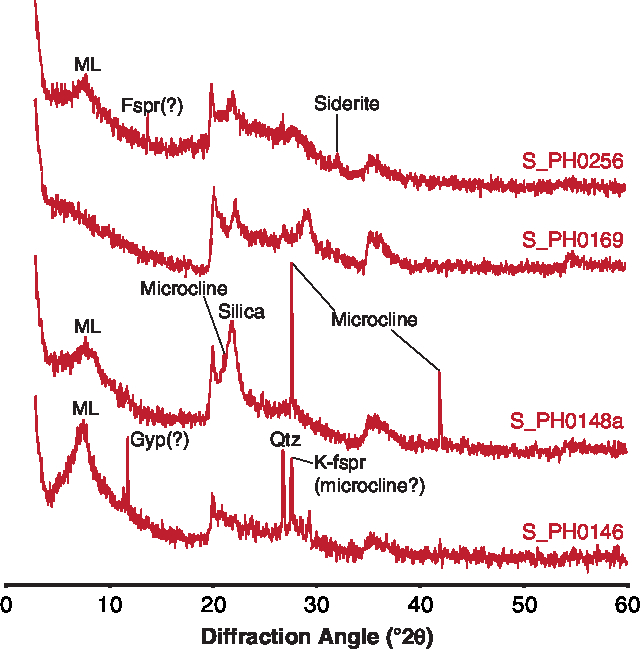
Fig. 5. Representative whole-rock X-ray diffraction traces. Fspr – feldspar; Gyp – gypsum; ML – mixed-layer clay; Qtz – quartz.
Zircon was recovered from 6 of the 11 bentonites (S_PH0136, 0146, 0157, 0169, 0242 and 0256). It is notably more abundant and of larger average grain size (up to 200 μm in length) in bentonites S_PH0136 and S_PH0146, from the base of the section (Fig. 3). In addition to euhedral zircon, several of the bentonite samples contain euhedral apatite, pyrite and a red-brown opaque mineral (possibly ilmenite). Similar restricted heavy mineral assemblages have been interpreted to be indicative of primary bentonites; that is, those formed through the in situ alteration of volcanic ash (Weaver, Reference Weaver1963).
3.b. U–Pb zircon SIMS geochronology
Approximately 300–500 g of each bentonite sample was processed for zircon separation. Most of the bentonite samples were disaggregated using a steel jaw crusher. This is with the exception of poorly consolidated samples, which were disaggregated by hand using an agate mortar and pestle. Samples were sieved using a 250 μm sieve and the <250 μm fraction was processed for zircon separation. Samples were washed several times in water to remove the clay fractions and were then dried in an oven. Zircons were concentrated using standard methods; that is, heavy liquid separation using LST (ρ = 2.8 g cm−3), followed by magnetic separation.
Zircons were hand-picked using a binocular microscope onto double-sided sticky tape. Sample grains, together with fragments of the 91500 zircon standard (Wiedenbeck et al. Reference Wiedenbeck, Allé, Corfu, Griffin, Meier, Oberli, Quadt, Roddick and Spiegel1995), were then mounted in epoxy at the NORDSIM facility, Swedish Natural History Museum. The mount was polished to expose grain interiors before optical and scanning electron microscope cathodoluminescence (SEM-CL) imaging. When imaged under SEM-CL, most grains show fine growth and/or sector zonation. A few grains from bentonites S_PH0136, S_PH0146 and S_PH0256 appear to contain inherited cores, although where it was possible to analyse both the core and rim of a grain, these were indistinguishable in age within analytical uncertainties.
U–Pb geochronology was undertaken on sample zircon grains using the CAMECA 1280-IMS secondary ion mass spectrometer at the NORDSIM facility. Analytical protocols follow those of Whitehouse & Kamber (Reference Whitehouse and Kamber2005) and Jeon & Whitehouse (Reference Jeon and Whitehouse2015). A spot size of ∼20 μm was used throughout. Analysis pits are ∼2–3 μm deep; such shallow pits mean analyses correspond well with the SEM-CL images, which sample up to ∼5 μm below the surface of a zircon grain. U–Pb isotope data from individual spot analyses were calculated on the basis of 12 measured ratios. All data were collected during a single ∼24 hour analytical session in 2014. The 91500 zircon standard (Wiedenbeck et al. Reference Wiedenbeck, Allé, Corfu, Griffin, Meier, Oberli, Quadt, Roddick and Spiegel1995) was used as the primary standard and was analysed every 4–6 sample analyses. A Pb/UO–UO2/UO calibration scheme was used (Jeon & Whitehouse, Reference Jeon and Whitehouse2015). The uncertainty of the U–Pb standard calibration was ±1.36 % (2SE; from 21 spot analyses) and this is propagated into the analytical uncertainties. No secondary standard zircon was analysed during the analytical session; however, long-term analysis of the TEMORA-2 zircon as an unknown has yielded a mean 206Pb–238U date of 418.0 ± 3.4 Ma (2SD; Jeon & Whitehouse, Reference Jeon and Whitehouse2015), which agrees well with the accepted date of 416.8 Ma (Black et al. Reference Black, Kamo, Allen, Davis, Aleinikoff, Valley, Mundil, Campbell, Korsch, Williams and Foudoulis2004). U–Pb ages were calculated using the decay constants of Jaffey et al. (Reference Jaffey, Flynn, Glendenin, Bentley and Essling1971) and a natural 238U/235U ratio of 137.88, as recommended by Steiger & Jäger (Reference Steiger and Jäger1977). U–Pb Tera-Wasserburg concordia diagrams were drawn from data uncorrected for non-radiogenic (common) lead using Isoplot v. 4.15 (Ludwig, Reference Ludwig2012). 207Pb-corrected ages were calculated attributing all common lead to surficial contamination and corrected using a modern-day average terrestrial common Pb composition (207Pb/206Pb = 0.836; Stacey & Kramers, Reference Stacey and Kramers1975). Five analyses contain no measurable common lead; these analyses are clearly labelled in online Supplementary Material Table S1. TuffZirc dates were calculated from the 207Pb-corrected dates, and uncorrected 206Pb–238U dates for analyses containing no common lead, using Isoplot v. 4.15 (Ludwig, Reference Ludwig2012). These are used to approximate the eruption ages of the bentonite horizons. A complete data table can be found in the online Supplementary Material.
3.c. Whole-rock geochemistry
Approximately 50 g of each bentonite sample were dried overnight at 105 °C and then comminuted to powders using a Resch planetary ball mill equipped with agate grinding vessels. Whole-rock bentonite powders were analysed for major-, trace- and rare earth element (REE) concentrations at ALS Minerals, Loughrea, Ireland, using their ME-MS81d method. The method involves fusing 0.2–0.4 g of powdered sample with lithium metaborate at 1000 °C, followed by HCl-HNO3 acid digestion.
Major-element concentrations were determined using inductively coupled plasma atomic emission spectroscopy (ICP-AES). Trace and REE concentrations were determined using inductively coupled plasma mass spectrometry (ICP-MS). Loss-on-ignition (LOI) values range between 6.8 and 21.0 %, although excluding samples S_PH0157 and S_PH0169, LOI values are <10 %. Raw data are presented in online Supplementary Material Table S2.
4. Results
4.a. U–Pb SIMS geochronology
U–Pb SIMS geochronology was undertaken on zircon grains separated from five Kanguk Formation bentonites (Fig. 3). Fifteen spot analyses were undertaken on 13 grains from bentonite S_PH0136 and yielded concordant to slightly discordant dates (Fig. 6a). One concordant analysis is resolvably older than all other analyses (136/4.1; Fig. 6a). This is tentatively interpreted to represent an older inherited magmatic grain. Likewise, one analysis yielded younger U–Pb ages than all other analyses and is tentatively interpreted to have been affected by lead loss (136/5.1; Fig. 6a). The TuffZirc algorithm excludes these two analyses and yields a date of 90.4 +1.0/−0.8 Ma (97.8 % confidence, n = 13), which is interpreted as the preferred age of this bentonite.
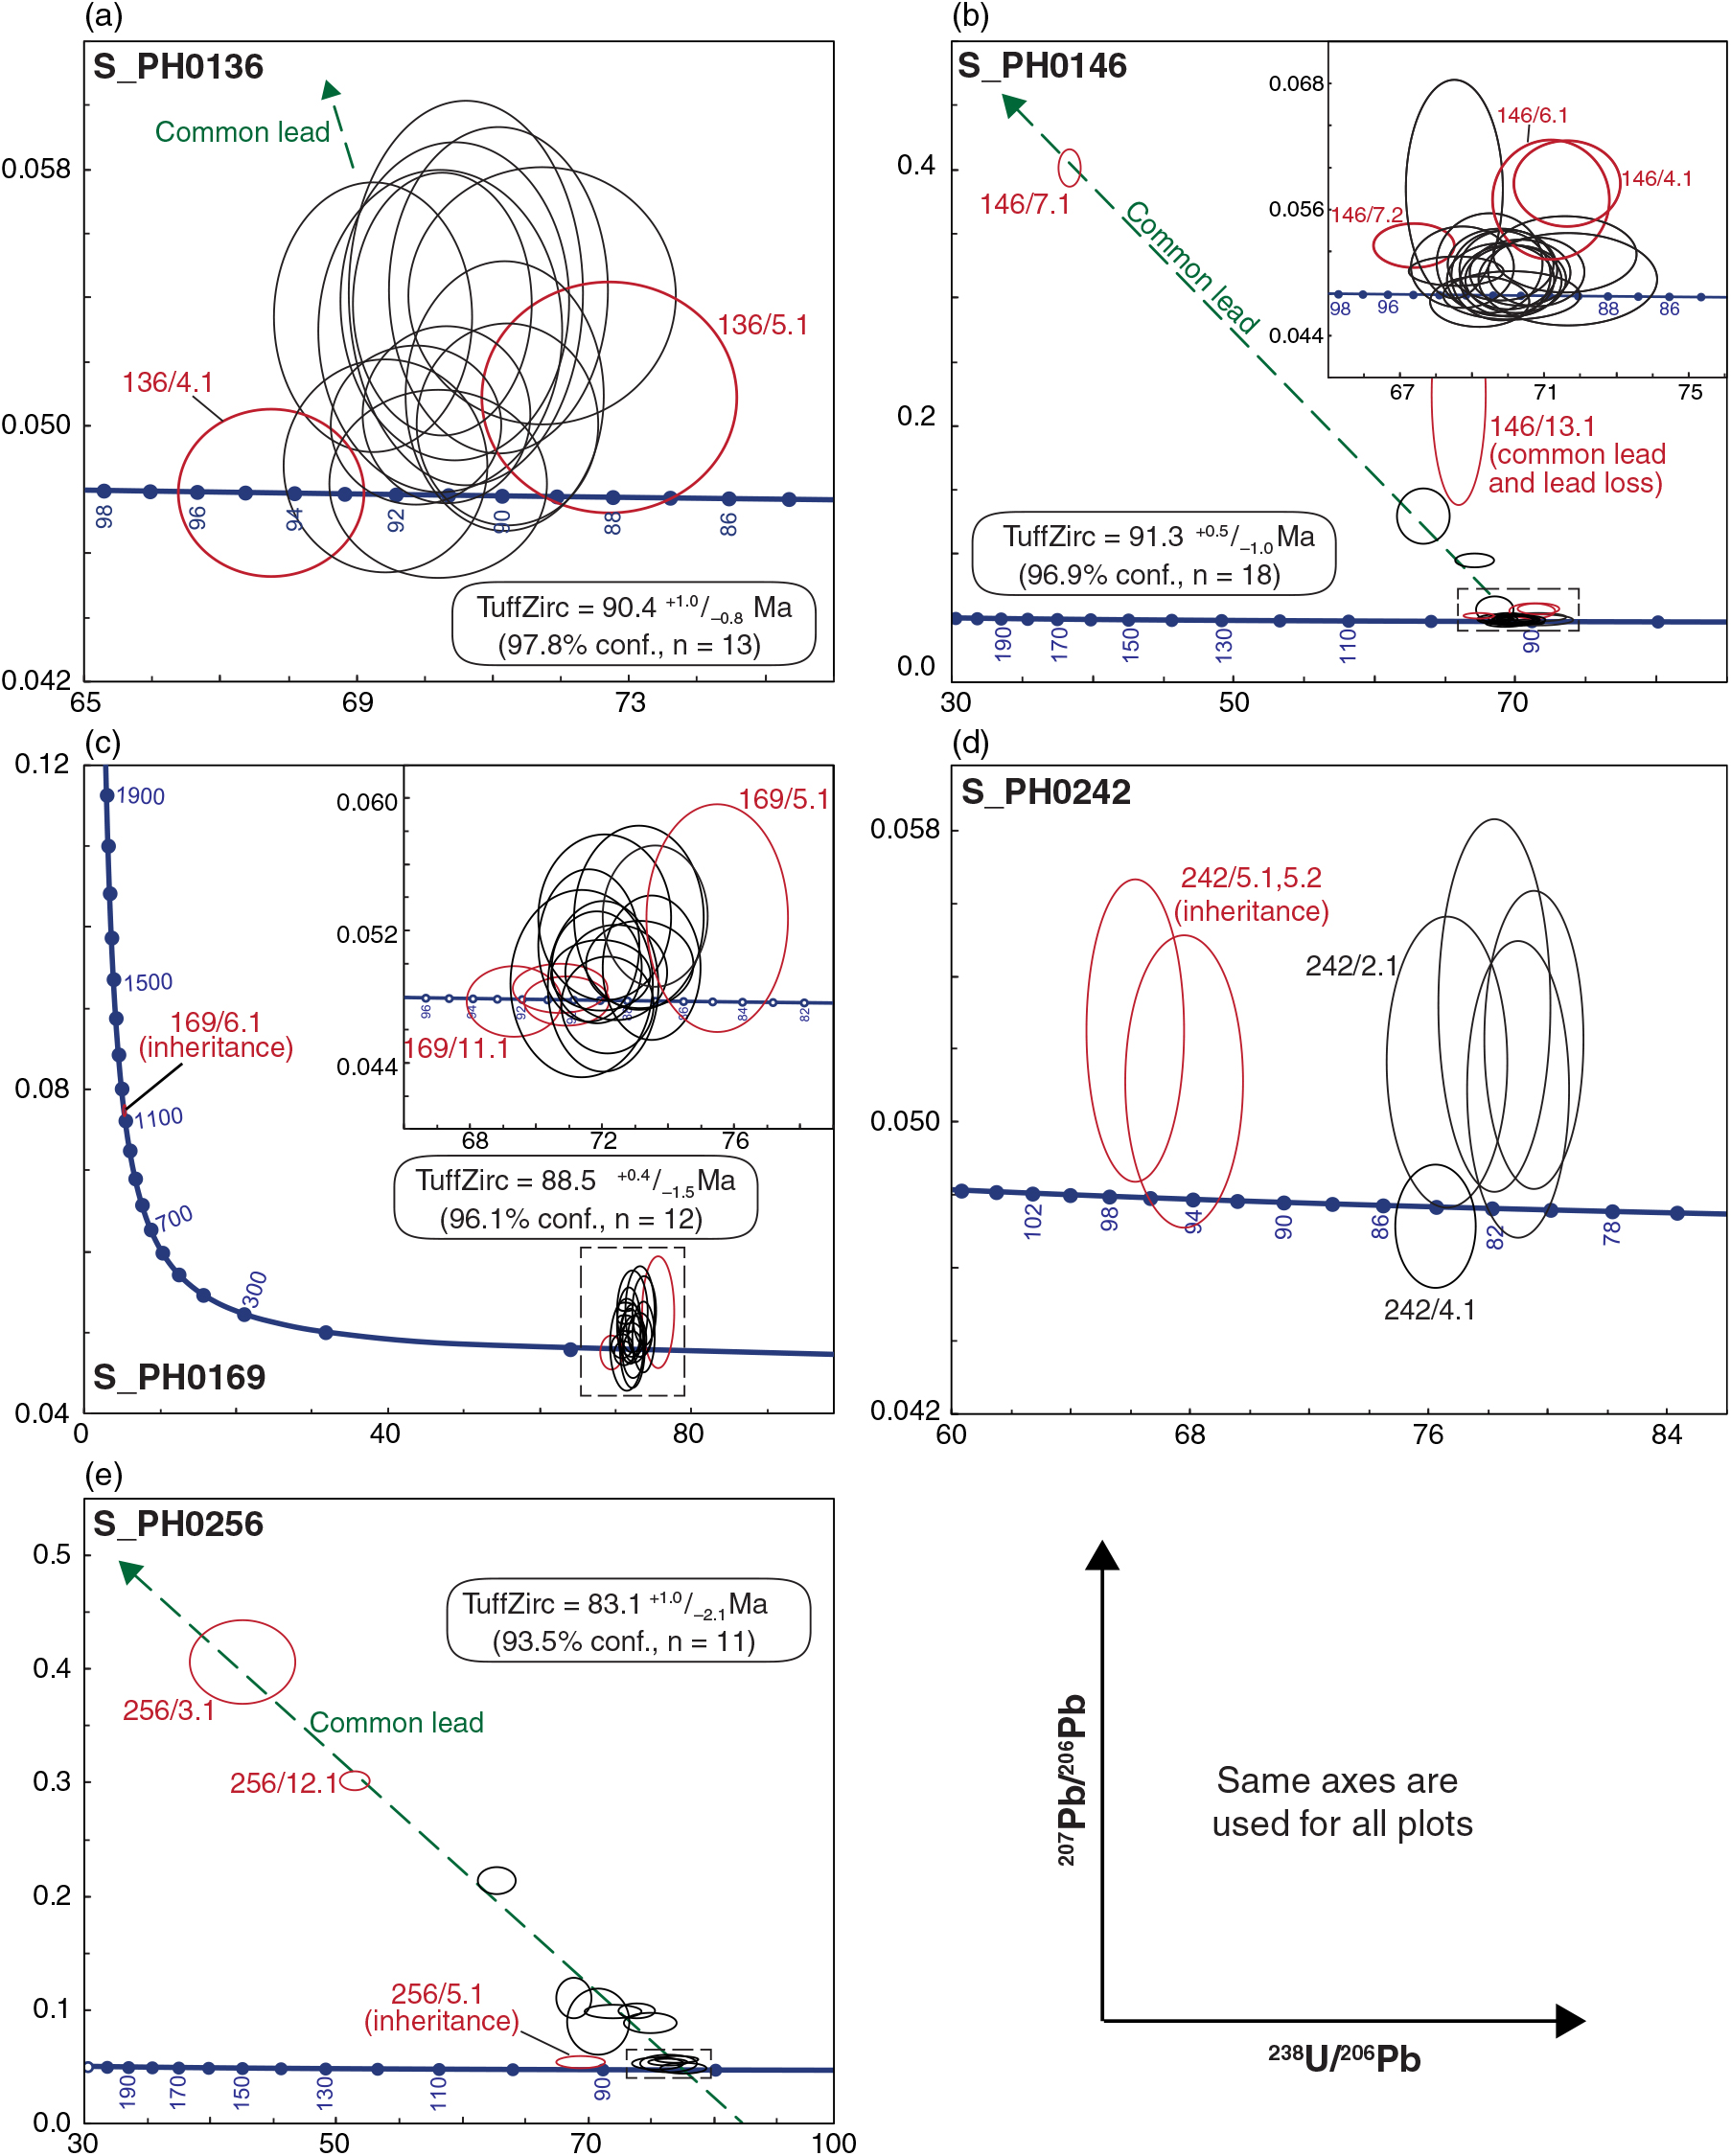
Fig. 6. Tera-Wasserburg U–Pb concordia diagrams showing U–Pb SIMS data from the Kanguk Formation bentonites. Uncertainty ellipses are drawn at the 2s confidence level; data are uncorrected for common lead. The blue band is the Concordia curve; blue numbers are concordant ages in units of Ma. Quoted dates are TuffZirc dates; black and red uncertainty ellipses denote analyses included/excluded by the TuffZirc algorithm.
Twenty-three spot analyses were undertaken on 18 grains from bentonite S_PH0146. These analyses comprise a dominant age population at c. 91.5 Ma and four older discordant analyses (Fig. 6b). Three of the discordant older analyses form a linear trend that is consistent with common lead contamination (Fig. 6b). Analysis 146/13.1 lies above this trend and likely contains an element of lead loss. Within the main age cluster, there is one slightly discordant analysis from an inherited core that yielded an older 207Pb-corrected date of 94.4 Ma (146/7.2 Fig. 6b inset). The TuffZirc algorithm excluded analyses 146/7.2 and 146/13.1, together with analysis 146/7.1, which has an imprecise 207Pb-corrected date, and analyses 146/4.1 and 146/6.1, which have relatively young 207Pb-corrected dates. The remaining 18 analyses give a TuffZirc date of 91.3 +0.5/−1.0 Ma (96.9 % confidence). This is taken as the preferred age for bentonite S_PH0146.
Seventeen spot analyses were undertaken on 11 grains from bentonite S_PH0169. One grain yielded a substantially older concordant 207Pb–206Pb date of 1134 ± 15 Ma (169/6.1; Fig. 6c) and is interpreted as an inherited grain, either entrained during eruption, or washed or blown in after deposition. On closer inspection of the data, two analyses only marginally overlap within uncertainty with the main sample age population (Fig. 6c inset) and are tentatively interpreted as another inherited grain (169/11.1) and a grain that has experienced minor lead loss (169/5.1), respectively. The TuffZirc algorithm excluded these three analyses, together with analyses 169/1.2 and 169/2.2, which have >90 Ma 207Pb-corrected dates. The remaining 12 analyses yield a TuffZirc date of 88.5 +0.4/−1.5 Ma (96.1 % confidence).
Owing to the poor recovery of zircon from bentonite S_PH0242, only eight spot analyses on five grains were undertaken. One analysis (242/3.1) yielded imprecise dates and contains substantial common lead. The other seven analyses form two concordant to slightly discordant age clusters at c. 96 and 82 Ma (Fig. 6d). The two c. 96 Ma analyses are from an anhedral, sector-zoned grain fragment, which is interpreted as an older inherited grain (242/5.1, 5.2; Fig. 6d). The younger, c. 82 Ma age cluster comprises three analyses from a single grain, which yielded 80–81 Ma 207Pb-corrected dates (242/1.1–242/1.3), and single analyses from two grains, which yielded 83.2 and 84.1 Ma 207Pb-corrected dates (242/2.1 and 242/4.1, respectively). These data are too scattered to represent a single age population. Their interpretation is, however, not straightforward. Supporting information, such as SEM-CL images and Th/U ratios, provide little insight: all grains are euhedral, contain fine-scale oscillatory zonation and have similar Th/U ratios (0.33–0.61). Given the uncertainty in the interpretation of these data, no eruption age is calculated for this sample.
Fourteen spot analyses were undertaken on 13 grains from bentonite S_PH0256. One analysis yielded relatively old, slightly discordant dates that do not overlap with the other analyses (256/5.1; Fig. 6e). This likely represents an inherited grain as there is no evidence for a xenocrystic core within this grain based on SEM-CL imaging. All remaining analyses yielded discordant to concordant dates that fall on a linear trend consistent with common lead contamination (Fig. 6e). The TuffZirc algorithm excludes analysis 256/5.1, together with analyses 256/3.1 and 256/12.1, which have imprecise 207Pb-corrected dates. The remaining 11 analyses yield a TuffZirc date of 83.1 +1.0/−2.1 Ma (93.5 % confidence), which is taken as the preferred age of this bentonite.
4.b. Whole-rock geochemistry
Eleven bentonites were analysed for whole-rock geochemistry. These all show consistently greater enrichment in large-ion lithophile elements compared to the high field strength and REEs when data are normalized to primitive mantle values (Fig. 7a). Two bentonites, S_PH0157 and S_PH0169, exhibit negative Nb–Ta anomalies, which are conspicuously absent from the other bentonites analysed (Fig. 7a). Samples show similar trends in REE concentrations: chondrite-normalized REE trends are characterized by a stronger enrichment in light rare earth elements (LREE) than heavy rare earth elements (HREE) and negative europium anomalies (Fig. 7b). Bentonites S_PH0157 and S_PH0169 have smaller europium anomalies (0.51 and 0.38, respectively) than the other bentonites analysed (0.2–0.31).
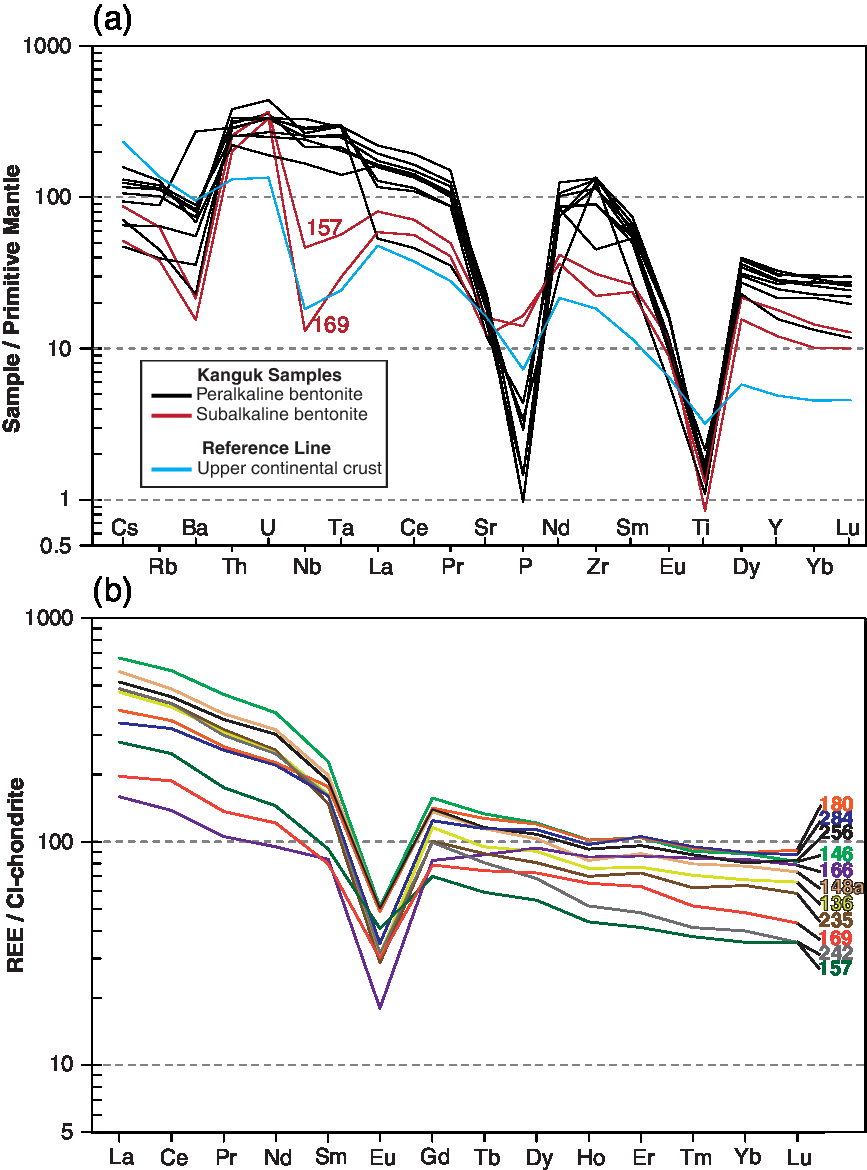
Fig. 7. (a) Primitive-mantle normalized multi-element diagram (normalized to the values of McDonough & Sun, Reference McDonough and Sun1995). The reference line for the upper continental crust is drawn according to Rudnick & Gao (Reference Rudnick, Gao, Holland and Turekian2003). (b) Whole-rock rare earth element data from the Kanguk Formation bentonites normalized to the CI-chondrite values of McDonough & Sun (Reference McDonough and Sun1995).
As discussed in the introduction, the major elements (Si, Al, Na, K, Mg, Ca and Fe) are of limited use for classifying extensively altered volcanic rocks such as bentonites because of element mobility. Instead, the classification of altered volcanic rocks relies on several trace elements that are generally considered to be immobile during most upper crustal processes and are also indicators of petrogenetic processes. These include Ti, Zr, Nb, Hf and Ta (Winchester & Floyd, Reference Winchester and Floyd1977; Huff et al. Reference Huff, Merriman, Morgan and Roberts1993; Kiipli et al. Reference Kiipli, Hints, Kallaste, Verš and Voolma2017). In felsic igneous rocks, the trace-element budget is commonly controlled by accessory minerals (Wark & Miller, Reference Wark and Miller1993; Bea, Reference Bea1996; Hoskin et al. Reference Hoskin, Kinny, Wyborn and Chappell2000; Claiborne et al. Reference Claiborne, Miller and Wooden2010). These include apatite and zircon, which are ubiquitous phenocrysts in the Kanguk Formation bentonites.
Classification and tectonic discrimination diagrams are widely used in geochemical studies of bentonites to elucidate original (unaltered) ash compositions and the tectonic settings of the source volcanoes where direct petrogenetic and geological constraints are not available. Their usage is, however, controversial. This is because many diagrams employ absolute elemental concentrations, which are difficult to apply to bentonites because diagenetic alteration may render elemental abundances dissimilar to those of the original unaltered volcanic ash (e.g. through residual enrichment or element mobility). Furthermore, concerns have been raised about the efficacy of several widely used classification and tectonic discrimination diagrams developed during the 1970 s and 1980 s (e.g. Wang & Glover, Reference Wang and Glover1992; Snow, Reference Snow2006; Li et al. Reference Li, Arndt, Tang and Ripley2015). This is because such diagrams were constructed using limited datasets that under-represent the extent of geochemical variation in igneous rocks from different tectonic settings. Thus, caution should be exercised when using classification and discrimination diagrams in isolation, particularly for ancient altered volcanic rocks whose source cannot be established from direct field evidence.
On the Zr/TiO2 versus Nb/Y classification diagram of Winchester & Floyd (Reference Winchester and Floyd1977) most of the bentonites plot in the comendite/pantellerite (peralkaline rhyolite) and trachyte fields. This is with the exception of bentonites S_PH0157 and S_PH0169, which plot within the subalkaline rhyolite and rhyodacite/dacite fields (Fig. 8a). Yttrium can sometimes be mobilized during the alteration of volcanic rocks to bentonites (e.g. Christidis, Reference Christidis1998; Hill et al. Reference Hill, Worden and Meighan2000). Thus, the measured Nb/Y ratios should be regarded as maximum estimates for the alkalinity of the original ash layers. Using the tectonic discrimination diagrams of Schandl & Gorton (Reference Schandl and Gorton2002) that employ ratios of Hf, Ta, Th and Yb, and are designed to identify the tectonic environments of felsic and intermediate volcanic rocks, all but two of the Kanguk Formation bentonites plot as a tight cluster in the within-plate volcanic zone field (Fig. 8b, c). Bentonites S_PH0157 and S_PH0169 plot separately, within the active continental margin field (Fig. 8b, c).
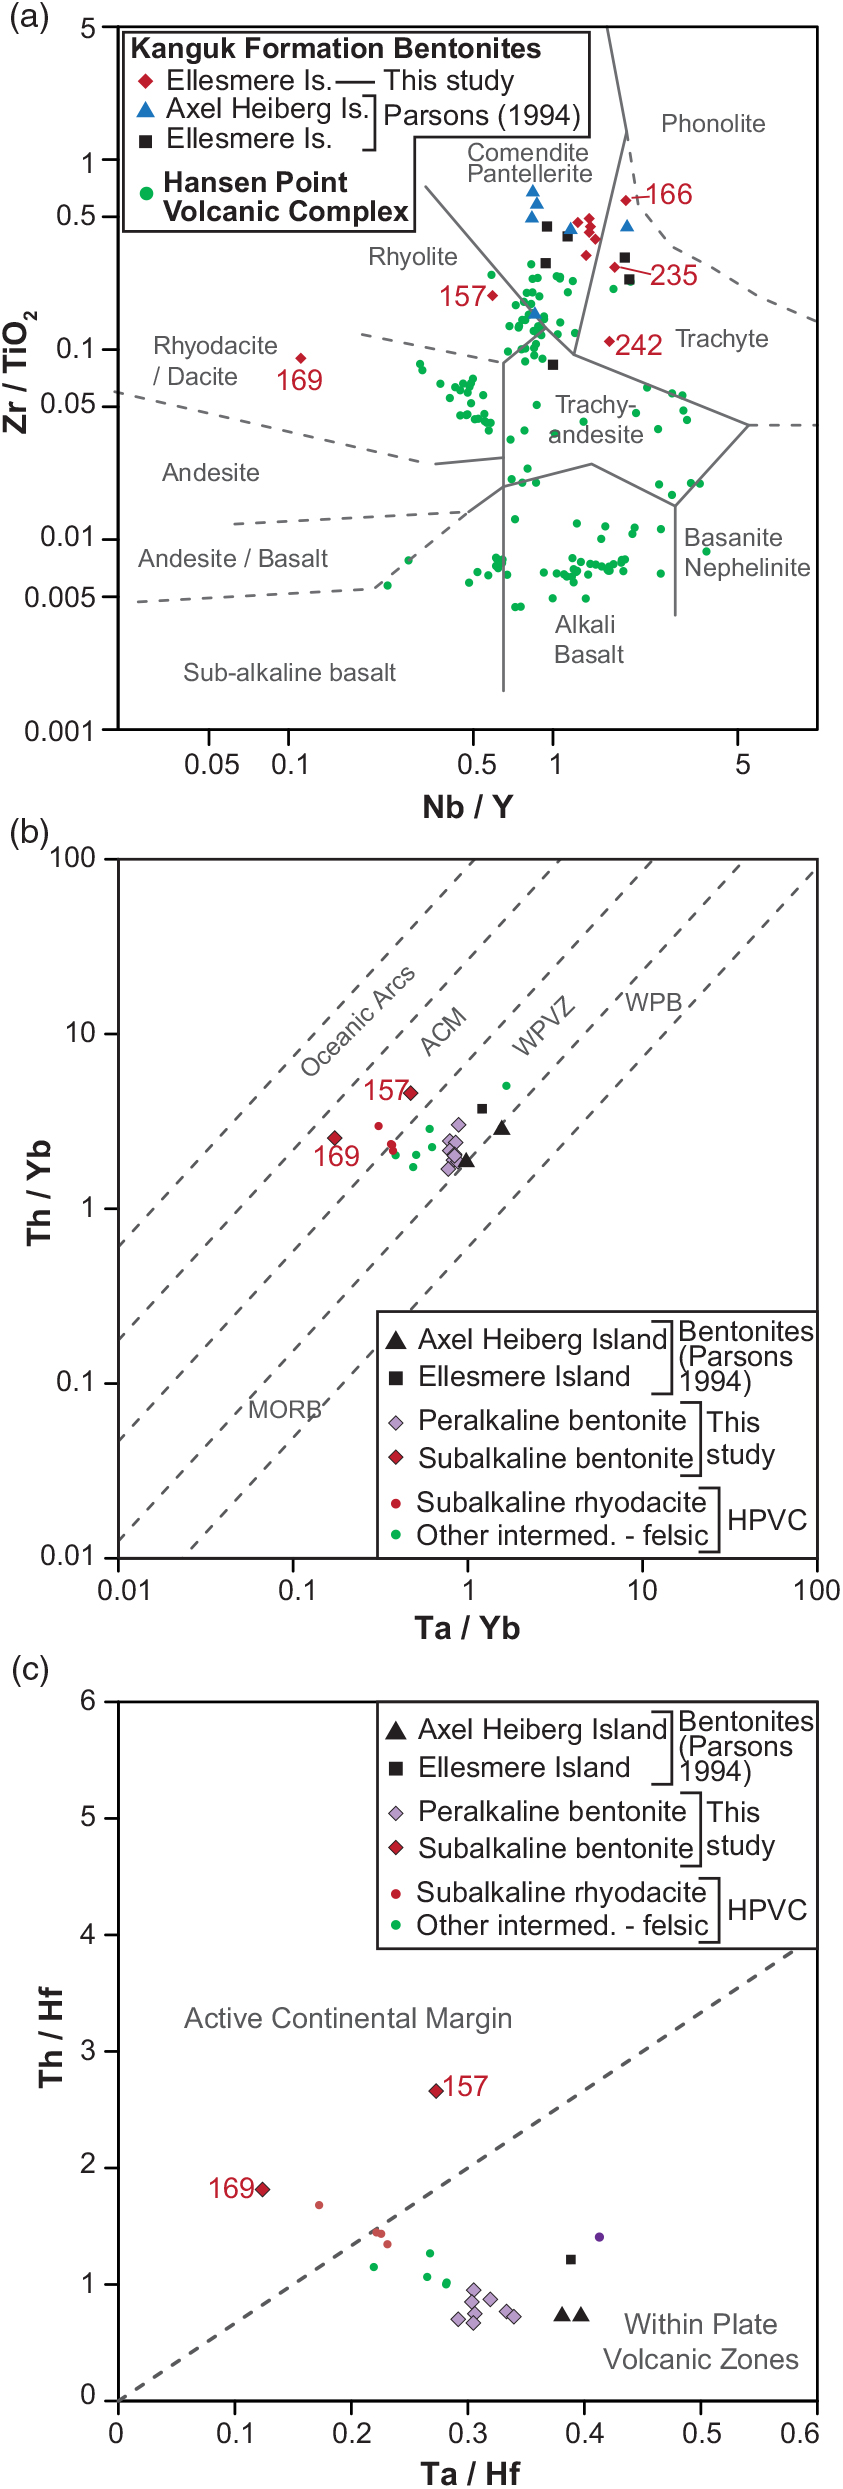
Fig. 8. Trace-element classification and tectonic discrimination diagrams. (a) is after Winchester & Floyd (Reference Winchester and Floyd1977). Is. – island. (b, c) are after Schandl & Gorton (Reference Schandl and Gorton2002). ACM – active continental margins; MORB – mid-ocean ridge basalts; WPB – within-plate basalts; WPVZ – within-plate volcanic zones. Kanguk Formation bentonite whole-rock geochemistry data from Parsons (Reference Parsons1994) are also drawn. Whole-rock geochemistry data from the Hansen Point Volcanic Complex (HPVC) are redrawn from Trettin (Reference Trettin1996), Estrada & Henjes-Kunst (Reference Estrada and Henjes-Kunst2004) and Estrada et al. (Reference Estrada, Damaske, Henjes-Kunst, Schreckenberger, Oakey, Piepjohn, Eckelmann and Linnemann2016).
5. Discussion
5.a. U–Pb geochronology
U–Pb SIMS dating was undertaken on zircons separated from five Kanguk Formation bentonites. Four of these bentonites yielded robust ages, which are summarized in Table 1. In detail, the U–Pb age from bentonite S_PH0136 is slightly younger than that from the overlying bentonite S_PH0146 (Fig. 9; Table 1), although these ages are indistinguishable within analytical uncertainties.
Table 1. U–Pb zircon SIMS TuffZirc dates obtained from the Kanguk Formation bentonites

n – number of analyses included in age calculation / total number of analyses.
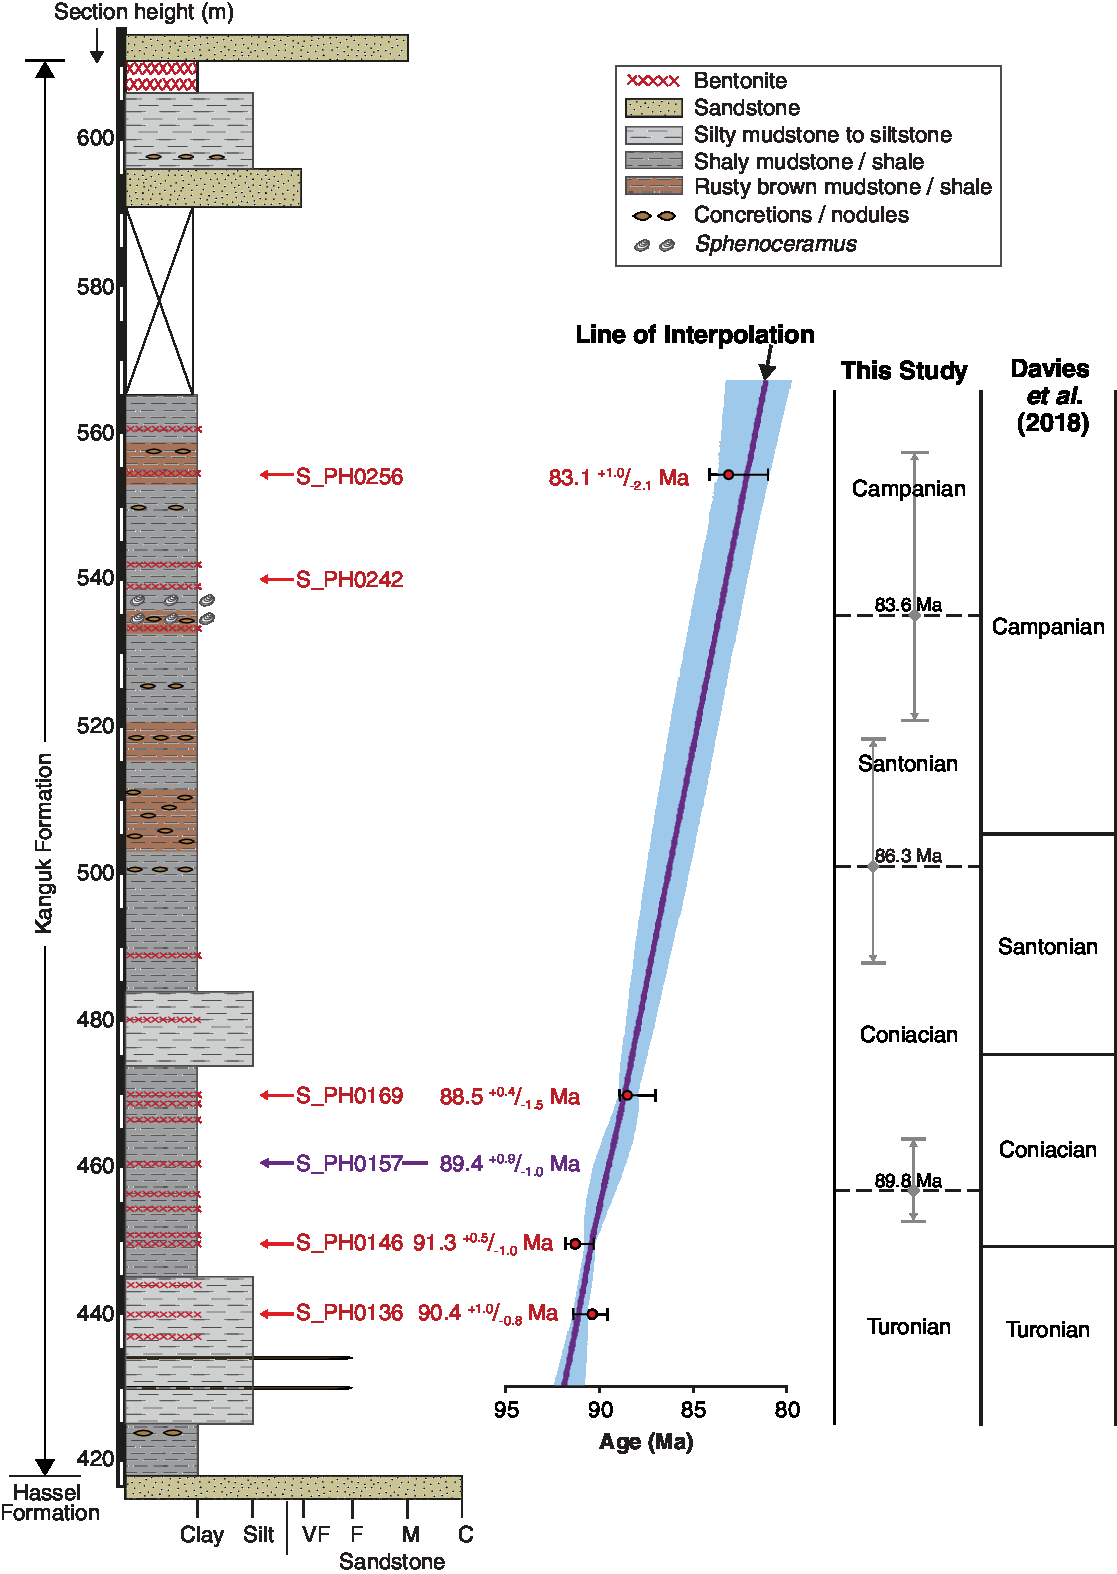
Fig. 9. Age versus stratigraphic height interpolation model for section ES2 calculated using the U–Pb zircon SIMS dates. Interpolation between bentonite horizons was done using the P_Sequence routine of the OXCAL program (Bronk Ramsey, Reference Bronk Ramsey2008; Bronk Ramsey & Lee, Reference Bronk Ramsey and Lee2013). The pale grey (blue online) band surrounding the line of interpolation denotes the 95 % credible interval of the interpolation model. Numerical ages for the stage boundaries are from Cohen et al. (Reference Cohen, Finney, Gibbard and Fan2013). Uncertainties in the positions of stage boundaries are represented by grey vertical lines. The positions of stage boundaries inferred by Davies et al. (Reference Davies, Schröder-Adams, Herrle, Hülse, Schneider, Quesnel and Harwood2018) using a combination of benthic Foraminifera biostratigraphy and δ13C chemostratigraphy are also shown. Note that the age of bentonite S_PH0157 is estimated from the interpolation model.
The positions of chronostratigraphic stage boundaries within the studied section have been estimated through interpolation using the Bayesian chronological modelling software program OXCAL (Fig. 9; Bronk Ramsey, Reference Bronk Ramsey2008; Bronk Ramsey & Lee, Reference Bronk Ramsey and Lee2013). From the same OXCAL interpolation model, the age of an undated bentonite sample with active continental margin chemistry (bentonite S_PH0157) is estimated to be 89.4 +0.9/−1.0 Ma (95 % credible interval; Fig. 9). Computing similar interpolation models for the sections at Glacier Fiord and the Hoodoo Dome using the U–Pb zircon CA-ID-TIMS ages from Davis et al. (Reference Davis, Schröder-Adams, Galloway, Herrle and Pugh2016) permits chronostratigraphic correlation across the basin (Fig. 10). Figures illustrating these interpolation models are available in the online Supplementary Material.
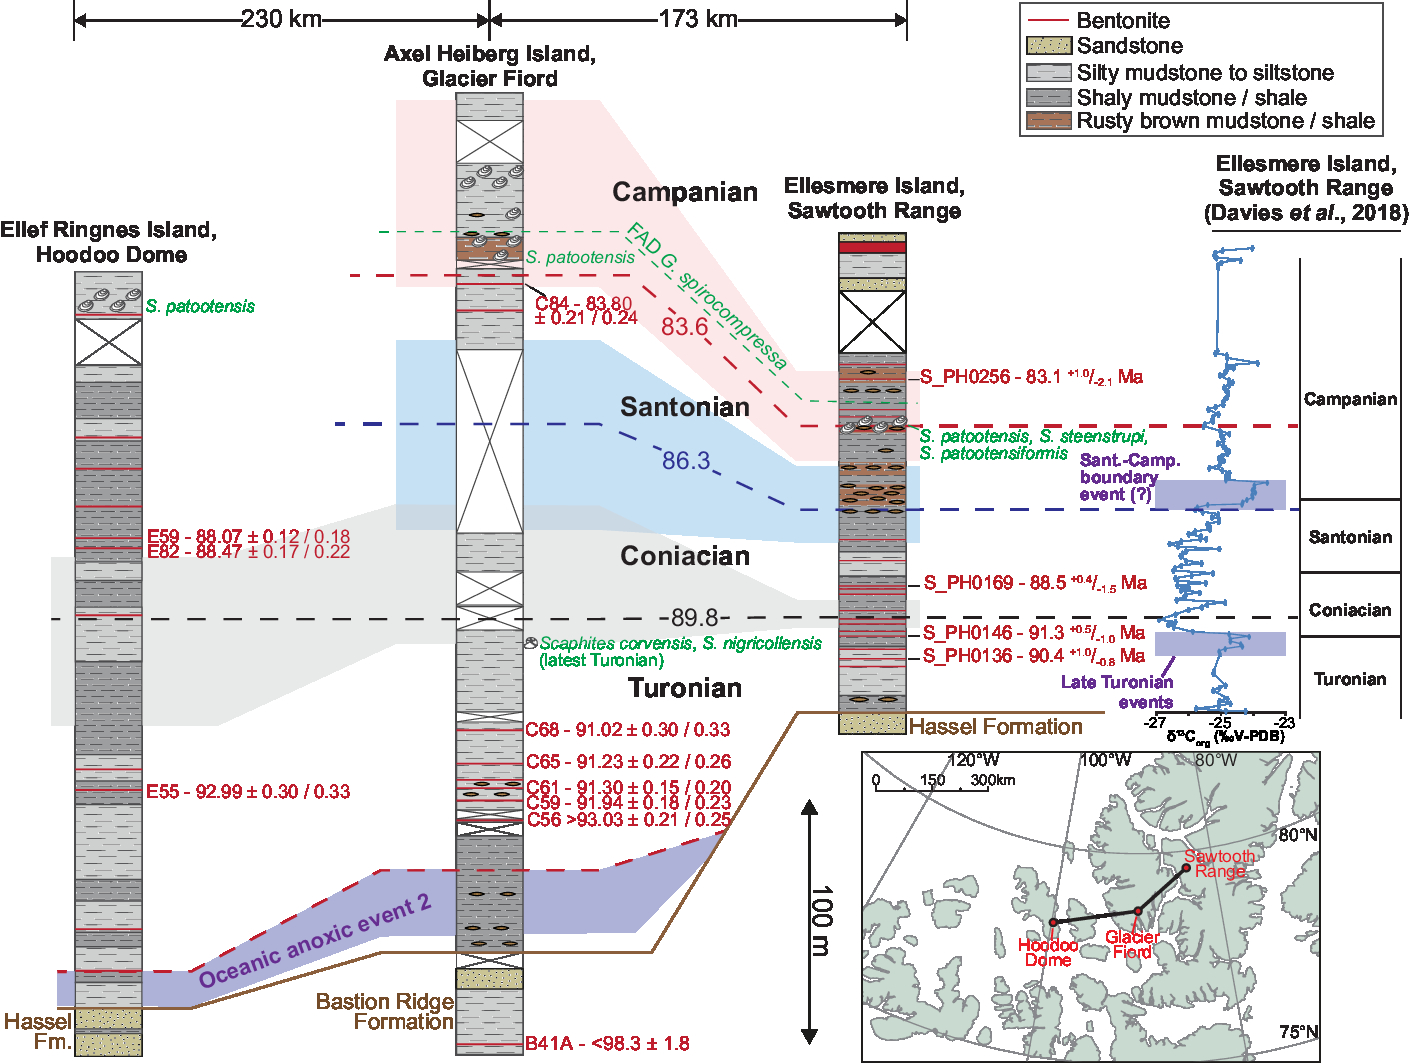
Fig. 10. Correlation panel for the Kanguk Formation based on U–Pb ages from interbedded bentonites. For each section, an age versus height interpolation model was calculated using OXCAL (Bronk Ramsey, Reference Bronk Ramsey2008; Bronk Ramsey & Lee, Reference Bronk Ramsey and Lee2013); chronostratigraphic stage boundaries, represented by dashed lines, were correlated between sections from these. The uncertainty in positions of chronostratigraphic boundaries is denoted by the shaded (colour online) bands surrounding the boundaries. These represent the 95 % credible interval of the interpolation models. The Glacier Fiord and Hoodoo Dome sections are redrawn and simplified from Schröder-Adams et al. (Reference Schröder-Adams, Herrle, Embry, Haggart, Galloway, Pugh and Harwood2014) and Pugh et al. (Reference Pugh, Schröder-Adams, Carter, Herrle, Galloway, Haggart, Andrews and Hatsukano2014), respectively. CA-ID-TIMS dates from these two sections are from Davis et al. (Reference Davis, Schröder-Adams, Galloway, Herrle and Pugh2016). ± X/Y uncertainty levels (sensu Schoene et al. Reference Schoene, Crowley, Condon, Schmitz and Bowring2006) are shown for the CA-ID-TIMS data; X uncertainties are relevant for the comparison of the CA-ID-TIMS dates, whereas the Y uncertainties are relevant when comparing the CA-ID-TIMS dates to our SIMS dates. First appearance datums (FAD) for G. spirocompressa are from Schröder-Adams et al. (Reference Schröder-Adams, Herrle, Embry, Haggart, Galloway, Pugh and Harwood2014) and Davies et al. (Reference Davies, Schröder-Adams, Herrle, Hülse, Schneider, Quesnel and Harwood2018). δ13Corg data are redrawn from Davies et al. (Reference Davies, Schröder-Adams, Herrle, Hülse, Schneider, Quesnel and Harwood2018); horizontal shaded bars denote intervals containing positive isotope excursions identified by the authors.
The new U–Pb zircon ages bracket the intervening portion of the Kanguk Formation in section ES2 to the upper Turonian to lower Campanian interval (Fig. 9). Furthermore, these data suggest that the Cenomanian to lower Turonian interval, including an expression of OAE2, is either missing or highly condensed in this section.
The positions of chronostratigraphic boundaries within section ES2 were inferred previously by Davies et al. (Reference Davies, Schröder-Adams, Herrle, Hülse, Schneider, Quesnel and Harwood2018; Fig. 9) using benthic Foraminifera biostratigraphy and by matching of δ13C isotope data to composite curves from the Western Interior Basin of North America (Joo & Sageman, Reference Joo and Sageman2014) and England (Jarvis et al. Reference Jarvis, Gale, Jenkyns and Pearce2006). In comparing our interpolated stage boundaries, there is reasonable agreement for the position of the basal Coniacian Stage boundary but poorer agreement for the basal Santonian and Campanian Stage boundaries (Fig. 9). Davies et al. (Reference Davies, Schröder-Adams, Herrle, Hülse, Schneider, Quesnel and Harwood2018) equated the base of the Coniacian Stage with the same level as bentonite S_PH0146 (Fig. 9); however, the U–Pb date from this bentonite of 91.3 +0.5/−1.0 Ma (96.9 % confidence; Table 1) constrains the boundary to be above this level. Our U–Pb interpolation model places the basal Coniacian boundary 7–8 m above this bentonite (Fig. 9). The base Santonian boundary is poorly constrained in our interpolation model owing to a lack of bentonite age control from near to this stratigraphic level (Fig. 9). The position of the base Campanian boundary is also imprecisely constrained, although it is positioned at a higher level within the section compared to Davies et al. (Reference Davies, Schröder-Adams, Herrle, Hülse, Schneider, Quesnel and Harwood2018), who placed the boundary below a short δ13C isotope excursion inferred to represent a Santonian–Campanian boundary event (Fig. 9). This isotope excursion occurs within a brown mudstone/shale unit containing numerous siderite(?) nodules and beds (Fig. 9). Furthermore, no correlative of this isotopic event was identified in a nearby section at Slidre Fiord, Ellesmere Island, by Davies et al. (Reference Davies, Schröder-Adams, Herrle, Hülse, Schneider, Quesnel and Harwood2018). Consequently, this excursion may be lithologically controlled and of only local significance. The base of the Campanian Stage in our interpolation model is located close to the first occurrence of the inoceramid bivalve Sphenoceramus patootensis, a latest Santonian to early Campanian boreal marker species (Fig. 9). S. patootensis forms part of a late Santonian to early Campanian Sphenoceramus association that has been reported from the upper Kanguk Formation across the entire Sverdrup Basin, where it occurs in a single or several closely spaced horizons (e.g. Tozer & Thorsteinsson, Reference Tozer and Thorsteinsson1964; Pugh et al. Reference Pugh, Schröder-Adams, Carter, Herrle, Galloway, Haggart, Andrews and Hatsukano2014; Schröder-Adams et al. Reference Schröder-Adams, Herrle, Embry, Haggart, Galloway, Pugh and Harwood2014; Davies et al. Reference Davies, Schröder-Adams, Herrle, Hülse, Schneider, Quesnel and Harwood2018). Revising the position of the basal Campanian boundary to a higher level within the Sawtooth Range section removes the diachroneity between the first appearance datum of the foraminifer Glaphyrammina spirocompressa and the bivalve Sphenoceramus patootensis in this section compared to other sites within the Sverdrup Basin (Fig. 10).
5.b. Original ash composition and tectonic setting of source volcanoes
A peralkaline rhyolitic to trachytic ash composition is inferred for all bentonites except S_PH0157 and S_PH0169 using the Zr/TiO2 versus Nb/Y classification diagram (Fig. 8a). An evolved (felsic) magmatic source is further supported by the presence of sizeable negative europium anomalies in these samples (Fig. 7b). In other studies of bentonites, these anomalies have been inferred to arise through the removal of plagioclase feldspar during fractional crystallization and to indicate an evolved (felsic) magmatic parentage (e.g. Bohor & Triplehorn, Reference Bohor and Triplehorn1993; Wray, Reference Wray1995; Huff et al. Reference Huff, Morgan and Rundle1996). The high zirconium concentrations (475–1420 ppm) coupled with a poor recovery of zircon are consistent with a peralkaline composition, as laboratory experiments have demonstrated that zircon solubility increases dramatically as a function of peralkalinity ((Na2O + K2O)/Al2O3; Watson, Reference Watson1979; Linnen & Keppler, Reference Linnen and Keppler2002). A peralkaline rhyolitic to trachytic ash composition is consistent with previous work by Parsons (Reference Parsons1994; Fig. 8). Additional support for such an ash composition is obtained by comparing the data from these Kanguk Formation bentonites with equivalent geochemistry data from Permian tonsteins (kaolinitic, diagenetically altered, volcanic ash layers) in the Songzao Coalfield, China (Dai et al. Reference Dai, Wang, Zhou, Hower, Li, Chen, Zhu and Zou2011; Table 2). Dai et al. (Reference Dai, Wang, Zhou, Hower, Li, Chen, Zhu and Zou2011) characterized three types of tonstein (mafic, silicic and alkali) that were differentiated using TiO2/Al2O3 ratios and a suite of trace and REEs. In brief, alkali tonsteins show significant enrichment in Nb, Ta, Zr, Hf, REEs and Ga, whilst silicic tonsteins have low REE concentrations but exhibit the greatest fractionation between LREEs and HREEs (Table 2). Using the same geochemical indices, these Kanguk Formation bentonites yield value ranges that are substantially different from the silicic tonsteins and partially overlap with the alkali tonsteins (Table 2). This is except for TiO2/Al2O3 values, which fall between those of silicic and alkali tonsteins.
Table 2. Comparison of whole-rock geochemistry data from bentonites of the Kanguk Formation to Permian mafic, silicic and alkali tonsteins of the Songzao Coalfield, China (Dai et al. Reference Dai, Wang, Zhou, Hower, Li, Chen, Zhu and Zou2011). Data are expressed as minimum and maximum ranges

* Calculated using data normalized to CI-chondrite values (McDonough & Sun, Reference McDonough and Sun1995).
† Number of analyses used to calculate the data ranges.
Using the tectonic discrimination diagrams of Schandl & Gorton (Reference Schandl and Gorton2002), these peralkaline bentonites plot as a tight cluster in the within-plate volcanic zones field (Fig. 8b, c). Such a tectonic setting is consistent with the inferred peralkaline rhyolitic/trachytic ash composition, as the majority of peralkaline felsic rocks exposed globally are associated with continental extensional (rift) settings (MacDonald, Reference MacDonald1974). The conspicuous lack of negative Nb–Ta anomalies in these bentonites further supports an intraplate tectonic setting with minimal crustal contamination.
Bentonites S_PH0157 and S_PH0169 show geochemical differences to the other bentonites analysed. They plot within the subalkaline rhyolite and dacite/rhyodacite fields in the Zr/TiO2 versus Nb/Y classification diagram (Fig. 8a). Furthermore, these bentonites have negative Nb–Ta anomalies (Fig. 7a), smaller negative europium anomalies (Fig. 7b) and the lowest concentrations of zirconium and REEs apart from bentonite S_PH0166. Taken together these data indicate a different, subalkaline dacitic to rhyolitic ash composition for these two bentonites. Bentonites S_PH0157 and S_PH0169 plot in the active continental margin field in Figure 8b, c. Such a tectonic setting is consistent with the negative Nb–Ta anomalies present in these bentonites, which are a prominent geochemical feature of subduction zone magmatism (Baier et al. Reference Baier, Audétat and Keppler2008). Negative Nb–Ta anomalies are, however, not unique to active continental margins and can occur in magmatic rocks from other tectonic settings; for example, magma generated in an anorogenic continental setting can gain arc-like geochemical characteristics through extensive crustal assimilation (e.g. Pearce, Reference Pearce2014).
Taken together, the available data support that there are two distinct types of bentonite within the Kanguk Formation which were likely sourced from volcanic centres within different tectonic regimes. These are as follows: (1) thick (mostly 20–80 cm), c. 92–83 Ma peralkaline rhyolitic to trachytic ashes with geochemistry suggestive of an intraplate tectonic setting (n = 9); (2) thin (<5 cm), c. 90–88 Ma subalkaline dacitic to rhyolitic ashes likely originating from an active continental margin setting (bentonites S_PH0157 and S_PH0169).
5.c. Possible locations of the source volcanoes
5.c.1. Peralkaline bentonites
The volcanic source(s) of intraplate, peralkaline bentonites within the Kanguk Formation has been discussed in other studies (Parsons, Reference Parsons1994; Davis et al. Reference Davis, Schröder-Adams, Galloway, Herrle and Pugh2016) that concluded they were locally sourced from igneous centres on the Sverdrup Rim, Alpha Ridge, northern Ellesmere Island and/or northern Greenland. Davis et al. (Reference Davis, Schröder-Adams, Galloway, Herrle and Pugh2016) inferred ash transportation distances of <1000 km for these bentonites on the basis of 10–40 cm bed thicknesses. Peralkaline bentonites in section ES2 are ~10–500 cm thick (Fig. 3), which, together with the coarse size of zircon phenocrysts in the Turonian bentonites S_PH0136 and S_PH0146, corroborates that the source volcanoes were proximal to the Sverdrup Basin.
Within this geographical radius there are known alkaline mafic to felsic volcanic and intrusive rocks exposed locally on northern Ellesmere Island that have compatible geochemistry and overlapping age (Fig. 11). Local 92–90 Ma bimodal alkaline igneous rocks of the Wootton Intrusive Complex are exposed to the north of the Sverdrup Basin, on northern Ellesmere Island (Trettin & Parrish, Reference Trettin and Parrish1987; Estrada & Henjes-Kunst, Reference Estrada and Henjes-Kunst2013). The complex comprises predominantly gabbro, with minor granitoids and hybrid rocks (Trettin & Parrish, Reference Trettin and Parrish1987; Estrada et al. Reference Estrada, Piepjohn, Henjes-Kunst and von Gosen2006), although 93–91 Ma hypabyssal alkali-feldspar- and quartz-bearing microgranites with peralkaline rhyolitic chemistry have also been reported (Estrada et al. Reference Estrada, Piepjohn, Henjes-Kunst and von Gosen2006; Estrada & Henjes-Kunst, Reference Estrada and Henjes-Kunst2013).
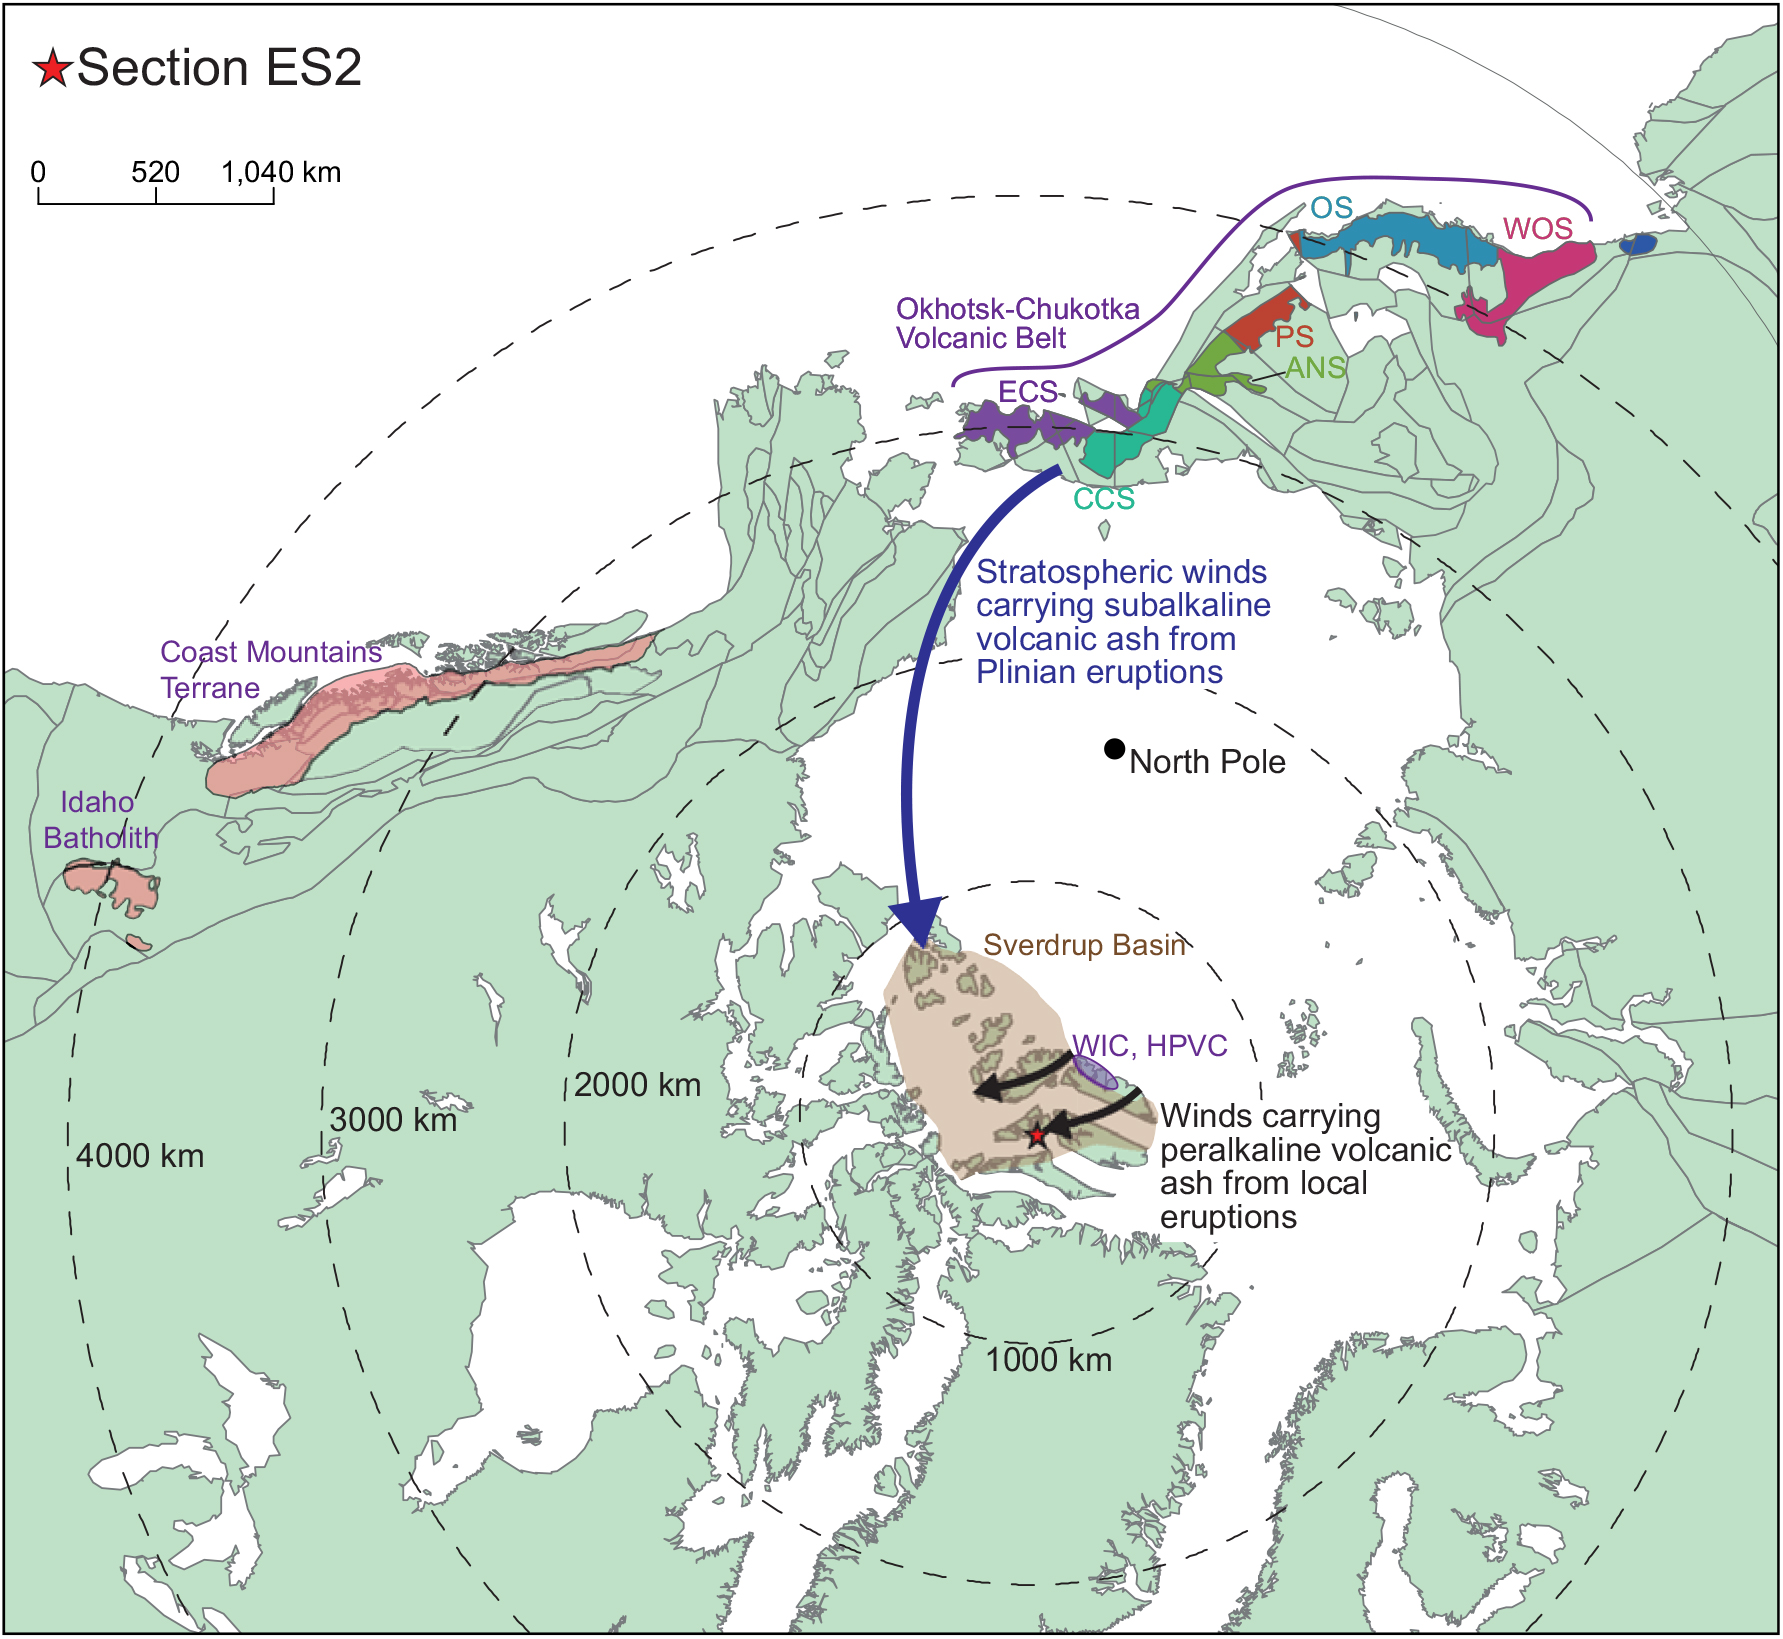
Fig. 11. Plate tectonic reconstruction of the circum-Arctic region during Late Cretaceous times (89 Ma) created in GPlates (v. 2) using the model of Matthews et al. (Reference Matthews, Maloney, Zahirovic, Williams, Seton and Müller2016). The Coast Mountains Terrane is redrawn from Wheeler et al. (Reference Wheeler, Brookfield, Gabrielse, Monger, Tipper and Woodsworth1991); the Coast Mountains Batholith comprises the majority of the Coast Mountains Terrane. The Okhotsk–Chukotka Volcanic Belt is redrawn from Tikhomirov et al. (Reference Tikhomirov, Kalinina, Moriguti, Makishima, Kobayashi, Cherepanova and Nakamura2012). The Hanson Point Volcanic Complex (HPVC) and Wootton Intrusive Complex (WIC) are simplified from Estrada et al. (Reference Estrada, Damaske, Henjes-Kunst, Schreckenberger, Oakey, Piepjohn, Eckelmann and Linnemann2016). Abbreviations for segments within the Okhotsk–Chukotka Volcanic Belt (from Tikhomirov et al. Reference Tikhomirov, Kalinina, Moriguti, Makishima, Kobayashi, Cherepanova and Nakamura2012): ANS – Anadyr segment; CCS – Central Chukotka segment; ECS – East Chukotka segment; OS – Okhotsk segment; PS – Penzhina segment; WOS – West Okhotsk segment.
Similarly, the Hansen Point volcanic complex (HPVC) exposed on northern Ellesmere Island is characterized by transitional to mildly alkaline, mafic to felsic volcanic rocks (Trettin & Parrish, Reference Trettin and Parrish1987; Embry & Osadetz, Reference Embry and Osadetz1988; Embry, Reference Embry and Trettin1991; Trettin, Reference Trettin1996; Estrada & Henjes-Kunst, Reference Estrada and Henjes-Kunst2004; Estrada et al. Reference Estrada, Piepjohn, Henjes-Kunst and von Gosen2006), except for voluminous subalkaline rhyodacites and the dolerites within the vicinity of Yelverton Bay (Fig. 1). HPVC volcanic rocks largely have an intraplate geochemical affinity (Fig. 8b, c), and were likely erupted in a continental rift setting (Estrada & Henjes-Kunst, Reference Estrada and Henjes-Kunst2004, Reference Estrada and Henjes-Kunst2013). This is apart from the subalkaline rhyodacites that show more transitional geochemistry and plot close to or within the active continental margin field in Figure 8b, c. Their transitional chemistry has been attributed to crustal contamination of the parent magma (Estrada et al. Reference Estrada, Damaske, Henjes-Kunst, Schreckenberger, Oakey, Piepjohn, Eckelmann and Linnemann2016). The majority of these volcanic rocks are interpreted to have been erupted subaerially, although some interbedded shales contain dinoflagellates, indicating a marine environment (Embry & Osadetz, Reference Embry and Osadetz1988). These shales have yielded very similar dinoflagellate assemblages to those of the Kanguk Formation (Embry, Reference Embry and Trettin1991), suggesting the two may in part be coeval. Several Ar–Ar and Rb–Sr dates have been published, which yield a wide range of ages from 45–95 Ma, although most are within the 75–95 Ma age range (Estrada & Henjes-Kunst, Reference Estrada and Henjes-Kunst2004; Bono et al. Reference Bono, Tarduno and Singer2013; Estrada & Henjes-Kunst, Reference Estrada and Henjes-Kunst2013). Few U–Pb dates exist from the HPVC; a U–Pb TIMS age from a porphyritic rhyodacite (88 +20/−21 Ma; Trettin & Parrish, Reference Trettin and Parrish1987) is too imprecise to provide meaningful comparison with the U–Pb bentonite dates from the Kanguk Formation. Three recent U–Pb LA-ICP-MS dates of 104–96 Ma from subalkaline rhyodacites to the west of Yelverton Bay (Estrada et al. Reference Estrada, Damaske, Henjes-Kunst, Schreckenberger, Oakey, Piepjohn, Eckelmann and Linnemann2016) pre-date the deposition of the Kanguk Formation bentonites. Based on still sparse age data, HPVC magmatism, at least within the Yelverton Bay area, lasted from c. 122 to 74 Ma and changed from a subalkaline to dominantly mildly alkaline character since c. 96 Ma (Estrada et al. Reference Estrada, Damaske, Henjes-Kunst, Schreckenberger, Oakey, Piepjohn, Eckelmann and Linnemann2016).
On the basis of available age data, a Greenland source for the peralkaline Kanguk bentonites is unlikely. The bimodal Kap Washington Group exposed on North Greenland contains units with similar chemistry to the peralkaline Kanguk Formation bentonites (trachytic to rhyolitic lavas and ignimbrites, and fewer mildly alkaline basalts; Thórarinsson et al. Reference Thórarinsson, Holm, Tappe, Heaman and Tegner2011). Available isotopic ages, however, suggest that the felsic portions of the group were erupted after 71 Ma (Tegner et al. Reference Tegner, Storey, Holm, Thorarinsson, Zhao, Lo and Knudsen2011; Thórarinsson et al. Reference Thórarinsson, Holm, Tappe, Heaman and Tegner2011) and thus after the Kanguk Formation bentonites. Older (85–80 Ma) alkaline dykes are known from North Greenland, but these are of mafic composition (Kontak et al. Reference Kontak, Jensen, Dostal, Archibald and Kyser2001; Thórarinsson et al. Reference Thórarinsson, Söderlund, Døssing, Holm, Ernst and Tegner2015).
5.c.2. Subalkaline bentonites
On the basis of available age and geochemistry data from the HPVC, this volcanic complex is an unlikely source area for the two c. 90–88 Ma bentonites with subalkaline geochemistry. This is because the complex at this time is thought to have been characterized by mildly alkaline, intraplate magmatism (Estrada et al. Reference Estrada, Damaske, Henjes-Kunst, Schreckenberger, Oakey, Piepjohn, Eckelmann and Linnemann2016; see Section 5.c.1). The two bentonites with subalkaline geochemistry are notably thinner than the peralkaline bentonites and contain small zircon grains (typically 50–80 μm in length). Thus, it is possible that these bentonites originated from further afield compared to those with peralkaline chemistry. The subalkaline bentonites have geochemical characteristics that are consistent with an active continental margin tectonic setting (Section 5.b). The closest destructive plate margin at this time was ~3000 km away, along the western margin of North America and the eastern margin of Russia (Fig. 11).
There is evidence of considerable Late Cretaceous magmatism along the West Coast of North America. This is exemplified by the Coast Mountains and Idaho batholiths (Fig. 11; Gehrels et al. Reference Gehrels, Rusmore, Woodsworth, Crawford, Andronicos, Hollister, Patchett, Ducea, Butler, Klepeis, Davidson, Friedman, Haggart, Mahoney, Crawford, Pearson and Girardi2009; Gaschnig et al. Reference Gaschnig, Vervoort, Lewis and McClelland2010; Cecil et al. Reference Cecil, Gehrels, Ducea and Patchett2011). However, only local evidence remains of any associated volcanism, following subsequent uplift and erosion (Miller et al. Reference Miller, Gelman, Parfenov, Hourigan, Miller, Grantz and Klemperer2002). In contrast, there is a substantial volume of subalkaline felsic volcanic rocks preserved within the Okhotsk–Chukotka Volcanic Belt (OCVB; Tikhomirov et al. Reference Tikhomirov, Kalinina, Kobayashi and Nakamura2008, Reference Tikhomirov, Kalinina, Moriguti, Makishima, Kobayashi, Cherepanova and Nakamura2012; Akinin & Miller, Reference Akinin and Miller2011; Pease et al. Reference Pease, Miller, Wyld, Sokolov, Akinin, Wright, Pease and Coakley2018). Using U–Pb and Ar–Ar age data, Tikhomirov et al. (Reference Tikhomirov, Kalinina, Moriguti, Makishima, Kobayashi, Cherepanova and Nakamura2012) identified several episodes of peak volcanism within the northern part of the volcanic belt, which occurred during c. 82–79, 85.5–84 and 89–87 Ma. Based on the available geochemical and U–Pb age data, bentonites S_PH0157 and S_PH0169 are compatible with a volcanic source in the northern OCVB. Volcanism in the OCVB is thought to have been most intense during c. 89–84 Ma, with considerable thicknesses (1–2 km) of predominantly felsic volcanic rocks accumulated over a large area of the central Chukchi segment (Akinin & Miller, Reference Akinin and Miller2011; Tikhomirov et al. Reference Tikhomirov, Kalinina, Moriguti, Makishima, Kobayashi, Cherepanova and Nakamura2012). This has been interpreted to represent catastrophic Plinian-type volcanism that was comparable in volume, duration and composition to that of a silicic large igneous province (Tikhomirov et al. Reference Tikhomirov, Kalinina, Moriguti, Makishima, Kobayashi, Cherepanova and Nakamura2012).
A lack of ash deposits to the west of the OCVB has been interpreted as evidence of predominant Late Cretaceous winds from NE Russia towards Alaska (Spicer & Herman, Reference Spicer and Herman2010), and by extension, the Sverdrup Basin. Numerous bentonites have been reported from Upper Cretaceous strata on the North Slope of Alaska (Seabee, Schrader Bluff, Prince Creek formations and the Hue Shale; e.g. Molenaar et al. Reference Molenaar, Bird, Kirk, Taileur and Weimer1987; Mull et al. Reference Mull, Houseknecht and Bird2003) and the Mackenzie Delta area, Canada (Boundary Creek and Smoking Hills sequences; Dixon, Reference Dixon1996, pp. 73–4), which have been suggested to have originated from the OCVB (e.g. Miller et al. Reference Miller, Gelman, Parfenov, Hourigan, Miller, Grantz and Klemperer2002; Bergman et al. Reference Bergman, Akinin, Decker, Miller and Layer2006; Houseknecht & Bird, Reference Houseknecht, Bird, Spencer, Embry, Gautier, Stoupakova and Sørensen2011). Large volcanic eruptions, of Plinian to ultra-Plinian scale, injecting volcanic ash high into the stratosphere would have been required to facilitate volcanic ash transportation over such great distances. It is feasible, that during 89–84 Ma, intense volcanism within the OCVB resulted in substantial volcanic ash being injected into the stratosphere, leading to widespread volcanic ash dispersal across Arctic Alaska and Canada, reaching as far east as the Sverdrup Basin (Fig. 11).
6. Conclusions
Two distinct types of bentonite are identified within the Kanguk Formation on the basis of whole-rock geochemical analyses from an outcrop section in the Sawtooth Range, Ellesmere Island. Numerous relatively thick (~10–500 cm) peralkaline rhyolitic to trachytic bentonites possessing geochemical affinities consistent with an intraplate tectonic setting occur at several levels within an upper Turonian to lower Campanian outcrop section. These are likely the products of local volcanism associated with the alkaline phase of the HALIP. Thinner (<5 cm) subalkaline dacitic to rhyolitic bentonites are consistent with an active continental margin setting. From the available data, these appear to be confined to the upper Turonian to lower Coniacian. The lack of nearby potential sources of subalkaline magmatism, together with the thinner bed thickness of the subalkaline bentonites, supports a more distal source area. The age and geochemistry of the subalkaline bentonites correlate with an interval of intense volcanism in the OCVB, Russia. Numerous bentonites have been reported from Upper Cretaceous strata on the North Slope of Alaska and in the Mackenzie Delta area, which have been suggested to have originated from the OCVB by other workers (e.g. Miller et al. Reference Miller, Gelman, Parfenov, Hourigan, Miller, Grantz and Klemperer2002; Bergman et al. Reference Bergman, Akinin, Decker, Miller and Layer2006; Houseknecht & Bird, Reference Houseknecht, Bird, Spencer, Embry, Gautier, Stoupakova and Sørensen2011). It is proposed that during early Coniacian times intense volcanism within this volcanic belt resulted in widespread volcanic ash dispersal across Arctic Alaska and Canada, reaching as far east as the Sverdrup Basin.
Author ORCIDs
Michael A Pointon, 0000-0003-1992-0053; Michael J Flowerdew, 0000-0002-9710-2593; Peter Hülse, 0000-0002-0264-7583; Simon Schneider, 0000-0001-6493-357X; Martin J Whitehouse, 0000-0003-2227-577X
Acknowledgements
Jason Day and Giulio Lampronti (both University of Cambridge) are thanked for help with sample separation and XRD analysis, respectively. Kerstin Lindén is thanked for assistance at the NORDSIM facility. Constructive comments on an earlier version of this manuscript by Mike Curtis, Simon Passey and Andy Whitham (all CASP) are appreciated. Thomas Hadlari and Bill Davis are thanked for their constructive reviews and thought-provoking comments. Thanks to Magda Biszczuk (CASP) for help with the plate reconstructions and other GIS wizardry. This research was funded by CASP’s industrial sponsors. This is NORDSIM publication # 607.
Supplementary material
To view supplementary material for this article, please visit https://doi.org/10.1017/S0016756819000414


