


1. Introduction
Many Fe and Cu skarn deposits occur at or near contact zones between carbonate rocks and igneous intrusions (Meinert, Dipple & Nicolescu, Reference Meinert, Dipple and Nicolescu2005). However, some skarn-type Pb–Zn–Ag deposits are hosted in carbonate rocks and are relatively far from any direct influence of an intrusive mass. These skarn deposits are characterized by manganese skarn minerals (rhodonite, bustamite and vogtite) and are defined as distal skarn-type Pb–Zn deposits (Meinert, Reference Meinert1987; Meinert, Dipple & Nicolescu, Reference Meinert, Dipple and Nicolescu2005).
There are three predominant mechanisms responsible for the formation of skarn deposits: (1) fluid phase separation; (2) mixing of fluids; and (3) interaction between fluids and wallrock (Ahmad & Arthur, Reference Ahmad and Arthur1980; Wilkinson, Reference Wilkinson2001; Peter et al. Reference Peter, Jaroslav, Andrew and Anthony2004). Many workers (González-Partida & Camprubí, Reference González-Partida and Camprubí2006; Bertelli et al. Reference Bertelli, Baker, Cleverley and Ulrich2009; Kamvong & Zaw, Reference Kamvong and Zaw2009; Mollai, Sharma & Pe-Piper, Reference Mollai, Sharma and Pe-Piper2009; Canet et al. Reference Canet, González-Partida, Camprubí, Castro-Mora, Romero, Prol-Ledesma, Linares, Romero-Guadarrama and Sánchez-Vargas2011; Palinkas et al. Reference Palinkas, Palinkas, Renac, Spangenberg, Lueders and Molnar2013; Yang et al. Reference Yang, Ye, Cheng and Bao2013) have studied the origin of ore-forming fluids and the depositional mechanisms of some Pb–Zn skarn deposits based on the skarn mineral compositions (e.g. garnet and diopside), isotopic compositions (C, H, O and S isotopes) of minerals, such as hedenbergite, quartz, calcite and sulphides, and fluid inclusion geochemistry. These studies have shown that sulphide mineralization can occur during different ore-forming processes, including fluid–rock interaction (Bertelli et al. Reference Bertelli, Baker, Cleverley and Ulrich2009), fluid boiling (Mollai, Sharma & Pe-Piper, Reference Mollai, Sharma and Pe-Piper2009; Canet et al. Reference Canet, González-Partida, Camprubí, Castro-Mora, Romero, Prol-Ledesma, Linares, Romero-Guadarrama and Sánchez-Vargas2011) and fluid mixing between magmatic and meteoric fluids (González-Partida & Camprubí, Reference González-Partida and Camprubí2006; Kamvong & Zaw, Reference Kamvong and Zaw2009; Palinkas et al. Reference Palinkas, Palinkas, Renac, Spangenberg, Lueders and Molnar2013; Yang et al. Reference Yang, Ye, Cheng and Bao2013). Therefore, the origin of the fluid and precipitation mechanisms responsible for the formation of the sulphide mineralization are the subject of considerable debate.
The Luziyuan skarn-type Pb–Zn deposit was discovered in 2006 in the Baoshan–Narong–Dongzhi block metallogenic belt (BND belt) in Yunnan Province, China. The current reserves are estimated at 1.9 Mt of Pb + Zn metal in ores with a Pb grade of 0.6–5.2 % and a Zn grade of 1.6–13.2 %. The geological features of the deposit have been well characterized by many researchers because of its local and regional economic importance in the BND belt (Zhao, Lu & Xie, Reference Zhao, Lu and Xie2002; Dong & Chen, Reference Dong and Chen2007; Yang & Luo, Reference Yang and Luo2011; Ye et al. Reference Ye, Cook, Ciobanu, Liu, Zhang, Liu, Gao, Yang and Danyushevskiy2011a; Ye, Yang & Bao, Reference Ye, Yang and Bao2011b; Yang et al. Reference Yang, Ye, Cheng, Bao and Gao2012; Cang, Deng & Wang, Reference Cang, Deng and Wang2013; Deng, Li & Wen, Reference Deng, Li and Wen2013; Lin et al. Reference Lin, Deng, Sha and Liang2013; Ye, Bao & Yang, Reference Ye, Bao and Yang2013). However, to date, only two studies (published in Chinese only) have examined the fluid inclusions and ore deposit genesis (Xia, Chen & Lu, Reference Xia, Chen and Lu2005; Cang, Deng & Wang, Reference Cang, Deng and Wang2013).
The present study provides fluid inclusion and stable isotope data obtained from both ore and gangue minerals from the Luziyuan deposit. The purpose of this paper is to provide a better understanding of the origin of the ore-forming fluid and to discuss the general mechanisms that control the formation of the skarn-type deposit at Luziyuan.
2. Geological setting
2.a. Regional geology
The Luziyuan skarn-type Pb–Zn deposit is hosted in the BND belt of the Dian-Tai-Ma metallogenic province (Fig. 1). The BND belt is bounded to the west by the Nujiang abyssal fault and to the east by the Kejie fault. It is the main metallogenic belt between the Tengchong terrane and Changning–Menglian suture zones. This belt hosts two similar skarn-type deposits (Fig. 1), the Hetaoping and the Jinchang skarn-type Pb–Zn deposits, both of which have been discussed in several previous studies (Chen, Lu & Xia, Reference Chen, Lu and Xia2005; Zhu, Han & Xue, Reference Zhu, Han and Xue2006; Xue, Han & Yang, Reference Xue, Han and Yang2008; Chen, Huang & Lu, Reference Chen, Huang and Lu2009; Han, Reference Han2010; Gao et al. Reference Gao, Ye, Cheng and Yang2011; Xue et al. Reference Xue, Han, Huang, Li and Dong2011; Yang et al. Reference Yang, Ye, Cheng and Bao2013).
Figure 1. Regional geological setting of the Luziyuan skarn-type Pb–Zn deposit within the Baoshan–Narong–Dongzhi (BND) belt (adapted from Ye et al. Reference Ye, Cook, Ciobanu, Liu, Zhang, Liu, Gao, Yang and Danyushevskiy2011a). The small box shown is expanded in Figure 2.
There is evidence of minor intermediate to felsic igneous activity in the Luziyuan ore district, of which the Muchang alkaline granite is the most conspicuous example. The Muchang granite is characterized by high FeOt/MgO and 10000*Ga/Al ratios with A-type granite affinities (Ye et al. Reference Ye, Gao, Cheng, Yang and Tao2010). Dating of zircons from the intrusion indicates an age of 266 ± 5.4 Ma (U–Pb, laser ablation – inductively coupled plasma – mass spectrometry (LA-ICP-MS)) (Ye et al. Reference Ye, Gao, Cheng, Yang and Tao2010). However, the Luziyuan Pb–Zn mineralization (which has a Sm–Nd age of 183 ± 2.3 Ma, Yanshanian; Yang, Reference Yang2013) was not associated with the Muchang intrusion. Additionally, an unexposed intermediate-acidic intrusion in the Luziyuan mining area is considered to be related to the Muchang intrusion and a product of mid-Permian igneous activity (Ye et al. Reference Ye, Gao, Cheng, Yang and Tao2010). The gravity low anomaly and negative aeromagnetic anomaly were found in the Luziyuan area and have been interpreted to be linked to the concealed intrusion (Li & Mo, Reference Li and Mo2001; Zhao, Lu & Xie, Reference Zhao, Lu and Xie2002; Dong & Chen, Reference Dong and Chen2007).
2.b. Geology of the Luziyuan deposit
The Luziyuan skarn-type Pb–Zn deposit consists of three orebodies (I, II, III) from the northwest to the southeast (Fig. 2a). Field surveys at 1220 m, 1265 m and 1495 m above sea level (asl) of the second orebody (II) indicate that the deposit has a predominantly stratiform architecture, with parallel sedimentary layers (Fig. 2b). The deposit is hosted by upper Cambrian rocks, including marble and slate of the Shahechang Formation, and is relatively far from the concealed intermediate-acidic intrusion, a feature shared by other distal skarn-type Pb–Zn deposits (Einaudi, Meinert & Newberry, Reference Einaudi, Meinert and Newberry1981; Shimizu & Ilyama, Reference Shimizu and Ilyama1982; Yun & Einaudi, Reference Yun and Einaudi1982; Meinert, Reference Meinert1987; Meinert et al. Reference Meinert, Hedenquist, Satoh and Matsuhisa2003; Williams-Jones et al. Reference Williams-Jones, Samson, Ault, Gagnon and Fryer2010; Palinkas et al. Reference Palinkas, Palinkas, Renac, Spangenberg, Lueders and Molnar2013). The country rock was subjected to widespread skarn alteration, and field surveys conducted in this study showed that, based on variations in the mineral assemblage, there were three different alteration zones at different depths, as follows (Figs 2b, 3): (1) an actinolite zone (1495 m asl) – chlorite–actinolite–calcite–quartz; (2) a rhodonite zone (1265 m asl) – rhodonite–actinolite–fluorite–quartz–calcite; and (3) a garnet zone (1220 m asl) – garnet–rhodonite–actinolite–fluorite–quartz– calcite.
Figure 2. (a) Geological map of the Luziyuan deposit and (b) representative cross-section A–B through the deposit, showing the geometry of the orebodies, vertical skarn zonation and the location of samples collected for this study. The Huoshaoqiao Formation comprises argillaceous siltstone; the Pupiao Formation comprises meta-siltstone with intercalated meta-quartz–arenite; the Baoshan Formation comprises silty slate with intercalated argillaceous limestone; the third Member of the Shahechang Formation comprises schist with intercalated marble; the first layer of the second Member of the Shahechang Formation comprises limestone with minor siltstone, and the second layer comprises marble and quartz schist (redrawn after Lü, Deng & Hu, Reference Lü, Deng and Hu2013).
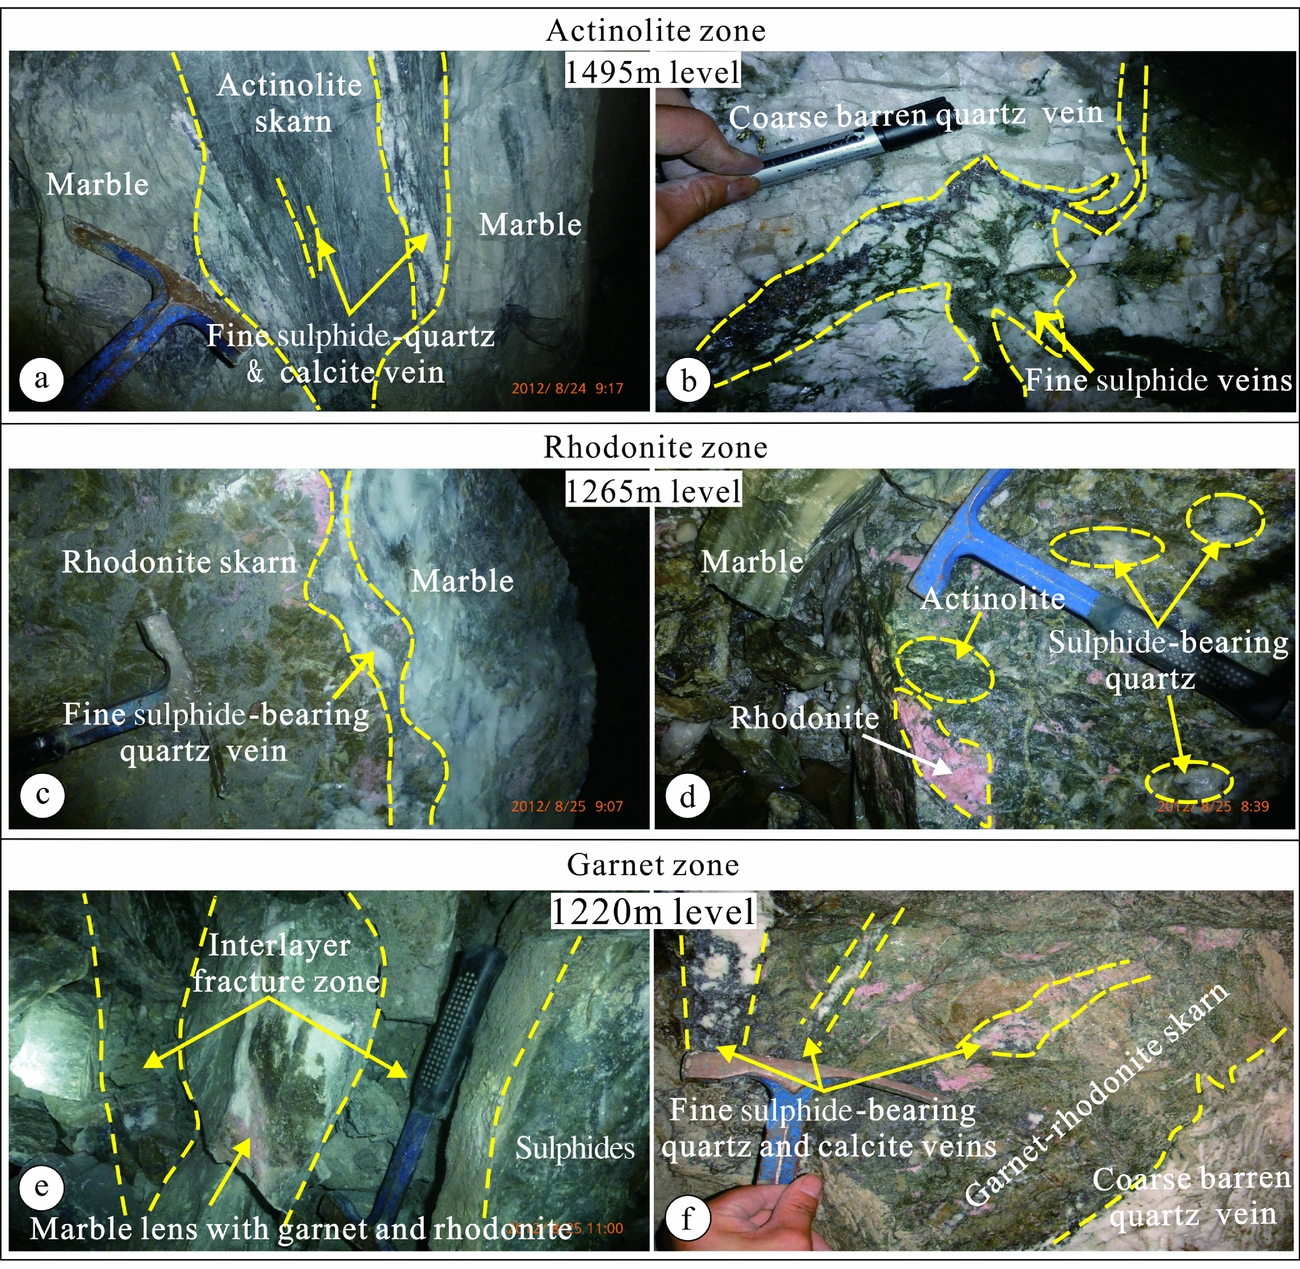
Figure 3. Photographs of Pb–Zn mineralization, skarnification and quartz veins from 1495 m, 1265 m and 1220 m asl in the Luziyuan orebody. (a) The 1495 m level shows replacement of carbonate host rocks by actinolite skarn and fine sulphides, quartz and calcite. (b) Coarse barren quartz vein cut by fine sulphide vein. (c) The 1265 m level shows a mineralized quartz vein with skarn replacement from the front towards the marble host rock. (d) Rhodonite relics replaced by actinolite, which was in turn replaced by sulphide-bearing quartz. (e) The 1220 m level shows a marble lens with rhodonite and actinolite in the interlayer fracture zone. (f) Garnet–rhodonite skarn cut by several fine sulphide-bearing quartz and calcite veins, replaced by coarse barren quartz veins.
The distinguishing criterion of the zone 1 assemblage is actinolite–chlorite, which is abundant in the upper part of the skarn system (1495 m), where it forms veins several centimetres to several metres wide around the No. II orebody (Fig. 3a). Sulphide mineralization (sphalerite, galena and chalcopyrite) occurs as fine-grained veins in zone 1 (Fig. 3a) and cuts the early coarse-grained barren quartz veins (Fig. 3b). The zone 2 assemblage is found at a depth of 1265 m and is based on the occurrence of rhodonite, which forms a c. 50 m wide zone around the No. II orebody, thereby constituting the central part of the skarn system. Moving away from the orebody, the skarn zones occur in the following sequence: rhodonite–actinolite to quartz veins to marble (Fig. 3c). It is evident that the rhodonite in the zone 2 assemblage was replaced by actinolite (Fig. 3d). At a depth of 1220 m, pale green garnets, which are considered indicative of the zone 3 assemblage, are abundant (Fig. 3e). The zone 3 assemblage is typically c. 5 m wide, and the garnet–rhodonite assemblage was also replaced by the actinolite and coarse-grained barren quartz veins that are characteristic of the zone 1 assemblage (Fig. 3f). Several fine-grained sulphide-bearing quartz and calcite veins also cut across the garnet–rhodonite skarn at 1220 m.
2.c. Paragenetic relationship between skarn and ore minerals
Skarn alteration is the main form of alteration throughout the BND belt district (Fig. 3) and is represented by anhydrous (garnet, rhodonite and bustamite) and hydrous (actinolite and chlorite) skarn minerals. The ore mineral assemblage is predominantly sphalerite–galena–chalcopyrite–quartz–calcite with distinct zoning: garnet to rhodonite–bustamite, followed by sphalerite–galena–chalcopyrite–quartz–calcite actinolite–chlorite, and then marble (Fig. 3c).
Petrographic studies have demonstrated that anhydrous skarn minerals (garnet, rhodonite and bustamite) are partly replaced by hydrous skarn minerals (actinolite and chlorite). In addition, the coarse-grained barren quartz veins replaced garnet–rhodonite–bustamite–actinolite skarn, and fine-grained sulphide-bearing quartz and calcite veins cut coarse-grained barren quartz veins and garnet–rhodonite–bustamite–actinolite skarn. The following vein paragenesis is determined in the ore district based on cross-cutting relationships: (1) garnet–rhodonite–bustamite–actinolite skarn (Fig. 3c, d, f); (2) coarse-grained barren veins (Fig. 3b, f); and (3) fine-grained sulphide-bearing quartz and calcite veins (Fig. 3a, e).
The following paragenetic stages of ore and gangue mineral formation have been determined from field and petrographic evidence. The anhydrous skarn-forming stage (Stage 1) (mainly rhodonite) was followed by hydrous skarn minerals (mainly actinolite) (Stage 2) and then by the early quartz stage (Stage 3), represented by the coarse barren quartz veins. Stage 4 is represented by the formation of sulphides (galena, sphalerite and minor chalcopyrite), quartz and calcite. Stages 3 and 4 are the main focus of this study. Figure 4 illustrates a simplified paragenetic sequence for the skarn mineral assemblages and ore sulphides within the Luziyuan deposit.
Figure 4. Generalized paragenetic sequence for skarn minerals and sulphides at the Luziyuan deposit.
3. Materials and methods
To study the Stage 1 and Stage 2 skarn minerals, two samples (LZY12-34 and LZY12-3) were selected. Sample LZY12-34 represents the textural relationship between rhodonite and actinolite, and sample LZY12-3 represents the textural relationship between actinolite and the sulphides.
To study the fluid inclusions associated with Stages 3 and 4, seven samples of the ore assemblages were gathered from three different levels (1495 m, 1265 m and 1220 m) of the No. II orebody. These samples represent two stages (3 and 4), i.e. the coarse-grained barren veins and fine-grained sulphide-bearing quartz and calcite veins.
Five samples of the Stage 3 quartz samples in the No. II orebody and five samples of the quartz, calcite and sphalerite from the Stage 4 (sulphide-forming stage) minerals were obtained for H–O isotope analyses. From these samples, it was possible to characterize the origin of mineralizing fluid in Stages 3 and 4. In addition, 38 sulphur isotope analyses were carried out on 35 samples of sulphide ore and 3 gypsum samples of country rock from the No. II orebody. Some sample locations are shown in Figure 2b.
3.a. Mineral chemistry analysis
Mineral chemistry analyses of skarn minerals from Stages 1 and 2 were determined by a Coherent GeoLasPro 193 nm Laser Ablation system coupled with an Agilent 7700× ICP–MS at the State Key Laboratory of Ore Deposit Geochemistry, Institute of Geochemistry, Chinese Academy of Sciences, Guiyang, China. Helium was applied as a carrier gas, and argon was used as the make-up gas and mixed with the carrier gas via a T-connector before entering the ICP. The working parameters of the laser instrument were as follows: laser beam (32 um in diameter), repetition rate of 4 Hz, and energy density of 1–45 J cm−2. The acquisition of data during each analysis took 60 s (20 s on background; 40 s on signal). Major contents were calibrated against multiple-standards (GSE-1G, CGSG-1 and CGSG-2). Every ten sample analyses were followed by one analysis of GSE-1G as a quality control to correct the time-dependent drift of sensitivity and mass discrimination. Detailed analytical and data-processing methodology is described by Liu et al. (Reference Liu, Hu, Gao, Günther, Xu, Gao and Chen2008). The raw ICP-MS data were treated offline using the ICPMSDataCal software (Liu et al. Reference Liu, Hu, Gao, Günther, Xu, Gao and Chen2008).
3.b. Microthermometry analysis
The microthermometry investigation of fluid inclusions focused on seven samples from Stages 3 and 4 (Table 1), and all analyses were performed on fluid inclusions hosted by quartz, calcite and sphalerite using a heating–freezing stage (Linkam THMSG-600) at the State Key Laboratory of Ore Deposit Geochemistry, Chinese Academy of Sciences, Guiyang, China. The temperature range of the instrument is −196 to +600 °C, and the precision and accuracy of the microthermometry measurements, based on standard calibration procedures, was estimated to be ±2 °C for homogenization temperatures and ±0.1 °C for last ice-melting temperatures. Salinity estimates were determined from the last melting temperature of ice for the NaCl–H2O system (Bodnar, Reference Bodnar1993). Given that calcite and sphalerite are relatively soft minerals, freezing of inclusions can lead to expansion and stretching, enlarging the vapour bubble. To avoid false homogenization temperatures, the homogenization temperature measurements were performed before the ice-melting temperature measurements. For homogenization, the temperature was initially increased at a rate of 20 °C min−1 until the vapour bubble began to disappear. Thereafter, the heating rate was reduced to 0.5 °C min−1 until the bubble completely disappeared. When the homogenization temperature measurements were completed, the temperature was decreased to −160 °C at a rate of 20 °C min−1 to assure completely frozen inclusions and was then slowly increased at a rate of 10 °C min−1. Once the ice began to melt, the rate of heating was decreased to 0.1 °C min−1. The temperature at which the last ice melted indicated the freezing-point depression of the fluid inclusions.
Table 1. Representative LA-ICP-MS analyses of rhodonites.
All Fe as FeO; cation proportions on the basis of 12 oxygens.
3.c. Laser Raman spectroscopy analysis
The compositions of selected individual fluid inclusions were determined at the State Key Lab for Mineral Deposit Research, Nanjing University, China, using a Raman microprobe (Renishaw RM2000) with an Ar ion laser. A surface power of 5 mW was used with a laser wavelength of 514.5 nm, the detector charge-coupled device (CCD) area was 20 μm2, and the scanning range of the spectra was set to between 200 and 4000 cm−1, with an accumulation time of 30 s for each scan.
3.d. Stable isotope analysis
The hydrogen isotopic compositions of the fluid inclusions and the oxygen isotopic composition of the host quartz were determined for Stages 3 and 4 (Table 4, further below). Sulphur isotope analysis focused on chalcopyrite, sphalerite, galena from sulphide ores, and gypsum of country rock (Table 5, further below). To prepare monomineralic samples, coarse purified quartz, sulphide and sulphate minerals were first separated by handpicking under a binocular microscope and then crushed and sieved. Finally, they were treated in dehydrated ethanol to remove any impurities.
For the oxygen isotope analysis, 1 g of a 200-mesh quartz sample was used, and oxygen extracted using the BrF5 method described by Clayton & Mayeda (Reference Clayton and Mayeda1963). The resultant oxygen was reacted with graphite rods to produce carbon dioxide. The oxygen isotopic compositions were determined at the State Key Laboratory of Isotopic Geology of the Ministry of Land and Resources, Beijing, China, using a stable isotope mass spectrometer (MAT-253EM). The results are given relative to V-SMOW (Vienna Standard Mean Ocean Water) (Craig, Reference Craig1961; Baertschi, Reference Baertschi1976), with a precision of ±0.2 ‰.
For the hydrogen isotope analysis, 2–3 g of a 40- to 80-mesh quartz sample was prepared. The samples were heated in an induction furnace to decrepitate fluid inclusions and release the water. The water was reduced with Zn metal in a sealed tube at 450 °C (Coleman et al. Reference Coleman, Sheppard, Durham, Rouse and Moore1982). The hydrogen isotopic compositions were also analysed with a stable isotope mass spectrometer (MAT-253EM) at the State Key Laboratory of Isotopic Geology of the Ministry of Land and Resources. The δD values are also reported relative to V-SMOW, with an analytical precision of ±2 ‰.
For the sulphur isotope analysis, 0.05 g of a 200-mesh sulphide and gypsum samples were prepared. Each sample was reacted with Cu2O powder to produce SO2 following the technique of Robinson & Kusakabe (Reference Robinson and Kusakabe1975). The SO2 gas was gathered and purified to analyse the sulphur isotope compositions using a mass spectrometer (MAT252) at the State Key Laboratory of Ore Deposit Geochemistry, Chinese Academy of Sciences. The analytical results are reported relative to CDT (Canyon Diablo Troilite), with a precision of ±0.2 ‰.
4. Results
4.a. Rhodonite textural investigation
The textural relationship between rhodonite and other minerals was investigated in detail in this study. Exsolution textures between rhodonite and bustamite were photographed (Fig. 5d), and overprinting of sulphide and hydrous skarn minerals is also evident (Fig. 5e–h).
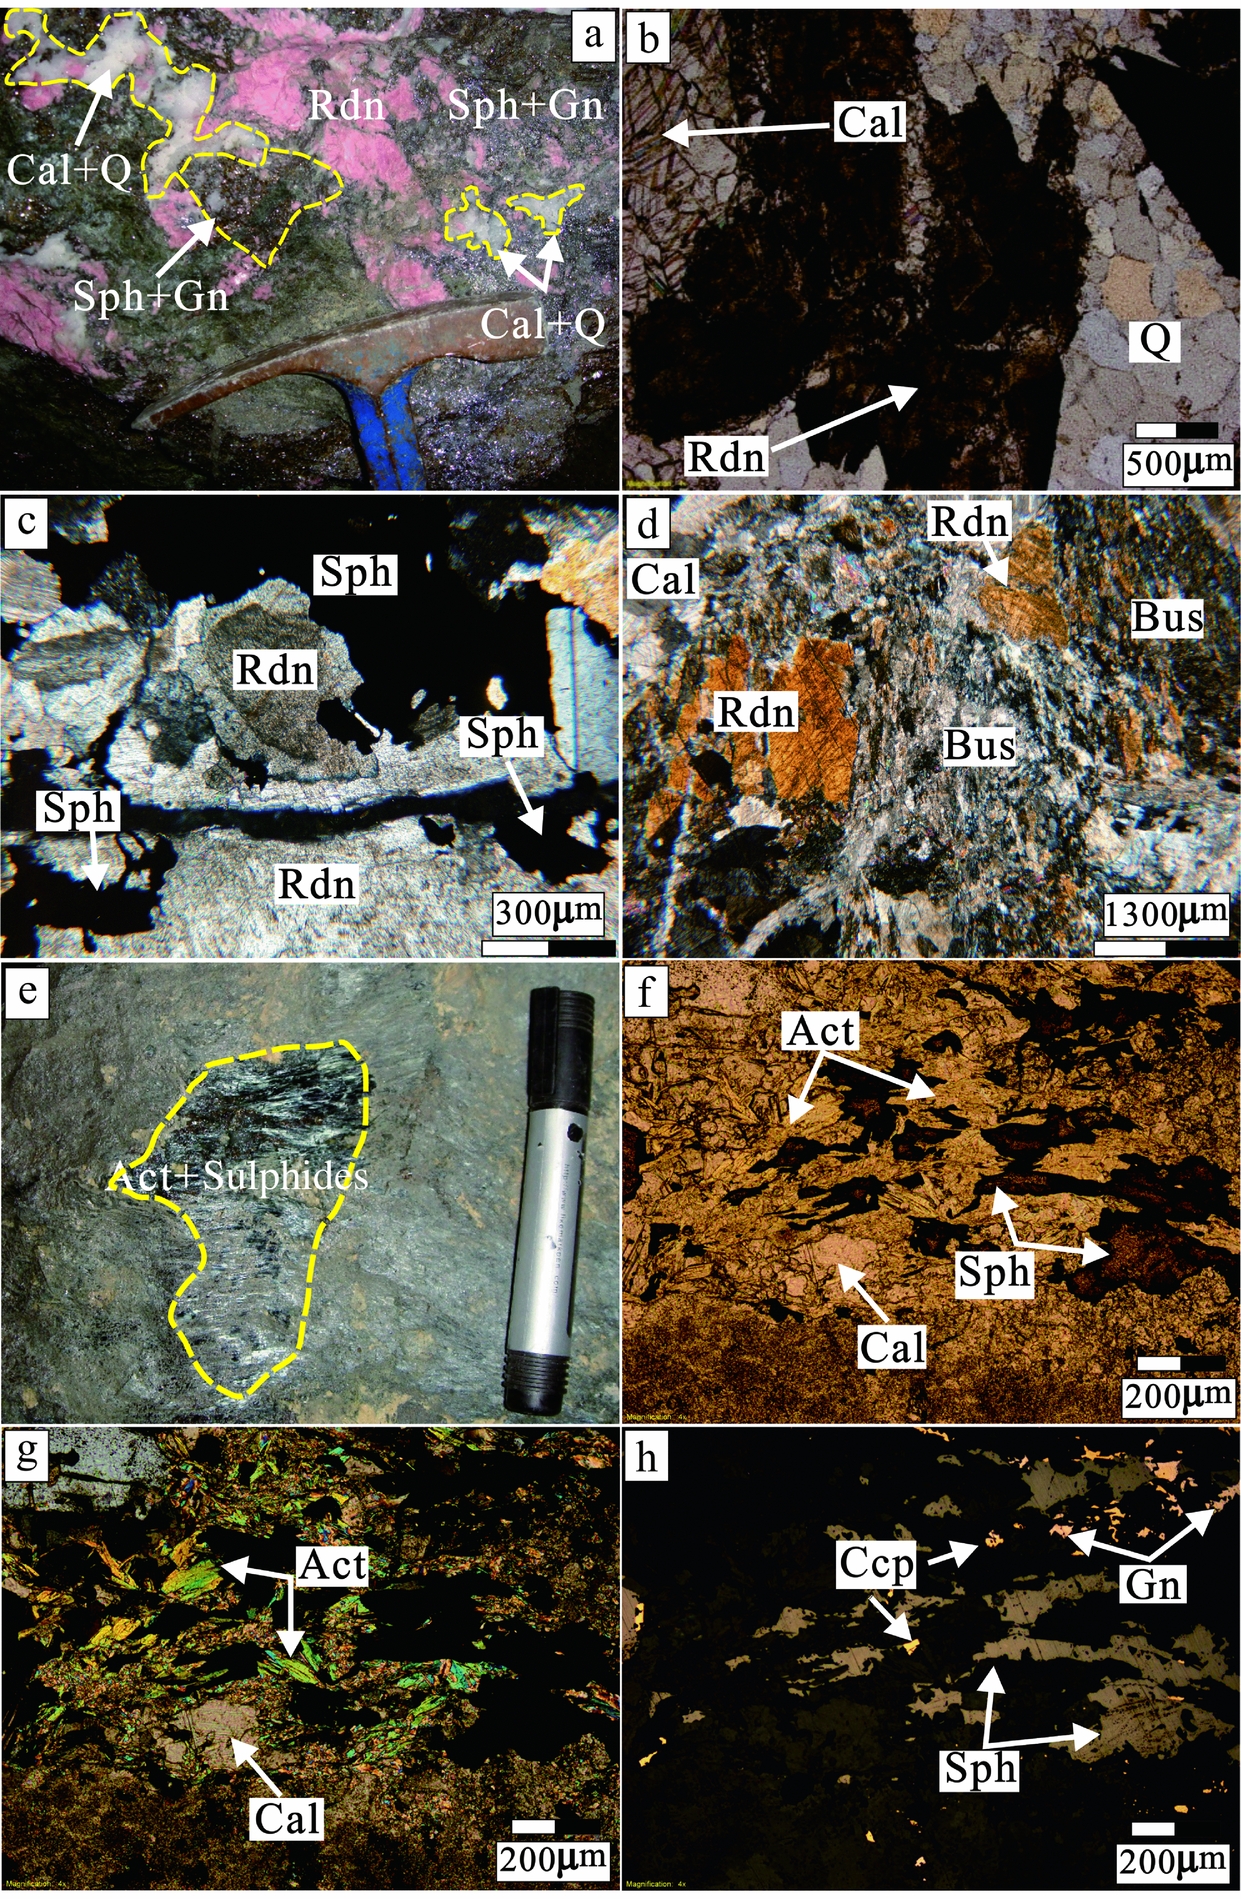
Figure 5. Macroscopic and microscopic features of skarn mineralization from the Luziyuan deposit. (a) Pink rhodonite overprinted by a quartz–calcite–sphalerite–galena assemblage. (b) Replacement of rhodonite by quartz and calcite along the cleavage plane under plane-polarized light. (c) Columnar rhodonite crystal (first-order grey to orange interference colour) replaced by sphalerite under crossed nicols. (d) Numerous fibrous bustamite coexists with prismatic rhodonite (orange interference colour) under crossed nicols. (e) Typical sulphide mineralization shown by small grains infilling fibrous actinolite aggregate. (f) Sulphide infilling between actinolite under plane-polarized light showing that the formation of sulphides was later than actinolite formation. (g) Actinolite showing secondary interference colours blue and green under crossed nicols. (h) Sphalerite, galena and chalcopyrite infilling between actinolite under reflected light (Rdn – rhodonite, Bus – bustamite, Act – actinolite, Q – quartz, Cal – calcite, Ccp – chalcopyrite, Sph – sphalerite, Gn – galena).
The evidence from both hand specimens and thin sections indicates that Stage 1 skarn minerals (rhodonite) coexisted with fibrous skarn minerals (bustamite), suggesting an exsolved textural relationship between rhodonite and bustamite. Rhodonite has MnSiO3 contents of 66.1–77.7 mole %, CaSiO3 contents of 19.2–28.2 mole % and (Fe, Mg)SiO3 contents of 7.1–14.2 mole % (Table 1). Bustamite has MnSiO3 contents of 54.0–65.3 mole %, CaSiO3 contents of 28.1–32.8 mole %, and (Fe, Mg)SiO3 contents of 5.2–15.0 mole % (Table 2). In hand specimen (Fig. 5a), rhodonite has a prismatic crystal shape, is pink in colour, and occurs as relict within the actinolite zone. In thin sections (Fig. 5b–d), calcite, quartz and sphalerite replace rhodonite along cleavage planes.
Table 2. Representative LA-ICP-MS analyses of bustamites and actinolites.
All Fe as FeO; cation proportions on the basis of 12 oxygens.
Sample LZY12-3 shows fibrous and radiating aggregates (10 cm wide) within the marble (Fig. 5e), and sphalerite, galena and chalcopyrite occur commonly as interstitial grains or scattered crystals between the fibrous minerals (Fig. 5f–h). These fibrous minerals were determined to be actinolite with concentrations of 10.1–11.1 mole % MnSiO3, 26.9–27.4 mole % CaSiO3, and 62.2–63.2 mole % (Fe, Mg)SiO3 (Table 2).
4.b. Fluid inclusion studies
4.b.1. Fluid inclusion petrography
Owing to the lack of fluid inclusions in Stages 1 and 2, only fluid inclusions from Stages 3 and 4 were investigated in this study. Based on the number of constituent phases observed at room temperature (Roedder, Reference Roedder1984: 12–26), combined with microthermometric behaviour, two main types of fluid inclusions were recognized:
Type 1 refers to two-phase (vapour + liquid) aqueous inclusions. They are elliptical or circular in shape, and sizes vary between 8 and 25 μm in the longest dimension (Fig. 6c–j). The vapour phase was estimated to occupy 10–50 vol. % of the inclusion. Total homogenization of all Type 1 inclusions was to the liquid phase. The Type 1 fluid inclusions occur in Stages 3 and 4.
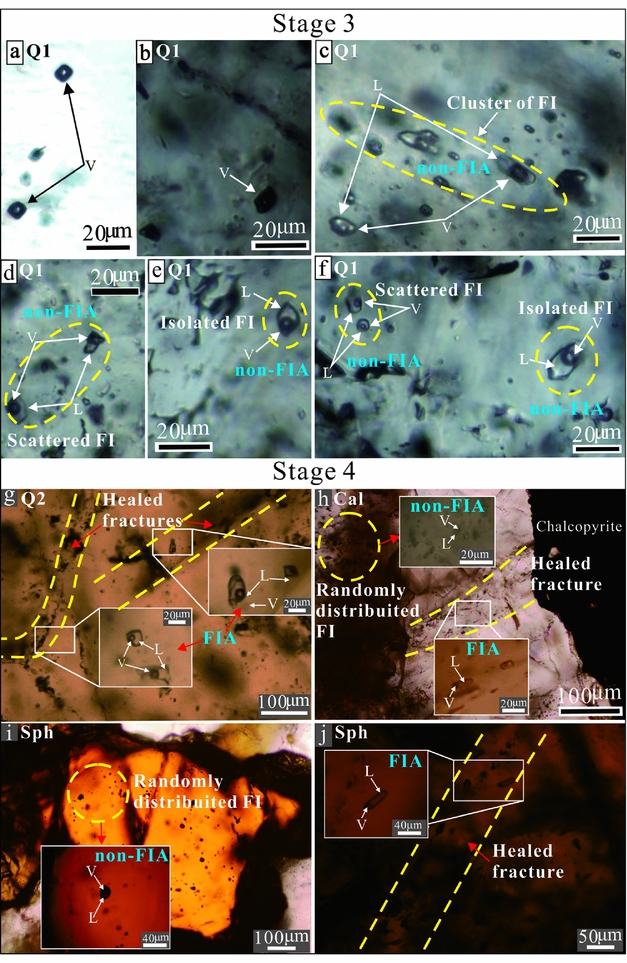
Figure 6. Photomicrographs of non-FIAs and FIAs hosted by quartz, calcite and sphalerite from Stages 3 and 4. (a, b) Type 2 non-aqueous fluid inclusions occur as negative shapes trapped in Stage 3 quartz. (c–f) Fluid inclusions (Type 1) within non-FIA hosted by Stage 3 quartz occur as clusters (scattered, isolated). (g) Fluid inclusions (Type 1) in Stage 4 quartz occur as FIAs along the subparallel transgranular planar arrays. (h) Fluid inclusions (Type 1) in Stage 4 calcite occur as non-FIA in random distribution, and fluid inclusions (Type 1) occur as FIA along the healed fractures. (i) Fluid inclusions (Type 1) occur as non-FIA randomly distributed in the Stage 4 sphalerite. (j) Fluid inclusions (Type 1) occur as FIA along the subparallel transgranular planar arrays in the Stage 4 sphalerite. Non-FIA – non-fluid inclusion assemblage; FIA – fluid inclusion assemblage.
Type 2 represents elliptical to well-rounded, non-aqueous inclusions. They show one phase of vapour at room temperature, ranging in size from 8 to 10 μm in the longest dimension (Fig. 6a, b). Notably, the Type 2 fluid inclusions are of rare occurrence and occur only in Stage 3.
Fluid inclusion assemblage (FIA) refers to discriminating a group of petrographically associated fluid inclusions (Goldstein & Reynolds, Reference Goldstein and Reynolds1994: 77–9). A FIA implies that the inclusions are cogenetic, forming at the same time and from the same fluid. Fluid inclusions that occur within healed microfractures or within growth zones of host mineral are easily identified as FIA. However, not all fluid inclusions could be assigned to a FIA during this study. Only the secondary inclusions occurring along healed fractures are assigned the term FIA. Here we use the abbreviation ‘non-FIA’ to represent the fluid inclusions which occur as isolated, irregular clusters, randomly distributed and scattered (Chi & Lu, Reference Chi and Lu2008).
In Stage 3, Type 1 inclusions hosted in quartz usually show a primary origin and occur as irregular clusters (Fig. 6c), scattered (Fig. 6d) and isolated (Fig. 6e, f) with similar vapour-to-liquid (V/L) ratios (30–50 %), which represents non-FIAs (Fig. 6c–f). In Figure 6f, some Type 1 inclusions with relatively low V/L ratios (10–20 %) occur as scattered separated from isolated inclusions with V/L ratios (30–50 %) in the same grains.
In Stage 4, Type 1 inclusions hosted in calcite and sphalerite occur as non-FIAs and FIAs. The non-FIA inclusions usually occur as randomly distributed (Fig. 6h, i) and have consistent V/L ratios (V/L = 20–40 %). In contrast, the FIA inclusions occur in transgranular planar arrays or healed microcracks of quartz, calcite and sphalerite crystals (Fig. 6g, h, j). These secondary FIA inclusions have low V/L ratios (10–20 %), which represent fluid entrapment after mineral crystallization.
4.b.2. Microthermometry
The microthermometric results are evaluated by FIA in these host minerals (quartz, calcite and sphalerite). The microthermometric data for the fluid inclusions in this study are summarized in Table 3 and Figures 7 and 8.
Table 3. Summary of homogenization temperatures, salinities and pressures for the studied fluid inclusions.
IC = irregular cluster; I = isolated; S = scattered; RD = randomly distributed; HF = healed fracture; numbers in brackets represent inclusion numbers. HF is fluid inclusion assemblage (FIA), and the others are non-FIAs. FI = fluid inclusion; Lv = liquid-vapour fluid inclusions; T h = homogenization temperature; T m(ice) = temperature of final ice melting; P = minimum pressure; temperatures in °C; salinities in wt % NaCl equiv.
Figure 7. Histograms showing homogenization temperatures (Th) and salinity for non-FIA and FIA inclusions in the Luziyuan deposit. (a, b) Th and salinity histograms of non-FIA (I, C and S) inclusions in Stage 3 quartz; (c) d-Th and salinity histograms of non-FIA (RD) and FIA (HF) inclusions in Stage 4 calcite; (e) f-Th and salinity histograms of non-FIA (RD) and FIA (HF) inclusions in Stage 4 sphalerite; (g) h-Th and salinity histograms of FIA inclusions in Stage 4 quartz. I – isolated; IC – irregular cluster; S – scattered; RD – randomly distributed; HF – healed fracture; Q – quartz; Cal – calcite; Sph – sphalerite.
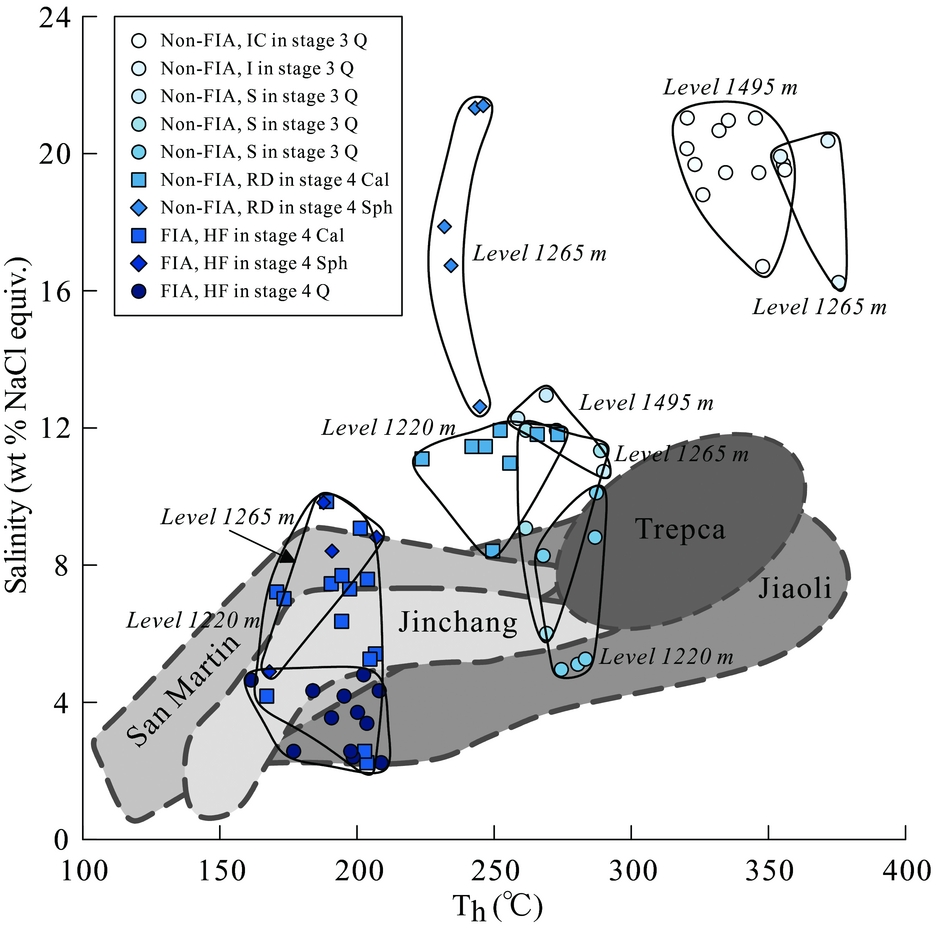
Figure 8. Homogenization temperature vs salinity for non-FIAs and FIAs in Stages 3 and 4 from different levels of the Luziyuan deposit together with data from other distal Pb–Zn skarn deposits, such as the Jinchang (Chen, Huang & Lu, Reference Chen, Huang and Lu2009), Jiaoli (Li & Zhao, Reference Li and Zhao2004), San Martin (González-Partida & Camprubí, Reference González-Partida and Camprubí2006). Abbreviations are the same as those in Figure 7.
In Stage 3, non-FIA (irregular clusters) inclusions record homogenization temperatures of 320–356 °C and salinities of 16.7–21.0 wt % NaCl equivalent (Table 3; Fig. 7a, b). Additionally, three non-FIA (isolated) inclusions have higher homogenization temperatures of 354–376 °C and similar salinities of 16.2–20.4 wt % NaCl equivalent (Table 3; Fig. 7a, b). In contrast, fluid inclusions from non-FIA (scattered) reveal low homogenization temperatures between 259 and 290 °C and low salinities varying between 5.0 and 13.0 wt % NaCl equivalent (Table 3; Fig. 7a, b).
In Stage 4, homogenization temperatures and salinities for non-FIA in calcite range from 224 to 273 °C and from 8.4 to 11.9 wt % NaCl equivalent, respectively (Table 3; Fig. 7c, d), which are similar values to those of non-FIA (scattered) in Stage 3, whereas fluid inclusions from FIA in calcite exhibit low homogenization temperatures (167–207 °C) and salinities (2.2–9.9 wt % NaCl equivalent). Non-FIAs in sphalerite have similar homogenization temperatures (232–246 °C) to inclusions in calcite, but higher salinities (12.6–21.4 wt % NaCl equivalent) (Table 3; Fig. 7e, f). FIA in sphalerite shows similar homogenization temperatures (168–207 °C) and salinities (4.9–9.8 wt % NaCl equivalent) to FIA in calcite (Table 3; Fig. 7e, f). FIA in quartz shows analogous homogenization temperatures (161–209 °C) and salinities (2.2–4.8 wt % NaCl equivalent) (Table 3; Fig. 7g, h) to calcite and sphalerite.
In the homogenization temperature v. salinity diagram (Fig. 8), the fluid inclusion data from the three minerals from Stages 3 and 4 show the following characteristics: for non-FIA inclusions in Stage 3 quartz, it seems that non-FIA (irregular cluster) fluid inclusion data for 1495 are the same as non-FIA (isolated) inclusion data for 1265, non-FIA (scattered) inclusion data are nearly the same for all three levels and have lower homogenization temperature and salinity compared to non-FIA (irregular cluster and isolated); non-FIA inclusions from the calcite and sphalerite in Stage 4 again show the same homogenization temperatures for 1220 and 1265 respectively; the secondary FIA inclusions in calcite, sphalerite and quartz are always lower in homogenization temperature and salinity compared to non-FIA inclusions for all levels.
4.b.3. Laser Raman spectroscopy
The gas compositions of representative fluid inclusions in quartz crystals from Stages 3 and 4 were determined by laser Raman spectroscopy. The analyses of Stage 3 non-aqueous fluid inclusions show that CH4 is the dominant component (Fig. 9a). The vapour phase composition of the Stage 4 aqueous two-phase (vapour–liquid) inclusions is mainly composed of H2O, with no other compressive volatile components (Fig. 9b).
Figure 9. Representative Raman spectra of fluid inclusions in quartz from Stages 3 and 4. (a) CH4 spectra of vapour in non-aqueous inclusions in quartz from Stage 3; (b) H2O spectrum of vapour in biphase (vapour + liquid) aqueous inclusions from Stage 4.
4.c. Stable isotope studies
4.c.1. Hydrogen and oxygen isotopes
The hydrogen isotopic composition of the fluid inclusions in quartz and the oxygen isotopic composition of the quartz grains from Stages 3 and 4 were investigated. The results of the analyses are summarized in Table 4. The oxygen isotopic composition of the fluid in equilibrium with the quartz was calculated using appropriate fractionation factors (see footnote to Table 4).
Table 4. Hydrogen isotopic composition of fluid inclusions hosted by quartz and oxygen isotope composition of quartz from the Luziyuan Pb–Zn skarn deposit.
Q1 = quartz hosted by Stage 3; Q2 = quartz hosted by Stage 4. δ18OH2O‰ values were calculated based on the quartz–H2O oxygen isotope fractionation equation of Zheng (Reference Zheng1993), and temperatures (T) are based on micothermometric data from non-FIA inclusions in Stages 3 and 4.
The calculated oxygen and hydrogen isotopic compositions of the fluid inclusions from Stage 3 quartz have similar δ18Ofluid values but much lower δD values (δ18Ofluid = 5.3–9.6 ‰, δD = −118 to −72 ‰) than magmatic water dissolved in felsic melts (δ18O = 5.5–10.0 ‰, δD = −50 to −85 ‰; Taylor, Reference Taylor1997). In contrast, the calculated oxygen and hydrogen isotopic compositions of the Stage 4 fluid yield much lower δ18Ofluid and δD values (δ18Ofluid = 2.7–3.7 ‰, δD = −109 to −85 ‰). The hydrogen isotopic compositions of the fluid inclusions in Stage 3 quartz (δD = −90.4 ± 19.4 ‰, n = 5) and Stage 4 quartz (δD = −99.0 ± 8.9 ‰, n = 5) are similar and have a wide range of values.
4.c.2. Sulphur isotopes
Sulphur isotope ratios for sulphides associated with the hydrothermal mineralization of the Luziyuan deposit are presented in Table 5. The δ34S values for the sulphides range from 9.9 to 14.2 ‰ and have a mean of 11.9 ‰ (n = 35). The δ34S values of these sulphides are much higher than the δ34S values published for major Pb–Zn skarn deposits in the BND belt, such as the Jinchang (Chen, Huang & Lu, Reference Chen, Huang and Lu2009) and Hetaoping deposits (Gao et al. Reference Gao, Ye, Cheng and Yang2011), and in other parts of the world, such as the Bajiazi (Zhao et al. Reference Zhao, Dong, Li and Bi2003) and Trepca deposits (Palinkas et al. Reference Palinkas, Palinkas, Renac, Spangenberg, Lueders and Molnar2013) (Table 5). Furthermore, the δ34S values of these sulphides have a prominent homogeneity and show a tower-like frequency distribution (Fig. 10). These results indicate that the δ34S values of sulphides are nearly consistent (chalcopyrite: 12.6 ± 0.94 ‰, sphalerite: 11.8 ± 0.87 ‰ and galena: 11.4 ± 0.93 ‰) and markedly lower than that of gypsum (16.9–17.1 ‰) samples from the host rock.
Table 5. Sulphur isotope data of sulphides from the Luziyuan Pb–Zn skarn deposit.
Figure 10. Frequency histogram of sulphur isotopes for chalcopyrite (Ccp), sphalerite (Sp), galena (Gn) and gypsum (Gp).
5. Discussion
5.a. Textural relationship between rhodonite and other minerals
The genesis and formation conditions of rhodonite have previously been investigated on the basis of petrography, theoretical considerations and experimental data (Abrecht & Peters, Reference Abrecht and Peters1980; Brown, Essene & Peacor, Reference Brown, Essene and Peacor1980; Winter, Essene & Peacor, Reference Winter, Essene and Peacor1981; Abrecht, Reference Abrecht1985, Reference Abrecht1989; Cabella, Gaggero & Lucchetti, Reference Cabella, Gaggero and Lucchetti1991; Mohapatraa & Nayak, Reference Mohapatra and Nayak2005). Those authors suggested that the complex genesis of rhodonite corresponds to different formation conditions (e.g. temperature, pressure, CO2 fugacity, O2 fugacity, water activity, and Mn2+/Ca2+ ratio in the fluid). Winter, Essene & Peacor (Reference Winter, Essene and Peacor1981) reported that the rhodonite–pyroxmangite transformation in the system MnSiO3 occurs at 575 °C for pressures of +8 to –9 kbar. Mohapatraa & Nayak (Reference Mohapatra and Nayak2005) studied the genesis of rhodonite from the metamorphosed Mn carbonate–silicate rocks, and considered that rhodonite was produced through the mineral reaction (Kutnahorite + Quartz → Rhodonite + CO2) and this mineral reaction is influenced by the protolithic bulk composition, variation in XCO2 (<0.2 to ~0.3) and different oxygen fugacities rather than the metamorphic temperature. Cabella, Gaggero & Lucchetti (Reference Cabella, Gaggero and Lucchetti1991) discussed the formation conditions of Mn–silicate and carbonate assemblages on the basis of the system SiO2–MnO–CaO–CO2–O2, and considered that braunite- rhodonite-, johannsenite- and calcite-bearing assemblages equilibrated through mineral reactions (e.g. braunite + quartz → rhodonite + O2) at constant P–T conditions (P = 2.5 ± 0.5 kbar; T = 275 ± 25 °C) as a result of progressive infiltration of Ca-rich, CO2-bearing, relatively reducing hydrous fluids. Abrecht (Reference Abrecht1989) reported that hydrous Mn-silicates (e.g. friedelite) were formed during retrograde metamorphism by alteration of anhydrous Mn-silicates (e.g. rhodonite) through mineral reaction (e.g. tephroite + rhodonite + H2O + HCl = friedelite). Abrecht (Reference Abrecht1985) investigated the formation conditions of two occurrences of rhodonite from the Pb–Zn–Cu skarn deposits from three mines (Empire Mine, New Mexico, USA; Monte Civillina, Italy; Valle del Temperino, Italy). One occurrence is that of submicroscopic intergrowths between prismatic rhodonite and fibrous bustamite, which was formed at the temperature below the clinopyroxene–bustamite stability field through mineral reaction (CaMnSi2O6 (cpx) + Mn(2+) = (Mn, Ca)SiO3(rdn) + Ca(2+)) due to increasing Mn activity in the hydrothermal solution. The other occurrence is euhedral rhodonite occurring together with calcite + quartz, which was formed at equilibrium temperatures (T = 385 °C), pressures (P = 1 kbar), and CO2 fugacity (XCO2 = 0.1) through mineral reaction (CaMnSi2O6 (cpx) + CO2 = MnSiO3 (rdn) + CaCO3 + SiO2).
Based on investigation of the formation conditions of rhodonite by the authors mentioned above, rhodonite in metamorphosed Mn deposits and Pb–Zn skarn deposits is formed by either phase transformation or mineral reactions corresponding to different formation conditions. However, the exsolution of the bustamite can lead to the formation of rhodonite, and its formation conditions have been discussed by some workers (Abrecht & Peters, Reference Abrecht and Peters1980; Brown, Essene & Peacor, Reference Brown, Essene and Peacor1980). Brown, Essene & Peacor (Reference Brown, Essene and Peacor1980) discussed the subsolidus phase relations in ternary systems (CaSiO3–MgSiO3–MnSiO3 and CaSiO3–FeSiO3–MnSiO3) and estimated that the P–T conditions for the exsolved bustamite and rhodonite were 6 kbar at 550 °C on the basis of calcite–dolomite thermometry. However, these conditions were not confirmed by the bustamite exsolution experiment. In contrast, experimental studies of bustamite exsolution (Abrecht & Peters, Reference Abrecht and Peters1980) indicated that the coexistence of rhodonite and bustamite forms by the bustamite exsolution at temperatures between 600 and 1100 °C and pressure of 2 kbar, and is strongly T-dependent and to a lesser extent pressure-dependent. Furthermore, Abrecht & Peters (Reference Abrecht and Peters1980) calculated that the equilibrium temperatures for natural rhodonite–bustamite assemblages of Ravinella di Sotto (Ivrea zone, Italy) and Broken Hill (New South Wales, Australia) are at 500–550 °C based on the experimental data. Therefore, the exsolved bustamite and rhodonite from Luziyuan skarn deposit suggests a temperature of at least 500 °C. In this study, as an early-stage skarn mineral, rhodonite is widespread in the Luziyuan district. As stated earlier, the petrographic evidences indicate that the prismatic rhodonite coexists with fibrous bustamite (Fig. 5d), which is replaced by the assemblage of calcite and quartz (Fig. 5b). In Figure 11, the rhodonite and bustamite compositions plot into the bustamite–rhodonite miscibility gap at T = 550 °C as expected by Abrecht & Peters (Reference Abrecht and Peters1980). Therefore, the observed coexistence of rhodonite and bustamite suggests that the bustamite exsolution formed as proposed by Abrecht & Peters (Reference Abrecht and Peters1980). Thus, the textural characteristics are reconciled with the exsolved bustamite and rhodonite, suggesting that the estimated temperature of the rhodonite-formation fluid was at least 500 °C.
Figure 11. Mn–Ca-(Fe + Mg) plot of pyroxenoid compositions from the Luziyuan mine. Dashed lines indicate miscibility gap between rhodonite and bustamite at T = 550 °C (Abrecht & Peters, Reference Abrecht and Peters1980).
5.b. Temperature and salinity of the Stages 3 and 4 ore fluids
As mentioned above, fluid inclusions in quartz from Stage 3 occur as non-FIAs including irregular clusters, isolated and scattered, whereas fluid inclusions in calcite and sphalerite from Stage 4 occur as non-FIAs and FIAs, and fluid inclusions in quartz from Stage 4 only occur as FIAs. The data obtained from these fluid inclusions in Stage 3 show distinct populations (Fig. 8); fluids from non-FIAs (irregular clusters and isolated) in Stage 3 have higher temperature and salinity than non-FIAs (scattered) in the same stage. Furthermore, the lower-temperature and -salinity fluids from non-FIAs (scattered) may suggest that mixing with dilute and cooler fluids, probably of meteoric origin, occurred after equilibration of early magmatic fluids. This process is suggested by the remarkable decrease of both temperature and salinity values (Fig. 8).
Apart from fluids from non-FIAs in sphalerite, fluids from non-FIAs in Stage 4 have lower temperature and salinity than in Stage 3 (Fig. 8). The overlap between the microthermometry data from non-FIAs (scattered) in Stage 3 and non-FIAs in Stage 4 (Fig. 8), also indicating non-FIAs in Stage 4, record mixing with dilute and cooler meteoric water. By contrast, fluids from FIAs in Stage 4 have the lowest observed temperature and salinity. Such characteristics may suggest that substantial mixing with dilute and cooler fluids, probably of meteoric origin, occurred during Stage 4 mineralization.
The salinities of the fluid inclusions from non-FIAs in sphalerite and calcite are markedly different (Fig. 8), such that those in calcite are typically lower than those in sphalerite (Fig. 8). Based on fluid inclusion petrographic investigations, such high-salinity inclusions in sphalerite occupy only a relatively small population (10–25 %): only five fluid inclusion data record such high salinity, whereas the majority of relatively low-salinity inclusions are recorded in calcite during Stage 4 mineralization. These features may suggest that the high-salinity inclusions in sphalerite were trapped during small portions of the sulphide stage, whereas the inclusions in calcite were trapped throughout the whole sulphide stage. Further discussion of such high-salinity fluids in sphalerite will be presented below.
Figure 8 also shows data of fluid inclusions from distal skarn-type Pb–Zn ores, such as the Jinchang (Chen, Huang & Lu, Reference Chen, Huang and Lu2009), Jiaoli (Li & Zhao, Reference Li and Zhao2004), San Martin (González-Partida & Camprubí, Reference González-Partida and Camprubí2006) and Trepca orebodies (Palinkas et al. Reference Palinkas, Palinkas, Renac, Spangenberg, Lueders and Molnar2013). These ore deposits are controlled by structure and lithology, which are spatially related to granitic plutons.
Temperature–salinity trends in most of these deposits have been ascribed to mixing of high-temperature saline fluids of either possible or demonstrated magmatic origin, with low-temperature, low-salinity meteoric waters. Meteoric waters have been recognized as a major source of ore fluids for some deposits (Jinchang, Jiaoli, San Martin). Magmatic fluid has been recognized as an important source of ore fluids in the Trepca orebodies. Fluid mixing has been recognized, along with fluid-host interactions, as an important ore deposition mechanism in these deposits. In the Luziyuan deposit, the non-FIA (scattered) inclusions in Stage 3 and secondary FIA inclusions in Stage 4 seem to overlap with some of the fields of other skarns, indicating a significant input of meteoric waters. However, the non-FIAs (irregular cluster and isolated) in Stage 3 have higher homogenization temperature and salinity than inclusions from other skarns, representing a magmatic fluid. The non-FIA inclusions in Stage 4 show slightly lower homogenization temperature than Trepca skarn, but the former have relatively high salinity, which is discussed below.
The homogenization temperature and salinity of two-phase aqueous fluid inclusion assemblages (such as non-FIAs and FIAs) can be used to estimate the minimum pressure of fluid entrapment (Bodnar, Burnham & Sterner, Reference Bodnar, Burnham and Sterner1985; Bodnar & Vityk, Reference Bodnar, Vityk, Vivo and Frezzotti1994; Driesner & Heinrich, Reference Driesner and Heinrich2007; Steele-Macinnis, Lecurnberri-Sanchez & Bodnar, Reference Steele-Macinnis, Lecumberri-Sanchez and Bodnar2012). Due to the absence of fluid boiling assemblages in the Luziyuan deposit, the actual trapping conditions of the fluid cannot be estimated (Roedder & Bodnar, Reference Roedder and Bodnar1980). However, the minimum pressures of fluid entrapment in Stages 3 and 4 were calculated based on the HokieFlincs_H2O-NaCl software of Steele-Macinnis, Lecurnberri-Sanchez & Bodnar (Reference Steele-Macinnis, Lecumberri-Sanchez and Bodnar2012). The Stage 3 fluid inclusion data measured in non-FIAs reveal the minimum formation pressure in the wide range between 96 and 195 bar (Table 3; Fig. 12), and the Stage 4 fluid inclusion data measured in non-FIAs would indicate a relatively low minimum pressure of entrapment of 23–53 bar (Table 3; Fig. 12). Notably, the Stage 3 ore fluids have the highest pressure and show a pressure decrease associated with the depth decrease (Fig. 12); the Stage 4 ore fluids show lower pressure than Stage 3 and have nearly the same pressure for all three levels, whereas post-ore fluids from secondary FIAs show the lowest pressure and nearly the same pressure for all three levels (Fig. 12). The above evidence suggests that fluids derived from the deep concealed intrusion beneath the Luziyuan ore district may have migrated upwards to the host rocks.
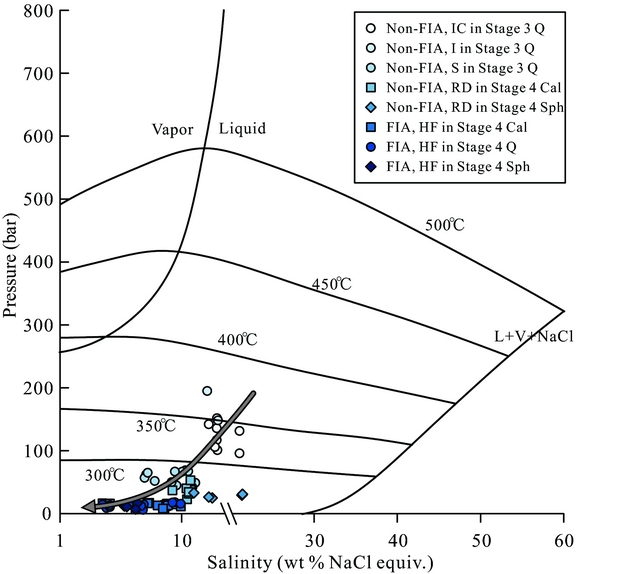
Figure 12. Phase diagram for the NaCl–H2O system (Driesner & Heinrich, Reference Driesner and Heinrich2007) showing all aqueous inclusion assemblages that homogenize by vapour disappearance. Abbreviations are the same as those in Figure 7.
5.c. Source of the ore-forming fluids
The features of early fluids of Pb–Zn skarn deposits have been revealed for the Zacatepec Pb–Zn–Ag deposit in Oaxaca (Canet et al. Reference Canet, González-Partida, Camprubí, Castro-Mora, Romero, Prol-Ledesma, Linares, Romero-Guadarrama and Sánchez-Vargas2011) and the Trepča Pb–Zn–Ag deposit in Kosovo (Palinkaš et al. Reference Palinkas, Palinkas, Renac, Spangenberg, Lueders and Molnar2013). These studies have shown that the fluids in the hydrous skarn stage and sulphide stage are dominated by meteoric waters with low temperature and salinity. However, Zhao et al. (Reference Zhao, Dong, Li and Bi2003) suggested that the fluids in the hydrous skarn stage and sulphide stage are magmatic water.
Therefore, it is unclear that the fluids in the hydrous skarn stage and sulphide stage are either meteoric waters or magmatic waters. In the case of the Luziyuan deposit, the origin of the ore-forming fluid from Stages 3 and 4 is discussed on the basis of the hydrogen isotope data from fluid inclusions hosted by quartz and by the oxygen isotope data of quartz. The δ18Ofluid values in the Luziyuan Pb–Zn skarn deposit decrease from early to late stages. This is supported by Figure 13, which shows an isotopic shift in oxygen towards the meteoric waterline from Stage 3 to 4. Notably, both Stages 3 and 4 have extremely low δDfluid values (−118 to −72 ‰ and −109 to −98 ‰, respectively). Compared with the composition of Meso-Cenozoic meteoric water in the regimes of the ‘Sanjiang’ middle belt (δDfluid = −110 ‰ to −90 ‰; Xu & Mo, Reference Xu and Mo2000), the hydrogen data from Stage 3 quartz have relatively high δDfluid values, except for one sample (δDfluid = −118 ‰). The extremely low δDfluid values have been ascribed to either boiling (Giggenbach, Reference Giggenbach, Simmons and Graham2003; Seghedi et al. Reference Seghedi, Voica Bojar, Downes, Rosu, Tonarini and Mason2007; De Hoog, Taylor & Van Bergen, Reference De Hoog, Taylor and Van Bergen2009) or reactions within organic-matter-rich metasedimentary rocks (Sheppard, Reference Sheppard1986; Moura, Reference Moura2008). However, petrographic evidence for boiling has not been observed in this study; instead, three CH4-rich fluid inclusions hosted in Stage 3 quartz have been identified (Fig. 9a). Hence, the low δDfluid value (δDfluid = −118 ‰) can be interpreted to be the result of reactions with organic-matter-rich metasedimentary rocks. The hydrogen data from Stage 4 quartz (δDfluid = −109 to −98 ‰) are in good agreement with those of meteoric water (δDfluid = −110 to −90 ‰). For the hydrogen and oxygen isotopic evolution of the Luziyuan deposit, this trend indicates mixing between early magmatic water with high δ18Ofluid and δDfluid values and meteoric water with relatively low δ18Ofluid and δDfluid values, with greater contributions of meteoric water to the ore fluids in Stage 4.

Figure 13. Plot of δD v. δ18O for Stage 3 and 4 fluids (fields showing δD and δ18O of metamorphic and primary magmatic water are after Taylor (Reference Taylor1997).
High-salinity fluids, such as those present during Stage 4 mineralization, are typically produced by (1) seawater evaporation, (2) dissolution of halite or other evaporites or (3) the segregation of exsolved magmatic water. The δ34S compositions from the Luziyuan deposit are consistent with those of a gypsum layer from Ordovician strata exposed in the Luziyuan region (Fig. 10). The high δ34S values of sulphides in this deposit may reflect thermochemical sulphate reduction because of the extremely low isotopic fractionation between sulphides and sulphates (Ohmoto, Kaiser & Geer, Reference Ohmoto, Kaiser, Geer, Herbert and Ho1990; Hoefs, Reference Hoefs1997: 201). Moreover, as confirmed by the Raman data, the non-aqueous fluid inclusions are rich in CH4, which indicates that a reducing ore fluid is responsible for this deposit. Therefore, the sulphur species of the ore-forming fluid are dominated by H2S, and the δ34S values of the hydrothermal system were hardly influenced by deposition of sulphides (Ohmoto & Rye, Reference Ohmoto, Rye and Barnes1979: 509–67). This may explain why the ore fluid in this deposit has high δ34S values. The presence of the gypsum from host rock, with its associated isotopic signature, is distinct from other similar types of major Pb–Zn skarn deposits (Table 6), and its signature in the Luziyuan ore fluid suggests that this gypsum was the main source of sulphur for the ore-forming fluids during the formation of the Luziyuan deposit. Overall, the high-salinity fluid associated with the Stage 4 mineralization may have interacted with the gypsum layer, thus ruling out seawater evaporation and magmatic waters. Such a scenario would also explain why the fluid inclusions do not become less saline between Stages 3 and 4. Overall, both the fluid inclusion and stable isotope evidence suggests that the Luziyuan ore fluids were derived from two sources, magmatic fluids and meteoric water, and were simultaneously influenced by the dissolution of evaporites (an Ordovician gypsum layer) occurring in the Luziyuan region.
Table 6. Summary of sulphur isotope data for the described Pb–Zn skarn deposit.
Sph = sphalerite, Gn = galena, Py = pyrite, Po = pyrrhotite, Ccp = chalcopyrite, Gp = gypsum.
5.d. Ore deposit genesis
The Luziyuan deposit formed in the early Yanshanian (183 ± 2.3 Ma, Sm–Nd age of calcite; Yang, Reference Yang2013) in response to collision between the Tengchong terrane and the Baoshan terrane (Mo & Pan, Reference Mo and Pan2006). Yanshanian granitic plutons are not exposed in the Luziyuan region. However, a concealed intermediate-acidic intrusion in the area was indicated by geophysical exploration (Li & Mo, Reference Li and Mo2001) and is considered to be related to the Muchang intrusion (Ye et al. Reference Ye, Gao, Cheng, Yang and Tao2010). The country rocks are marble and slate of the upper Cambrian Shahechang Formation, and a large number of Mn-bearing skarn minerals (e.g. rhodonite) are present. The ore-forming fluids were derived mainly from magmatic water with some input of meteoric water during the late mineralization stage, based on fluid inclusion data and H and O isotopic data. The Luziyuan Pb–Zn deposit shares a number of common features with distal Pb–Zn skarn deposits worldwide, including the tectonic setting, concealed intermediate-acidic intrusion, skarn minerals and mineralization fluids (Einaudi, Meinert & Newberry, Reference Einaudi, Meinert and Newberry1981; Meinert, Reference Meinert1987; Newberry, Reference Newberry1987; Megaw, Ruiz & Titley, Reference Megaw, Ruiz and Titley1988; Li & Zhao, Reference Li and Zhao2004; Yang et al. Reference Yang, Ye, Cheng and Bao2013). These similarities support our viewpoint that it is a distal Pb–Zn skarn deposit. Additionally, the Luziyuan Pb–Zn skarn deposit has another distal characteristic: it contains elevated Co and depleted In contents, a pattern that is significantly different from that of proximal Cu–Fe skarn deposits based on the LA-ICP-MS analysis of sphalerite (Ye et al. Reference Ye, Cook, Ciobanu, Liu, Zhang, Liu, Gao, Yang and Danyushevskiy2011a).
A metallogenic model for the Luziyuan deposit can be derived by combining the findings of the fluid inclusion and stable isotope results with the field and textural observations. The emplacement of a concealed intrusive body produced a relatively high-temperature, high-salinity magmatic fluid. This magmatic fluid became relatively enriched in Pb and Zn as it migrated upwards through the marble and slate of the upper Cambrian Shahechang Formation, which is known to be enriched in Pb (325 ppm) and Zn (420 ppm) (Dong & Chen, Reference Dong and Chen2007). The migration of this fluid to the site of the carbonate host rock resulted in a reaction that generated the Stage 1 anhydrous phases (garnet and rhodonite) and Stage 2 hydrous skarn minerals (actinolite and chlorite). During Stages 3 and 4, the ore fluid mixed with meteoric water, which involved the dissolution of a gypsum layer in the overlying Ordovician strata, causing metals such as Pb and Zn to precipitate as sulphides.
6. Conclusions
Skarn mineral chemistry, microthermometric and Raman spectroscopic data, in combination with H–O–S isotope data, allow some important conclusions to be drawn about the origin of the ore-forming fluid and mechanisms that control the formation of the Luziyuan skarn-type Pb–Zn deposit:
(1) Four paragenetic stages are developed in the Luziyuan deposit: Stage 1, the anhydrous skarn-forming stage (garnet–rhodonite–bustamite assemblage); Stage 2, the hydrous skarn-forming stage (actinolite–chlorite assemblage); Stage 3, the early quartz stage; and Stage 4, the later sulphide-forming stage (sphalerite, galena and chalcopyrite-quartz–calcite assemblage).
(2) The exsolved bustamite and rhodonite indicate an estimated skarn-forming fluid temperature of 500 °C during Stage 1 mineralization.
(3) The high-salinity inclusions in Stage 4 sphalerite are attributed to the dissolution of evaporites (an Ordovician gypsum layer) in the Luziyuan region.
(4) Fluid inclusions and H–O isotopes indicate that fluid mixing between magmatic water and meteoric water took place during the sulphide stage, which caused metals such as Pb and Zn to precipitate as sulphides.
Acknowledgements
This research project was jointly supported by the National Natural Science Foundation of China (Grant No. 41173063); the 12th Five-year Plan Project of State Key Laboratory of Ore-deposit Geochemistry, Chinese Academy of Sciences, Guiyang, China (Grant No. SKLODG-ZY125-02); and the National ‘973 Project’ (Grant No. 2014CB440900). We are greatly indebted to Chief Engineer Zhou Yunman (Yunnan Geology and Mineral Resources Ltd.), who assisted with sampling.
Declaration of interest
There are no known conflicts of interest associated with this publication.


