1. Introduction
Extensional mid-crustal shear zones are structural elements usually associated with the development of metamorphic core complexes (Davis & Coney, Reference Davis and Coney1979; Lister, Banga & Feenstra, Reference Lister, Banga and Feenstra1984; Wernicke, Reference Wernicke1985; Dewey, Reference Dewey1988). These shear zones accommodate most of the strain and are considered to comply with the extensional tectonic process which accompanies and follows crustal thickening (Walcott and White, Reference Walcott and White1998; Pe-Piper, Piper & Matarangas, Reference Pe-Piper, Piper and Matarangas2002; Gueydan, Mehl & Parra, Reference Gueydan, Mehl, Parra, Gapais, Brun and Cobbold2005; Cirrincione et al. Reference Cirrincione, Fazio, Ortolano, Pezzino and Punturo2012). Another common feature of core complexes is the occurrence of granitoid plutons (Foster et al. Reference Foster, Schafer, Fanning and Hyndman2001; Passchier, Zhang & Konopasek, Reference Passchier, Zhang and Konopasek2005), many of which are considered to have syntectonically intruded during the active crustal-scale deformation stage.
Over the last decades, several studies have investigated the behaviour of high-strain zones as potential seismic reflectors, many of them focusing on the source of seismic anisotropy (e.g. Barruol et al. Reference Barruol, Mainprice, Kern, de Saint Blanquat and Compte1993; Rey, Fountain & Clement, Reference Rey, Fountain and Clement1994; Khazanehdari et al. Reference Khazanehdari, Rutter, Casey and Burlini1998; Almqvist et al. Reference Almqvist, Hirt, Herwegh, Ebert, Walter, Leiss and Burlini2013). In this view, the strong crystallographic orientations of constituent minerals and the mylonitic petrofabric play an important role in affecting the physical properties distribution along the shear zones (Fountain, Hurich & Smithson, Reference Fountain, Hurich and Smithson1984; Kern & Wenk, Reference Kern and Wenk1990; Burlini & Kunze, Reference Burlini and Kunze2000).
The Kavala Shear Zone, exposed in the southern Rhodope (K. Kyriakopoulos, unpub. thesis, University of Athens, 1987) core complex (NE Greece, Fig. 1a), may be considered as a natural laboratory for investigating the mylonitic evolution of a magma intrusion, the emplacement and deformation of which took place during the shearing event. Well-preserved non-coaxial plastic deformation involved an early Miocene metaluminous to weakly peraluminous granodiorite pluton (named either Symvolon or Kavala in the literature) and metamorphic host rock, both locally intruded by aplitic dykes. Mylonitic rocks exhibit NE–SW monotonous stretching lineation consistent with the shape elongation of the exposed pluton, the deformation of which occurred at various stages during syn-shearing emplacement (Jones et al. Reference Jones, Tarney, Baker and Gerouki1992; Brun & Sokoutis, Reference Brun and Sokoutis2007).
Figure 1. (a) Geological setting of the southern Rhodope and Serbo Macedonian massifs (modified after Brun & Sokoutis, Reference Brun and Sokoutis2007); and (b) synthetic cross-section of the area of interest.
The purpose of the present paper is to analyse and discuss the changes of composition and textural and petrophysical features in granitoid rocks sharing a mylonitic event during the evolution of an extensional shear zone; in particular, we attempted to highlight any local variation in seismic anisotropy related to increasing textural strength. Results obtained can promote a better understanding of the seismic behaviour of those present-day geodynamic realms characterized by exhumation after the crustal thickening stage.
2. Geological setting
The study area is located in NE Greece (Fig. 1a) in the southern part of the Rhodope Massif, mostly comprising pre-Alpine crystalline units intruded by various Cenozoic plutonic complexes. The Rhodope Massif is considered as a piece of the Alpine–Himalayan Orogen (Burg et al. Reference Burg, Ricou, Ivanov, Godfriaux, Dimov and Klain1996; Zagorchev, Reference Zagorchev1998; Kilias et al. Reference Kilias, Frisch, Avgerinas, Dunkl, Falalakis and Gawlick2010; Burg Reference Burg, Skourtsos and Lister2012), extended through southern Bulgaria and northern Greece, surrounded by the Balkan belt to the north and the Dinarides–Hellenides to the south (Dewey et al. Reference Dewey, Pitman III, Ryan and Bonnin1973; Bonchev, Reference Bonchev1988).
According to Dinter & Royden (Reference Dinter and Royden1993) and Sokoutis et al. (Reference Sokoutis, Brun, Van Den Driessche and Pavlides1993) it can be considered as a ‘Core Complex’ exhumed by a large-scale extension that affected the north Aegean area during Eocene–Miocene time. It is bordered to the north by the Maritsa Fault, to the west by the Kerdilia Complex thrust units of the Serbo-Macedonian Massif in the Chalkidiki Peninsula (Kilias, Falalakis & Mountrakis, Reference Kilias, Falalakis and Mountrakis1999) and to the east by early–middle Cenozoic volcanic sequences and sedimentary succession of the Thrace Basin (Jones et al. Reference Jones, Tarney, Baker and Gerouki1992; Caracciolo et al. Reference Caracciolo, Von Eynatten, Tolosana-Delgado, Critelli, Manetti and Marchev2012).
Papanikolaou & Panagopoulos (Reference Papanikolaou and Panagopoulos1981) subdivide the Rhodope Core Complex (RCC) into two main units: a Lower Tectonic Unit (LTU) and an Upper Tectonic Unit (UTU), corresponding to the Pangaio Unit and Sideronero Unit of Kilias & Mountrakis (Reference Kilias and Mountrakis1990), respectively (Fig. 1a, b). The two units are separated by a SW-verging thrust zone (Nestos thrust system of Lips, White & Wijbrans, Reference Lips, White and Wijbrans2000) extending from the Bulgarian border to the Xanthi Zone (Zachos & Dimadis, Reference Zachos and Dimadis1983; Kilias & Mountrakis, Reference Kilias and Mountrakis1990). The LTU is mainly composed of massive and foliated marble rocks with subordinate paraschists in alternance with orthogneisses; the UTU consists of ortho- and paragneisses, sometimes migmatitic, amphibolites and ultramafic rocks, calc-silicate rocks and marbles (Fig. 2a). The orthogneiss protoliths are of Permo-Carboniferous age in the LTU and Late Jurassic age in the UTU, according to SHRIMP (sensitive high-resolution ion microprobe) U–Pb zircon dating by Turpaud & Reischmann (Reference Turpaud and Reischmann2010). These authors also proposed referring to the Lower and the Upper tectonic units as the Thracia Terrane and Rhodope Terrane, respectively.
Figure 2. (a) Geological sketch map of the Kavala study area and samples location; and (b) profile (orientation: NNW–SSE) showing the anticline structure of the Kavala Shear Zone.
The early–middle Cenozoic metamorphic evolution (see review by Burg, Reference Burg, Skourtsos and Lister2012) developed into three different events. The first event (M1), characterized by high-pressure conditions, produced eclogite facies assemblages within amphibolite and chloritoid-staurolite schists (Mposkos & Perdikatsis, Reference Mposkos and Perdikatsis1987; Liati, Reference Liati1988). The second event (M2) attained pressure–temperature (P–T) conditions of c. 0.7 GPa and 650°C, overprinting the syn-M1 high-pressure assemblages. The last event (M3), showing retrograde character, developed under greenschist facies conditions. Geochronological data suggest an early–middle Eocene age for M2 (Liati, Reference Liati1988), whereas the retrograde mylonitic event (M3?) affecting the basement gneisses in the Kavala area may be ascribed to early Miocene time (c. 19–22 Ma), indicating exhumation at shallow crustal levels (consistent with temperatures of 350–400°C) by that time (Del Moro et al. Reference Del Moro, Kyriakopoulos, Pezzino, Atzori and Lo Giudice1990; Lips, White & Wijbrans, Reference Lips, White and Wijbrans2000).
As a consequence of the Eocene–Miocene large-scale extension, numerous sedimentary basins developed with associated effusive and intrusive magmatism (Jackson & White, Reference Jackson and White1989; Baker & Liati, Reference Baker and Liati1991). The magmatic activity took place in close spatial association with the development of the extensional structures throughout NE Greece from the Chalkidiki Peninsula to eastern Thrace; indeed, these magmatic complexes represent the source area of the Thrace Basin sandstones (Caracciolo et al. Reference Caracciolo, Critelli, Innocenti, Kolios and Manetti2011, Reference Caracciolo, Critelli, Innocenti, Kolios and Manetti2013).
According to Jones et al. (Reference Jones, Tarney, Baker and Gerouki1992) the various middle Cenozoic granitoids of the Rhodope Massif are mostly post-collisional crustal magmas, emplaced at the same time as extensional collapse of the over-thickened crust. They include: (1) the Xanthi granodiorite body (c. 30 Ma; K. Kyriakopoulos, unpub. thesis, University of Athens, 1987; Liati & Kreuzer, Reference Liati and Kreuzer1990) which crops out in the SE area close to the coastline; (2) the Vrondou granodiorite complex (c. 30 Ma; Durr et al. Reference Durr, Altherr, Keller, Okrusch, Seidel, Closs, Roeder and Schmidt1978; Kolocotroni & Dixon, Reference Kolocotroni and Dixon1991) which occupies the northern area of Serres town, evolving to mylonite in the western margin; and (3) the Kavala (or Symvolon) pluton (21–22 Ma; Dinter et al. Reference Dinter, MacFarlane, Hames, Isachsen, Bowring and Royden1995) cropping out in the SW sector of the Rhodope Massif, close to the city of Kavala (Fig. 2a). The Kavala pluton constitutes the core of an anticline (Fig. 2b); it is a NE–SW-elongated body c. 45 km long and 5–12 km wide and mainly consists of weakly to strongly foliated granodiorites (Kyriakopoulos, Pezzino & Del Moro, Reference Kyriakopoulos, Pezzino and Del Moro1989; Neiva et al. Reference Neiva, Christofides, Eleftheriadis and Soldatos1996; Eleftheriadis & Koroneos, Reference Eleftheriadis and Koroneos2003). The Kavala and (the western part of the) Vroundou plutons are considered to be related to the same tectonic phase since they both show evidence of syn-extensional shearing emplacement (e.g. Gapais, Reference Gapais1989; Dinter & Royden, Reference Dinter and Royden1993; Dinter et al. Reference Dinter, MacFarlane, Hames, Isachsen, Bowring and Royden1995).
The Kavala (Symvolon) pluton investigated in this paper intruded pre-Miocene marbles and gneisses, including Permo-Carboniferous metagranitoids (Turpaud & Reischmann, Reference Turpaud and Reischmann2010), of the LTU along the SW–NE-trending Kavala–Komotini fault zone (Dimadis & Zachos, Reference Dimadis and Zachos1989).
A crystallization pressure in the range of 0.53–0.75 GPa has been inferred by Neiva et al. (Reference Neiva, Christofides, Eleftheriadis and Soldatos1996) using Al-in-hornblende geobarometry. Dinter et al. (Reference Dinter, MacFarlane, Hames, Isachsen, Bowring and Royden1995) constrained intrusion, mylonitization and rapid cooling of the pluton to below 500°C at c. 21–22 Ma (U–Pb zircon and titanite ages and Ar/Ar hornblende ages).
Syntectonic emplacement of the Kavala pluton is apparent from pervasive S-C-C′ fabric, with NE–SW-oriented stretching lineation and inferred top-to-the-SW or -WSW sense of shear (Brun & Sokoutis, Reference Brun and Sokoutis2007). Intensity of deformation increases towards the contact with the host rock gneisses that, according to the same authors, were already deformed during the emplacement of the pluton. Despite the longer deformation history of the host rock gneisses, possibly including the effects of Cretaceous thrusting, it is suggested that any previous linear fabric was affected by rotation towards the early Miocene principal stretching direction. All the fabric elements of the plutonic rocks as well as of the host rocks are therefore considered to reflect the latest horizontal stretching and to represent markers of the extensional shear zone activity (Punturo et al. Reference Punturo, Cirrincione, Fazio, Fiannacca, Kern, Mengel, Ortolano and Pezzino2012).
3. Method
Variably deformed lithotypes were collected along the shear zone, including granitoids from the pluton, aplite dykes and host rock gneisses (Fig. 2a, Table 1).
Table 1. Specimens collected and geographic coordinates.

Petrographic investigations were carried out on thin-sections cut according to the fabric elements (i.e. x: stretching lineation; y: perpendicular to lineation within the foliation plane; and z: pole to foliation) assisted by X-ray fluorescence (XRF) bulk-rock chemistry analysis, electron probe micro-analysis of main and accessory mineral phases and calculation of modal abundances by means of PetMix spreadsheet (available at http://www.geologynet.com/micros2.htm).
This first step was aimed at highlighting the main petrographic and microstructural features of all of the analysed lithotypes involved in the shearing event. Subsequently, we focused on selected granitoid mylonites from the pluton since they were involved in a single deformational event and exhibit a relative compositional homogeneity, confirmed by both meso- and macro-scale observations and by geochemical investigation.
Electron probe micro-analyses (EPMA) were performed with a Cameca SX100 at the Department of Geosciences, Mining and Economics, Clausthal University of Technology, equipped with a W-filament, four vertical wavelength-dispersive spectrometers, operating at 15 kV accelerating voltage and 20 nA beam current conditions, calibrated with natural mineral standards. Part of the analyses were also performed on a Tescan-Vega\\LMU scanning electron microscope (SEM), equipped with an energy-dispersive x-ray spectrometer (EDS) Edax Neptune XM4 60 at the Department of Biological, Geological and Environmental Sciences of Catania University.
Whole-rock compositions were determined by X-ray fluorescence on pressed powder pellets, performed on a Philips PW2404 spectrometer equipped with a Rh anticathode at the Department of Biological, Geological and Environmental Sciences, Catania University, corrected for matrix effects (Franzini, Leoni & Saitta, Reference Franzini, Leoni and Saitta1975). Loss on ignition (LOI) values were determined by standard gravimetric procedures. Diagrams displaying the geochemical variability of the studied rocks were constructed using the PetroGraph software by Petrelli et al. (Reference Petrelli, Poli, Perugini and Peccerillo2005).
The calculation of the mineral modes is based on the generalized petrological mixing model reported by Le Maitre (Reference Le Maitre1979) using the computer program PetMix, which is based on least-squares fit.
Bulk elastic and density properties of the selected granitoid samples were first calculated at fixed P–T conditions on the basis of volume percentages of constituent minerals, their compositions and single crystal elastic moduli by considering the aggregate to be isotropic (Hacker & Abers, Reference Hacker and Abers2004).
Successively, seismic velocities (P- and S-wave) and density were experimentally measured at increasing pressure conditions (up to 400 MPa) in a multi-anvil apparatus using the ultrasound transmission technique (Kern Reference Kern1982; Kern, Liu & Popp, Reference Kern, Liu and Popp1997). The use of transducers operating at 2 MHz (V p) and 1 MHz (V s) allowed the measurement of the directional dependence (anisotropy) of elastic properties as a function of pressure.
Measurements of compressional and orthogonally polarized shear-wave velocities were made on 43 mm edged sample cubes cut parallel to macroscopic fabric elements (i.e. lineation, foliation). The shear-wave transducers were oriented such that the predominant S1 and S2 particle motions were either parallel or perpendicular to foliation and lineation. Each set of results is composed of nine velocity values: three P-wave velocities and six S-wave velocities. Length and volume (density) variations of the sample cubes, resulting from changes in the main stress, are obtained from the piston displacement. The cumulative error in both V p and V s was estimated to be <1%. A detailed description of the device, as well as the transducer–piston–sample arrangement, is given by Kern, Liu & Popp (Reference Kern, Liu and Popp1997).
4. Outcrop features
The main rock type of the Kavala pluton is a medium- to coarse-grained, sometimes porphyritic, granodiorite composed of quartz, plagioclase and K-feldspar with varying proportions of biotite and hornblende as mafic phases. Hornblende-biotite diorites and tonalites, typically foliated, and monzogranites locally crop out. Dioritic-tonalitic enclaves are widespread and mostly concentrated at the pluton periphery. Aplitic dykes intrude the plutonic rocks as well as the metamorphic host rocks at different localities. At the scale of the outcrop (Fig. 3a–c) a pervasive S-C-C′ fabric, with NE–SW-oriented stretching lineation and inferred top-to-the-SW or -WSW sense of shear, is evident (Fig. 2a). The field-pervasive planar fabric, mostly consisting of C surfaces (strike 199°; dip 14° ESE), shows textures varying from weakly deformed to strongly mylonitic. In country rocks which were already deformed during the pluton emplacement, the mylonitic event lead to almost-complete obliteration of the original structural features (Fig. 3a, b). The intensity of shearing deformation in the plutonic rocks increases towards the contact with the country rocks, consistent with syn- to late-tectonic emplacement (Fig. 3a, b). This is also indicated by the occurrence of two different dyke populations: an older population consisting of sheared subconcordant dykes, parallelized soon after their emplacement to the mylonitic foliation of the host rocks (Fig. 3c), and a younger population of dykes cutting the same foliation at a high angle (see also Brun & Sokoutis, Reference Brun and Sokoutis2007).
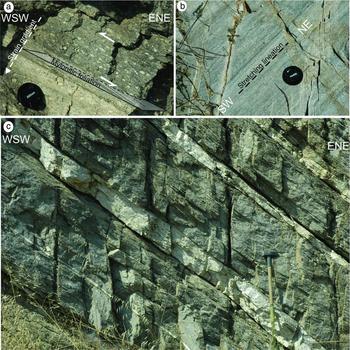
Figure 3. Mylonitic structures of country rocks: (a) evidence of mylonitic foliation and increasing strain within orthogneiss and (b) stretching lineation within orthogneiss. (c) Mylonitized granodiorite and aplite dykes.
All of the investigated mylonitic rocks of the two groups (i.e. granitoids and country rocks) exhibit the classical appearance of L-S (lineated and foliated) tectonites (Turner & Weiss, Reference Turner and Weiss1963) with a pronounced cataclastic overprint of varying degrees. The first group comprises mylonites derived from granodiorite (samples KB1–5, KB8, KB14–18) and from aplite dykes (samples KB6 and KB7); the second group includes four metamorphic host rocks (KB9–12).
5. Petrography
5.a. Mylonites from granitoid rocks and aplite dykes
Mylonites from the granitoid rocks are characterized by the assemblage Pl, Qtz, Kfs and Bt±Am as fundamental phases and Aln, Ep, Ttn, Zrn, Ap, Fe-oxides, Wmca, Grt, Tur and Chl as the most common accessory phases (mineral abbreviations after Siivola & Schmid, Reference Siivola, Schmid, Fettes and Desmons2007); representative minerochemical compositions are reported in Appendix A (see the online Supplementary Material available at http://journals.cambridge.org/geo). The rocks mostly consist of variously rounded feldspar porphyroclasts (submillimetre up to centimetre sized) wrapped by quartz levels alternating with discontinuous micaceous domains that define a typical augen-type structure (Fig. 4a–d). The main mylonitic foliation (C surface), corresponding to the field foliation, is often accompanied by the presence of variably angulated flattening surfaces (S) locally intersected by C′-type foliation due to the activation of synthetic fractures with respect to the sense of shear. Local strain localization led to the formation of millimetre-thick ultramylonitic layers characterized by cryptocrystalline matrix, locally visible in some specimens (Fig. 4c, d).
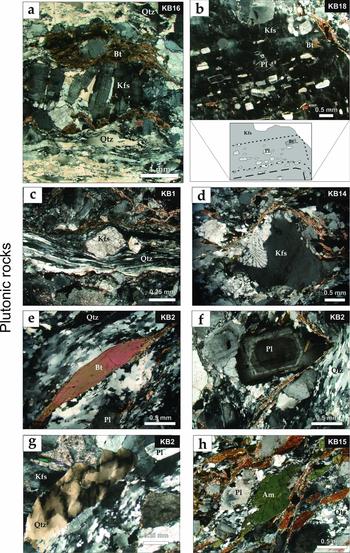
Figure 4. Photomicrographs (crossed polarizers) of selected mylonitic granodiorite: (a) alternance of quartz and micaceous domains that mantle feldspar porphyroclasts; (b) concentric distribution of plagioclase inclusions within K-feldspar megacryst; (c) quartz ribbons and microcrystalline matrix wrapping K-feldspar porphyroclast; (d) myrmekite developed at the periphery of a K-feldspar porphyroclast; (e) biotite fish mantled by recrystallized quartz grains; (f) relic magmatic zoning in plagioclase; (g) chessboard pattern within a quartz domain; and (h) sigmoidal plagioclase and amphibole porphyroclasts.
The largest porphyroclasts are almost exclusively composed of K-feldspar (up to 2 cm in size in the samples deformed at a lesser extent), locally characterized by euhedral plagioclase inclusions concentrically arranged with long axes parallel to the crystal-growth edges, as is typical of K-feldspar phenocrysts grown in magma (e.g. Vernon, Reference Vernon1986; Fig. 4b). Moreover, K-feldspar crystals are often fragmented into lenses parallel to the mylonitic foliation (forming bookshelf-sliding microstructures) and show undulose extinction. Myrmekites sometimes occur at the crystal rims (Fig. 4d).
Plagioclase (also producing augens up to 5 mm size) together with quartz comprise granoblastic levels alternating with micaceous levels. Primary albite twins are also widespread; magmatic oscillatory zoning is sometimes evident (Fig. 4f).
The mineral chemistry of feldspars is relatively homogeneous in all of the examined plutonic rocks with alkali feldspar characterized by a nearly pure orthoclase composition and plagioclase ranging from andesine/oligoclase to albite (Fig. 5a); this latter composition is ascribed to synmylonitic retrograde reaction.

Figure 5. Compositional features of (a) fundamental and (b) accessory mineral phases of mylonitic rocks from the Kavala Shear Zone.
Quartz grains usually exhibit deformation lamellae, undulose extinction and sometimes chessboard patterns (Fig. 4g). Ribbon-like quartz is widespread, especially in the most-deformed samples; moreover, various recrystallization processes have been detected in quartz-rich domains such as bulging, subgrain rotation and grain boundary migration.
Biotite is the main mafic phase together with amphibole when it occurs in the assemblage. As is expected in mylonites, the biotite laths show characteristic sigmoidal shape forming ‘mica-fish’ (Fig. 4e). Fe/Fe+Mg ratios range from 0.36 to 0.52, with a slight AlIV increment in biotite from amphibole-free granodiorite (Fig. 5a).
Amphibole often forms sigmoidal grains (Fig. 4h), delineating the S-C-C′ fabric together with Pl and Kfs. According to the classification diagrams depicted in Figure 5, relatively homogeneous edenite to pargasite compositions cluster at the boundary between the Fe-edenite, edenite-hornblende and Fe-pargasite-hornblende fields.
White mica and chlorite occur as products of synmylonitic reactions (Cirrincione et al. Reference Cirrincione, Fazio, Heilbronner, Kern, Mengel, Ortolano, Pezzino and Punturo2010). White mica is characterized by low phengite content and low Fe/Fe+Mg ratios; chlorite shows ripidolitic to pycnochloritic composition.
Among the accessory phases, allanite is widespread; it occurs as small grains which may be either pre- and syn-kinematic. Finally, very rare garnet fragments form swarms parallel to the main foliation.
From granitoid mylonitic rocks, we further selected a suite of specimens which we considered to be representative of the development of strain; indeed, these samples are characterized by progressively decreasing grain size, which accompanies diminishing porphyroclasts percentage (from 53.9 to 17.6%) and increasing matrix content (from 46.2 to 82.4%) as similarly observed in rocks from other shear zones (e.g. Cirrincione et al. Reference Cirrincione, Fazio, Fiannacca, Ortolano and Punturo2009, Reference Cirrincione, Fazio, Heilbronner, Kern, Mengel, Ortolano, Pezzino and Punturo2010; Fazio, Punturo & Cirrincione, Reference Fazio, Punturo and Cirrincione2010).
The aplite dykes exhibit a fine grain size and are characterized by the assemblage Qtz, Pl, Kfs, Ep, Grt, Ap, Wmca, Ttn, Aln, Chl and Fe-oxides±Bt.
Feldspar grains are usually cloudy due to very abundant crypto-crystalline inclusions of secondary phases and form fragmented and boudinaged porphyroclasts draped by quartz ribbons (Fig. 5a, b). Finer grain sizes, scanty biotite and relatively homogeneous plagioclase (oligoclase), together with the diabantite composition of synmylonitic chlorite, are the main differences from granodiorites (Fig. 5).
5.b. Country rocks
The second group of sampled mylonitic rocks comprises four orthogneisses (KB9–12) with the general assemblage Qtz, Pl, Kfs, Wmca and Bt, the latter mostly retrogressed into chlorite. Ap, Ep, Aln, Zrn, Ttn, Fe-oxides, Tur and Grt are the accessory constituents occurring at variable extent. Ultramylonite bands as well as S-C-C′ fabric are also visible (Fig. 6c, d); quartz domains are characterized by well-developed ribbon-like microstructure (up to 3 cm in length). White mica commonly occurs in these S-C-C′ mylonites, forming the classical ‘fish’ microstructure (Wmca1) characterized by a relatively high phengite content ranging from 17 to 30% and variable Fe/Fe+Mg ratios (Fig. 5b). Moreover, fine-grained aggregates developed along the shear planes (Wmca2, Fig. 6g). Biotite is relatively abundant and characterized by an intermediate Fe/Fe+Mg ratio (Fig. 5a).

Figure 6. Photomicrographs of (a, b) aplite dykes and (c–h) host rocks. (a, b) K-feldspar porphyroclasts surrounded by quartz-mica formed matrix; (c, d) alternance of micaceous and quartz layers, development of S-C-C′ foliations and sinistral shearing sense; (e, f) close-up of rectangular area highlighted in (c): epidote corona surrounding pre-kinematic allanite (optical microscope) and SEM image; (g) alternance of micas and quartz domains along the shear planes; and (h) banding within feldspar.
Synkinematic epidote coronas commonly surround pre-mylonitic allanite grains (Fig. 6e, f). The bending of feldspar twins often records an intense deformational event (Fig. 6h). Atoll-like garnet (very small grains, maximum 90 microns) surrounded by biotite laths may also occur.
6. Geochemistry
Samples from both granitoids and country rock orthogneisses involved in the Kavala Shear Zone have been analysed for major and selected trace elements; results are reported in Table 2.
Table 2. Whole rock (wt%) and selected trace element (ppm) compositions of mylonitic rocks from the Kavala Shear Zone. LOI – loss on ignition; b.d. – below limits of detection.
In the Q′(F′)-ANOR classification diagram (Streckeisen & Le Maitre, Reference Streckeisen and Le Maitre1979; Fig. 7a) the Miocene plutonic rocks and host gneisses mostly plot as two distinct groups in the granodiorite and in the granite fields, respectively. Aplite dykes show granite composition. The granodiorites are subalkaline and mostly metaluminous to weakly peraluminous (Fig. 7b), with ASI (aluminium saturation index) in the 0.99–1.06 range, except for an amphibole-bearing and relatively SiO2-poor sample (KB15) with a lower ASI value of 0.91. For the other samples, no clear correlation between peraluminosity and SiO2 content is observable. It is worth noting that both dykes and country rock gneisses show a more pronounced peraluminosity than main granodiorite types.
Figure 7. (a) Classification of the studied rocks from the Kavala Shear Zone in the Q′(F′)-ANOR diagram (Streckeisen & Le Maitre, Reference Streckeisen and Le Maitre1979); (b) ASI v. SiO2 variation diagram. Circles: Miocene plutonic rocks (the empty circles are the samples selected for the petrophysical investigation); squares: Miocene aplite dykes; triangles: pre-Miocene host rocks.
Compared to the compositions and trends reported by Neiva et al. (Reference Neiva, Christofides, Eleftheriadis and Soldatos1996) and Eleftheriadis & Koroneos (Reference Eleftheriadis and Koroneos2003) for the same Miocene granitoid rocks, no significant difference is observed. In the variation diagrams for major and selected trace elements (Fig. 8), despite diffuse data scattering granodiorites and aplite dykes follow the same magmatic trends of decreasing MgO, Fe2O3tot, TiO2, Al2O3, P2O5, V and Zr and increasing K2O and Rb with increasing SiO2 content. Negative correlations are also envisaged for CaO, Na2O, Sr and La. Country-rock othogneisses are often similarly scattered but they plot as a distinct population, defining trends subparallel to those of granodiorites, characterized by higher Fe2O3tot, TiO2 and V and lower CaO, Na2O and Sr for a given SiO2 content. Since many major and trace elements appear to have been only slightly disturbed by post-magmatic modifications, their trends can be considered largely representative of the igneous protoliths of the different lithotypes, helping to select the most-suitable samples for the purposes of the present study.

Figure 8. Harker variation diagrams for selected major and trace elements. Oxide amounts in wt%; trace elements in ppm. Symbols as in Figure 7.
Whole-rock chemical data together with mineral chemistry results were also used to calculate the modal composition of the studied rocks, based on the generalized petrological mixing model reported by Le Maitre (Reference Le Maitre1979) using the spreadsheet PetMix. Results (Table 3; Fig. 9) provided the average percentages for plutonic granodiorite as follows: Qtz 29.2 – Pl 44.5 – Kfs 16 – Bt 8.1 being three samples characterized by the occurrence of hornblende 0.9, 2.5 and 15 vol.% in samples KB18, KB17 and KB15, respectively. The latter sample also exhibits the lowest quartz amount (23.9%). Regarding the aplite dykes (samples KB7 and KB6), their modal percentages are: Qtz 32.4 and 36.2 vol.%; Pl 39.2 and 30.8 vol.%; and K-fsp 25.7 and 28.1 vol.%. Biotite occurs only in sample KB6 (4.9 vol.%), whereas in sample KB7 it is completely replaced by chlorite (2.7 vol.%).
Table 3. Modal abundances (vol.%) of constituent minerals calculated using PetMix spreadsheet on the basis of bulk rock and mineral compositions.

Figure 9. Modal abundances of the mylonitic rocks investigated, calculated on the basis of bulk rock and mineral chemistry.
Meta-igneous country rocks exhibit the following contents of main minerals: quartz 25.7–37.9 vol.%; plagioclase 28.4–49.5 vol.%; K-feldspar 9.4–23.5 vol.%; biotite 4.2–12.4 vol.% and white mica 4.7–18.5 vol.%, the latter absent from sample KB11.
7. Petrophysical properties
Petrophysical investigation focused on samples KB1, KB2, KB3, KB4 and KB18, which are considered to be representative of the increasing strain within the shear zone (Fig. 10); moreover, the selected samples are characterized by bulk and mineral compositions, which suggests a similar pre-mylonitic protolith (Figs 7–9).

Figure 10. Photographs of the granodiorite mylonitic rock selected for the petrophysical investigation, illustrating the variation in microstructural features at both hand and micro scale.
The physical properties of these granitoid mylonites were first calculated by considering the aggregate to be isotropic, on the basis of the modal assemblage (calculated using PetMix) and of the single crystal elastic moduli; the computation of bulk modulus, shear modulus and density was carried out using the worksheet by Hacker & Abers (Reference Hacker and Abers2004) based on thermodynamic relationships and on the Hashin–Shtrikman approximation. The calculated compressional and shear wave velocities for given P–T conditions are listed in Table 4. Since the investigated mylonites are homogeneous in compositions, results are very similar with V p ~ 5.87 km s−1 and V s ~ 3.40 km s−1. Poisson's ratio is 0.25 for all of the investigated samples and, similarly, V p/V s = 1.73.
Table 4. Comparison between the physical properties calculated with the Hashin-Shtriman approximation (Hacker & Abers, Reference Hacker and Abers2004) and near-intrinsic properties measured at 400 MPa.

In order to determine the directional dependence of seismic velocities on the same mylonitic rocks, measurements were carried out as a function of pressure (P max = 400 MPa) on sample cubes cut according to the fabric elements (x: lineation; x–y: foliation plane; z: pole to foliation). Results for compressional and shear waves are listed in Appendix B (see the online Supplementary Material available at http://journals.cambridge.org/geo).
The pressure dependence of compressional wave velocities is shown in Figure 11, which summarizes the P-wave behaviour along the three mutually orthogonal directions together with the related anisotropy, defined as [(V max–V min)/V mean]×100. A non-linear rise of velocities is observed at low confining pressure, due to the progressive closure of oriented low-aspect-ratio microcracks that give rise to a steep decrease in seismic anisotropy.

Figure 11. Patterns of compressional wave velocities (km s−1) and related seismic anisotropy AV p (%) as a function of pressure for the selected mylonitic granodiorite rocks (x: lineation; y: normal to lineation within the foliation plane; z: normal to foliation).
At high-pressure conditions the compacted aggregates reflect a nearly intrisic behaviour, that is, the properties of the rock matrix. The intrinsic properties are controlled by the contribution of the constituent minerals, their abundances and arrangement in the rock. For all the studied mylonites, the highest P-wave velocities are measured parallel to the foliation (x–y) plane whereas P-wave velocities are lowest normal to foliation (z-direction) (Fig. 11). At 400 MPa, compressional wave velocities of granodiorites lie within a narrow range (V p,mean = 5.75–5.96 km s−1) as well as density (c. 2.66 g cm−3). Seismic anisotropy of V p increases from 4.66% (sample KB1) to 6.92% (sample KB4), with a V p/V s ratio of 1.70.
The shear waves velocities of the different rocks vary within the range 2.91–3.52 km s−1. They depend on the propagation direction as well as on the direction of their polarization: fast and slow shear waves are polarized parallel and normal to the foliation plane, respectively. Shear wave splitting (S1–S2) is most pronounced within the foliation plane (Appendix B; see the online Supplementary Material available at http://journals.cambridge.org/geo) whereas, normal to foliation, the shear wave splitting is found to be low. Figure 12 depicts the detailed behaviour of shear waves with increasing pressure in samples KB1 and KB4, representative end-members of low- and high-strain domains within the granitoid mylonites. Finally, a comparison between measured and calculated results shows that velocities (both compressional and shear waves) as well as density values are very close (Table 4).

Figure 12. Patterns of shear wave velocities (km s−1) for KB1 (weakly deformed) and KB4 (the most deformed) mylonitic granodiorite. The fabric elements (x, y and z) are as for Figure 11.
We also performed a regression analysis of the velocity–pressure relationship for both the non-linear and linear segments of the curves obtained at increasing pressure conditions. Interpolation was carried out using the VpPlot script (Wang et al. Reference Wang, Ji, Salisbury, Xia, Pan and Xu2005) on MatLab. This tool provides information about critical points, velocity–pressure curve fitting and error analysis. In the non-linear regime, V(P) = a(lnP)2+b(lnP)+c (P = P c), where a and b are constants and c is the velocity when P is equal to 1 MPa. In the linear regime, the velocity–pressure relationship is described by V(P) = V 0+DP (P<P c), where P c is the critical confining pressure above which a linear velocity increase is observed. In the studied mylonite granodiorites, the linear behaviour is approached for P c>250 MPa. Intrinsic pressure derivatives of velocities, P 0, V 0 and P c are listed in Tables 5 (compressional waves) and 6 (shear waves and V p/V s ratio).
Table 5. Parameters for compressional wave velocity – pressure relationship and derivatives (calculated with VpPlot).

Table 6. Parameters for shear velocity – pressure relationship and derivatives (calculated with MatLab Program VpPlot), together with Poisson and V p/V s ratios.
It is worth noting that the petrophysical properties derived from the linear regime reflect the intrinsic behaviour of the rock, where the contribution of pores and microfractures is negligible.
For the studied mylonitic rocks, the relationship between microstructural features related to increasing strain (expressed as clast/matrix percentage) and elastic properties (represented by the anisotropy of V p) is summarized in Figure 13.
Figure 13. Clast (matrix) abundances in the selected mylonitic granodiorite together with AV p (%) plot.
Finally, we calculated the normal incidence reflection coefficients (R c) from modelled and measured V p and density values for the contacts between orthogneiss (sample KB10, representative of the country rock) and the mylonitic granodiorite (KB4 and KB1, the most- and least-deformed samples respectively; Table 7). When considering the rocks to be isotropic (both orthogneiss and granodiorite), reflection coefficients of c. 0.01–0.02 resulted. In order to envisage any possible reflector within the shear zone, we calculated the coefficients for all of the investigated mylonite granodiorite (KB1, KB2, KB3, KB4 and KB18) by considering, for each sample, the velocity distribution in the x–y (foliation) plane and in the z-direction (normal to foliation). Results highlight that the reflection coefficient remains similar (R c = 0.02) in the samples deformed at a lesser extent, whereas it increases to 0.03 in sample KB4 (the most-deformed mylonite; Table 7).
Table 7. Calculation of acoustic impedance I and normal incidence reflection coefficients R c for the main lithotype of the Kavala Shear Zone.
8. Discussion and concluding remarks
The extensional shear zone of Kavala is an excellent natural site for studying the relationship between mylonitic features and seismic properties in a syntectonic granodiorite pluton emplaced during the large-scale extension that affected NE Greece during late Cenozoic time.
Focusing on the main rock type of the pluton (i.e. granodiorite), we selected a suite with textural and compositional features representative of progressive deformation of the same granitoid rock across the shear zone (Fig. 10). Indeed, this assumption (based on mineralogical and geochemical features of the selected samples) is justified by their similar elastic properties, calculated for the isotropic aggregates (Table 4).
Within the selected mylonite suite, the clast/matrix ratios dramatically decrease (from 1.2 to 0.2) as deformation proceeds. At the same time, quartz ribbons become widespread and micas tend to align parallel to mylonitic foliation. An addition, synmylonitic microstructures and new assemblages tend to replace the pre-mylonitic magmatic structures. In terms of changes in elastic properties and their distribution related to the rock fabric, we noted that within the shear zone the maxima in V p, V s and V s1 are within the foliation (x–y) plane, whereas the minima in V p, V s and V s2 tend to align normal to the mylonitic foliation. In particular, despite the fact that the compressional wave velocities remain quite constant within the foliation plane (c. 6 km s−1), we observed a progressive velocity decrease normal to foliaton (z-direction) as deformation proceeds (Fig. 11). As a consequence, V p anisotropy increases from 4.66% (in areas deformed at a lesser extent) to 6.92% in the most mylonitized domains (Fig. 13). Bulk anisotropy of the rocks is mainly caused by the phyllosilicate minerals (micas, chlorite), their modal abundances and crystal preferred orientation (CPO); indeed, as deformation proceeds and the angle between the S and C planes (S-C-C′ fabric) becomes smaller, the [001] axes tend to align parallel to the pole of the shearing plane. On the contrary, feldspars (which represent the load-bearing framework phases) probably make a negligible contribution to seismic anisotropy because of their brittle behaviour which does not produce appreciable CPO (Fig. 3a–h).
These results are also in agreement with recent studies on magnetic fabric, which highlighted a prevailing NE–SW-trending magnetic lineation and subhorizontal foliation planes (Zananiri et al. Reference Zananiri, Kondopoulou, Dimitriadis and Kilias2013) within the KSZ, confirming the high anisotropy character of the granitoid pluton which underwent ductile shearing of variable extent.
Importantly, the calculated normal incidence reflection coefficients (R c) between the mylonitic granodiorite and the host rock are in the range 0.01–0.02; interestingly, when considering the observed seismic anisotropy of the mylonitic rocks, the coefficients are higher (0.02–0.03) with the highest value obtained in the most-deformed sample (KB4). It is worth noting that even these relatively small values can produce significant reflections, especially when low-angle laminated geometries are involved as occurs within shear zones (e.g. Fountain, Hurich & Smithson, Reference Fountain, Hurich and Smithson1984; Hurich & Smithson, Reference Hurich and Smithson1987; Hurich, Deemer & Indares, Reference Hurich, Deemer and Indares2001; Ross et al. Reference Ross, Brown, Pananont, Nelson, Klemperer, Haines, Wenjin and Jingru2004; Brown et al. Reference Brown, Zhang, Palomeras, Simancas, Carbonell, Juhlin and Salisbury2012). As a consequence, within the shear zone the field mylonitic planar fabric (strike 199°; dip 14° ESE) could likely act as a reflector surface. It should however be noted that the thickness of the lithologic units is critical in any interpretation of reflectivity. A characteristic thickness of observable reflectors is estimated to be c. 20–200 m (e.g. Parsons, Howie & Thompson, Reference Parsons, Howie and Thompson1992; Rey, Fountain & Clement, Reference Rey, Fountain and Clement1994) which is comparable with the estimated thickness of the shear zone (up to 200 m).
Results obtained clearly indicate the textural control (e.g. increasing CPO, especially of strongly anisotropic minerals, and grain size reduction) on the distribution of seismic anisotropy along a granitoid body within an extensional shear zone, therefore providing a link between microstructures, tectonics and the distribution of seismic properties. In addition, they allow large-scale seismic data, when available, to be better constrained and reflector geometries, together with the dynamics of crustal evolution, to be understood to a greater extent.
Acknowledgements
We thank Volker Feeser for the laboratory facilities and Detlef Schulte-Kortnak and Robert Hinkes for their technical support in Kiel. We are indebted to Salvatore Critelli for the critical reading of the manuscript. We are also grateful to Sebastiano Imposa for the constructive discussion about the seismic reflection coefficients and to Nino Lo Giudice for his valuable help. Finally, we thank Mark Allen, Telemaco Tesei and an anonymous reviewer for the suggestions that improved the paper. This work was supported by PRIN 2009 (research project grant by the Italian MIUR), project title ‘Tectono-metamorphic evolution of the crystalline basement units of the eastern sector of the Rhodope Massif’.