


1. Introduction
The gradual decrease of the mantle potential temperature since the Eoarchaean influenced several systematic geochemical changes in the crust and mantle, which helped to stabilize the cratons by the end of the Neoarchaean (Richter, Reference Richter1988; Polat et al. Reference Polat, Appel and Fryer2011 a; Keller & Schoene, Reference Keller and Schoene2018; Condie, 2020; Gamal El Dien et al. Reference Gamal El Dien, Doucet, Murphy and Li2020; Windley et al. Reference Windley, Kusky and Polat2021). As a consequence of decrease of the mantle potential temperature vis-à-vis lowering of the geothermal gradient, the thermal structure of the Earth’s interior was transformed and the stabilized cratons broke apart and reassembled to initiate ‘Wilson Cycle type’ plate tectonics during the Archaean–Proterozoic boundary (Brown, Reference Brown2010; Laurent et al. Reference Laurent, Martin, Moyen and Doucelance2014; Brown et al. Reference Brown, Johnson and Gardiner2020 a; Kusky et al. Reference Kusky, Wang, Robinson, Huang, Wirth, Ning, Zhong and Polat2021; Windley et al. Reference Windley, Kusky and Polat2021). Such control of geothermal gradient for operating the plate tectonics during the Archaean–Proterozoic boundary can best be understood by studying the pressure–temperature (P–T) evolution of the granulite- (high-T) and eclogite-facies (high-P) rocks which formed and evolved in direct response to various tectonic activities during that time (Brown, Reference Brown2006, Reference Brown2007, Reference Brown2014; Brown & Johnson, Reference Brown and Johnson2018, Reference Brown and Johnson2019; Cawood et al. Reference Cawood, Hawkesworth, Pisarevsky, Dhuime, Capitanio and Nebel2018; Nutman et al. Reference Nutman, Bennett, Friend and Yi2020).
The Indian subcontinent hosts a large number of such high-grade (essentially granulite-facies) rocks within several Precambrian orogenic belts. The majority of these high-grade rocks are either Palaeo- to Mesoproterozoic (c. 1700–1500 Ma) or Neoproterozoic to Late Cambrian (c. 1000–900 and 550–480 Ma) in age (e.g. Eastern Ghats Belt; Central India Tectonic Zone; Aravalli Delhi Mobile Belt; Chotanagpur Gneissic Complex; Bhopalpatnam Granulite Belt; and parts of Southern Granulite Terrane) (reviewed in Dasgupta et al. Reference Dasgupta, Bose and Das2013; Mukherjee et al. Reference Mukherjee, Dey, Sanyal, Sengupta and Mukherjee2019; Chattopadhyay et al. Reference Chattopadhyay, Bhowmik and Roy2020; Dey et al. Reference Dey, Karmakar, Ibanez-Mejia, Mukherjee, Sanyal and Sengupta2020; Fareeduddin & Banerjee; Reference Fareeduddin and Banerjee2020; Ganguly & Chatterjee, Reference Ganguly and Chatterjee2020; Santosh, Reference Santosh2020). Other than those, the oldest Mesoarchaean-Palaeoproterozoic (c. 3000–2450 Ma) granulite-facies rocks in India are also reported from the Coorg block (Santosh et al. Reference Santosh, Yang, Shaji, Tsunogae, Mohan and Satyanarayanan2015; Amaldev et al. Reference Amaldev, Santosh, Tang, Baiju, Tsunogae and Satyanarayanan2016), Karimnagar Granulite Belt (Santosh et al. Reference Santosh, Yokoyama and Acharyya2004; Prakash et al. Reference Prakash, Singh, Tewari, Joshi, Frimmel, Hokada and Rakotonandrasana2017) and the southern end of the Dharwar craton (Northern Granulite Terrane or Salem Block) that continues up to the Palghat–Cauvery Shear System (PCSS) within the Southern Granulite Terrane (SGT) (e.g. Rao et al. Reference Rao, Chetty, Janardhan and Gopalan1996; Bhaskar Rao et al. Reference Bhaskar Rao, Janardhan, Vijaya Kumar, Narayana, Dayal, Taylor, Chetty and Ramakrishnan2003; Braun & Kriegsman, Reference Braun, Kriegsman, Yoshida, Windley and Dasgupta2003; Ghosh et al. Reference Ghosh, de Wit and Zartman2004; Clark et al. Reference Clark, Collins, Kinny, Timms and Chetty2009; Anderson et al. Reference Anderson, Payne, Kelsey, Hand, Collins and Santosh2012; Peucat et al. Reference Peucat, Jayananda, Chardon, Capdevila, Fanning and Paquette2013; Ram Mohan et al. Reference Ram Mohan, Satyanarayanan, Santosh, Sylvester, Tubrett and Lam2013; Santosh et al. Reference Santosh, Shaji, Tsunogae, Ram Mohan, Satyanarayanan and Horie2013; Brandt et al. Reference Brandt, Raith, Schenk, Sengupta, Srikantappa and Gerdes2014; Samuel et al. Reference Samuel, Santosh, Liu, Wang and Sajeev2014; Raith et al. Reference Raith, Brandt, Sengupta, Berndt, John and Srikantappa2016; Li et al. Reference Li, Santosh and Palin2018; George et al. Reference George, Sajeev, Santosh and Zhai2019; Han et al. Reference Han, Santosh, Ganguly and Li2019; Talukdar et al. Reference Talukdar, Mukhopadhyay, Sanyal and Sengupta2019; Ratheesh-Kumar et al. Reference Ratheesh-Kumar, Windley, Xiao, Jia, Mohanty and Zeba-Nezrin2020). While the peak metamorphism of the Karimnagar Granulite Belt and Coorg block occurred in the Neoarchaean (c. 2600 Ma) and Mesoarchaean (c. 3000 Ma), respectively, the parts of the SGT (from Northern Granulite Terrane to PCSS) underwent peak metamorphism during the Archaean–Proterozoic boundary (c. 2700–2450 Ma). Hence, to understand the plate tectonics during the Archaean–Proterozoic boundary in terms of the Indian subcontinent, computation and comparison of the evolution of the geothermal gradient from different parts of PCSS within the SGT are necessary based on the characterization of the style of metamorphism.
Within the SGT, the PCSS is an anastomosing network (∼350 × 70 km) of several shear zones that is bounded by the Moyar–Bhavani Shear Zone in the north and the Palghat–Cauvery Shear Zone in the south (Fig. 1). Several mappable rafts of Neoarchaean layered magmatic complexes with oceanic crustal affinities are present within the PCSS (reviewed in Brandt et al. Reference Brandt, Raith, Schenk, Sengupta, Srikantappa and Gerdes2014). The Sittampundi Layered Complex (SLC) is one of the magmatic layered complexes, consists of mafic, ultramafic and anorthositic rocks with chromitite layers and was interpreted as an arc/ophiolite complex formed in the Archaean suprasubduction zone arc setting at c. 2540 Ma (Subramaniam, Reference Subramaniam1956; Windley et al. Reference Windley, Bishop and Smith1981; Rao et al. Reference Rao, Chetty, Janardhan and Gopalan1996; Dutta et al. Reference Dutta, Bhui, Sengupta, Sanyal and Mukhopadhyay2011; Ghosh & Konar, Reference Ghosh and Konar2012; Ram Mohan et al. Reference Ram Mohan, Satyanarayanan, Santosh, Sylvester, Tubrett and Lam2013; Karmakar et al. Reference Karmakar, Mukherjee, Sanyal and Sengupta2017; Talukdar et al. Reference Talukdar, Sanyal and Sengupta2017, He et al. Reference He, Wang, George, Sajeev, Guo, Lai and Zhai2021). The SLC suite was intruded by voluminous felsic magmas of a calc-alkaline nature during the narrow span of c. 2530–2500 Ma, and underwent polyphase deformation and high-grade metamorphism at c. 2490–2450 Ma (e.g. Rao et al. Reference Rao, Chetty, Janardhan and Gopalan1996; Ghosh et al. Reference Ghosh, de Wit and Zartman2004; Chowdhury et al. Reference Chowdhury, Talukdar, Sengupta, Sanyal and Mukhopadhyay2013; Ram Mohan et al. Reference Ram Mohan, Satyanarayanan, Santosh, Sylvester, Tubrett and Lam2013; Karmakar et al. Reference Karmakar, Mukherjee, Sanyal and Sengupta2017; Talukdar et al. Reference Talukdar, Sanyal and Sengupta2017; He et al. Reference He, Wang, George, Sajeev, Guo, Lai and Zhai2021). The metabasites of the SLC were considered to attain peak metamorphism in the eclogite-facies condition (Subramaniam, Reference Subramaniam1956; Sajeev et al. Reference Sajeev, Windley, Connolly and Kon2009). However, Rao et al. (Reference Rao, Chetty, Janardhan and Gopalan1996), Chowdhury et al. (Reference Chowdhury, Talukdar, Sengupta, Sanyal and Mukhopadhyay2013) and Karmakar et al. (Reference Karmakar, Mukherjee, Sanyal and Sengupta2017) reported that the peak metamorphism of the SLC occurred under high-pressure granulite-facies conditions (850–750 °C and 11–13 kbar). Recently, Karmakar et al. (Reference Karmakar, Mukherjee, Sanyal and Sengupta2017) suggested a new possibility, that the corundum-bearing anorthosite in the SLC might have undergone ultra-high-temperature (UHT) metamorphism prior to the high-pressure granulite-facies metamorphism. On the contrary, George et al. (Reference George, Sajeev, Santosh and Zhai2019) established that the adjacent Kolli Hills area experienced peak metamorphism at 980 °C temperature and 22 kbar pressure (eclogite-facies?) during c. 2526 Ma.
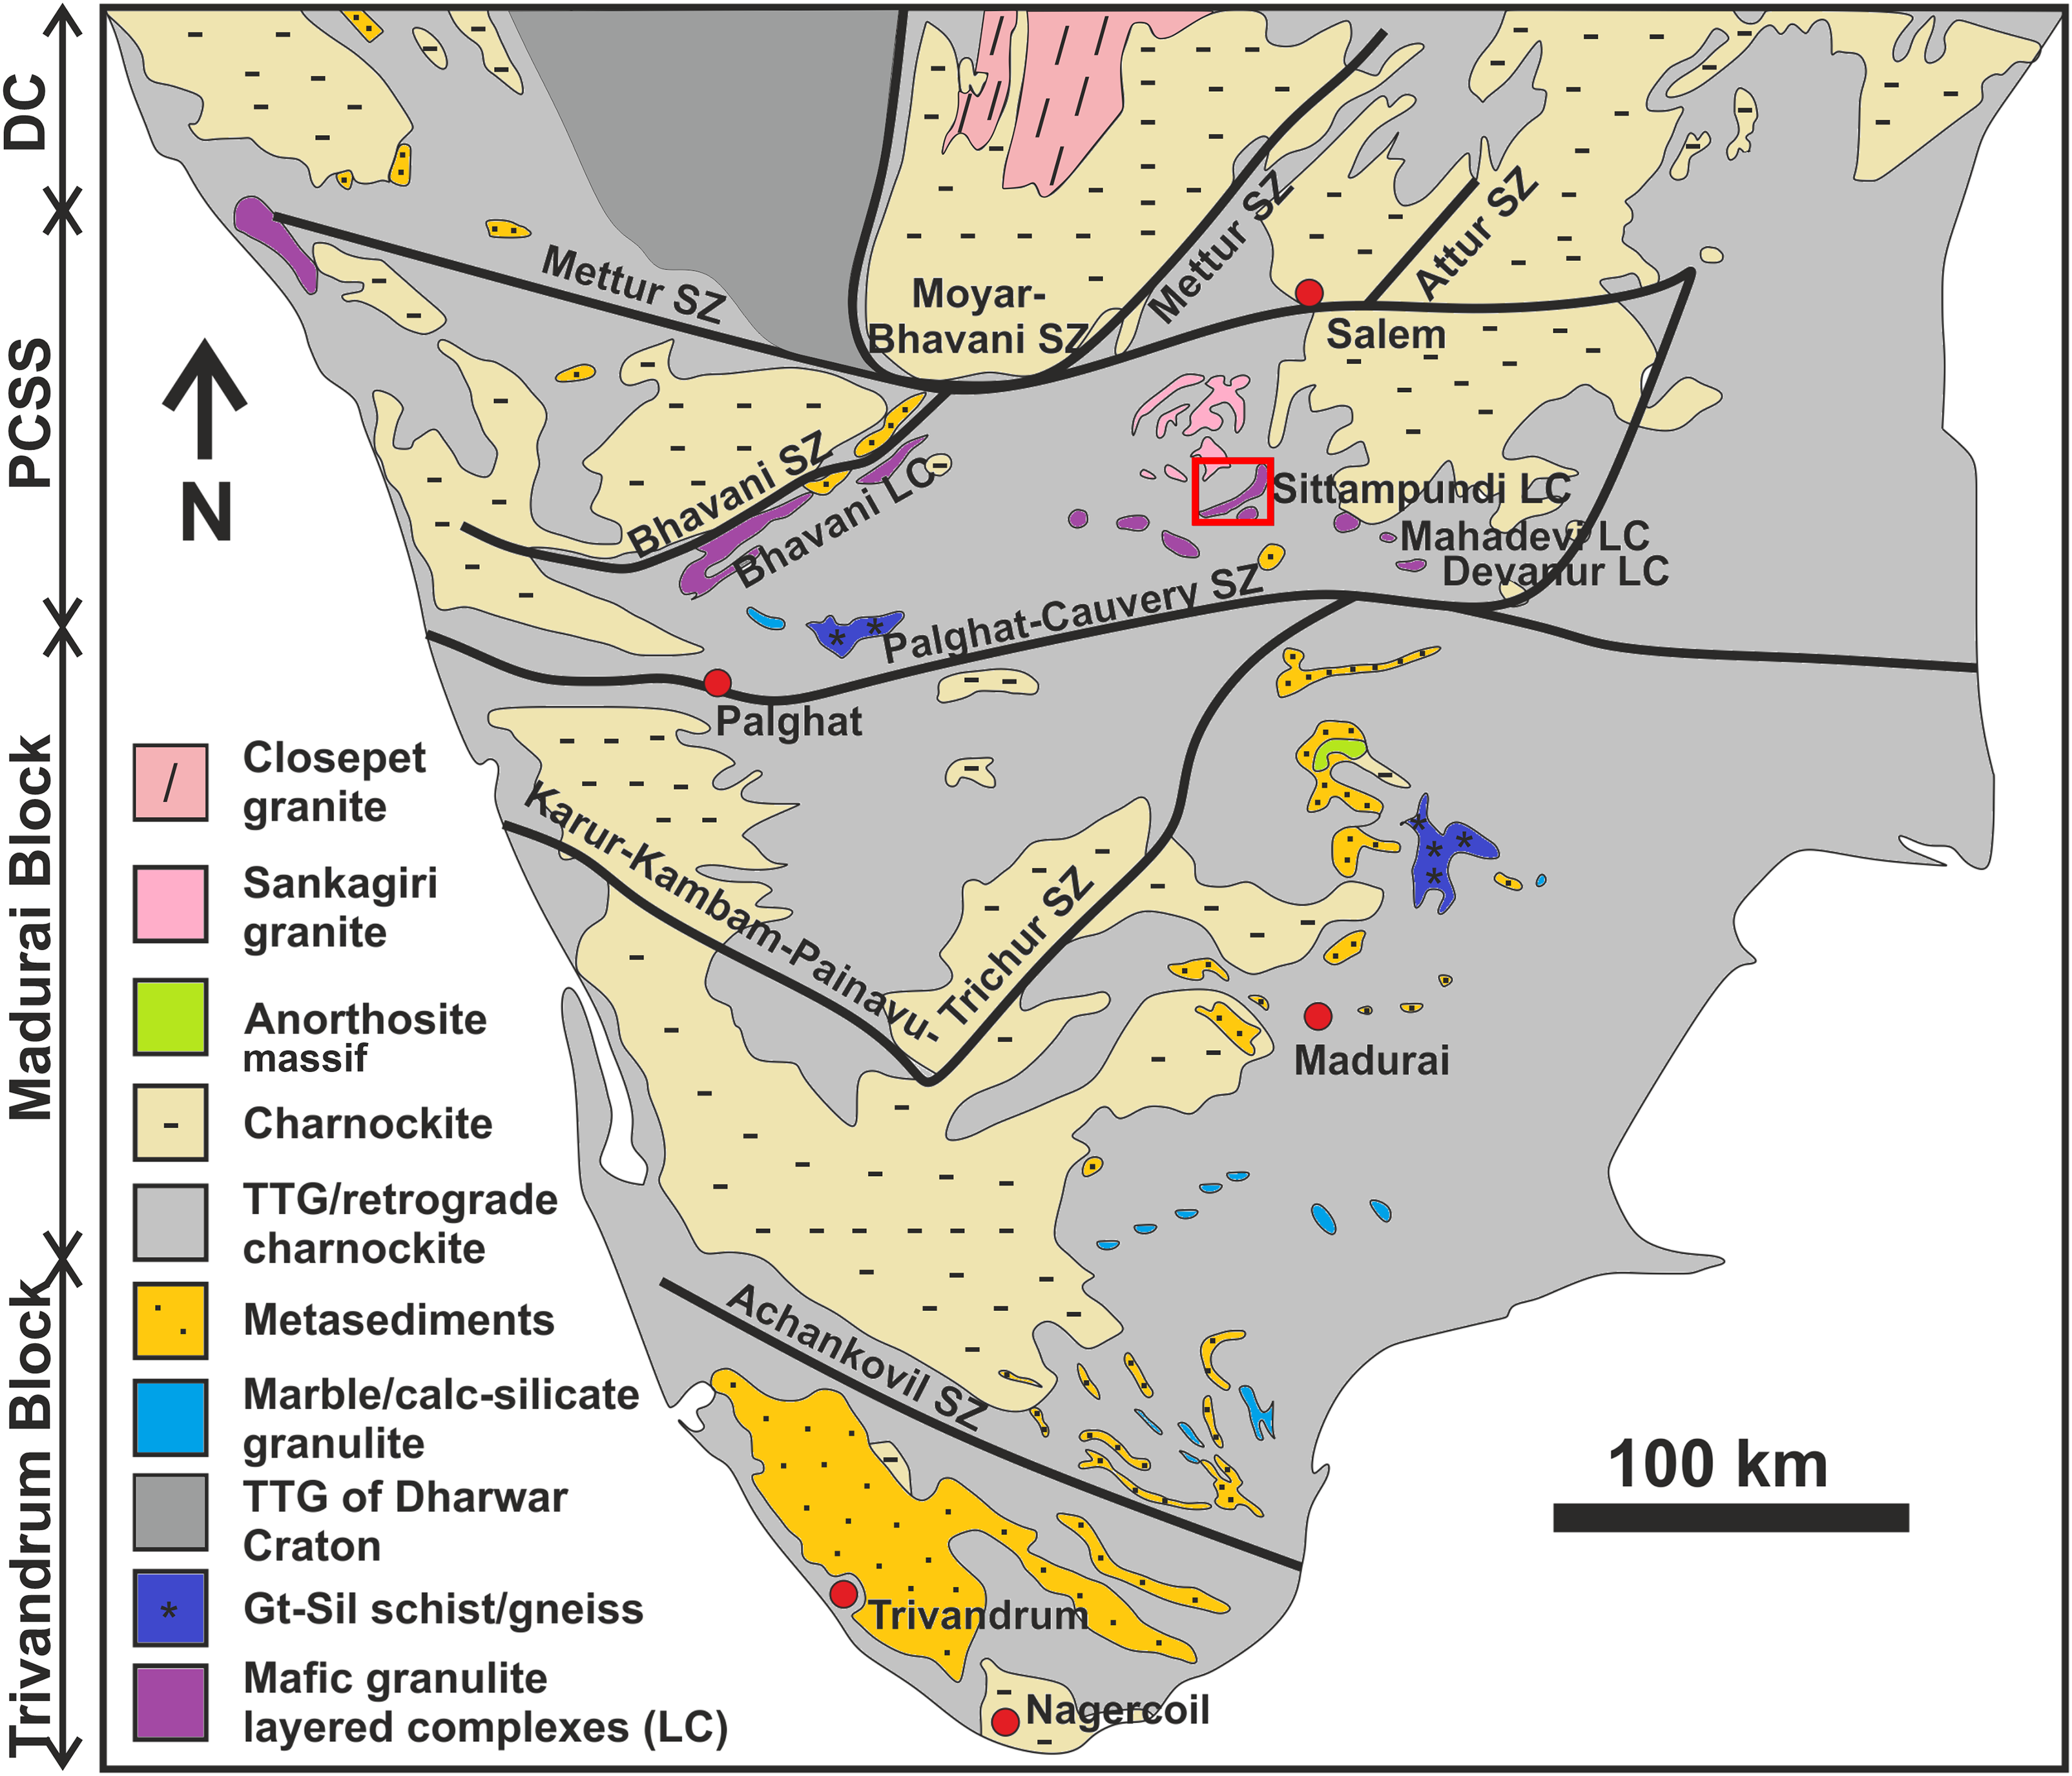
Fig. 1. (a) A generalized geological map of the Southern Granulite Terrane (SGT), south India (modified after the Geological Survey of India map of Tamil Nadu, published in 2001). The rectangle marks the study area. Abbreviations used are: SZ – shear zone, LC – layered complex.
Excluding the Archaean mantle eclogite xenoliths (reviewed in Tappe et al. Reference Tappe, Smart, Pearson, Steenfelt and Simonetti2011; Melnik et al. Reference Melnik, Korolev, Skublov, Müller, Li and Li2021), crustal (orogenic) eclogite-facies rocks of Archaean time have been never found on Earth until now. If the metabasites of the SLC underwent eclogite-facies metamorphism during the Neoarchaean, these metabasites will be the oldest eclogite-facies rocks after the c. 2010 Ma old eclogite-facies rocks of Cameroon (Loose & Schenk, Reference Loose and Schenk2018), indicating that the apparent average geothermal gradient in a Neoarchaean subduction zone was low enough to form eclogites in the subduction zone. Therefore, further study is necessary to check whether the metabasite of SLC underwent eclogite-facies metamorphism or granulite-facies metamorphism. It is also necessary to determine the precise timing of the peak metamorphism of the metabasites, which is still lacking.
In the present study, we carried out the mineral chemical analyses with an Electron Microprobe (EPMA), and whole-rock analyses by inductively coupled plasma mass spectrometry (ICP-MS) for quantitative petrological studies. Zircon U–Pb Sensitive High-Resolution Ion Microprobe (SHRIMP) dating on the metabasites of the SLC was undertaken to constrain the timing of protolith formation and different stages of metamorphism. We then determined the peak and retrograde metamorphic conditions of the metabasites by applying conventional geothermobarometric calculations combined with pseudosection modelling. The tectonic affinity of the protolith was determined using the whole-rock compositions. Finally, by combining the results of this and previous studies, we attempted to determine the apparent average geothermal gradient of the Archaean–Proterozoic boundary, which, in turn, controls the style of metamorphism during that time.
2. General geology
Southern India mainly consists of the Archaean Dharwar Craton (DC) in the north and the Proterozoic SGT in the south (Fig. 1). The SGT is one of the oldest granulites of India, having evolved for more than 2 billion years since the Archaean–Proterozoic boundary (e.g. Braun & Kriegsman, Reference Braun, Kriegsman, Yoshida, Windley and Dasgupta2003; Ghosh et al. Reference Ghosh, de Wit and Zartman2004; Plavsa et al. Reference Plavsa, Collins, Foden, Kropinski, Santosh, Chetty and Clark2012; Brandt et al. Reference Brandt, Raith, Schenk, Sengupta, Srikantappa and Gerdes2014; Santosh et al. Reference Santosh, Yang, Shaji, Tsunogae, Mohan and Satyanarayanan2015, Reference Santosh, Yang, Shaji, Ram Mohan, Tsunogae and Satyanarayanan2016). Within the SGT, several roughly E–W-trending crustal-scale shear/suture zones occur, which are collectively known as the PCSS. The PCSS is also commonly referred to as the Moyar–Bhavani–Cauvery Suture (MBCS), Cauvery Shear System (CSS) and Cauvery–Bhavani Shear System (CBSS) in the existing literature (reviewed in Brandt et al. Reference Brandt, Raith, Schenk, Sengupta, Srikantappa and Gerdes2014). The Northern Granulite Block (also known as the Salem Block), which is a possible extension of the Dharwar craton that continues even beyond the PCSS (Ghosh et al. Reference Ghosh, de Wit and Zartman2004; Plavsa et al. Reference Plavsa, Collins, Foden, Kropinski, Santosh, Chetty and Clark2012; Brandt et al. Reference Brandt, Raith, Schenk, Sengupta, Srikantappa and Gerdes2014; Sengupta et al. Reference Sengupta, Raith, Kooijman, Talukdar, Chowdhury, Sanyal, Mezger and Mukhopadhyay2015; Raith et al. Reference Raith, Brandt, Sengupta, Berndt, John and Srikantappa2016), is separated from the Madurai, Trivandrum and Nagercoil Block by the PCSS (Fig. 1). All of these blocks have distinct geological histories in terms of their isotopic and structural signatures (Braun & Kriegsman, Reference Braun, Kriegsman, Yoshida, Windley and Dasgupta2003; Ghosh et al. Reference Ghosh, de Wit and Zartman2004; Plavsa et al. Reference Plavsa, Collins, Foden, Kropinski, Santosh, Chetty and Clark2012; Brandt et al. Reference Brandt, Raith, Schenk, Sengupta, Srikantappa and Gerdes2014). Over the years, the PCSS was defined differently by several authors as (1) a dextral strike-slip shear zone (Drury et al. Reference Drury, Harris, Holt, Reeves-Smith and Wightman1984); (2) a collapsed marginal basin (Drury & Holt, Reference Drury and Holt1980); (3) a collision/suture zone (Meißner et al. Reference Meißner, Deters, Srikantappa and Köhler2002; Bhaskar Rao et al. Reference Bhaskar Rao, Janardhan, Vijaya Kumar, Narayana, Dayal, Taylor, Chetty and Ramakrishnan2003; Santosh et al. Reference Santosh, Xiao, Tsunogae, Chetty and Yellappa2012); (4) analogous to the central part of the Limpopo mobile belt (Ramakrishnan, Reference Ramakrishnan1993); (5) an Archaean–Neoproterozoic boundary (Harris et al. Reference Harris, Santosh and Taylor1994); (6) a zone of Palaeoproterozoic and Neoproterozoic reworking of Archaean crust (Harris et al. Reference Harris, Santosh and Taylor1994; Rao et al. Reference Rao, Chetty, Janardhan and Gopalan1996; Chetty et al. Reference Chetty, Bhaskar Rao, Narayana and Ramakrishnan2003; Ghosh et al. Reference Ghosh, de Wit and Zartman2004); (7) an extended join with Madagascar and East Antarctica (Ghosh et al. Reference Ghosh, de Wit and Zartman2004; Brandt et al. Reference Brandt, Raith, Schenk, Sengupta, Srikantappa and Gerdes2014; Sengupta et al. Reference Sengupta, Raith, Kooijman, Talukdar, Chowdhury, Sanyal, Mezger and Mukhopadhyay2015); and (8) a crustal-scale ‘flower structure’ (Chetty & Bhaskar Rao, Reference Chetty and Bhaskar Rao2006). According to Drury et al. (Reference Drury, Harris, Holt, Reeves-Smith and Wightman1984), Gopalakrishnan et al. (Reference Gopalakrishnan, Venkata Rao and Viswanathan1990), Rao et al. (Reference Rao, Chetty, Janardhan and Gopalan1996) and Chetty & Bhaskar Rao (Reference Chetty and Bhaskar Rao2006), the PCSS has experienced three phases of deformation (D1, D2 and D3). As a result of the D1 deformation stage, the regional-scale F1 fold formed in the Archaean and was first refolded into tight isoclinal folds (F2) by the D2 deformation during the Palaeoproterozoic and then into upright to open cross-folds (F3). The ENE–WSW axial planar mylonitic foliation developed during the D3 deformation, which is manifested as a network of shear zones. The network of shear zones within the PCSS defines a crustal-scale flower structure that formed due to dextral transpression during oblique subduction and collision between the DC and Madurai block (Chetty & Bhaskar Rao, Reference Chetty and Bhaskar Rao2006) during the D3 deformation in the late Neoproterozoic–Cambrian. As a consequence of subduction and collision, the N–S-trending structural fabrics of the DC were reworked by the E–W-trending fabrics of the PCSS (Drury et al. Reference Drury, Harris, Holt, Reeves-Smith and Wightman1984; Rao et al. Reference Rao, Chetty, Janardhan and Gopalan1996; Chetty et al. Reference Chetty, Bhaskar Rao, Narayana and Ramakrishnan2003; Anderson et al. Reference Anderson, Payne, Kelsey, Hand, Collins and Santosh2012; Yellappa et al. Reference Yellappa, Santosh, Chetty, Kwon, Park, Nagesh, Mohanty and Venkatasivappa2012; Ram Mohan et al. Reference Ram Mohan, Satyanarayanan, Santosh, Sylvester, Tubrett and Lam2013; Santosh et al. Reference Santosh, Shaji, Tsunogae, Ram Mohan, Satyanarayanan and Horie2013; Brandt et al. Reference Brandt, Raith, Schenk, Sengupta, Srikantappa and Gerdes2014). Several studies reveal that the PCSS is a trace of the Ediacaran–Cambrian suture that extends from Madagascar and resulted from the closure of the Mozambique Ocean during the assembly of Gondwana (Collins et al. Reference Collins, Clark, Sajeev, Santosh, Kelsey David and Matin2007 a; Raharimahefa & Kusky, Reference Raharimahefa and Kusky2009). Santosh et al. (Reference Santosh, Maruyama and Yamamoto2009) suggested that the long-lived Pacific-style Neoproterozoic subduction–accretion tectonics culminated in a Himalayan-style collision along the zone during the late Neoproterozoic–Cambrian. As a result, the southern part of the PCSS was influenced by the latest Neoproterozoic–Cambrian tectonometamorphic events, whereas the northern part of the PCSS was dominated by the late Neoarchaean – early Palaeoproterozoic tectonometamorphic events (Ghosh et al. Reference Ghosh, de Wit and Zartman2004; Brandt et al. Reference Brandt, Raith, Schenk, Sengupta, Srikantappa and Gerdes2014; Collins et al. Reference Collins, Clark and Plavsa2014; Plavsa et al. Reference Plavsa, Collins, Foden and Clark2015). On the other hand, it is also postulated that as a component of the unified land mass consisting of Madagascar, East Antarctica and parts of the Indian shield, the PCSS existed even before the Neoproterozoic era, as the Neoarchaean rocks are found further south of the PCSS (Ghosh et al. Reference Ghosh, de Wit and Zartman2004; Brandt et al. Reference Brandt, Raith, Schenk, Sengupta, Srikantappa and Gerdes2014; Sengupta et al. Reference Sengupta, Raith, Kooijman, Talukdar, Chowdhury, Sanyal, Mezger and Mukhopadhyay2015; Raith et al. Reference Raith, Brandt, Sengupta, Berndt, John and Srikantappa2016).
The PCSS is composed of amphibolite-facies migmatitic hornblende gneiss, hornblende–biotite gneiss, and granitic orthogneiss and granulite-facies orthopyroxene gneiss, and massive charnockite (reviewed in Brandt et al. Reference Brandt, Raith, Schenk, Sengupta, Srikantappa and Gerdes2014). These rocks host multiple lenses of metasedimentary rocks, such as paragneiss, metapelite, marble, calc-silicate rock and quartzite (e.g. Chetty, Reference Chetty, Santosh and Yoshida1996). As well as the metasedimentary rocks, mappable rafts of several layered magmatic complexes have also been reported. These layered magmatic complexes are the Salem Layered Complex, Attapadi Ophiolite Complex (Agali Hill), Bhawani Layered Complex, Mahadevi Layered Complex, Devanur Layered Complex and Sittampundi Layered Complex (SLC; Fig. 2) (Subramaniam, Reference Subramaniam1956; Windley et al. Reference Windley, Bishop and Smith1981; Rao et al. Reference Rao, Chetty, Janardhan and Gopalan1996, Reference Bhaskar Rao, Janardhan, Vijaya Kumar, Narayana, Dayal, Taylor, Chetty and Ramakrishnan2003; Dutta et al. Reference Dutta, Bhui, Sengupta, Sanyal and Mukhopadhyay2011; Ghosh & Konar, Reference Ghosh and Konar2012; Yellappa et al. Reference Yellappa, Santosh, Chetty, Kwon, Park, Nagesh, Mohanty and Venkatasivappa2012, Reference Yellappa, Santosh and Manju2019; Noack et al. Reference Noack, Kleinschrodt, Kirchenbaur, Fonseca and Munker2013; Santosh et al. Reference Santosh, Shaji, Tsunogae, Ram Mohan, Satyanarayanan and Horie2013; Brandt et al. Reference Brandt, Raith, Schenk, Sengupta, Srikantappa and Gerdes2014; Karmakar et al. Reference Karmakar, Mukherjee, Sanyal and Sengupta2017; Talukdar et al. Reference Talukdar, Sanyal and Sengupta2017, Reference Talukdar, Mukhopadhyay, Sanyal and Sengupta2019; Chowdhury & Chakraborty, Reference Chowdhury and Chakraborty2019). Among these layered magmatic complexes, the Bhawani Layered Complex and SLC have drawn special attention during the last few decades because they contain economically profitable and non-profitable chromite seams and highly calcic anorthosites (Subramaniam, Reference Subramaniam1956; Windley et al. Reference Windley, Bishop and Smith1981; Rao et al. Reference Rao, Chetty, Janardhan and Gopalan1996; Dutta et al. Reference Dutta, Bhui, Sengupta, Sanyal and Mukhopadhyay2011; Ghosh & Konar, Reference Ghosh and Konar2012; Brandt et al. Reference Brandt, Raith, Schenk, Sengupta, Srikantappa and Gerdes2014; Karmakar et al. Reference Karmakar, Mukherjee, Sanyal and Sengupta2017; Talukdar et al. Reference Talukdar, Sanyal and Sengupta2017). The SLC covers an area of c. 36 km × 2 km and is located ∼80 km SSW of Salem city, Tamil Nadu. The rocks of the SLC are structurally concordant within the supracrustal gneiss (cratonic rocks), which suggests that they were emplaced within the craton before regional deformation and metamorphism (Rao et al. Reference Rao, Chetty, Janardhan and Gopalan1996). From bottom to top, the complex hosts magnesite-veined dunite, chromite-layered clinopyroxenite, chromite-layered anorthosite, and clinopyroxene-bearing meta-gabbro (Dutta et al. Reference Dutta, Bhui, Sengupta, Sanyal and Mukhopadhyay2011; Dharma Rao et al. Reference Dharma Rao, Santosh, Sajeev and Windley2012), which are capped by banded iron formations and basaltic amphibolites (Ram Mohan et al. Reference Ram Mohan, Satyanarayanan, Santosh, Sylvester, Tubrett and Lam2013). Compared to the surrounding rocks, the SLC is structurally more deformed. These rocks have been folded into a tight isoclinal antiform that is not reported in the adjacent cratonic gneisses. Subsequently, these rocks were refolded in an open fold with a N–S-trending axial plane, forming an arcuate pattern (Ghosh & Konar, Reference Ghosh and Konar2011). Due to the nature of the folding, the stratigraphy is repeated in reverse order, resulting in a maximum thickness of ∼2 km (Fig. 2).

Fig. 2. A lithological map of the study area (Sittampundi Layered Complex) (modified after Subramaniam, Reference Subramaniam1956) showing sample location.
The peak metamorphic conditions of the rocks in the SLC are controversial. Subramaniam (Reference Subramaniam1956) reported that eclogite-facies rocks are present as layers and lenses within the anorthosite. Pseudosection modelling and very rare omphacite inclusions in garnet suggested that these rocks underwent peak metamorphism at 1020 °C temperature and 20 kbar pressure (Sajeev et al. Reference Sajeev, Windley, Connolly and Kon2009). On the other hand, conventional geothermobarometric calculation by Rao et al. (Reference Rao, Chetty, Janardhan and Gopalan1996) denied the possibility of eclogite-facies metamorphism and concluded that the peak metamorphism occurred under high-pressure granulite-facies conditions (900–850 °C and 12 kbar). The peak P as 12 kbar was also estimated by Chowdhury et al. (Reference Chowdhury, Talukdar, Sengupta, Sanyal and Mukhopadhyay2013) and Karmakar et al. (Reference Karmakar, Mukherjee, Sanyal and Sengupta2017) from the SLC. However, their calculated peak T was slightly lower, i.e. 750 °C. After attaining the peak P–T condition, these high-grade rocks were retrogressed down to 700–600 °C and 6–8 kbar conditions by following a steep decompressive P–T path (Rao et al. Reference Rao, Chetty, Janardhan and Gopalan1996; Chowdhury et al. Reference Chowdhury, Talukdar, Sengupta, Sanyal and Mukhopadhyay2013; Karmakar et al. Reference Karmakar, Mukherjee, Sanyal and Sengupta2017). Similar peak and retrograde P–T conditions (peak: 800 °C and 12–14 kbar; retrograde: 580–620 °C and 6–8 kbar) are also established from the adjacent Mahadevi Layered Complex (Chowdhury & Chakraborty, Reference Chowdhury and Chakraborty2019). The adjoining Nilgiri and Kanja Malai Hills also experienced similar high-pressure granulite-facies metamorphism (Raith et al. Reference Raith, Srikantappa, Buhl and Koehler1999; Saitoh et al. Reference Saitoh, Tsunogae, Santosh, Chetty and Horie2011; Anderson et al. Reference Anderson, Payne, Kelsey, Hand, Collins and Santosh2012; Noack et al. Reference Noack, Kleinschrodt, Kirchenbaur, Fonseca and Munker2013; Samuel et al. Reference Samuel, Sajeev, Hokada, Horie and Itaya2015). A recent report by George et al. (Reference George, Sajeev, Santosh and Zhai2019), on the other hand, again invokes the possibility that eclogite-facies peak metamorphism (980 °C temperature and 22 kbar pressure) affected the adjacent Kolli Hills area.
Rao et al. (Reference Rao, Chetty, Janardhan and Gopalan1996) first attempted to estimate the age of peak metamorphism and the age of anorthosite emplacement by the whole-rock Sm–Nd isochron method. Those authors suggested that the anorthosite emplacement took place at 2935 ± 60 Ma and that peak metamorphism (M1) occurred soon after the emplacement of the magmatic rocks. A high-precision geochronological investigation using the bulk-separated zircon U–Pb method revealed that the anorthosite emplacement occurred at 2541 ± 13 Ma in a supra-subduction zone arc setting (Ram Mohan et al. Reference Ram Mohan, Satyanarayanan, Santosh, Sylvester, Tubrett and Lam2013) and that the high-grade peak metamorphism occurred at c. 2460 Ma (Chowdhury et al. Reference Chowdhury, Talukdar, Sengupta, Sanyal and Mukhopadhyay2013; Ram Mohan et al. Reference Ram Mohan, Satyanarayanan, Santosh, Sylvester, Tubrett and Lam2013). Similar age of high-grade metamorphism in the north of the SLC was also determined by Peucat et al. (Reference Peucat, Mahabaleswar and Jayananda1993, Reference Peucat, Jayananda, Chardon, Capdevila, Fanning and Paquette2013), Braun & Kriegsman (Reference Braun, Kriegsman, Yoshida, Windley and Dasgupta2003), Anderson et al. (Reference Anderson, Payne, Kelsey, Hand, Collins and Santosh2012) and Ratheesh-Kumar et al. (Reference Ratheesh-Kumar, Windley, Xiao, Jia, Mohanty and Zeba-Nezrin2020). A recent report by Talukdar et al. (Reference Talukdar, Mukhopadhyay, Sanyal and Sengupta2019) obtained from the adjacent Mahadevi Layered Complex also is at par with the findings of Chowdhury et al. (Reference Chowdhury, Talukdar, Sengupta, Sanyal and Mukhopadhyay2013) and Ram Mohan et al. (Reference Ram Mohan, Satyanarayanan, Santosh, Sylvester, Tubrett and Lam2013). The age data and their interpretations discussed above also coincide with the findings of Raith et al. (Reference Raith, Srikantappa, Buhl and Koehler1999), Ghosh et al. (Reference Ghosh, de Wit and Zartman2004), Clark et al. (Reference Clark, Collins, Kinny, Timms and Chetty2009), Saitoh et al. (Reference Saitoh, Tsunogae, Santosh, Chetty and Horie2011), Sato et al. (Reference Sato, Santosh, Tsunogae, Chetty and Hirata2011) and Samuel et al. (Reference Samuel, Sajeev, Hokada, Horie and Itaya2015) from the adjacent areas. The ophiolite formation located adjacent to the anorthosite not only yields Archaean and Palaeoproterozoic ages but also preserves a weak Neoproterozoic signature of c. 720 Ma (Rao et al. Reference Rao, Chetty, Janardhan and Gopalan1996; Ram Mohan et al. Reference Ram Mohan, Satyanarayanan, Santosh, Sylvester, Tubrett and Lam2013). However, no study has successfully determined the age of the peak metamorphism of the metabasite in the SLC.
3. Methodology
Petrographic analyses and textural observations were conducted at the Department of Earth and Environmental Science, Jeonbuk National University, South Korea, using an optical microscope.
The mineral compositions were analysed using Shimadzu EPMA 1600 installed at the Korea Basic Science Institute, Jeonju. The accelerating voltage was fixed at 15 kV, whereas the beam current and probe diameter were set to 20 nA and 1 μm, respectively. Natural and synthetic silicates and oxides were used as standard materials during the analyses. The raw data were quantified as oxides by the ZAF method.
The bulk rock compositions (major element, trace element, and rare-earth element (REE) abundances) of SP1A, SP1E and SP1K were calculated using ICP-MS (Perkin Elmer Optima 3000) at the Activation Laboratories, Ancaster, Ontario, Canada. The Fe2O3 was measured by the titration method, and the loss on ignition (LOI) was considered equivalent to the amount of H2O. Prior to this analysis, each sample was crushed to 90 % and passed through #10 mesh, and then split to yield a ∼250 g powdered sample. Consequently, the powdered samples were further pulverized to 95 % and passed through a #200 mesh to collect unbiased sample powders for analysis.
For bulk-separated geochronological analysis, the three samples were crushed down to ∼5 mm diameter chips using an oil-press mill and further smashed down to powder (∼250 μm diameter) using a ball mill pulverizer. Following the initial crushing, zircon grains were separated from the powdered rock samples by the heavy mineral separation method using wet-sieving, panning and magnetic separation methods with a hand-held Nd magnet and Frantz Isodynamic Magnetic Separator (Model L1). The separated zircon grains, together with standard zircon grains, were then hand-picked and mounted in epoxy resin. Unfortunately, only one sample (SP1A) contained ∼15 datable grains of zircon, which were separated from ∼10 kg of rock samples. The rest of the grains are too small to be analysed by the SHRIMP IIe. The other two samples were entirely devoid of zircon and/or monazite. The mount was polished with 1 μm diamond paste until all the grains were properly exposed on the surface. The zircon grains were analysed for U–Pb dating by SHRIMP IIe at Hiroshima University. The spot size was c. 18 µm, and five scans through the critical mass ranges were made for data collection. The analytical conditions of the SHRIMP IIe involved a Köhler aperture of 70 μm, a source slit of 80 μm, a collector slit of 90 μm, an ESA voltage of 941.70 V, an arc voltage of 60 mA and a primary current of 2800 V. Counts of 196Zr2O, 204Pb, 206Pb, 207Pb, 208Pb, 238U, 248ThO, 254UO and background (204.1Pb) were measured during each scan. The analytical technique was adopted from the methodology outlined by Saha et al. (Reference Saha, Das, Hidaka, Kimura, Chakraborty and Hayasaka2016). Two zircon standards, FC1 (1099 ± 0.6 Ma; Paces & Miller, Reference Paces and Miller1993) and SL13 (572 Ma, U concentration = 238 ppm; Claoué-Long et al. Reference Claoue-Long, Compston, Roberts, Fanning, Berggren, Kent, Aubry and Hardenbol1995) were used for the U–Pb calibration and the calculation of the U content in the samples, respectively. The weighted average ages of the standard were within the error range of the reference zircon grains (1099 ± 0.6 Ma). Based on the method developed by Compston (Reference Compston1999), a common Pb correction was applied to the measured 204Pb. Finally, Isoplot/Ex 4.15 (Ludwig, Reference Ludwig2012) and CONCH (Nelson, Reference Nelson2006) were used for age calculations and various statistical plotting of the age data. Only near-concordant ages (≤5 % discordant points) were considered for probability density plots and single-population weighted-average age calculations. Spot ages are quoted at the 1σ level, whereas mean ages are given at the 95 % confidence level. All the ages mentioned in the results section are 207Pb/206Pb ages.
4. Field occurrence and petrography
The rocks targeted in the present study are reddish-black metabasite (Fig. 3). These rocks were collected from precisely the same locality of the eclogite occurrence as described by Sajeev et al. (Reference Sajeev, Windley, Connolly and Kon2009). These reddish-black metabasites occur within the anorthosite bodies as lenses and layers and are surrounded by thick to thin amphibolite rims (Fig. 3a, b) which formed due to retrogression vis-à-vis hydration during exhumation (Sajeev et al. Reference Sajeev, Windley, Connolly and Kon2009). Unlike the abundant occurrences of anorthosite bodies in and around Sittampundi village, such isolated occurrences of mafic lenses within the anorthosite bodies are restricted exclusively to this particular area. Occasionally, these mafic rocks are interlayered with the host anorthosite bodies (Fig. 3b). In addition to these anorthosite bodies, isolated exposures of leucogranite and rare garnetite associated with meta-gabbro (Fig. 3c) have also been reported from the study area.

Fig. 3. Field occurrences of rocks observed in the study area. (a) The reddish-black metabasite typically occurs within the anorthosite body and is partially enclosed by an amphibolite layer. (b) Mafic-rich layers are present within the anorthisitic host rock. (c) Isolated exposure of garnetite that is found very close to the metabasite.
Thin-sections were prepared from all the reddish-black metabasite collected in and around the sampling site. From the mineralogical and textural points of view, three different varieties of reddish-black metabasite were selected for detailed petrological investigations. The location details, textural, mineralogical and chemical characteristics of these three samples are summarized in Table 1.
Table 1. The location, mineralogy, texture and mineral chemistry of the studied metabasites

Note:por = porphyroblast; inc = inclusion; sym = symplectite. Mineral abbreviations are used after Whitney and Evans (Reference Whitney and Evans2010).
4.a. Sample SP1A
This reddish-black metabasite is coarse-grained and composed of garnet, clinopyroxene, amphibole, plagioclase (as Pl1 and Pl2), ilmenite (as Ilm1 and Ilm2) and rutile with minor quartz. Garnet, plagioclase (Pl1) and clinopyroxene are present as porphyroblastic phases (Fig. 4a, b). Rutile, clinopyroxene and minor quartz occur as inclusions within garnet porphyroblasts (Fig. 4b), but it is important to note that no omphacite inclusions were found in the several thin-sections of this sample. The overall texture of the rock is granoblastic (Fig. 3a). The peak mineral assemblage is defined by the presence of garnet, plagioclase (Pl1), clinopyroxene, rutile, coarse ilmenite (Ilm1), and quartz (Fig. 4a). Symplectite texture formed locally around the porphyroblastic garnet (Fig. 4b). The symplectite consists of amphibole (Amp), plagioclase (Pl2) and fine ilmenite (Ilm2), indicating that the amphibole (Amp) + plagioclase (Pl2) + fine-ilmenite (Ilm2) mineral assemblage was formed due to the following reactions:
 $${\rm{Grt}} + {\rm{Qz}} + {\rm{Rt}} + {{\rm{H}}_2}{\rm{O}} \to {\rm{Amp}} + {\rm{P}}{{\rm{l}}_2} + {\rm{Il}}{{\rm{m}}_2}$$
 $${\rm{Grt}} + {\rm{Cpx}} + {\rm{Qz}} + {\rm{Rt}} + {{\rm{H}}_2}{\rm{O}} \to {\rm{Amp}} + {\rm{P}}{{\rm{l}}_2} + {\rm{Il}}{{\rm{m}}_2}$$

Fig. 4. The representative optical microphotographs of the three samples showing the overall mineralogy and textural assemblages. (a) The microphotograph of sample SP1A (PPL) shows the granoblastic texture composed of garnet (Grt), clinopyroxene (Cpx), plagioclase (Pl1) and coarse ilmenite (Ilm1) as a part of the peak assemblage. Amphibole (Amp) are found at the boundary of the clinopyroxene as part of the retrograde metamorphism. (b) Symplectite reaction texture (Sym) which consists of amphibole (Amp) and plagioclase (Pl2) around the porphyroblastic garnet (Grt) grains. Inclusion of clinopyroxene (Cpx) is also observed within the garnet (Grt) of sample SP1A. (c) The microphotograph of sample SP1K (PPL and CPL) depicts the presence of orthopyroxene (Opx) as inclusion in garnet (Grt) and as porphyroblast in the matrix. (d) The profound development of the symplectite (Sym) texture around the porphyroblastic garnet (Grt) and orthopyroxene (Opx) and rutile (Rt) inclusions within the garnet are reported from sample SP1K. (e) The microphotograph of sample SP1E (CPL) showing granoblastic texture which is marked by the equilibrium textural relationship between the porphyroblastic garnet (Grt) and clinopyroxene (Cpx) and the limited development of the symplectite texture (Sym) around the garnet (Grt). (f) Inclusion of quartz (Qz) and clinopyroxene (Cpx) are present within garnet (Grt) of sample SP1E. Mineral abbreviations are used after Whitney & Evans (Reference Whitney and Evans2010).
This type of symplectite could form due to decompression-related destabilization of the porphyroblastic garnet and rutile via reactions (1) and (2).
4.b. Sample SP1K
This medium- to coarse-grained reddish-black metabasite sample additionally contains rare orthopyroxene as inclusions within porphyroblastic garnet grains and as porphyroblasts in the matrix (Fig. 4c, d). Occasionally, randomly oriented needles of rutile are also observed as inclusions within garnet (Fig. 4d). However, this rock does not contain ilmenite (Ilm1) in the matrix. This rock also locally exhibits symplectite texture (amphibole and plagioclase) around the garnet grains, which may have formed due to decompression, as in sample SP1A (Fig. 4c, d).
The appearance of orthopyroxene as porphyroblasts or inclusions within the garnet grains may suggest that this rock experienced peak metamorphism below eclogite-facies metamorphic conditions. On the other hand, the presence of rutile needles within garnet suggests that the rock experienced high-grade metamorphism (ultra-high-pressure/high-pressure/high-temperature (UHP/HP/HT)) at the peak (Griffin et al. Reference Griffin, Jensen and Misra1971; Ague & Eckert, Reference Ague and Eckert2012). Because this rock was collected with two other rocks (samples SP1A and SP1E) from the same locality, the difference in mineral assemblage among the three samples may be due to compositional differences. However, to confirm the possibility of a compositional effect, the exact peak metamorphic P–T conditions of this rock will be compared with those of the other two samples in the latter part of this paper.
4.c. Sample SP1E
This reddish-black metabasite is coarse-grained. Mineralogically, this sample is similar to SP1A but does not have porphyroblastic plagioclase or plagioclase inclusions within the porphyroblastic garnet. The plagioclase grains are found as a part of the symplectite texture. The overall texture of the rock is granoblastic. The rock contains inclusions of quartz and clinopyroxene within garnet (Fig. 4e, f), similar to that of SP1A. However, the symplectite texture around the garnet is less developed than that in SP1A (Fig. 4e, f). The lesser amount of symplectite texture may be due to the presence of less water during retrograde metamorphism. In addition, unlike the other two samples, the clinopyroxene grains in the matrix are not rimmed by retrograde amphibole. Furthermore, this rock does not contain rutile and/or ilmenite as inclusions in garnet porphyroblasts or as minerals in the matrix.
The absence of plagioclase porphyroblast and plagioclase inclusion in garnet may suggest that the rock experienced peak metamorphism above the stability field of plagioclase, which is a common scenario in the case of eclogite-facies metamorphism. However, the bulk composition of the rock can also play a crucial role in the absence of plagioclase under conditions with lower pressures (granulite-facies) than those associated with eclogite-facies metamorphism (Jan & Howie, Reference Jan and Howie1981). To determine the exact reason(s) for the absence of plagioclase, the P–T conditions were estimated using a conventional geothermometer and pseudosection analysis on this particular rock.
5. Mineral chemistry
The mineral chemical data of the three samples were analysed using EPMA. The obtained data were then used in conventional geothermobarometric calculations and to understand the chemical characteristics of certain major minerals in the samples. In the following subsections, the mineral chemical data of the individual minerals of these rocks are described. The stoichiometric criteria of Droop (Reference Droop1987) were adopted for garnet and pyroxene to calculate the Fe3+ concentration. The representative mineral chemical data of the individual rocks are summarized in Tables 2–5.
Table 2. The representative EPMA mineral chemical data of garnet

P-T pairs for each sample involve garnet for peak and retrograde P-T estimations.
C: core, R: rim. XPrp = [Mg/(Fe+Mg+Ca+Mn)], XAlm = [Fe/(Fe+Mg+Ca+Mn)], XGrs = [Ca/(Fe+Mg+Ca+Mn)], XSps = [Mn/(Fe+Mg+Ca+Mn)], XFe = [Fe/(Fe+Mg)], XMg = [Mg/(Fe+Mg)].
Table 3. The representative EPMA mineral chemical data of clinopyroxene (all samples) and orthopyroxene (sample SP1K)

P-T pairs for each sample involve clinopyroxene and orthopyroxene (for sample SP1K only) for peak P-T estimations.
Inc: inclusion; Por: porphyroblast. XFe = [Fe/(Fe+Mg)], XMg = [Mg/(Fe+Mg)], XCa = [Ca/(Fe+Mg+Ca)] and XJd = (Na-Fe3+-2Ti).
Table 4. The representative EPMA mineral chemical data of plagioclase
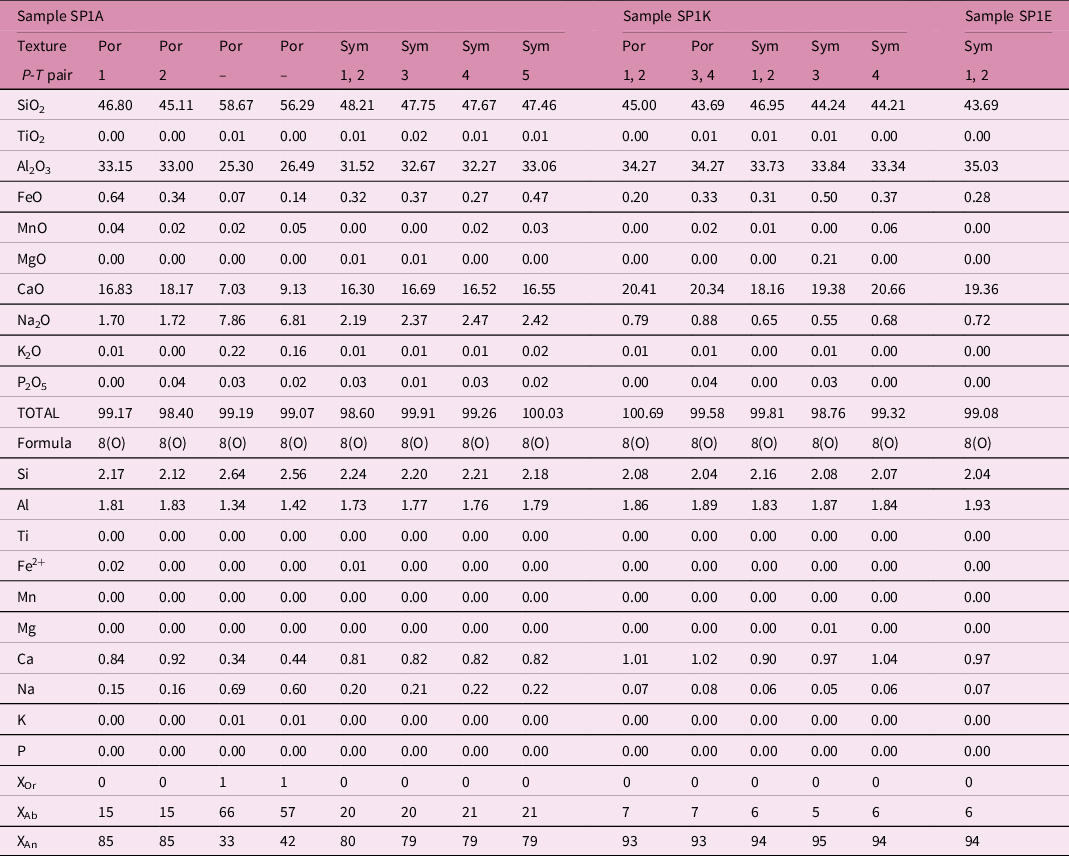
Notes: P-T pairs for each sample involve plagioclase for peak and retrograde P-T estimations.
Sym: symplectite, Por: porphyroblast. XAn = [Ca/(Na+Ca+K) x 100], XAb = [Na/(Na+Ca+K) x 100], XOr = [K/(Na+Ca+K) x 100].
Table 5. The representative EPMA mineral chemical data of amphibole

Notes: P-T pairs for each sample involve amphibole for retrograde P-T estimations.
Sym: symplectite. XFe = [Fe/(Fe+Mg)], XMg = [Mg/(Fe+Mg)].
5.a. Garnet
Garnet in all three samples is dominantly almandine–pyrope in composition with a minor amount of grossular and a negligible amount of spessartine (Table 2). In sample SP1A, the compositions of the garnet cores are 0.29–0.35 XPyrope [Mg/(Fe + Mg + Ca + Mn)], 0.46–0.53 XAlmandine [Fe/(Fe + Mg + Ca + Mn)], 0.16–0.19 XGrossular [Ca/(Fe + Mg + Ca + Mn)] and 0.01 XSpessertine [Mn/(Fe + Mg + Ca + Mn)], whereas the rims of the garnet exhibit a composition of 0.26–0.30 XPyrope, 0.48–0.56 XAlmandine, 0.16–0.20 XGrossular and 0.02 XSpessertine. In sample SP1K, the cores of the garnet exhibit XPyrope, XAlmandine, XGrossular and XSpessertine contents in the ranges of 0.36–0.49, 0.34–0.44, 0.16–0.18 and 0.01–0.02, respectively. In contrast, the rims of the garnet have compositions of 0.28–0.34 XPyrope, 0.47–0.54 XAlmandine, 0.15–0.18 XGrossular and 0.02–0.03 XSpessertine. The cores of the garnet grains in sample SP1E have 0.44–0.47 XPyrope, 0.36–0.39 XAlmandine, 0.15–0.16 XGrossular and 0.01 XSpessertine values, whereas the XPyrope, XAlmandine, XGrossular and XSpessertine values of the rims are 0.42–0.45, 0.37–0.40, 0.16–0.17 and 0.01, respectively.
5.b. Clinopyroxene
Clinopyroxene is abundant in all three samples (Table 3). In sample SP1A, all clinopyroxenes are diopsidic. The XFe [Fe/(Fe + Mg)] and XMg [Mg/(Fe + Mg)] contents do not exhibit any dramatic compositional differences between the cores of the porphyroblastic clinopyroxene and the clinopyroxene inclusions in garnet. The cores of porphyroblastic clinopyroxenes have XFe and XMg values of 0.26–0.29 and 0.71–0.74, respectively, and the clinopyroxene inclusions have XFe and XMg values of 0.23–0.27 and 0.73–0.77, respectively. In terms of XCa content [Ca/(Ca + Fe + Mg)], there is no discernible change between the porphyroblasts (0.44–0.46) and inclusions (0.46–0.49). The XJd (Na–Fe3+–2Ti) components of the porphyroblastic and included clinopyroxenes range from 0.02 to nil. The Al2O3 concentration of the porphyroblastic and included clinopyroxenes is generally higher than diopside, i.e. range between 1.84 and 4.58 wt %. The clinopyroxene is also diopsidic in composition for sample SP1K. The XFe and XMg contents of the clinopyroxene inclusions are 0.13–0.15 and 0.85–87, respectively. The core of the clinopyroxene porphyroblast exhibits the XFe and XMg composition as 0.12–0.16 and 0.84–0.88. The XJd contents of the inclusions and porphyroblasts are nil. The XCa contents of the inclusions and porphyroblasts vary between 0.48 and 0.49. The Al2O3 concentration of this sample is also high, ranging between 2.23 and 2.97 wt %. The composition of the clinopyroxene porphyroblasts (core) and inclusions is also diopsidic in sample SP1E. The XFe and XMg values of clinopyroxene porphyroblasts are 0.15–0.16 and 0.84–0.85, respectively, whereas the clinopyroxene inclusions have a constant composition from the core to the rim without any zoning (XFe: 0.14–0.15 and XMg: 0.85–0.86). The XCa content of the inclusions and porphyroblasts varies between 0.48 and 0.49. The XJd values of the clinopyroxene inclusions are nil. According to the Quad–Jd–Ae diagram by Morimoto (Reference Morimoto1988), all the pyroxene grains from these three samples are plotted in the Quad (En, Fs, Wo) field (Fig. 5a). The Al2O3 concentration of this sample is also high (2.69–4.62 wt %).

Fig. 5. Mineral classification diagrams based on their compositions. Different colours represent different samples (green for sample SP1A, yellow for sample SP1E and red for sample SP1K). (a) A Q–Jd–Ae clinopyroxene classification diagram (after Morimoto, Reference Morimoto1988) showing that all the clinopyroxene from the studied samples is located in the Quad (En, Fs, Wo) field. (b) A feldspar ternary diagram classified the plagioclase feldspar as porphyroblasts (Pl1) and symplectic (Pl2) for samples SP1A, SP1K and SP1E. (c) An amphibole classification diagram following the classification of Leake et al. (Reference Leake, Wooley and Arps1997) shows that the amphibole present in the studied samples is either pargasite or ferro-hastingsite with an edenite.
5.c. Orthopyroxene
Orthopyroxene grains are only observed in SP1K (Table 3). All orthopyroxene, whether present as tiny porphyroblasts in the matrix or as inclusions within garnet, is enstatitic in composition. The XMg and XFe values of the orthopyroxene porphyroblasts are 0.64 and 0.36, respectively.
On the other hand, most orthopyroxene inclusions have lower XFe contents (0.27–0.31) and higher XMg values (0.69–0.73) than orthopyroxene porphyroblasts. The orthopyroxene inclusions can be considered to retain the mineral chemistry that corresponds closely to the peak metamorphic conditions. The Al2O3 composition of these grains is restricted to a range of 1.84–2.32 wt %.
5.d. Plagioclase
Plagioclase is observed in SP1A and SP1K as porphyroblasts (Pl1) and symplectic (Pl2) (Table 4). However, in the SP1E, the plagioclase is exclusively symplectic (Table 4). In sample SP1A, the symplectic plagioclases (Pl2) have relatively consistent compositions of An79–86Ab14–21Or0 (An = Ca/(Na + Ca + K) × 100, Ab = Na/(Na + Ca + K) × 100, Or = K/(Na + Ca + K) × 100), whereas the plagioclase porphyroblasts (Pl1) show a wide compositional variation (An33–85Ab15–66Or0–1). Such variation possibly suggests that these grains were later affected by the post-peak retrograde metamorphism. The compositions of the plagioclases (Pl1 and Pl2) in sample SP1K are almost identical to each other. The Pl1 have the composition of An93Ab07Or0, and the Pl2 have compositions of An94–95Ab5–6Or0, which suggests that the plagioclases are close to the calcic end-member. The symplectic plagioclases in sample SP1E have minor compositional variations in the range of An94–95Ab5–6Or0. Hence, these plagioclases are also calcic. The compositions of all the plagioclase grains were plotted on a ternary diagram which depicts that, excluding two porphyroblastic grains from sample SP1A (andesine), all the porphyroblastic and symplectic plagioclases are bytownite. On the other hand, the porphyroblastic and symplectic plagioclases of samples SP1E and SP1K are exclusively anorthite (Fig. 5b).
5.e. Amphibole
Amphibole is present in abundance in all the samples at the boundary of the porphyroblastic garnet as one of the components of the symplectite texture (Table 5). In sample SP1A, amphiboles involved in the symplectite have XMg and XFe values of 0.65–0.71 and 0.29–0.35, respectively. Total Al values range between 2.05 and 2.45. The TiO2 contents are 0.88–1.48 wt %. In sample SP1K, the amphiboles in the symplectite have XMg and XFe values of 0.77–0.81 and 0.19–0.23, respectively, with total Al values of 2.17–2.25 and TiO2 wt % values of 0.45–0.71. In sample SP1E, amphibole is scarce, and the symplectite formation is not as conspicuous as in the other samples. The XMg and XFe values of amphiboles in the symplectite site are 0.85 and 0.15, respectively, with a total Al of 2.61. The TiO2 wt % of amphibole is 0.45. According to the classification scheme developed by Leake et al. (Reference Leake, Wooley and Arps1997), all the amphiboles are classified as either pargasite or ferro-hastingsite, with one grain plotted in the Edenite field (Fig. 5c).
6. Whole-rock geochemistry
All three samples were characterized in terms of their major elements, trace elements and REE compositions. The whole-rock geochemical data are presented in Supplementary Table 1 (available online at https://doi.org/10.1017/S0016756822000164). The SiO2 content ranges from 46.19 to 47.14 wt % in the three rocks, which suggests that these samples are mafic rocks with basaltic compositions. The MgO content is highest (16.25 wt %) in sample SP1E and lowest (8.97 wt %) in sample SP1A, whereas the Al2O3 content is lowest (11.82 wt %) in sample SP1E and highest (16.95 wt %) in sample SP1K. In sample SP1A, the Fe2O3 content (2.84 wt %) is high, while in samples SP1K and SP1E the Fe2O3 content is only 0.46 wt % and 0.94 wt %, respectively. The K2O and Na2O contents in all three samples range between <0.01 and 0.17 wt % and 0.36 and 1.64 wt %, respectively. Plotting the composition of our three rocks along with the mafic rocks of Ram Mohan et al. (Reference Ram Mohan, Satyanarayanan, Santosh, Sylvester, Tubrett and Lam2013) and Dutta et al. (Reference Dutta, Bhui, Sengupta, Sanyal and Mukhopadhyay2011) from the SLC on the (Na2O + K2O) vs SiO2 diagram (after Irvine & Baragar, Reference Irvine and Baragar1971) and the FeOt–(Na2O + K2O)–MgO ternary diagram (after Irvine & Baragar, Reference Irvine and Baragar1971) reveals that these rocks have subalkaline characteristics, and are tholeiitic in composition (Fig. 6a, b). On the Zr/Y vs Zr tectonic discrimination diagram (after Pearce & Norry, Reference Pearce and Norry1979), the majority of our samples along with the samples of Ram Mohan et al. (Reference Ram Mohan, Satyanarayanan, Santosh, Sylvester, Tubrett and Lam2013) from the SLC are plotted within the island-arc basalt field (Fig. 6c). The arc affinities of the rocks are further substantiated by the V–(Ti/1000) tectonic discrimination diagram (after Shervais, Reference Shervais1982), in which the Ti/V ratios of most of our, Ram Mohan et al.’s (Reference Ram Mohan, Satyanarayanan, Santosh, Sylvester, Tubrett and Lam2013) and Dutta et al.’s (Reference Dutta, Bhui, Sengupta, Sanyal and Mukhopadhyay2011) samples from the SLC are mostly within 20–10 (Fig. 6d). The mid-ocean ridge basalt (MORB)-normalized incompatible element pattern (after Alabaster et al. Reference Alabaster, Pearce and Malpas1982; Sun & McDonough, Reference Sun and McDonough1989) of our three samples exhibits a general trend of large-ion lithophile elements (LILE, e.g. Sr, Rb, Ba and Th) enrichment and high-field-strength element (HFSE, e.g. Nb, Ce, Zr and Hf) depletion, which are in accordance with the pattern obtained by Ram Mohan et al. (Reference Ram Mohan, Satyanarayanan, Santosh, Sylvester, Tubrett and Lam2013).

Fig. 6. Geochemical plots of the studied rocks in this and previous studies characterize their chemical affinities and tectonic settings. (a) The (Na2O + K2O) vs SiO2 diagram (after Irvine & Baragar, Reference Irvine and Baragar1971) shows that all three rocks fall into the subalkaline category. (b) The FeOt–(Na2O + K2O)–MgO ternary diagram (after Irvine & Baragar, Reference Irvine and Baragar1971) depicts that the studied rocks are tholeiitic in nature. (c) The Zr/Y vs Zr tectonic discrimination diagram (after Pearce & Norry, Reference Pearce and Norry1979) suggests that these rocks formed in an island-arc setting. (d) The V vs (Ti/1000) tectonic discrimination diagram (after Shervais, Reference Shervais1982) reveals that the majority of these rocks were formed in an island-arc environment.
7. Metamorphic evolution
The metamorphic evolution of the study area is problematic, as discussed in the Sections 1 and 2. Additionally, the mineralogy of the studied samples needs further clarification to understand the absence of plagioclase in the peak metamorphic assemblage of sample SP1E and the appearance of orthopyroxene in the peak metamorphic assemblage of sample SP1K. Thus, to resolve these issues, conventional geothermobarometric calculations were coupled with pseudosection modelling.
7.a. P–T estimation using conventional geothermobarometry
To elucidate the peak and retrogressed metamorphic P–T conditions, the three samples were investigated in detail. The compositions of cores of the porphyroblastic clinopyroxene are similar to those of the garnet-hosted clinopyroxene inclusion. Such similar compositions between the cores of the porphyroblastic clinopyroxene and the inclusions indicate that these grains generally retain the peak metamorphic mineral chemistry. However, the small differences in the compositions might reflect the retrograde effect of the porphyroblastic clinopyroxene in the matrix, which is surrounded by retrograde amphibole. Since the core compositions of the pyroxene porphyroblast are almost the same as those of the included pyroxenes, the P–T estimation from the garnet-core – included-clinopyroxene pair and garnet-core – porphyroblastic-clinopyroxene core pair remains identical within the standard error limit. To estimate the peak pressure, relatively pristine plagioclase grains were selected, which are associated with the porphyroblastic garnet and pyroxene. Among these pyroxenes, the clinopyroxenes of all three samples have high Al2O3 contents (1.841–4.616 wt %; average 3.119 wt %), which suggests that these clinopyroxenes were formed under high-pressure, high-temperature conditions (Yoder & Tilley, Reference Yoder and Tilley1962; Wilson, Reference Wilson1976). Although the AlVI ion (0.53 Å) can substitute Mg2+ (0.72 Å) or Fe2+ (0.77 Å) in an octahedral site by volume reduction during high-pressure metamorphism (Wilson, Reference Wilson1976), the effect of Al while calculating peak P–T is negligible (Ai, Reference Ai1994). Thus, the computed peak P–T values involving the high-Al clinopyroxenes are considered valid. On the other hand, the retrograde P–T conditions were estimated from the reactive garnet rims and the adjacent symplectic/retrograde amphibole and plagioclase. The P–T conditions calculated by the conventional methods are summarized in Table 6.
Table 6. P-T estimations of three samples by conventional geothermobarometers

Note: Geothermobarometers used: 1Ganguly et al. (Reference Ganguly, Cheng and Tirone1996); 2Ellis & Green (Reference Ellis and Green1979); 3Moecher et al. (Reference Moecher, Essene and Anovitz1988); 4Eckert et al. (Reference Eckert, Newton and Kleppa1991); 5Perchuk et al. (Reference Perchuk, Aranovich, Podlesskii, Lavrant’eva, Gerasimov, Fed’kin, Kitsul, Karsakov and Berdnikov1985); 6Graham & Powell (Reference Graham and Powell1984); 7(Kohn & Spear, Reference Kohn and Spear1990); 8Bhattacharya et al. (Reference Bhattacharya, Krishnakumar, Raith and Sen1991); 9Perkins & Chipera (Reference Perkins and Chipera1985).
In sample SP1A, the peak metamorphic T values estimated using the garnet–clinopyroxene thermometer were 1024–905 °C (944 ± 20 °C; using Ganguly et al. Reference Ganguly, Cheng and Tirone1996) and 836–732 °C (767 ± 18 °C; using Ellis & Green, Reference Ellis and Green1979). The peak metamorphic P values calculated by the garnet–clinopyroxene–plagioclase–quartz barometer of Moecher et al. (Reference Moecher, Essene and Anovitz1988) and Eckert et al. (Reference Eckert, Newton and Kleppa1991) were 11–13 kbar (12 ± 1 kbar) and 9–11 kbar (10 ± 1 kbar), respectively. By adopting the same geothermometers of Ganguly et al. (Reference Ganguly, Cheng and Tirone1996) and Ellis & Green (Reference Ellis and Green1979) for sample SP1E, 909–864 °C (893 ± 11 °C) and 834–786 °C (817 ± 10 °C) were estimated as the peak metamorphic T conditions respectively, but the peak P of this rock cannot be computed due to the absence of plagioclase in the peak metamorphic assemblage. The peak T of sample SP1K was calculated by the garnet–orthopyroxene and garnet–clinopyroxene geothermometers. The garnet–clinopyroxene geothermometers of Ganguly et al. (Reference Ganguly, Cheng and Tirone1996) and Ellis & Green (Reference Ellis and Green1979) yielded peak T values of 960–818 °C (914 ± 33 °C) and 874–709 °C (825 ± 39 °C), while the garnet–orthopyroxene geothermometers of Bhattacharya et al. (Reference Bhattacharya, Krishnakumar, Raith and Sen1991) and Ganguly et al. (Reference Ganguly, Cheng and Tirone1996) yielded peak T values of 1224–845 °C (1059 ± 79 °C) and 1191–892 °C (1109 ± 72 °C), respectively. Peak P values of 14–10 kbar (12 ± 2 kbar) and 8–10 kbar (9 ± 1 kbar) were obtained for sample SP1K using the garnet–clinopyroxene–plagioclase–quartz barometers of Moecher et al. (Reference Moecher, Essene and Anovitz1988) and Eckert et al. (Reference Eckert, Newton and Kleppa1991), respectively. The garnet–orthopyroxene–plagioclase–quartz barometers of Bhattacharya et al. (Reference Bhattacharya, Krishnakumar, Raith and Sen1991) and Perkins & Chipera (Reference Perkins and Chipera1985) estimated peak pressures as 9–11 kbar (10 ± 1 kbar) and 11–12 kbar (12 ± 1 kbar), respectively. Summarizing the peak P–T estimations of the three samples reveals that all the samples experienced peak metamorphism under 14–11 kbar pressure and 900–800 °C temperature conditions, indicating that the different mineral assemblages in the three metabasites are due to compositional differences.
The retrogressed P–T conditions, under which the porphyroblastic garnet destabilized to form the surrounding symplectite texture, are calculated by the garnet–amphibole geothermometer and garnet–amphibole–plagioclase–quartz geobarometer. The mineral chemical data used for these minerals are exclusively from various symplectite textures. In sample SP1A, the garnet–amphibole geothermometers of Perchuk et al. (Reference Perchuk, Aranovich, Podlesskii, Lavrant’eva, Gerasimov, Fed’kin, Kitsul, Karsakov and Berdnikov1985) and Graham & Powell (Reference Graham and Powell1984) yield retrogressed temperatures of 553–527 °C (540 ± 5 °C) and 563–524 °C (548 ± 6 °C), respectively. The garnet–amphibole–plagioclase–quartz barometer (Kohn & Spear, Reference Kohn and Spear1990) yields a retrogressed pressure of 6–3.9 kbar (4.7 ± 0.3 kbar). Using the same geothermobarometers, the retrogressed P–T conditions are calculated as 501–496 °C (499 ± 3 °C) and 511–503 °C (507 ± 4 °C) and 6.3–4.6 kbar (5.5 ± 0.9) for SP1E. For sample SP1K, the temperature is calculated as 498–473 °C (486 ± 6 °C) and 502–467 °C (481 ± 8 °C) by the geothermometers of Perchuk et al. (Reference Perchuk, Aranovich, Podlesskii, Lavrant’eva, Gerasimov, Fed’kin, Kitsul, Karsakov and Berdnikov1985) and Graham & Powell (Reference Graham and Powell1984), respectively, whereas the pressure is calculated as 6.1–3.9 kbar (4.9 ± 0.5 kbar; using Kohn & Spear, Reference Kohn and Spear1990). Thus, the retrogressed P–T conditions of all three samples are also similar within the range of 550–480 °C and 5.5–4.5 kbar.
7.b. P–T estimation using pseudosection modelling
P–T pseudosection modelling was performed using the Perple_X program (Connolly & Petrini, Reference Connolly and Petrini2002, updated in 2017) with a consistent thermodynamic data set suggested by Holland & Powell (Reference Holland and Powell2011) to constrain the metamorphic P–T conditions of samples SP1A and SP1E. The Na2O–CaO–FeO–MgO–Al2O3–SiO2–H2O–TiO2–Fe2O3 (NCFMASHTO) system was used for pseudosection modelling. The measured whole-rock bulk composition, in molar amounts, of sample SP1A is Na2O = 1.686, CaO = 14.076, FeO = 10.198, MgO = 14.18, Al2O3 = 8.679, SiO2 = 48.979, H2O = 0.318, TiO2 = 0.751 and Fe2O3 (O) = 1.133, and the following activity models were used during pseudosection modelling: the activity models suggested by White et al. (Reference White, Powell, Holland, Johnson and Green2014) for garnet, ilmenite and magnetite; Dale et al.’s activity model (Reference Dale, Holland and Powell2000) for clinopyroxene (Jennings & Holland, Reference Jennings and Holland2015); Dale et al.’s model (Reference Dale, Holland and Powell2000) for amphibole; Holland & Powell’s model (Reference Holland and Powell2011) for epidote; and Newton et al.’s model (Reference Newton, Charlu and Kleppa1980) for plagioclase. Due to the absence of evidence in favour of melting in the meso- to microscopic scale, the melting was not considered for the pseudosection modelling. Quartz was considered to be a pure end-member phase.
Considering the petrological observation described in the petrography section, the Grt + Cpx + Pl + Ilm + Ru + Qz assemblage in sample SP1A is considered to have been stable during the peak metamorphic stage (Fig. 4a). This mineral assemblage is stable at 900–760 °C and 14–10.7 kbar in the pseudosection (Fig. 7). The isopleths of clinopyroxene (XFe and XCa) and garnet core (XMg) were overprinted on the peak mineral stability field. Compositionally, the core of clinopyroxene porphyroblasts is 0.26–0.29 XFe and 0.44–0.46 XCa, whereas the XMg content of the garnet cores varies between 0.36 and 0.43 (Tables 2, 3). Several isopleths of garnet and clinopyroxene within their respective compositional ranges intersect each other multiple times in the peak mineral stability field (Fig. 7). The peak P–T range calculated by conventional geothermobarometers also fits perfectly within the peak mineral stability field (Fig. 7). Considering the cross-cutting relationship of the several isopleths of the peak metamorphic assemblage and the result of the conventional geothermobarometry, it is evident that the peak metamorphic condition was restricted within 830–770 °C and 13–11 kbar.

Fig. 7. The P–T pseudosection modelling for the condition of peak metamorphism from sample SP1A using the NCFMASHTO system. The molar percentages of oxides used for modelling are mentioned at the top of the figure. The peak metamorphic P–T condition is defined by the field in which the Grt–Cpx–Pl–Ilm–Rt–Qz assemblage is stable. The peak P–T condition obtained by the conventional geothermobarometers is overlapped within the peak mineral stability field (marked in grey shade). The XFe, XCa and XMg isopleths of porphyroblastic clinopyroxene and garnet are also superimposed within the peak mineral stability field. Mineral abbreviations are used after Whitney & Evans (Reference Whitney and Evans2010).
The mineral assemblage of the symplectite is not present even in the lower P–T conditions of the pseudosection which was constructed using the bulk-rock composition obtained by powdered sample. As the development of symplectite texture around the porphyroblastic garnet during retrogression was local, the (homogenized?) bulk-rock composition failed to represent the imprint of retrogression. Hence, to constrain the retrograde metamorphic conditions that triggered the formation of the symplectite, the effective bulk composition was calculated from the local area consisting of symplectite by the method outlined in Stüwe (Reference Stüwe1997). The modal percentages of the minerals in the symplectite texture, excluding the garnet core, were calculated by image analysis using the software ImageJ (ver. 1.51; Schneider et al. Reference Schneider, Rasband and Eliceiri2012). To obtain a representative modal percentage of the minerals, we calculated the average modal percentages of the minerals from several symplectites. The average mineral compositions were then integrated with modal percentages of the corresponding minerals to obtain the effective bulk composition of the symplectite texture. The measured effective bulk composition, in molar amounts, is Na2O = 0.982, CaO = 13.318, FeO = 17.427, MgO = 10.455, Al2O3 = 8.408, SiO2 = 46.160, H2O = 0.393, TiO2 = 1.737 and Fe2O3 (O) = 1.115. The same activity models used for the estimation of peak P–T metamorphism were chosen to construct this pseudosection model as well. The mineral assemblage of symplectite is Grt + Cpx + Amp + Pl + Ilm + Mt + Qz. This mineral assemblage is stable over a wide range of P–T conditions in the pseudosection (Fig. 8). The conventional geothermobarometric analysis revealed that the retrograde P–T condition was 550–480 °C temperature and 5.5–4.5 kbar pressure, which fall perfectly within the retrograde mineral stability field (Fig. 8).

Fig. 8. The P–T pseudosection modellings for the condition of retrograde metamorphism from sample SP1A using the NCFMASHTO system. The molar percentages of oxides used for modelling are mentioned at the top of the figure. The retrograde metamorphic P–T condition is defined by the field in which the Grt–Cpx–Pl–Amp–Ilm–Mt–Qz assemblage of the symplectite texture is stable. More precise P–T conditions of the retrograde metamorphism, obtained by conventional geothermobarometers, are superimposed within the retrograde mineral stability field (marked in grey shade). Mineral abbreviations are used after Whitney & Evans (Reference Whitney and Evans2010).
The pseudosection for sample SP1E was constructed using the whole-rock bulk composition (molar amounts): Na2O = 0.349, CaO = 9.996, FeO = 10.872, MgO = 24.224, Al2O3 = 6.965, SiO2 = 46.799, H2O = 0.334, TiO2 = 0.108 and Fe2O3 (O) = 0.354. The same activity models and chemical systems used for SP1A were also used in this pseudosection modelling. Based on the petrological observations, Grt + Cpx + Qtz + Rt assemblage is considered to be the peak mineral assemblage. This mineral assemblage is stable at temperatures higher than 830–810 °C and pressures higher than 9.7–9.0 kbar in this P–T space (Fig. 9). The estimated P–T range includes the temperature conditions estimated using the geothermometer, as well as the peak metamorphic P–T conditions estimated for the other samples. As mentioned before, SP1E likely experienced the same metamorphism as the other two samples. Thus, the absence of plagioclase in the peak assemblage in the SP1E may be due to compositional effects.

Fig. 9. A P–T pseudosection modelling for sample SP1E using the NCFMASHTO system. The molar percentages of oxides used for modelling are mentioned at the top of the figure. The peak metamorphic P–T conditions are defined by the field in which the Grt–Cpx–Rt–Qz without plagioclase is stable (above the Pl-out line). Mineral abbreviations are used after Whitney & Evans (Reference Whitney and Evans2010).
8. Geochronology
We carried out U–Pb SHRIMP analysis on bulk-separated zircon grains. However, despite the large amounts of rock samples (∼10 kg for each sample and 30 kg in total) crushed to a powder to extract zircon grains, we were able to separate measurable grains of zircon for U–Pb SHRIMP analysis from only one sample (SP1A). The other two samples contain zircon grains (5–10 grains per sample), but they are too small to measure (≤20 µm in diameter) via SHRIMP U–Pb analysis. The individual data points from sample SP1A are presented in Table 7.
Table 7. Analytical results of SHRIMP U-Pb zircon geochronology

Note: Calculated ages are 207Pb/206Pb ages.
From sample SP1A, 14 datable zircon grains were separated. The rest of the grains have a grain size less than the beam diameter of the SHRIMP or are filled with inclusions and cracks. The grains have various shapes and sizes. One group of zircon grains is elongated (aspect ratio ∼3:1) and has comparatively larger grain sizes (∼80–50 µm in length) than the other group of zircon grains (Fig. 10a). Some of this group show well-developed oscillatory zoning, but others show faint oscillatory zoning with or without rims. The other group of zircon grains is rounded to sub-rounded in shape with diameters ranging between 25 µm and 20 µm (Fig. 10a). Most grains show homogeneous/unzoned thin bright rims. The thin bright rims are too thin to be dated by SHRIMP. Inclusions of other minerals within the zircon grains are rare but not absent.

Fig. 10. (a) The cathodoluminescence images of zircon grains in sample SP1A reveal various textures. The white circles indicate the analysed locations of the U–Pb SHRIMP dating. The near-concordant ages in Ma are shown. (b) The U–Pb SHRIMP analytical plot of sample SP1A on the Wetherill concordia shows that the data points spread on the concordia line between c. 2500 and 1800 Ma, with a youngest discordant point near 400 Ma.
A total of 14 points were measured on 14 grains. Of these 14 points, only 9 yielded near-concordant ages. The U and Th contents of these 9 grains range between 2422 and 129 ppm and 302and 23 ppm, respectively. The Th/U ratio varies between 0.05 and 0.45. The oldest age is 2514 ± 16 Ma, while the youngest is 1842 ± 21 Ma. All the analysed points reveal a continuous spread of data points between c. 2500 Ma and c. 1800 Ma on the Wetherill concordia diagram, with the youngest discordant data point near 400 Ma (Fig. 10b). The coarse zircon grain showing well-developed oscillatory zoning yields an age of 2514 ± 16 Ma with the highest Th/U of 0.45. The fine-grained zircon grains yield ages of 2440 ± 11 Ma, 1854 ± 8 Ma and 1842 ± 21 Ma, with low Th/U between 0.10 and 0.43. Other zircon grains with faint zoning and intermediate Th/U ratio of 0.05–0.27 yield ages between 2015 and 2248 Ma.
9. Discussion
9.a. Tectonic setting of metabasites
Although the studied rocks experienced multiple phases (at least two stages) of high-grade metamorphism and/or deformation, the various geochemical plots of Ram Mohan et al. (Reference Ram Mohan, Satyanarayanan, Santosh, Sylvester, Tubrett and Lam2013; Fig. 8) depicted that immobile elements, such as Al, Na, HFSEs, REEs (except Eu), Th and transitional metals (V, Y and Ti), were mostly unaffected during and after metamorphism. Thus, the results obtained from several geochemical plots and tectonic discrimination diagrams are useful in interpreting the tectonic environment of the protoliths of the metabasites in this study.
The metabasites are characterized as subalkaline and basaltic tholeiite in nature. The plotting of these basaltic rocks in the Zr/Y vs Zr and V–Ti tectonic discrimination diagrams strongly indicates that they formed in an island-arc environment (Fig. 6c, d). This island-arc tectonic setting in the SLC is also supported by the presence of an active convergent zone on the southern margin of the DC during Neoarchaean time (Santosh et al. Reference Santosh, Xiao, Tsunogae, Chetty and Yellappa2012), which, in turn, was responsible for the generation of these arc magmas in the suprasubduction zone (Ram Mohan et al. Reference Ram Mohan, Satyanarayanan, Santosh, Sylvester, Tubrett and Lam2013). The selective enrichment of LILEs (Sr, Rb, Ba, Th) and the depletion of HFSEs (Nb, Ce, Zr, Hf) also suggest that the rocks were derived from an enriched mantle source in a suprasubduction setting (Fig. 5; Ram Mohan et al. Reference Ram Mohan, Satyanarayanan, Santosh, Sylvester, Tubrett and Lam2013). A similar suprasubduction-zone arc-related tectonic environment was also reported for the adjacent Archaean Devanur Layered Complex (Yellappa et al. Reference Yellappa, Santosh, Chetty, Kwon, Park, Nagesh, Mohanty and Venkatasivappa2012), Mahadevi Layered Complex (Talukdar et al. Reference Talukdar, Mukhopadhyay, Sanyal and Sengupta2019) and Attapadi Ophiolite Complex (Santosh et al. Reference Santosh, Shaji, Tsunogae, Ram Mohan, Satyanarayanan and Horie2013).
Analogous to SLC, suprasubduction zone arc-related tectonic environment for the development of Archaean layered complex and greenstone belt is commonly reported from Greenland (Ivisaartoq Greenstone Belt and Fiskenæsset Anorthosite Complex) and Canada (Doré Lake Complex) (Polat et al. Reference Polat, Frei, Appel, Dilek, Fryer, Ordóñez-Calderón and Yang2008, Reference Polat, Appel, Fryer, Windley, Frei, Samson and Huang2009, Reference Polat, Fryer, Appel, Kalvig, Kerrich, Dilek and Yang2011 b, Reference Polat, Frei, Longstaffe and Woods2018). A majority of the Archaean anorthosite complexes were formed in an arc setting, similar to the ophiolite-hosted Tethyan anorthosites, which suggest that throughout Earth’s history most of the anorthosite complexes formed as a consequence of collisional tectonics (Sotiriou & Polat, Reference Sotiriou and Polat2020).
9.b. Peak metamorphic conditions and metamorphic evolution of the metabasites
In this paper, a study on the metabasites in the SLC was carried out to reveal their tectonic evolution. Together with the results of previous studies, the age dating of igneous zircon grains and whole-rock analysis in this study indicates that the metabasites intruded at c. 2515 Ma in an arc tectonic setting, which is discussed in detail later. After intrusion, the combination of conventional geothermobarometry and pseudosection analyses revealed that the metabasites experienced high-pressure granulite-facies peak metamorphism (900–800 °C and 14–11 kbar) and then amphibolite-facies metamorphism (550–480 °C and 5.5–4.5 kbar). These results do not match the eclogite-facies metamorphism reported by Sajeev et al. (Reference Sajeev, Windley, Connolly and Kon2009) but do support the interpretation of granulite-facies metamorphism from the surrounding rocks (Rao et al. Reference Rao, Chetty, Janardhan and Gopalan1996; Dutta et al. Reference Dutta, Bhui, Sengupta, Sanyal and Mukhopadhyay2011; Chowdhury et al. Reference Chowdhury, Talukdar, Sengupta, Sanyal and Mukhopadhyay2013). Although Sajeev et al. (Reference Sajeev, Windley, Connolly and Kon2009) suggested these metabasites are eclogites, based on a very limited number of omphacite grains, which is a typical mineral in eclogites, we did not find omphacite in our study. Furthermore, most clinopyroxene grains in Sajeev et al. (Reference Sajeev, Windley, Connolly and Kon2009) are not omphacite, and the few that do exist are barely omphacite at all, with a jadeite content of 21 mole % (omphacite should have jadeite contents higher than 20 mole %). Chowdhury & Chakraborty (Reference Chowdhury and Chakraborty2019) mentioned that the omphacite observed by Sajeev et al. (Reference Sajeev, Windley, Connolly and Kon2009) and cited as evidence of eclogite-facies metamorphism might have appeared due to the presence of thin amphibole lamella within clinopyroxene. The P–T conditions for the breakdown curve of albite to albite + quartz clinopyroxene with XJd values of 0.20–0.30 correspond to the high-pressure granulite-facies field (900–800 °C), indicating that clinopyroxene with an XJd value of 0.21 can form under high-pressure granulite-facies conditions if the rock has the suitable whole-rock composition. Therefore, the metabasite found by Sajeev et al. (Reference Sajeev, Windley, Connolly and Kon2009) in the study area may better be labelled as a high-pressure metabasic granulite instead of an eclogite.
9.c. Age of igneous and metamorphic activities
The determination of the intrusive and metamorphic ages is exceptionally challenging because the studied rocks contain a very limited number of zircon grains. Thus, we have to combine our geochronological data with the data of previous workers from adjacent areas to determine the exact ages of metamorphism. The oldest spot age retrieved in this study is 2514 ± 16 Ma from an oscillatory zoned zircon with a high Th/U ratio (Fig. 10a), indicative of an igneous origin (Corfu et al. Reference Corfu, Hanchar, Hoskin and Kinny2003). This age coincides with the magmatic crystallization age of the Sittampundi anorthosite (2541 ± 13 Ma of Ram Mohan et al. Reference Ram Mohan, Satyanarayanan, Santosh, Sylvester, Tubrett and Lam2013, and 2522 ± 12 Ma of He et al. Reference He, Wang, George, Sajeev, Guo, Lai and Zhai2021), which is interlayered with the SCL metabasite. Thus, the combination of the age obtained from the zircon with oscillating zoning and the ages in the previous studies possibly suggests that the protolith of these rocks intruded during the late Neoarchaean between c. 2540–2520 Ma.
Following the Neoarchaean ages, an age of 2440 ± 11 Ma was retrieved from an unzoned/homogeneous and tiny zircon grain. Similar ages have been documented by several workers in adjacent areas (Clark et al. Reference Clark, Collins, Kinny, Timms and Chetty2009; Anderson et al. Reference Anderson, Payne, Kelsey, Hand, Collins and Santosh2012; Ram Mohan et al. Reference Ram Mohan, Satyanarayanan, Santosh, Sylvester, Tubrett and Lam2013; Behera et al. Reference Behera, Waele, Thirukumaran, Sundaralingam, Narayanan, Sivalingam and Biswal2019) and are interpreted as the age of peak metamorphism during c. 2490–2460 Ma. Although we have only limited age data, the combination of previous data with our data probably suggests that the peak metamorphism occurred in the early Palaeoproterozoic (c. 2460–2440 Ma), which, in turn, discards the possibility of the late Neoproterozoic to Cambrian peak metamorphism for these metabasites as suggested by Sajeev et al. (Reference Sajeev, Windley, Connolly and Kon2009).
In addition to these two ages, there are several younger ages ranging between c. 2250 and 1850 Ma (Fig. 9a, b). Although such ages are not uncommon in the study area (e.g. Rao et al. Reference Rao, Chetty, Janardhan and Gopalan1996; Ram Mohan et al. Reference Ram Mohan, Satyanarayanan, Santosh, Sylvester, Tubrett and Lam2013; Behera et al. Reference Behera, Waele, Thirukumaran, Sundaralingam, Narayanan, Sivalingam and Biswal2019), the significance of these ages is poorly constrained in previous studies. By adopting Ar/Ar age dating of retrograde minerals, such as hornblende, Behera et al. (Reference Behera, Waele, Thirukumaran, Sundaralingam, Narayanan, Sivalingam and Biswal2019) recently suggested that the peak granulite-facies rocks experienced retrograde metamorphism under amphibolite-facies conditions at c. 2000 Ma. However, these ages were completely absent in their zircon grains. Although c. 2000 Ma was suggested as the metamorphic age, c. 1850 Ma can be considered a more plausible age for the second metamorphism for the following reasons. In the study of Behera et al. (Reference Behera, Waele, Thirukumaran, Sundaralingam, Narayanan, Sivalingam and Biswal2019), c. 2500 Ma zircon grains and c. 1850 Ma zircon grains were observed, but zircon grains with intermediate ages were not reported. The youngest age at the rim of a partially retrograded monazite was c. 1850 Ma, which suggests that the ages between c. 2500 and c. 1850 Ma are partially reset ages. Ar/Ar age dating indicates that deformation occurred between 2016 Ma and 1852 Ma. In this study, we obtained ages spanning from c. 2015 to c. 2248 Ma from zircon grains with faint concentric, banded or sector zoning with intermediate Th/U, suggesting partial resetting by a metamorphic event after c. 2460–2440 Ma. We also obtained an age of c. 1850 Ma from a zircon with an unzoned texture and low Th/U, indicative of a metamorphic origin. Moreover, the estimated P–T conditions of the amphibolite-facies metamorphism in this study (550–480 °C and 5.5–4.5 kbar) are in consonance with the P–T condition (500 °C and 4 kbar) obtained by Behera et al. (Reference Behera, Waele, Thirukumaran, Sundaralingam, Narayanan, Sivalingam and Biswal2019). Hence, we suggest that the amphibolite-facies retrograde metamorphism may have occurred at c. 1850 Ma. This interpretation can be supported by the widely reported c. 1850 Ma ages within the SGT (Collins et al. Reference Collins, Santosh, Braun and Clark2007 b; Sato et al. Reference Sato, Santosh, Tsunogae, Chetty and Hirata2011; Teale et al. Reference Teale, Collins, Foden, Payne, Plavsa, Chetty, Santosh and Fanning2011; Clark et al. Reference Clark, Healy, Johnson, Collins, Taylor, Santosh and Timms2015) and the emplacement of granitic magmatism and charnockite during c. 1900–1800 Ma (Ghosh et al. Reference Ghosh, de Wit and Zartman2004; Kröner et al. Reference Kröner, Santosh and Wong2012).
Apart from the near-concordant ages obtained in this study, five spot-ages were found to be discordant. There are several factors responsible for generating discordant spot-ages. Most discordant spot-ages are younger than the initial zircon crystallization event because Pb is lost from the crystal in response to subsequent geological events or via diffusion over longer timescales during high-temperature metamorphic events. In addition to these factors, Pb is easily lost from zircon in which the lattice has been affected by radiation damage via metamictization, crystal-plastic deformation, and low-temperature hydrothermal or fluid-assisted dissolution–reprecipitation reactions (reviewed in Peterman et al. Reference Peterman, Reddy, Saxey, Snoeyenbos, Rickard, Fougerouse and Kylander-Clark2016). From the existing geochronological data, it is difficult to comment on the duration of the high-temperature metamorphism. Moreover, evidence in favour of metamictization (metamict zircon), crystal-plastic deformation (not evaluated here) and hydrothermal dissolution–reprecipitation reactions (porous and inclusion-rich zircon) is not found in this study. Thus, in our case, the possibility of Pb loss during subsequent post-peak tectonothermal event(s) seems to be most plausible as the studied samples definitely experienced post-peak metamorphism (retrogression) after c. 2460–2440 Ma.
9.d. The change in the geothermal gradient in the subduction zones since the Neoarchaean–Palaeoproterozoic boundary
Because the apparent average geothermal gradient of the early Earth appears to have been hotter than that at the present, the apparent average geothermal gradient in subduction zones in the early Earth may have been different from that in modern subduction zones (e.g. Cawood et al. Reference Cawood, Kröner and Pisarevsky2006; van Hunen & Moyen, Reference van Hunen and Moyen2012, and references therein). Consequently, the style of metamorphism in the modern and early Earth’s subduction zones is also different. Our study area gives us a unique opportunity to study the style of metamorphism in a suprasubduction zone arc setting which developed during the Archaean–Proterozoic boundary.
In this contribution, it is concluded that the metabasite in the study area underwent high-pressure granulite-facies metamorphism (900–800 °C and 14–11 kbar) during the early Palaeoproterozoic (c. 2460–2440 Ma). The early Palaeoproterozoic high-pressure granulite-facies metamorphism (900–800 °C; 15–12 kbar) was also reported from a metamorphosed gabbro and anorthosite located in and around the study area (Chowdhury et al. Reference Chowdhury, Talukdar, Sengupta, Sanyal and Mukhopadhyay2013; Ram Mohan et al. Reference Ram Mohan, Satyanarayanan, Santosh, Sylvester, Tubrett and Lam2013; Karmakar et al. Reference Karmakar, Mukherjee, Sanyal and Sengupta2017). The metabasites in the study area were interpreted to have originated in a subduction tectonic setting in this study, and Ram Mohan et al. (Reference Ram Mohan, Satyanarayanan, Santosh, Sylvester, Tubrett and Lam2013) also suggested a suprasubduction zone tectonic setting for the study area. In this study, we calculated the apparent average geothermal gradient in the subduction zone by assuming that 1 kb of pressure corresponds to 3.7 km of depth. The apparent average geothermal gradient obtained for the study area was ∼20–16 °C km−1 (∼73–60 °C kbar−1; Fig. 11).

Fig. 11. The peak metamorphic P–T conditions of the subduction-related high-grade metamorphism from different localities across the world during the Archaean–Proterozoic boundary. The thick black lines bracket the range of the apparent average geothermal gradient (29–14 °C km−1) during the Archaean–Proterozoic boundary, which demonstrates the absence of eclogite- and blueschist-facies metamorphism.
The subduction–collisional-related high-grade metamorphism (750–900 °C and 9–16 kbar) at the Archaean–Proterozoic boundary has been reported from different areas within the PCSS of the SGT. For example, Saitoh et al. (Reference Saitoh, Tsunogae, Santosh, Chetty and Horie2011) and Anderson et al. (Reference Anderson, Payne, Kelsey, Hand, Collins and Santosh2012) reported high-pressure granulite-facies metamorphism in and around Kanja Malai Hill, and the apparent average geothermal gradient calculated from their P–T estimations was 16–14 °C km−1 and 18–17 °C km−1, respectively. From the metamorphic P–T conditions in the Nilgiri Hills and Namakkal area (Raith et al. Reference Raith, Srikantappa, Buhl and Koehler1999; Noack et al. Reference Noack, Kleinschrodt, Kirchenbaur, Fonseca and Munker2013; Brandt et al. Reference Brandt, Raith, Schenk, Sengupta, Srikantappa and Gerdes2014; Samuel et al. Reference Samuel, Sajeev, Hokada, Horie and Itaya2015), 16 °C km−1 and 16–15 °C km−1 are obtained as the apparent average geothermal gradients in the two areas. In the adjacent Mahadevi Layered Complex, the apparent average geothermal gradient calculated from the P–T estimations of Chowdhury & Chakraborty (Reference Chowdhury and Chakraborty2019) and Talukdar et al. (Reference Talukdar, Mukhopadhyay, Sanyal and Sengupta2019) was 15–18 °C km−1. These apparent average geothermal gradients are similar to those obtained in this study, suggesting that there was subduction along the PCSS during the Archaean–Proterozoic transition with an apparent geothermal gradient of ∼23–15 °C km−1 (Fig. 11). As well as the SGT, Neoarchaean high-grade metamorphism (800–840 °C and 7.5–8 kbar) from India is also reported from the Karimnagar Granulite Belt (Prakash et al. Reference Prakash, Singh, Tewari, Joshi, Frimmel, Hokada and Rakotonandrasana2017), which corresponds to the 29–28 °C km−1 apparent average geothermal gradient (Fig. 11). On the other hand, Neoarchaean granulite-facies metamorphism (800 °C and 8 kbar; reviewed in Peucat et al. Reference Peucat, Jayananda, Chardon, Capdevila, Fanning and Paquette2013) is also documented from the southern margin of the Dharwar Craton which corresponds to the apparent average geothermal gradient of 27 °C km−1 (Fig. 11).
Subduction-related Neoarchaean granulites have also been reported from other parts of the world. From the North China Craton, a similar Neoarchaean high-pressure granulite (c. 2500 Ma; 10–13 kbar and 780–850 °C) was reported to have formed by a subduction–collision event in the Jianping Complex (Wang & Cui, Reference Wang, Cui, Qian and Wang1994; Wei et al. Reference Wei, Zhang, Zhang, Wu and Li2001; O’Brien & Rotzler, Reference O’Brien and Rötzler2003; Liu et al. Reference Liu, Santosh, Wang, Bai and Yang2011; Lu et al. Reference Lu, Zhai, Lu, Wang, Chen, Peng, Wu and Zhao2017). The apparent geothermal gradient obtained from the Jianping Complex is 23–16 °C km−1 (85–60 °C kbar−1; Fig. 11). In the Snowbird Tectonic Zone and East Athabasca terrane in western Canada, Neoarchaean high-pressure metamorphic conditions (850–900 °C, 13 kbar) were also estimated by Mahan et al. (Reference Mahan, Goncalves, Flowers, Williams and Hoffman-Setka2008), and these metamorphic conditions represent an apparent average geothermal gradient of 19–18 °C km−1 (69–65 °C kbar−1; Fig. 11). The high-pressure metamorphism in the Athabasca terrane was interpreted to have been caused by collision, and the high-pressure granulite metamorphism was followed by rapid uplift (Mahan et al. Reference Mahan, Goncalves, Flowers, Williams and Hoffman-Setka2008).
The existence of subduction during the Archaean–Proterozoic transition is supported not only by granulite-facies metamorphism but also by the presence of arc-related Neoarchaean granitoids and paired metamorphic belt (Brown, Reference Brown2010). In the Siziwangqi area of central Inner Mongolia, an arc-related granitoid intruded at c. 2520–2440 Ma (Chen et al. Reference Chen, Zhao, Jahn, Sun and Zhou2017 a, b), and in the southern part of eastern Hebei Province and western Liaoning Province, North China Craton, medium-grained monzogranitic–syenogranitic gneisses were emplaced during c. 2527–2511 Ma in a back-arc basin tectonic setting (Fu et al. Reference Fu, Liu, Cawood, Wang, Hu, Sun, Gao and Hu2017). In southern Jilin Province, a Neoarchaean subduction-related Andean-type active continental margin existed along the northern margin of the North China Craton and was associated with two major phases of subduction-related igneous activity at c. 2700 Ma and c. 2600–2500 Ma (Guo et al. Reference Guo, Liu, Santosh and Wang2017). On the other hand, the western Dengfeng Complex of the North China Craton underwent high T/P metamorphism, whereas the eastern part of the Dengfeng Complex experienced medium T/P metamorphism. Together with the structural and geochemical data, these metamorphisms indicate an occurrence of the paired metamorphic belt during c. 2520–2500 Ma (Huang et al. Reference Huang, Kusky, Johnson, Wilde, Wang, Polat and Fu2020). The above data indicate that high-pressure granulite-facies metamorphism and magmatism in a subduction-related arc setting have occurred since at least the Neoarchaean, reflecting an apparent average geothermal gradient in subduction zones during the Archaean–Proterozoic boundary of ∼29–14 °C km−1 (Fig. 11).
As the apparent average geothermal gradient was in the range ∼29–14 °C km−1 in the subduction zone during the Archaean–Proterozoic boundary, the influence of temperature was greater than that of pressure during peak metamorphism which favoured the formation of high-pressure granulite-facies metamorphism over eclogite and blueschist-facies metamorphism in the subduction zone during the Archaean–Proterozoic boundary. The apparent average geothermal gradient gradually decreased after the Palaeoproterozoic. Consequently, the global metamorphic style changed, and pressure-dominated eclogite-facies metamorphism developed (Brown, Reference Brown2007; Brown & Johnson, Reference Brown and Johnson2019). During the Neoproterozoic–Phanerozoic, the apparent average geothermal gradient dropped further, HP–UHP eclogite- and blueschist-facies metamorphism emerged for the first time, and pressure-dominated metamorphism localities outnumbered temperature-dominated metamorphism localities globally (Brown, Reference Brown2007; Brown et al. Reference Brown, Kirkland and Johnson2020 b). Thus, the global metamorphic style in the subduction zone has changed gradually over time due to the counterclockwise steepening (lowering) of the apparent average geothermal gradient from the Neoarchaean to Neoproterozoic–Phanerozoic time.
10. Conclusions
The issues resolved in this study are summarized below:
-
1. The geochemical and geochronological analyses of this study combined with existing data of Ram Mohan et al. (Reference Ram Mohan, Satyanarayanan, Santosh, Sylvester, Tubrett and Lam2013) and He et al. (Reference He, Wang, George, Sajeev, Guo, Lai and Zhai2021) suggest that the metabasites in the SLC intruded in a suprasubduction arc setting during the late Neoarchaean (c. 2540–2520 Ma).
-
2. After the intrusion, the metabasites experienced high-pressure granulite-facies peak metamorphism (900–800 °C and 14–11 kbar) which was followed by amphibolite-facies metamorphism (550–480 °C and 5.5–4.5 kbar). The difference in metamorphic mineral assemblages among metabasites in the SLC is due to the different whole-rock compositions.
-
3. Our limited amount of geochronological data is in accordance with the ages established from the rocks of SLC (Ram Mohan et al. Reference Ram Mohan, Satyanarayanan, Santosh, Sylvester, Tubrett and Lam2013; Behera et al. Reference Behera, Waele, Thirukumaran, Sundaralingam, Narayanan, Sivalingam and Biswal2019), which possibly suggest that the high-pressure granulite-facies metamorphism occurred in the early Palaeoproterozoic (c. 2460–2440 Ma) during arc accretion, and the amphibolite-facies metamorphism occurred in the middle Palaeoproterozoic (c. 1900–1850 Ma).
-
4. The results obtained in this study, together with previous studies, indicate that the ‘Wilson cycle type’ plate tectonics had started from the Neoarchaean. As a result, the high-pressure granulite-facies rocks mostly formed in the subduction zone instead of eclogite- and blueschist-facies rocks due to the control of the apparent average geothermal gradient (∼29–14 °C km−1) during the Archaean–Proterozoic boundary.
Supplementary material
To view supplementary material for this article, please visit https://doi.org/10.1017/S0016756822000164
Acknowledgements
We thank Mrs Hyeon Ih. Ryu for helping during EPMA analysis. We also appreciate the help received from Mr Sayam Konar during the fieldwork. This paper was supported by the National Research Foundation of Korea (NRF-2017R1A2B2011224, NRF-2017K1A1A201380). A.C., being a Malaviya Postdoctoral Fellow, acknowledges the support of the Institute of Eminence program of the Ministry of Education, India (IoE/MPDF/2020-21/15). The analytical part of this work was partly supported by a Grant-in-Aid for Scientific Research by the Ministry of Education, Culture, Sports, Science and Technology (MEXT) (No. 15H03750 to K.D. as Co-PI). Efficient editorial handing by Dr Sarah Sherlock is acknowledged. Constructive comments by two anonymous reviewers improved the quality of the manuscript.


