


1. Introduction
The Altaids, located between the Siberian, North China, Tarim and East European cratons, represent one of the most important sites of juvenile crustal growth in the world (Şengör, Natal'in & Burtman, Reference Şengör, Natal'in and Burtman1993; Şengör & Natal'in, Reference Şengör and Natal'in1996) (Fig. 1). After decades of study, it is widely accepted that the Altaids formed by successive accretions of island arcs, accretionary prisms, minor ophiolitic fragments and small continental blocks (Coleman, Reference Coleman1989; Şengör, Natal'in & Burtman, Reference Şengör, Natal'in and Burtman1993; Dobretsov, Berzin & Buslov, Reference Dobretsov, Berzin and Buslov1995; Şengör & Natal'in, Reference Şengör and Natal'in1996; Gao et al. Reference Gao, Li, Xiao, Tang and He1998; Buchan et al. Reference Buchan, Pfänder, Kröner, Brewer, Tomurtogoo, Tomurhuu, Cunningham and Windley2002; Bazhenov et al. Reference Bazhenov, Collins, Degtyarev, Lavashova, Mikolaichuk, Pavlov and Van der Voo2003; Xiao et al. Reference Xiao, Windley, Hao and Zhai2003, Reference Xiao, Windley, Badarch, Sun, Li, Qin and Wang2004a, Reference Xiao, Zhang, Qin, Sun and Lib, Reference Xiao, Han, Yuan, Sun, Lin, Chen, Li, Li and Sun2008; Windley et al. Reference Windley, Alexeiev, Xiao, Kröner and Badarch2007). The closure of the Palaeo-Asian ocean terminated the accretionary history of the Altaids. However, the timing of the final suture has been hotly debated (Coleman, Reference Coleman1989; Zuo et al. Reference Zuo, Zhang, Wang, Jin, He, Zhang, Li and Bai1990, Reference Zuo, Zhang, He and Zhang1991; Shi et al. Reference Shi, Lu, Jia, Cai, Wu and Chen1994; Han et al. Reference Han, Wang, Jahn, Hong, Kagami and Sun1997; Ma, Shu & Sun, Reference Ma, Shu and Sun1997; Gao et al. Reference Gao, Li, Xiao, Tang and He1998; Xiao et al. Reference Xiao, Zhang, Qin, Sun and Li2004b, Reference Xiao, Han, Yuan, Sun, Lin, Chen, Li, Li and Sun2008; Zhou et al. Reference Zhou, Lesher, Yang, Li and Sun2004; Mao et al. Reference Mao, Xiao, Han, Sun, Yuan, Yan, Li, Yong and Zhang2006, Reference Mao, Xiao, Han, Yuan and Sun2008; Windley et al. Reference Windley, Alexeiev, Xiao, Kröner and Badarch2007; Zhang et al. Reference Zhang, Ai, Li, Rubatto, Song, Williams, Song, Ellis and Liou2007).
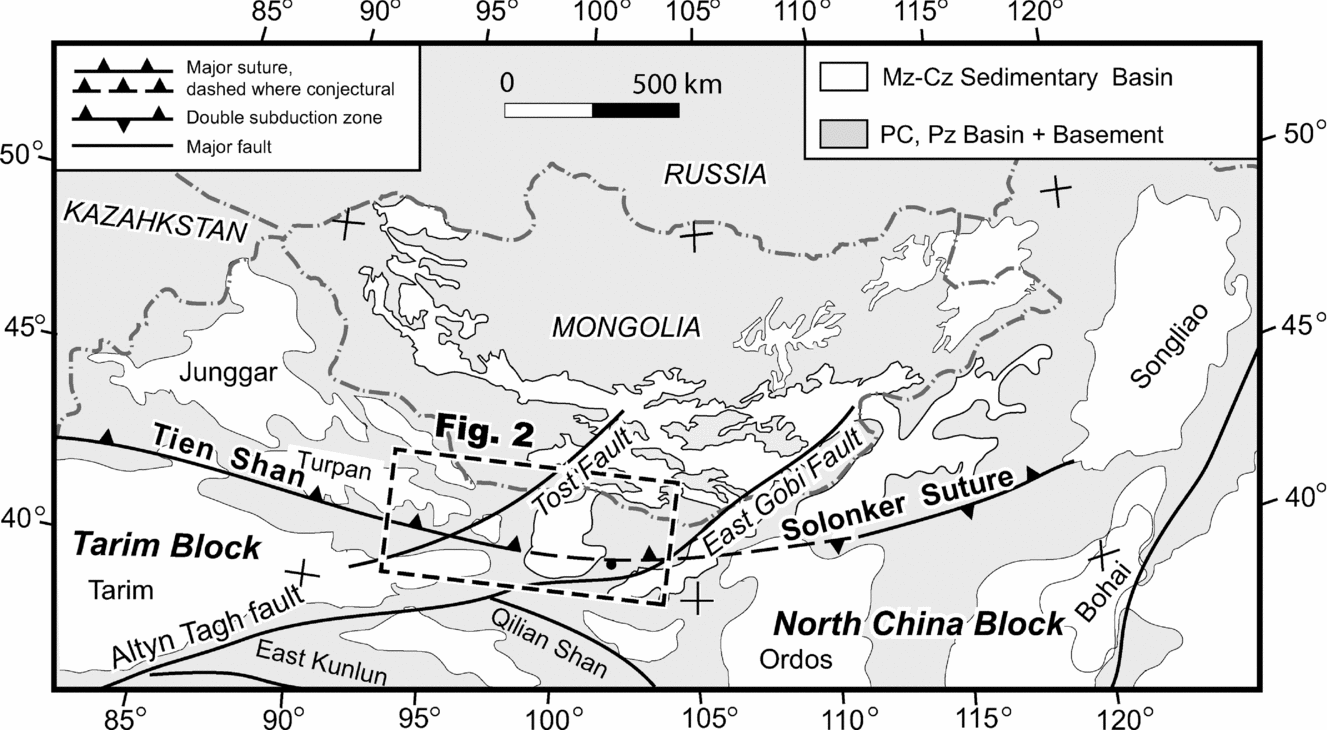
Figure 1. Simplified tectonic map of the southern and eastern Altaids showing the tectonic position of the Beishan orogen (based on our observations and modified after Liu & Wang (Reference Liu and Wang1995), Hendrix et al. (Reference Hendrix, Graham, Amory and Badarch1996), Hendrix (Reference Hendrix2000), Lamb & Badarch (Reference Lamb, Badarch, Ernst and Coleman2000) and Lamb et al. (Reference Lamb, Badarch, Navratil and Poier2008). PC – Precambrian; Pz – Palaeozoic; Mz – Mesozoic; Cz – Cenozoic. Location of Figure 2 is marked.
The Beishan mountain range in NW China, located on the southern margin of the Altaids, is a key area for unravelling the evolution and accretionary processes of the southern Altaids, and the closure time of the Palaeo-Asian ocean (Fig. 1). In particular, a Permian magmatic belt, the Liuyuan complex (LC), contains important information about the final stages of tectonic evolution of the ocean (Zuo et al. Reference Zuo, Zhang, Wang, Jin, He, Zhang, Li and Bai1990; Zhao et al. Reference Zhao, Guo, Han, Wang and Liu2006; Jiang et al. Reference Jiang, Xia, Yu, Dai, Wei and Ye2007). Previous studies proposed diverse models to explain the geological evolution of the Beishan and adjacent areas based on different interpretations of the LC (Zuo et al. Reference Zuo, Zhang, Wang, Jin, He, Zhang, Li and Bai1990, Reference Zuo, Zhang, He and Zhang1991; Liu & Wang, Reference Liu and Wang1995; Ma, Shu & Sun, Reference Ma, Shu and Sun1997; Nie et al. Reference Nie, Jiang, Bai, Wang, Su, Li, Liu and Zhao2002a; Xiao et al. Reference Xiao, Zhang, Qin, Sun and Li2004b), but no consensus emerged. For example, a Permian continental rift was favoured by those who considered that the final closure of the Palaeo-Asian ocean was before the Carboniferous (GSBGMR, 1989; Zuo et al. Reference Zuo, Zhang, Wang, Jin, He, Zhang, Li and Bai1990; XBGMR, 1993; Liu & Wang, Reference Liu and Wang1995; Ma, Shu & Sun, Reference Ma, Shu and Sun1997; Zuo, Liu & Liu, Reference Zuo, Liu and Liu2003; Zhao et al. Reference Zhao, Guo, Han, Wang and Liu2006; Jiang et al. Reference Jiang, Xia, Yu, Dai, Wei and Ye2007). In contrast, others argued that the Palaeo-Asian ocean did not close until late Permian time or later (Shi et al. Reference Shi, Lu, Jia, Cai, Wu and Chen1994; Zhu, Reference Zhu1997; Xiao et al. Reference Xiao, Windley, Hao and Zhai2003, Reference Xiao, Zhang, Qin, Sun and Li2004b, Reference Xiao, Han, Yuan, Sun, Lin, Chen, Li, Li and Sun2008; Windley et al. Reference Windley, Alexeiev, Xiao, Kröner and Badarch2007).
In this paper, we use detailed mapping, structural data, major–trace element and isotope geochemistry, and isotopic ages to place tight constraints on the petrogenesis and tectonic setting of the LC, and accordingly to establish the terminal processes on the southernmost margin of the Altaids.
2. Geological setting
The Beishan mountain range is composed of several arc belts that are separated by six ophiolite-bearing melange zones, which are marked today as major faults, shown in Figures 1 and 2a (Zuo et al. Reference Zuo, Zhang, Wang, Jin, He, Zhang, Li and Bai1990, Reference Zuo, Zhang, He and Zhang1991; Liu & Wang Reference Liu and Wang1995; Nie et al. Reference Nie, Jiang, Bai, Wang, Su, Li, Liu and Zhao2002a). Xiao et al. (Reference Xiao, Mao, Windley, Han, Qu, Zhang, Ao, Guo, Cleven, Lin, Shan and Li2010b) made detailed descriptions of the regional geology; here we introduce just the geology associated with the LC.
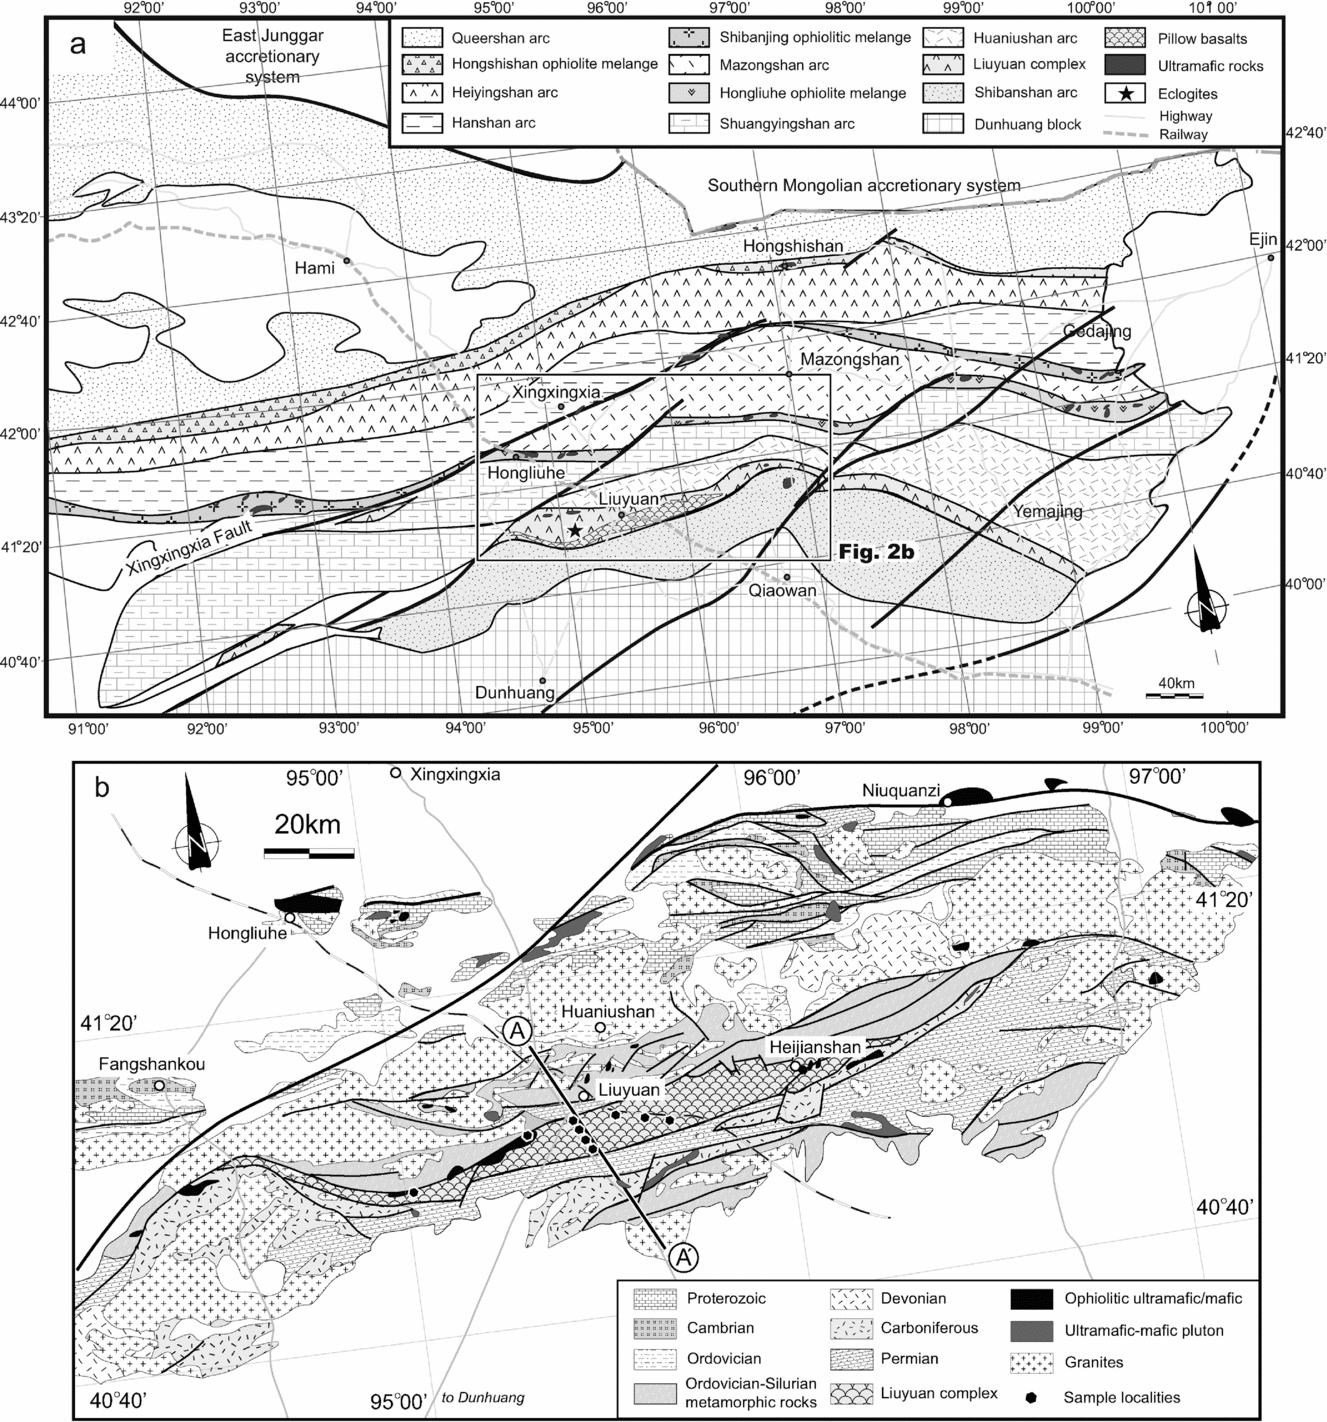
Figure 2. (a) Tectonic map of the southern part of the Beishan orogen, showing the position of the Liuyuan complex in relation to the three main arcs (based on our observations and modified after Liu & Wang, Reference Liu and Wang1995; Nie et al. Reference Nie, Jiang, Bai, Wang, Su, Li, Liu and Zhao2002a). (b) A geological map of the Liuyuan and adjacent areas showing the relationships between the main stratigraphic units of the Beishan (modified after GSBGMR, 1989; Zuo et al. Reference Zuo, Zhang, Wang, Jin, He, Zhang, Li and Bai1990; Nie et al. Reference Nie, Jiang, Bai, Wang, Su, Li, Liu and Zhao2002a). Black dots mark sample locations.
In the study area, four tectonic units are recognized: the Shuangyingshan arc, the Huaniushan arc, the Liuyuan complex and the Shibanshan arc (Fig. 2a, b). The Shuangyingshan arc consists of Precambrian to Ordovician shelf carbonates and clastic sediments including limestones, flysch, black cherts and highly metamorphosed clastic sediments that are now mainly migmatitic paragneisses, schists and marbles. Cambrian sediments are characterized by black shales and interbedded carbonates.
The Huaniushan arc, developed on the Shuangyingshan arc, comprises Ordovician–Permian calc-alkaline basalts, andesites, rhyolites, tuffs and volcaniclastic rocks with interlayered clastic sediments and carbonates (Zuo et al. Reference Zuo, Zhang, Wang, Jin, He, Zhang, Li and Bai1990; Liu & Wang Reference Liu and Wang1995; Nie et al. Reference Nie, Jiang, Bai, Wang, Su, Li, Liu and Zhao2002a). Along the southern margin of the arc there are discontinuous belts of gneisses, migmatites, schists and marbles that have greenschist to eclogite-facies mineral assemblages (Mei et al. Reference Mei, Yu, Li, Lu, Li, Zuo, Zuo, Ye and Liu1998, Reference Mei, Li, Lu, Yu, Zuo and Li1999; Yang et al. Reference Yang, Wu, Chen, Shi, Zhang, Meng, Zuo, Wu and Constantinovskaya2006). Eclogites at Gubaoquan (Fig. 2a) were designated an early Ordovician–Silurian age mainly by regional correlations; this was confirmed by a zircon age of 465 ± 10 Ma (GSBGMR 1989; Yu et al. Reference Yu, Lu, Mei, Zhao, Li and Li1999; Yang et al. Reference Yang, Wu, Chen, Shi, Zhang, Meng, Zuo, Wu and Constantinovskaya2006; Liu et al. Reference Liu, Chen, Jahn, Wu and Liu2011; Qu et al. Reference Qu, Xiao, Windley, Han, Mao, Ao and Zhang2011). The ages of granitoids in the Shuangyingshan–Huaniushan multiple arc range from Silurian to early Triassic (GSBGMR, 1989; Tian, Reference Tian1993; Nie et al. Reference Nie, Jiang, Bai, Wang, Su, Li, Liu and Zhao2002a, Reference Nie, Jiang, Liu, Chen, Liu and Zhangb; Zhao, Guo & Wang, Reference Zhao, Guo and Wang2007). For example, Zhao, Guo & Wang (Reference Zhao, Guo and Wang2007) reported sensitive high-resolution ion microprobe (SHRIMP) zircon U–Pb ages of 423 ± 8 Ma, 397 ± 7 Ma and 436 ± 9 Ma for granodiorites, monzogranites and potassium granites, respectively. An adakite has a zircon U–Pb age of 424 ± 4 Ma (Mao et al. Reference Mao, Xiao, Han, Sun, Yuan, Zhang, Ao and Li2010), the Shijingpo granite has a zircon U–Pb age of 380 ± 12 Ma (Tian, Reference Tian1993) and the Huaniushan and Huitongshan alkaline granites have 40Ar–39Ar ages on potassium feldspar of 192 ± 2 Ma and 194 ± 1 Ma, respectively (Nie et al. Reference Nie, Jiang, Liu, Chen, Liu and Zhang2002b; Jiang et al. Reference Jiang, Nie, Chen, Liu, Bai, Liu and Zhang2003).
The late Palaeozoic Shibanshan arc, located on the northern margin of the Dunhuang block (Fig. 2a, b), contains a low-grade and a high-grade metamorphic unit. The low-grade unit, on the northern margin of the arc, contains low greenschist-facies Devonian–Permian calc-alkaline volcanic rocks, volcaniclastic rocks, tuffs, carbonates and clastic rocks. The high-grade unit is mainly composed of gneisses, migmatites, schists, mylonitic schists and marbles. Previously published ages for these metamorphic rocks were mainly designated by comparison with similar rocks nearby; several contrasting ages such as Proterozoic, Ordovician–Silurian or Permian were suggested (GSBGMR, 1989; Liu & Wang Reference Liu and Wang1995; Yu et al. Reference Yu, Lu, Mei, Zhao, Li and Li1999; Yang et al. Reference Yang, Wu, Chen, Shi, Zhang, Meng, Zuo, Wu and Constantinovskaya2006). The metamorphic rocks have a whole-rock Rb–Sr age of 548 Ma (Zuo et al. Reference Zuo, Zhang, Wang, Jin, He, Zhang, Li and Bai1990). Both units contain abundant Carboniferous–early Triassic granitic intrusions (Zuo et al. Reference Zuo, Zhang, Wang, Jin, He, Zhang, Li and Bai1990; Nie et al. Reference Nie, Jiang, Bai, Wang, Su, Li, Liu and Zhao2002a).
The Liuyuan complex, located between the Huaniushan arc and the Shibanshan arc (Fig. 2a, b), contains greenschist-grade ophiolitic rocks (cherts, basalts, gabbros, ultramafic rocks) and intrusive batholiths and small plutons of diorite, granodiorite, biotite granite and alkali-granite (Zuo et al. Reference Zuo, Zhang, Wang, Jin, He, Zhang, Li and Bai1990; Liu & Wang, Reference Liu and Wang1995; Nie et al. Reference Nie, Jiang, Liu, Chen, Liu and Zhang2002a; Zhao, Guo & Wang, Reference Zhao, Guo and Wang2007).
3. Field relations and petrology of the Liuyuan ophiolitic complex
3.a. Field relations
The ENE–WSW-trending Liuyuan complex, located between the Huaniushan arc and the Shibanshan arc, is up to 20 km wide (Fig. 2b), and contains many imbricated thrust sheets. Samples for this study were mainly collected along two profiles illustrated in Figure 2b, plus some from the Heijianshan area (Fig. 2b). The complex comprises ultramafic rocks, gabbros, massive basalts, abundant pillow basalts, hyaloclastic pillow breccias, volcaniclastic breccias, basaltic tuffs and thin-bedded cherts. In several parts of the stratigraphy, volcaniclastic breccias up to 16 m thick consist of rhyolitic fragments in an andesitic matrix. The ultramafic rocks and some gabbros are located along faults on the northern margin of the complex (Fig. 2b). A characteristic of the complex is the abundance of hydrothermal veins that are predominantly filled by epidote with minor quartz, haematite and Fe carbonate.
Along the National Highway (Fig. 2b) all lithologies (except for ultramafic rocks) of the complex are well preserved and displayed. The best-preserved, structurally-intact sections show that the original stratigraphic succession was from bottom to top: olivine gabbro/massive gabbro (Fig. 4f), massive basalt, pillow basalt, basaltic volcaniclastic tuff and breccia, deep-sea chert with beds of tuff (Fig. 4a–c, e), and late hornblende gabbro (Fig. 4d). Thrusts have affected the whole complex, and have preferentially developed along beds of tuff and chert; as a result the whole complex is an imbricated thrust stack up to 20 km wide, with thrust directions towards the NNW (Fig. 3). In the main volcanic pile, fine-grained gabbroic dykes and late hornblende gabbro dykes (Fig. 4d) have intruded the basaltic rocks. Many olivine gabbros (Fig. 4f) crop out along the northern margin of the complex.
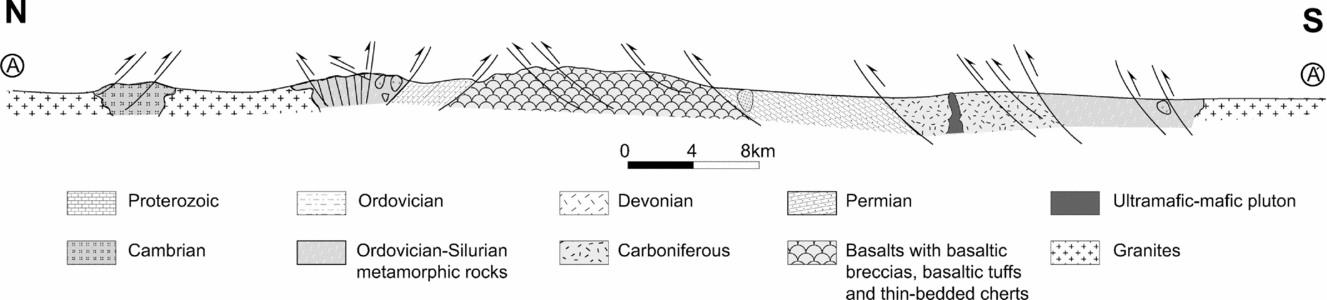

Figure 4. (Colour online) Field photos of the Liuyuan complex, Beishan. (a) Massive and pillow basalts imbricated by out-of-sequence thrusts with beds of chert and brecciated basalt, Liuyuan; (b) sheared pillow basalts, Heijianshan; (c) basaltic breccia, Liuyuan; (d) a gabbro dyke intruded into basalt. This is the locality where DQ-43 was sampled for geochronology, Liuyuan; (e) thin-bedded cherts between pillow basalts; (f) olivine gabbro on the northern margin of the Liuyuan complex; (g) ultramafic rocks in the Heijianshan area.
In the more intensively deformed Heijianshan (Fig. 2b) area, greenschist-facies metamorphosed gabbros and mafic volcanic rocks with elongate pillows (Fig. 4b) have been thrust to the SE. Several lenses of serpentinized ultramafic rocks occur along the faults (Fig. 4g).
3.b. Petrology of the Liuyuan complex
The ultramafic rocks include peridotites with variable degrees of serpentinization. Olivine is only preserved as inclusions in clinopyroxene, but some fine-grained spinels have survived the serpentinization. The ultramafic rocks are an important component of the LC, but we will focus on the mafic rocks in the later sections on geochemistry and geochronology, because ultramafic rocks are difficult to date and cannot be treated as magmas.
There are three types of slightly altered gabbro. The first, exposed in the northern margin of the LC, is olivine gabbro that consists of olivine, orthopyroxene, clinopyroxene, plagioclase and minor opaques. Subhedral–anhedral orthopyroxenes and clinopyroxenes are situated between euhedral plagioclases. Plagioclase contains a few inclusions of clinopyroxene. The second type is massive gabbro, exposed at the base of the basalts, made up of euhedral plagioclase, euhedral–subhedral clinopyroxene, magnetite, ilmenite, a little olivine and minor accessories; ilmenite content locally reaches 2–3%. Plagioclase is replaced by clay minerals and sericite in many samples. The third type is hornblende gabbro that forms dykes (DQ43) (which traverse all rocks of the complex) composed of clinopyroxene, plagioclase, hornblende and minor opaques. The margins of clinopyroxenes are partly replaced by hornblende, and plagioclase is partly replaced by clay minerals and sericite.
Most basalts are slightly altered, except for those in the Heijianshan area. Most basalts are cut by a few carbonate veins, and a few contain amygdales. Basaltic rocks are composed of plagioclase, magnetite, ilmenite, minor olivine and volcanic glass, and some samples have a little clinopyroxene. A few samples are enriched in ilmenite up to 2–3%. Jiang et al. (Reference Jiang, Xia, Yu, Dai, Wei and Ye2007) reported that basalts mainly consist of albite (Ab100–91) and clinopyroxene (En45–46). To avoid any possible effects of alteration, we chose the freshest rocks for our geochemical study.
4. Geochemistry
Representative major and trace element analyses are listed in Table 1. Details of analytical methodology are given in Appendix 1. The different types of mafic rocks (gabbros and basalts) have similar major element compositions, except for TiO2 (Table 1; Figs 5, 6). The mafic rocks are characterized by a range of SiO2 (46.0–52.1 wt%), TiO2 (1.2–3.6 wt%), Al2O3 (11.6–16.1 wt%), MgO (4.1–7.9 wt%), TFe2O3 (8.5–14.9 wt%), CaO (6.1–11.4 wt%), MnO (0.14–0.27 wt%) and K2O + Na2O (2.9–6.2 wt%). In the Zr/Ti v. Nb/Y diagram (Winchester & Floyd, Reference Winchester and Floyd1977), all the samples plot within the basalt fields (Fig. 5). As demonstrated by the binary diagrams (Figs 6, 7), the rocks have positive correlations between Mg no. (100 × MgO/(MgO + FeOT) and Al2O3, CaO, Cr and Ni contents, and a negative correlation between Mg no. and TFe2O3, TiO2, P2O5, Y and Zr contents. The mobile elements (K2O, Rb, Ba, U and Sr) show a large range of irregular variations.
Table 1. The major (wt%) and trace element (ppm) analyses of the Liuyuan complex, NW China

Eu* = 2 × EuN/(SmN + GdN); Mg no. = 100 × MgO/(MgO + FeOT); FeOT = 0.9 × TFe2O3.
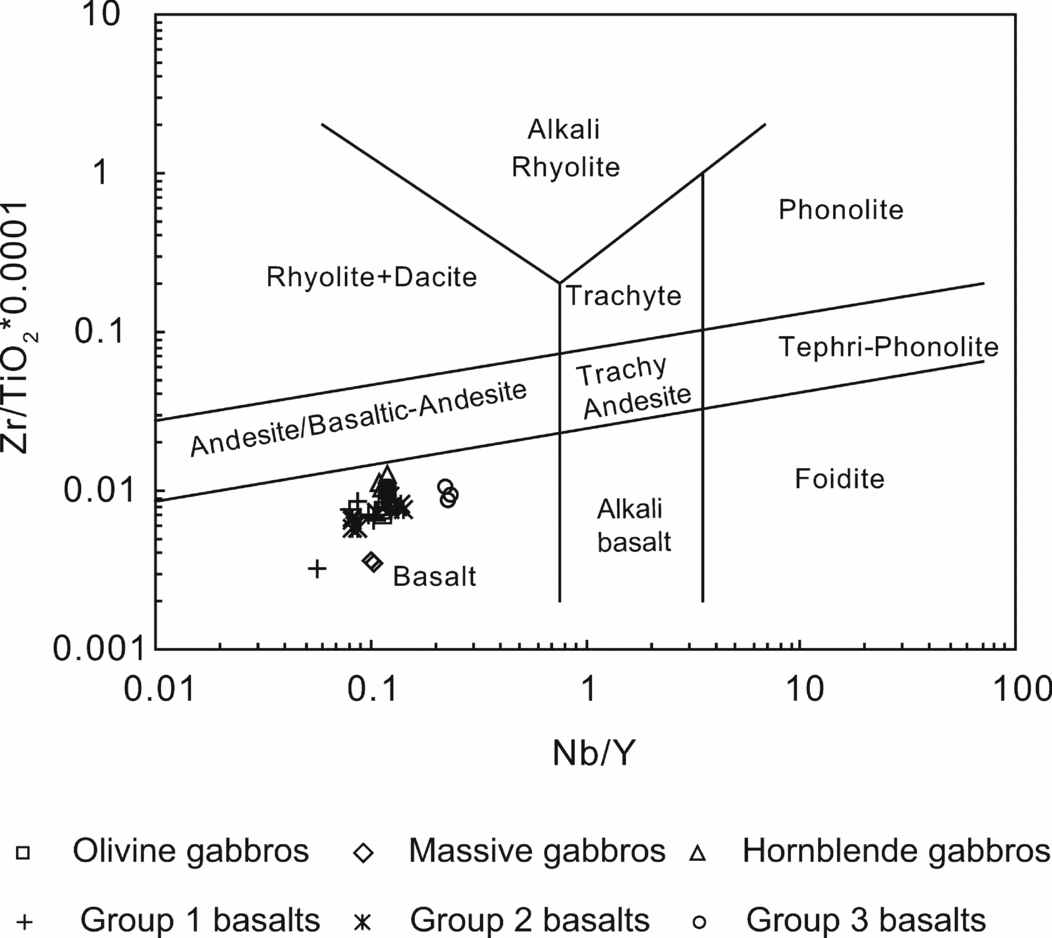
Figure 5. Zr/Ti v. Nb/Y diagram of Winchester & Floyd (Reference Winchester and Floyd1977).
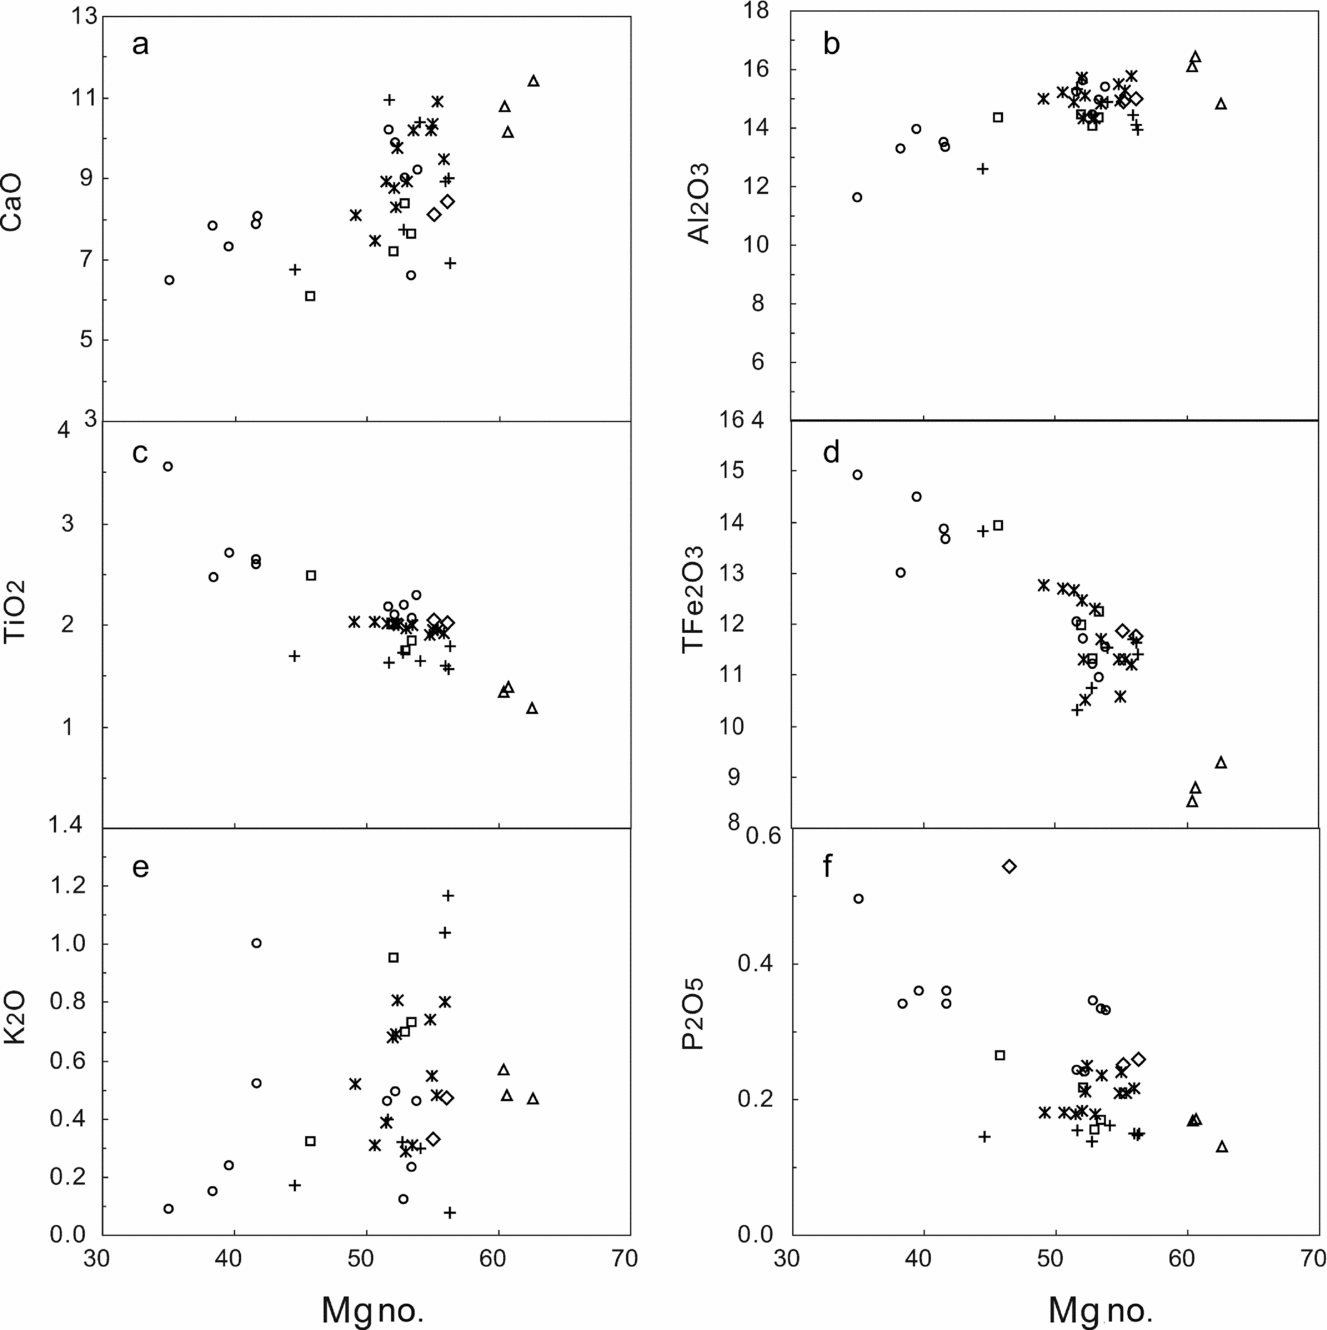
Figure 6. Mg no.–major binary diagrams versus Al2O3, TFe2O3, CaO, MnO, P2O5, TiO2 for rocks from the Liuyuan complex. Values are in wt% for oxides. Symbols as in Figure 5.
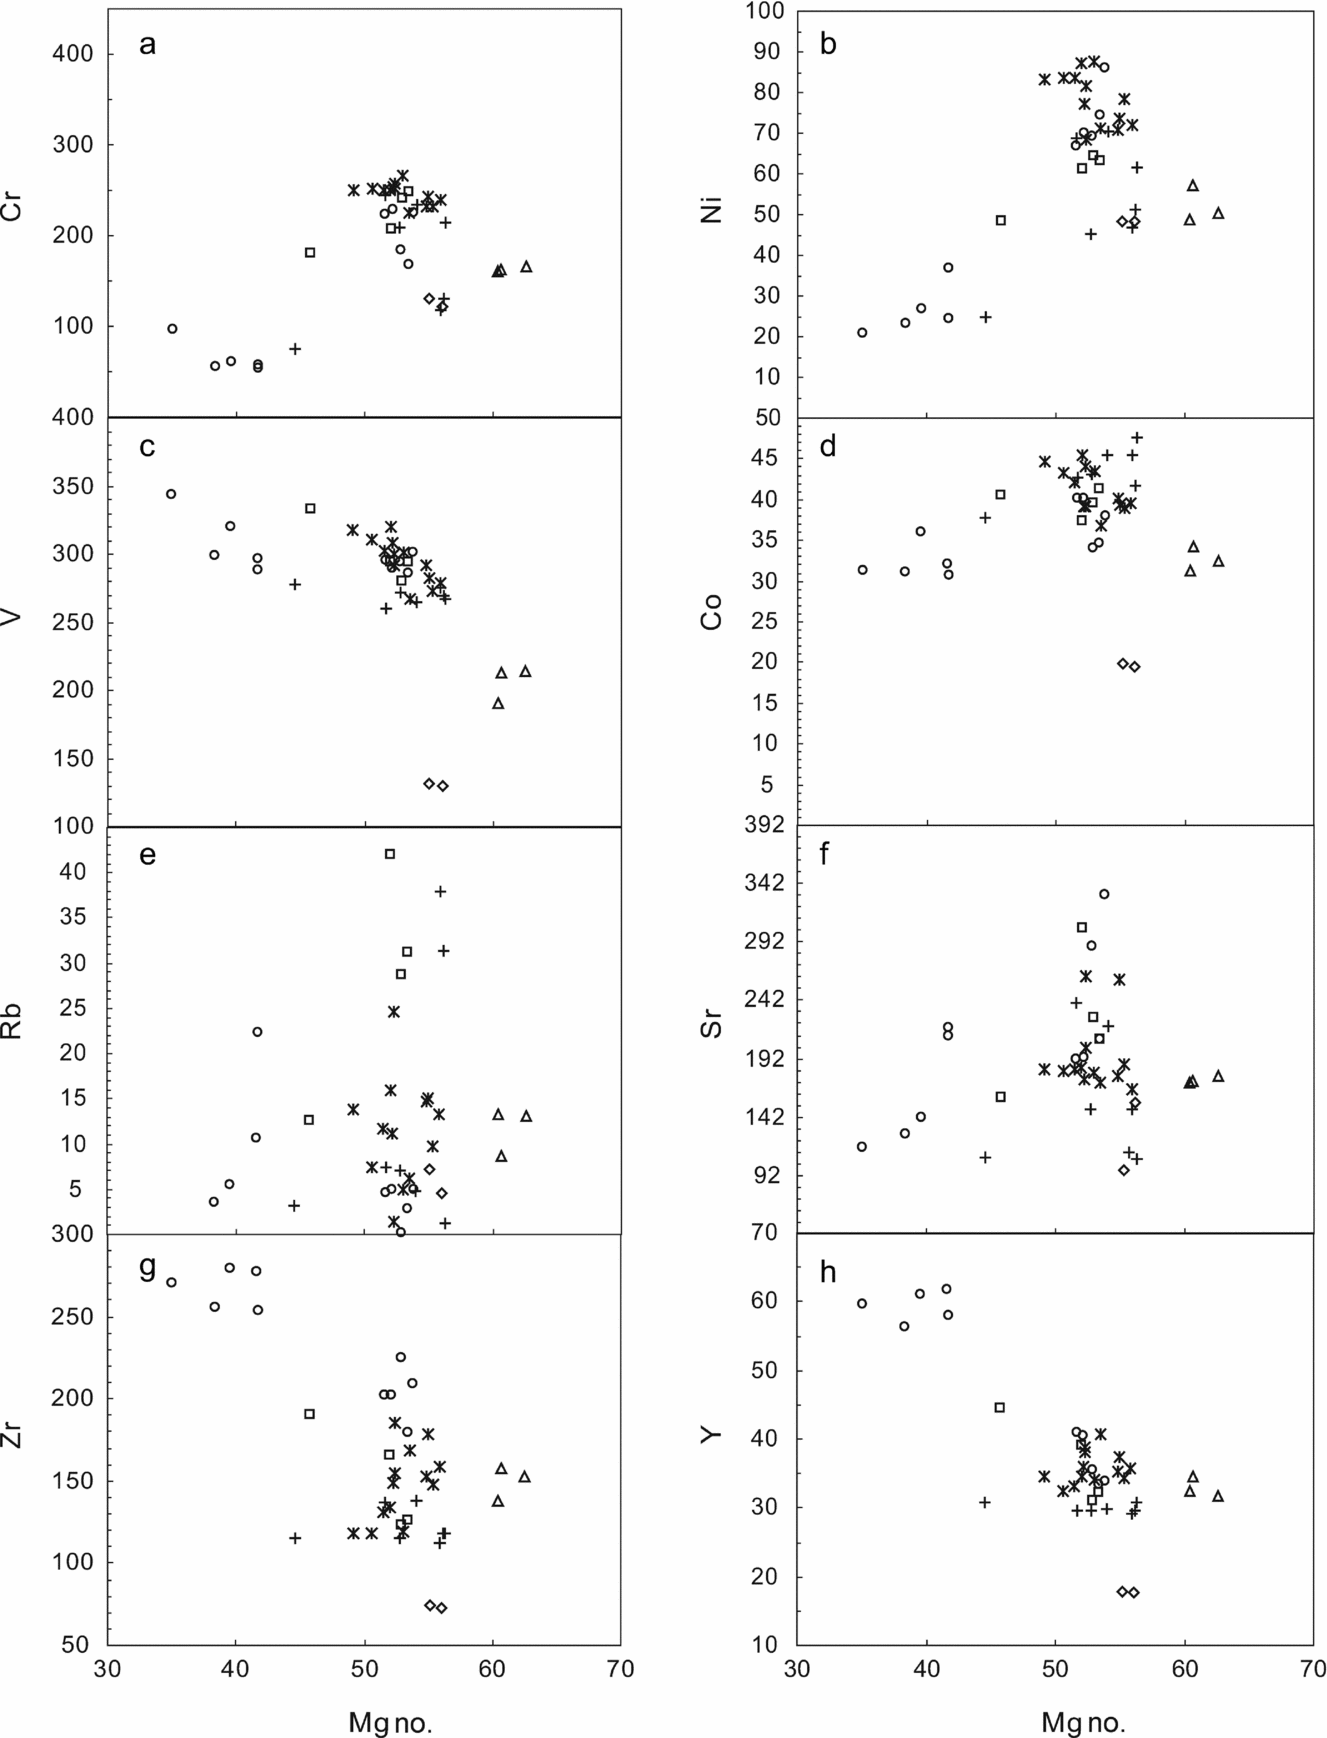
Figure 7. Mg no.–trace element binary diagrams versus Cr, Ni, V, Co, Rb, Sr, Zr, Y for rocks from the Liuyuan complex. Values are in ppm for trace elements. Symbols as in Figure 5.
4.a. Gabbros
Geochemically, the gabbros form three types, which are consistent with those defined petrologically above (Table 1; Figs 5, 6, 7).
The massive gabbros (Type 1) and olivine gabbros (Type 2) have similar major element characteristics, which are analogous to those of the basalts (Figs 5, 6). They display a limited range of compositions, e.g. SiO2 46.1–48.6 wt%; TiO2 1.8–2.5 wt%; Al2O3 14.1–15.0 wt%; Mg no. 46–56. The massive gabbros have relatively low Ni (48 ppm) and Cr (121–129 ppm) contents and total rare earth element (REE) contents (40–41 ppm), and the HREEs are lower than those of normal mid-ocean ridge basalt (N-MORB) (Sun & McDonough, Reference Sun and McDonough1989). The REE patterns are slightly enriched in LREEs (La/YbN = 1.6). A weak negative Eu anomaly (Eu/Eu* = 0.9) is notable (Fig. 8). The trace element ratios (Nb/Y = 0.10, Nb/Zr = 0.02–0.03, Zr/Y = 4.06–4.16 and Ta/Yb = 0.08) are similar to those of N-MORB. These gabbros display primitive mantle-normalized trace element patterns enriched in Pb and Ti elements relative to REEs, and are relatively depleted in Nb and Ta. All these features are subduction-related signatures.
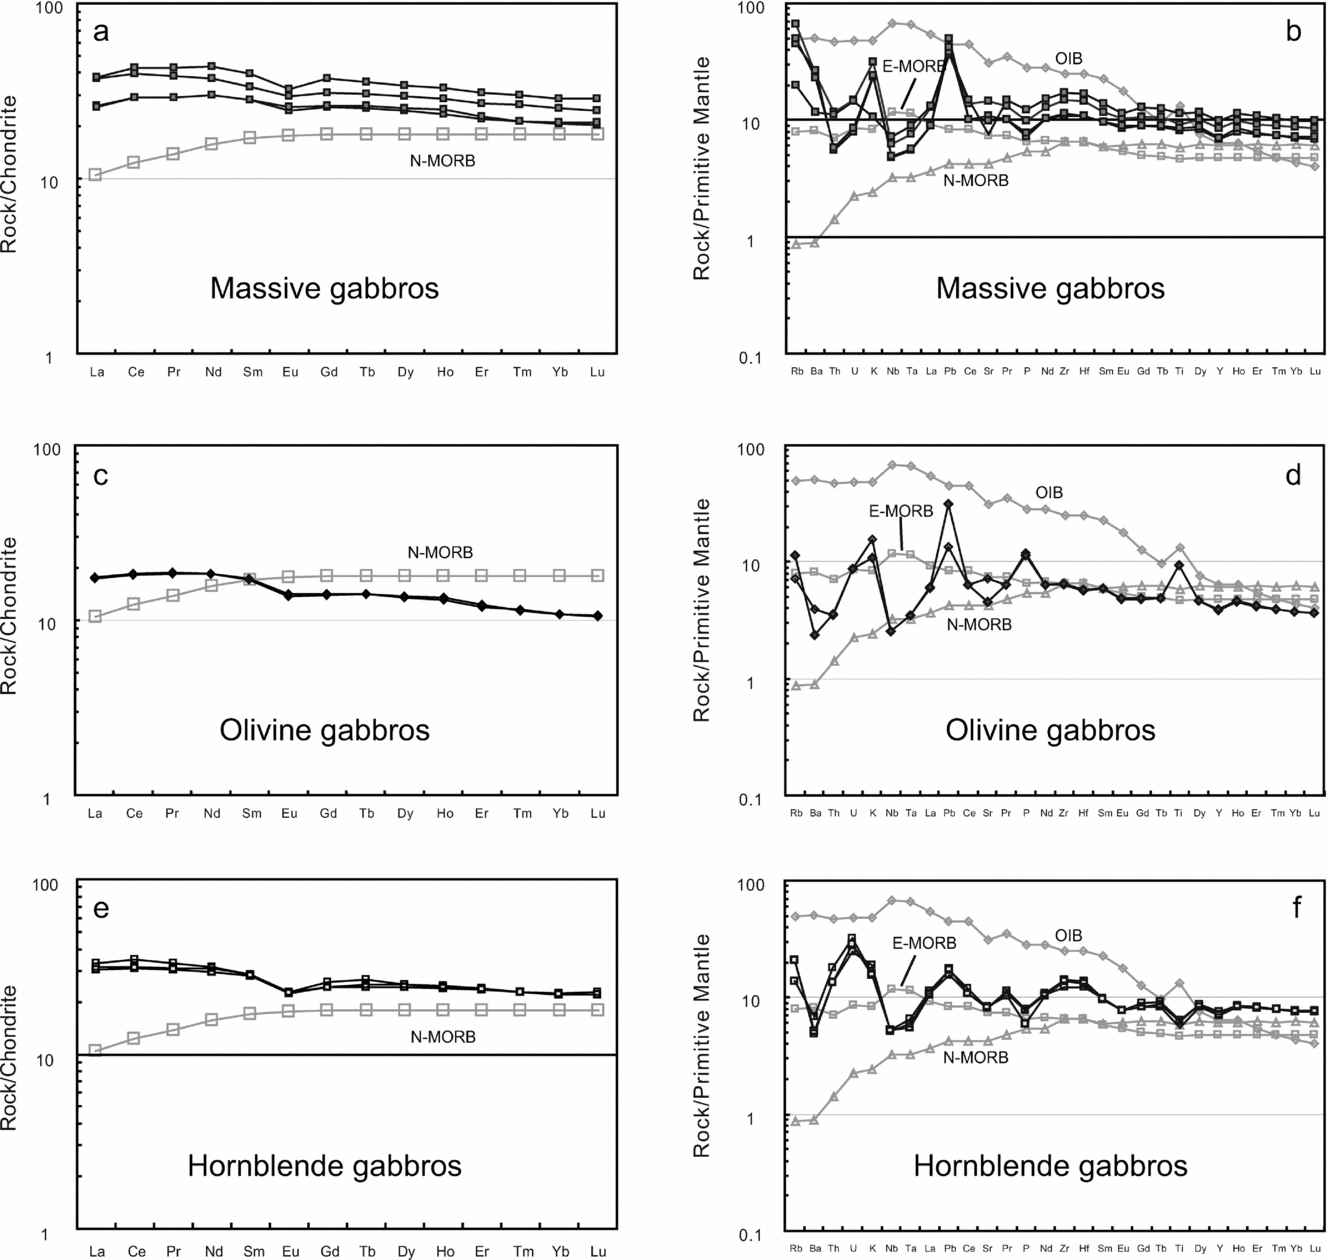
Figure 8. Chondrite-normalized REE patterns and primitive mantle (PM)-normalized multi-element diagrams for gabbros from the Liuyuan complex. The chondrite values are from Boynton (Reference Boynton and Henderson1984). The PM, N-MORB, E-MORB and OIB values are from Sun & McDonough (Reference Sun and McDonough1989).
Cr and Ni abundances of the olivine gabbros vary from 181 ppm to 248 ppm and 48 ppm to 65 ppm, respectively. All the REEs are slightly richer than those of N-MORB (Fig. 8; Table 1). The REEs display flat patterns (La/YbN = 1.2–1.5) and a weak negative Eu anomaly (Eu/Eu* = 0.8–1.0). The trace element ratios (Nb/Y = 0.11–0.12, Nb/Zr = 0.03, Zr/Y = 3.91–4.29 and Ta/Yb = 0.07) are similar to those of N-MORB or enriched mid-ocean ridge basalt (E-MORB) (Sun & McDonough, Reference Sun and McDonough1989). However, subduction-related signatures are shown by depletion in Nb and Ta in primitive mantle-normalized trace element patterns.
The hornblende gabbros (Type 3) are different from the gabbros of Types 1 and 2 and the basalts (Figs 5, 6, 7). The hornblende gabbros are characterized by relatively high SiO2 (50.0–50.3 wt%), CaO (10.2–11.4 wt%) and Al2O3 (14.8–16.5 wt%), and low TiO2 (1.2–1.4 wt%) and MgO (6.6–7.9 wt%) contents. The Mg no. range is from 60 to 63. The gabbros display moderate Cr (160–166 ppm) and Ni (49–57 ppm) contents. The REEs of the samples are slightly richer than those of N-MORB (Fig. 8; Table 1), and display flat patterns (La/YbN = 1.4–1.5) with a negative Eu anomaly (Eu/Eu* = 0.8–0.9). The trace element ratios (Nb/Y = 0.11–0.12, Nb/Zr = 0.02–0.03, Zr/Y = 4.25–4.82 and Ta/Yb = 0.06–0.07) range between those of N-MORB and E-MORB. Primitive mantle-normalized trace element patterns are enriched in large-ion lithophile elements (LILEs) (Rb, Ba, U, K) and Th and Pb, and depleted in Nb, Ta, Ti and Sr, which are similar to those of subduction-related magmas.
4.b. Basaltic rocks
Most basaltic samples have low loss on ignition (LOI) (<3.0 wt%), which indicates low levels of alteration, except for DQ56 (LOI = 6.25%), which is highly altered. The basaltic rocks are characterized by a wide range of SiO2 (47.0–52.1 wt%), TiO2 (1.6–3.6 wt%), Al2O3 (11.6–15.8 wt%), MgO (4.1–7.5 wt%), TFe2O3 (8.5–14.9 wt%), CaO (6.5–11.0 wt%) and MnO (0.14–0.27 wt%) contents, and Mg no. is 35–56 (Table 1; Fig. 6). The values of Cr (54.2–266.2 ppm) and Ni (20.7–87.6 ppm) are close to those of MORB, and incompatible element contents are relatively high, for example Zr (111.8–278.8 ppm), Y (29.1–278.2 ppm) and Yb (1.5–7.2 ppm) (Sun & McDonough, Reference Sun and McDonough1989).
The basaltic rocks are clearly divisible into three different groups based on their element contents (Table 1; Fig. 6). Group 1 is characterized by the lowest TiO2 contents (1.6–1.8%), while Group 2 has intermediate values (1.9–2.0%), and Group 3 basalts have the highest (2.1–3.6%). REE, Nb, Ta, Zr, Hf and Pb contents also increase progressively from Group 1 to 3, but the low ionic potential trace elements, including Li, K, Rb, Cs, Ba, Sr, U and Pb, and Th contents are irregular, with large ranges of variation (Figs 7, 9; Table 1). Most Group 1 basalts were collected from the south, Group 2 basalts from the middle, and Group 3 basalts from the north of the LC.
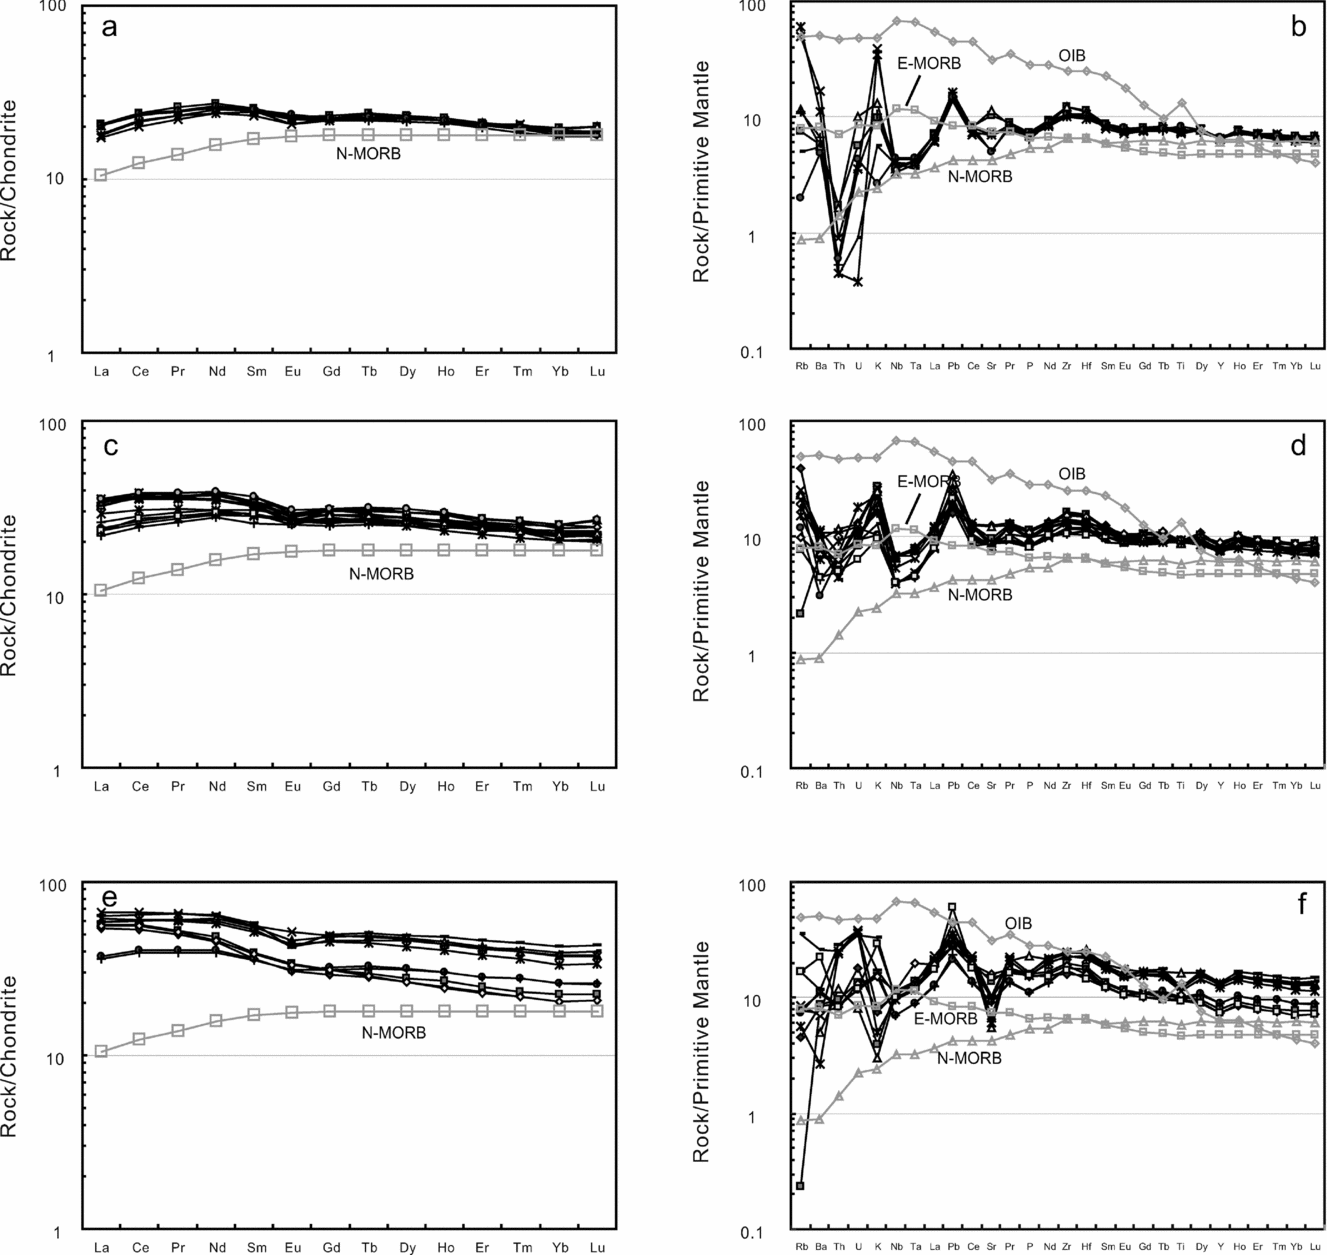
Figure 9. Chondrite-normalized REE patterns and primitive mantle (PM)-normalized multi-element diagrams for the three groups of basalts from the Liuyuan complex. The chondrite values are from Boynton (Reference Boynton and Henderson1984). The PM, N-MORB, E-MORB and OIB values are from Sun & McDonough (Reference Sun and McDonough1989).
Group 1 basalts have similar REE patterns to N-MORB (Fig. 9a) with a typical flat to weakly depleted pattern (La/YbN = 0.9–1.1) (Fig. 9a). They have a weak negative Eu anomaly (Eu/Eu* = 0.9–1.0) and symmetrical LREE-depleted patterns (La/SmN = 0.7–0.8) with flat HREEs (Gb/YbN = 1.2). They have similar low Th/Yb (0.01–0.04), Ta/Yb (0.04–0.06), Nb/Y (0.08–0.10) and Nb/Zr (0.02–0.03) ratios to N-MORB, but high Zr/Y (3.76–4.64) and Ti/Y (317–351) ratios close to E-MORB. In the primitive mantle-normalized trace element diagram (Fig. 9b), this group of basalts displays depletions in Nb, Ta and Th relative to LILEs and REEs, and Pb enrichment. LILEs (Rb, Ba, U and Sr) vary from enriched to depleted. These characteristics are similar to those of supra-subduction zone (SSZ) ophiolites (Hawkins, Reference Hawkins, Hawkins, Parson and Allan1994, Reference Hawkins2003; Hoeck et al. Reference Hoeck, Koller, Meisel and Onuzi2002; Dilek & Furnes, Reference Dilek and Furnes2011).
Group 2 basalts display REE patterns similar to those of E-MORB with a slight enrichment in LREEs (La/YbN = 1.1–1.7), and an overall REE enrichment 1.2–2.5 times that of typical E-MORB (Fig. 9c). The basalts have higher Th/Yb (0.1–0.26), Ta/Yb (0.05–0.09) and Nb/Y (0.08–0.14) ratios than the Group 1 basalts, and low Nb/Zr (0.02–0.03) ratios, which plot between N-MORB and E-MORB (Sun & McDonough, Reference Sun and McDonough1989). Zr/Y and Ti/Y ratios vary from 3.42 to 4.77 and 295 to 374, respectively. On a primitive mantle-normalized trace element diagram (Fig. 9d), the Group 2 basalts also exhibit an enrichment in LILEs (Rb, Ba, K and U) and Pb, and depletion in Nb, Ta and Th relative to LILEs and REEs, and thus are similar to subduction-related magmas.
Group 3 basalts are the most trace element-enriched of the three basalt groups. They are slightly LREE-enriched (La/YbN = 1.4–2.7), and have weak negative Eu anomalies (Eu/Eu* = 0.8–1.0) (Fig. 9e). They exhibit the highest Th/Yb (0.16–0.36), Ta/Yb (0.07–0.24), Nb/Y (0.12–0.24) and Nb/Zr (0.02–0.04) ratios, which are between those of N-MORB and E-MORB. They have Zr/Y (4.38–6.31) and Ti/Y (257–406) ratios that are between those of MORB and ocean island basalt (OIB) (Sun & McDonough, Reference Sun and McDonough1989). These subduction-related signatures are also confirmed by trace elements with relative depletion in Sr and high-field-strength elements (HFSEs) (Nb, Ta and Ti), and enrichments in Pb, LILEs and REEs on a primitive mantle-normalized trace element diagram (Fig. 9f).
5. Isotopic determinations
Rb–Sr and Sm–Nd isotopic results for the LC are presented in Table 2. Sr initial ratios and εNd(t) values are calculated at an age of 280 Ma, which is the same as that obtained from zircon geochronology of a gabbro presented in Section 6. The massive gabbros and olivine gabbros have similar εNd(t) values of 6.9 and 6.7–7.5, respectively. They exhibit relatively high (87Sr/86Sr)i values of 0.7057 and 0.7088–0.7098, respectively. The hornblende gabbros have moderate εNd(t) (7.7) and the lowest (87Sr/86Sr)i (0.7034) values, which plot in the mantle array magma area (Fig. 10).
Table 2. Sm–Nd and Rb–Sr isotopic data from the Liuyuan complex, Beishan orogen, NW China
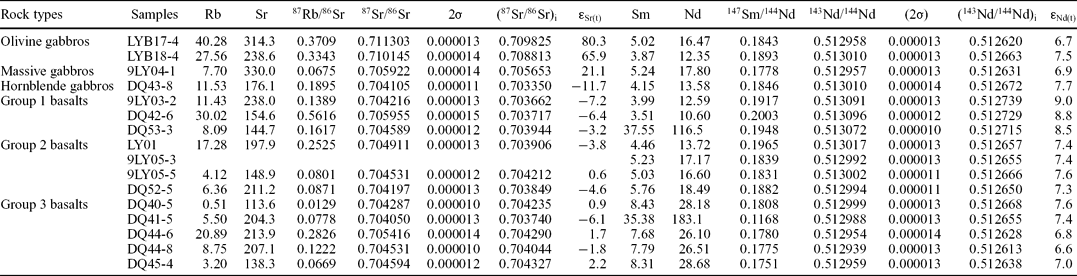
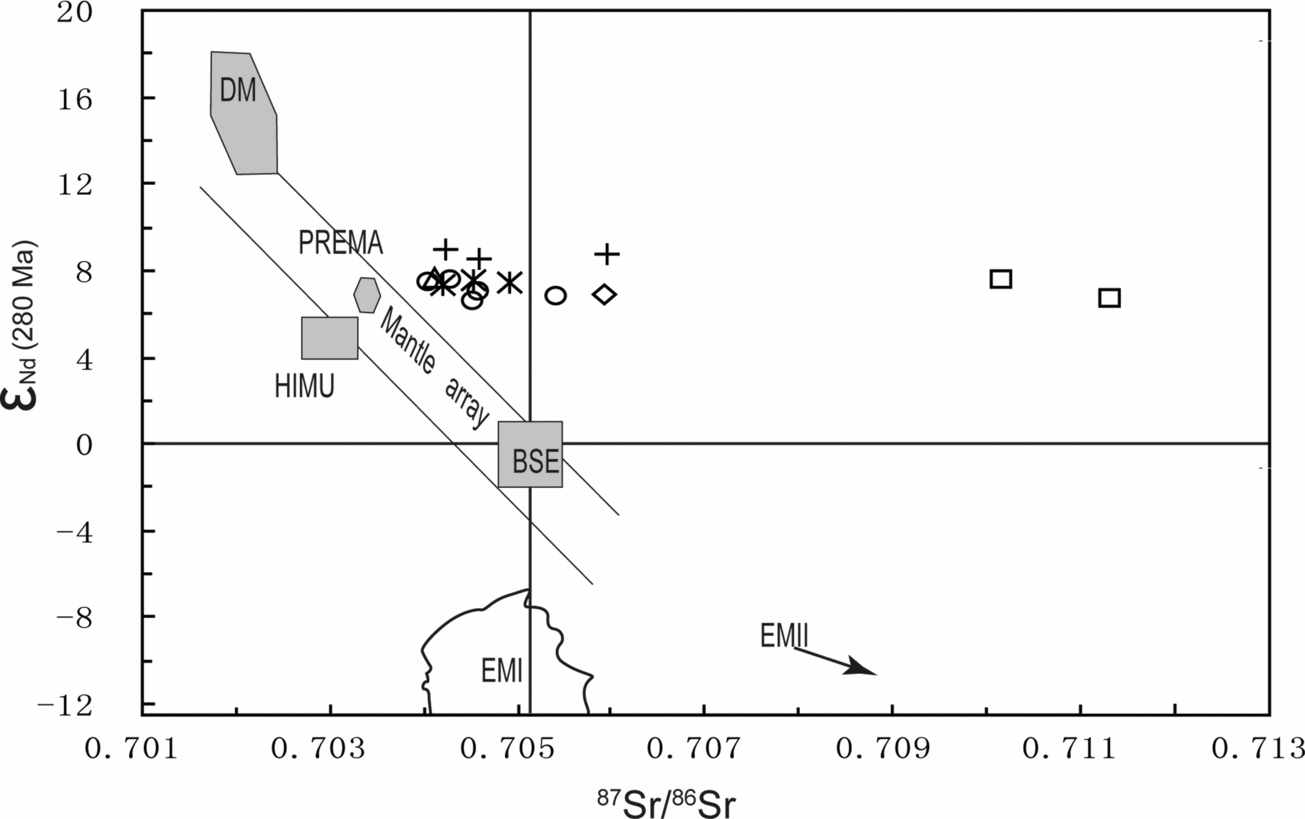
Figure 10. εNd(t) versus 87Sr/86Sr of samples from the Liuyuan complex. DM – depleted mantle; BSE – bulk silicate earth; EMI and EMII – enriched mantle; HIMU – mantle with high U/Pb ratio; PREMA – frequently observed prevalent mantle composition (Zindler & Hart, Reference Zindler and Hart1986).
The basaltic samples exhibit relatively low (87Sr/86Sr)i isotopic ratios varying between 0.703662 and 0.704327, and high (143Nd/144Nd)i isotopic ratios varying between 0.5126 and 0.5127. They have positive εNd(t) values from 6.6 to 9.0. In an εNd(t) versus 87Sr/86Sr diagram (Fig. 10), most samples fall close to, but on the high 87Sr/86Sr side of the mantle array (Tejada et al. Reference Tejada, Mahoney, Duncan and Hawkins1996; Neal, Mahoney & Chazey, Reference Neal, Mahoney and Chazey III2002). The Sr–Nd isotopic ratios also vary in an orderly manner between the three groups of basalts (Fig. 10; Table 2). Group 1 basalts display the highest εNd(t) (8.5–9) and lowest (87Sr/86Sr)i (0.703662–0.703944) isotopic ratios; the Group 2 basalts have intermediate εNd(t) (7.3–7.6) and (87Sr/86Sr)i (0.703849–0.704212) isotopic ratios; and the Group 3 basalts exhibit the lowest εNd(t) (6.6–7.6) and highest (87Sr/86Sr)i (0.70374–0.704327) isotopic ratios.
In summary, the rocks have a narrow range in positive εNd(t) values. Most samples have a narrow range in 87Sr/86Sr and these plot close to, but to the left of the mantle array, consistent with a fore-arc and/or back-arc and/or an oceanic arc setting.
6. Geochronology
In order to determine the age of the LC, zircons were separated from a hornblende gabbro (sample DQ43). The zircons are mostly colourless, transparent and well crystallized with short prismatic shapes (elongation ratios vary from 1.25 to 1.5), with grain sizes ranging from 100 to 200 μm in diameter. Cathodoluminescence (CL) images show that the zircons have similar compositions and typical basic magmatic zonal patterns (Fig. 11). These characteristics indicate that the zircons are of magmatic origin. U–Pb laser ablation (LA)-ICP-MS analytical results from 20 grains are listed in Table 3 and presented in Figure 12. The 206Pb–238U ages range from 281 ± 4 Ma to 296 ± 5 Ma, and concentrate in a small area close to or on the concordia line (Fig. 12a, b). Twenty analysed samples yield a 206Pb–238U weighted average age of 286 ± 2 Ma (MSWD = 0.62) (Fig. 12a), which is interpreted as the crystallization age of the gabbro.
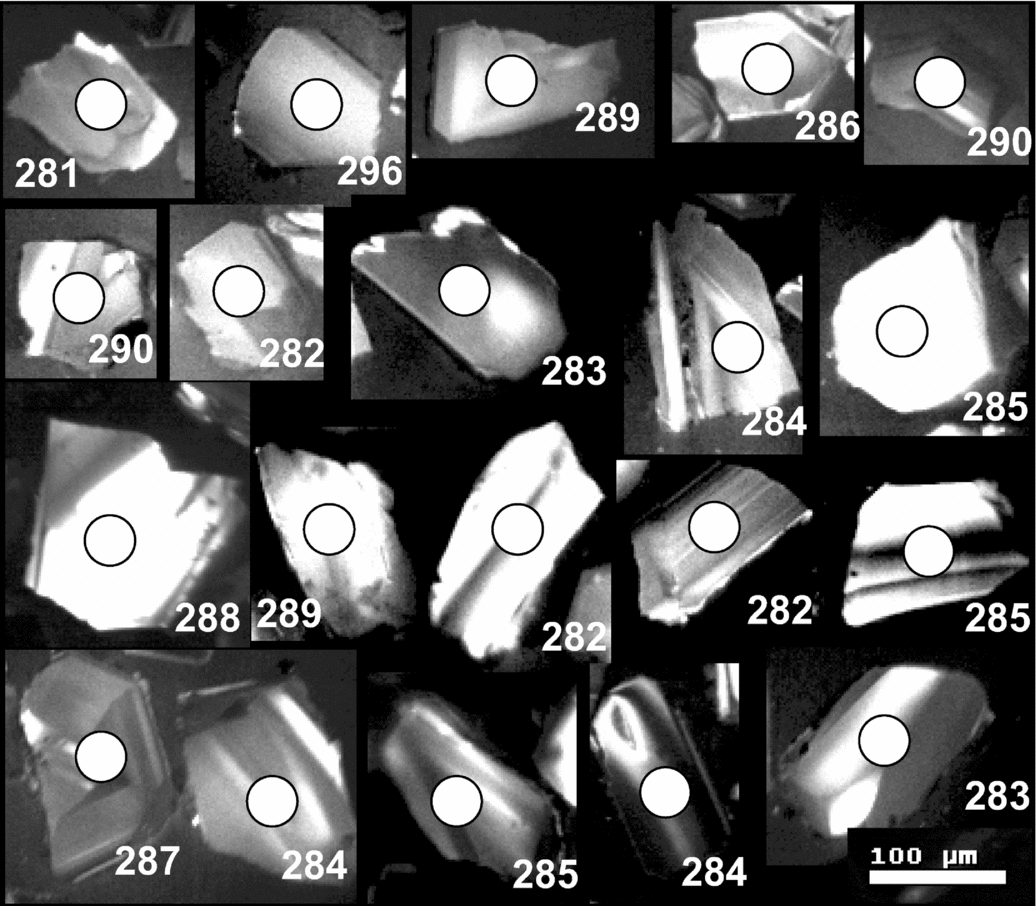
Figure 11. Cathodoluminescence (CL) images of zircons selected for radiometric dating from a hornblende gabbro in the Liuyuan complex. Circles mark the beam positions of the isotopic analyses.
Table 3. Zircon U–Pb LA-ICP-MS data for zircon grains from hornblende gabbros in the Liuyuan complex
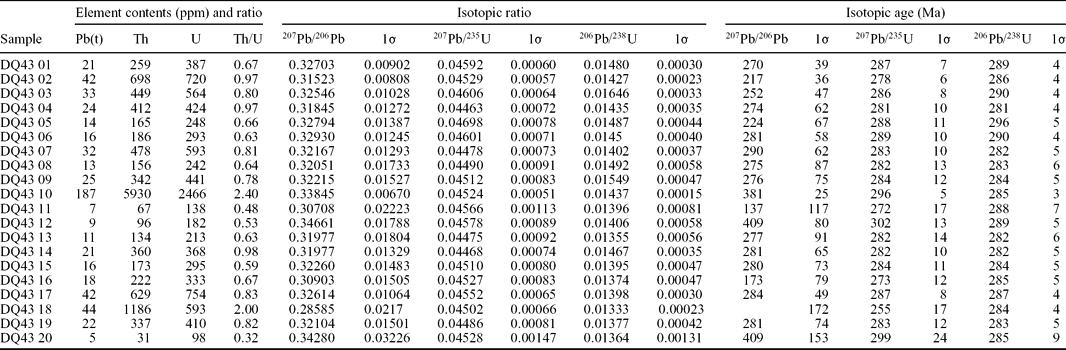

Figure 12. Concordia U–Pb diagram (a) and 206Pb/238U cumulative probability diagram (b) of LA-ICP-MS analyses of zircons from hornblende gabbros in the Liuyuan complex.
7. Discussion
7.a. The origin of the Liuyuan complex
Although most of the different rock types in the LC are mutually juxtaposed by thrusts, the original stratigraphy of the ultramafic–mafic complex can be rebuilt as follows (Fig. 13): from bottom to top, ultramafic rocks, olivine gabbro, massive basalt, pillow basalt, basaltic breccia and chert with tuff beds. The basalts and gabbros share similar chemical characteristics (Figs 6, 7). They have positive correlations between Mg no. and major (Al2O3 and CaO) and trace elements (Cr, Ni and Co), and a negative correlation between Mg no. and major elements (TFe2O3, TiO2 and P2O5), trace elements (Zr, Y, Nb, Ta, Hf, Pb) and REEs (Figs 6, 7; Table 1). All these values indicate that the basalts and gabbros were derived from the same source and that fractionation was important in their generation, for example the fractionation of clinopyroxene, ilmenite and plagioclase.

Figure 13. A reconstructed stratigraphy of the main units of the Liuyuan complex.
All the rocks display relatively high TiO2 (1.2–3.6 wt%) contents, which are different from those of island arc magmas. The rocks exhibit an overall HREE enrichment 1.2 to 4 times that of typical N-MORB/E-MORB (Table 1; Figs 8, 9), indicating that the source of the LC was most likely a relatively fertile mantle. The relatively flat chondrite-normalized REE patterns are similar to those of N-MORB and E-MORB, and the primitive mantle-normalized trace element patterns are similar to those of basalts from SSZ ophiolites. Such a subduction-related signature is consistent with the systematic enrichments in LILEs (Rb, K, Ba, U), Th and Pb, and depletions in Nb and Ta (Hawkins, Reference Hawkins, Hawkins, Parson and Allan1994, Reference Hawkins2003; Karsten, Klein & Sherman, Reference Karsten, Klein and Sherman1996; Hoeck et al. Reference Hoeck, Koller, Meisel and Onuzi2002).
HFSE abundances and element ratios are the most useful chemical signatures likely to be preserved, even if rocks are altered, or have undergone low-grade regional metamorphism or subduction metamorphism (Bedard, Reference Bedard1999). The Th/Yb, Ta/Yb, Nb/Y and Nb/Zr ratios of the three groups of basalts indicate that they vary from those of N-MORB to E-MORB, and the high Zr/Y and Ti/Y ratios vary between those of MORB and OIB (Sun & McDonough, Reference Sun and McDonough1989).
Several classification schemes provide diagnostic parameters to evaluate tectonic settings, of which the Ti/V ratio is one of the most useful (Shervais, Reference Shervais1982). On a Ti v. V diagram most Liuyuan samples plot within the ocean floor basalt (OFB) field, and exhibit a positive correlation from the MORB to the OFB fields (Fig. 14). On a Cr v. Y diagram (Fig. 15) (Pearce et al. Reference Pearce, Alabaster, Shelton and Searle1981) most samples plot in the MORB field, including Group 1 and 2 basalts, olivine gabbros and hornblende gabbros, and they overlap with the fields of the Lau Basin Ridge and Mariana Trough. Some Group 3 basalts plot in the MORB field, but all the basalts overlap with the field of the Lau Basin Ridge. The massive gabbros plot in the island arc tholeiite (IAT) field. The Hf/3–Ta–Th diagram (Wood, Reference Wood1980) is another useful tectonic magmatic discriminant diagram, which can diagnose SSZ settings. The basalt and gabbro samples display a clear SSZ signature (Fig. 16), plotting in the N-MORB and IAT fields, and predominantly on the boundary between N-MORB and IAT compositions. They overlap with basalts from the Lau Basin and the Mariana Trough. All Group 1 basalts plot in the N-MORB field; the Group 2 basalts, olivine gabbros, massive gabbros and hornblende gabbros plot on the margin between IAT and N-MORB and overlap the fields of the Mariana Trough and Lau Basin; the Group 3 basalts mainly plot in the IAT and N-MORB fields; only one sample plots in the E-MORB field. Usually these geochemical relations are interpreted to indicate a back-arc/fore-arc setting. However, in the anatomy of modern island arcs, they define a fore-arc ophiolite (Stern, Reference Stern2004, Reference Stern2008, Reference Stern, Kusky, Zhai and Xiao2009), an interpretation that we favour for the LC in this paper.
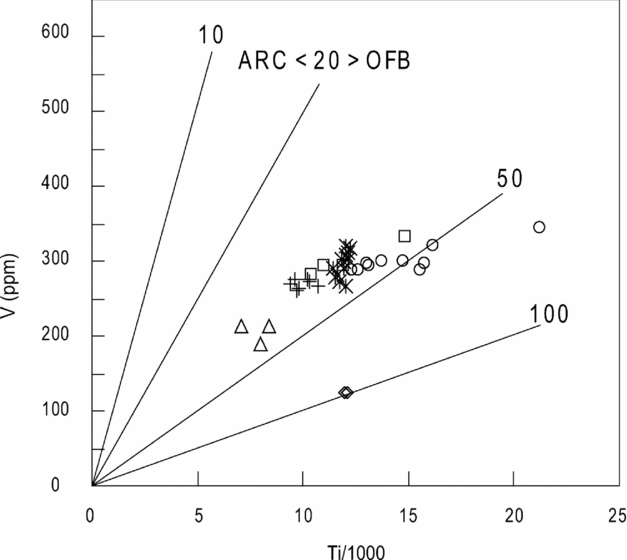
Figure 14. A Ti v. V discrimination diagram for rocks from the Liuyuan complex (Shervais, Reference Shervais1982). Symbols as in Figure 5. OFB – ocean floor basalt.

Figure 15. A Cr v. Y discrimination diagram for rocks from the Liuyuan complex, after Pearce et al. (Reference Pearce, Alabaster, Shelton and Searle1981). BON – boninite, IAT – island arc tholeiite and MORB – mid-oceanic ridge. The fields of the Lau Basin-Axial Ridge, the Tofua Arc, Mariana Trough and Mariana Arc are after Hawkins (Reference Hawkins2003). Symbols as in Figure 5.
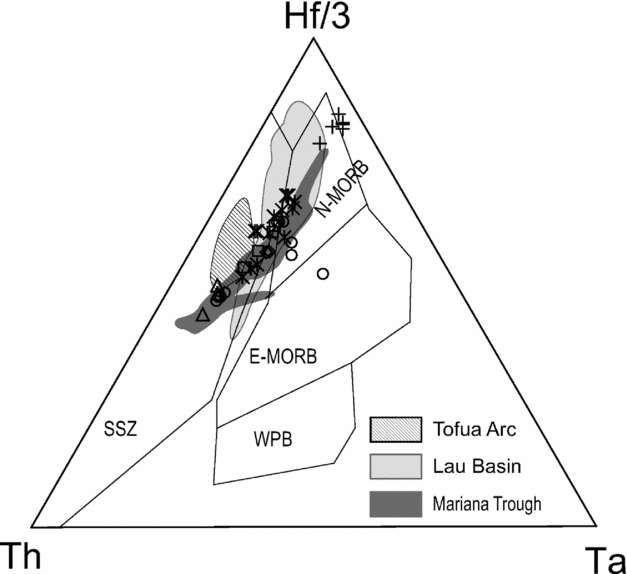
Figure 16. A discrimination diagram for Hf/3–Ta–Th (Wood, Reference Wood1980; Hawkins, Reference Hawkins2003) for rocks of the Liuyuan complex showing fields of N-MORB, E-MORB, WPB (within-plate) and SZZ (supra-subduction zone) magmas. The fields of the Tofua Arc, Lau Basin and Mariana Trough are from Hawkins (Reference Hawkins2003). Symbols as in Figure 5.
All the Liuyuan samples display high positive εNd(t) values (5.7–9.0). Except for the massive gabbros and olivine gabbros, the samples have low (87Sr/86Sr)i ratios, which are consistent with generation from a mantle-derived magma. Most samples plot immediately to the high 87Sr/86Sr side of the mantle array, consistent with mixing of slab-derived subducted components with the mantle source. The high (87Sr/86Sr)i gabbros suggest there has been redistribution of Sr during alteration of the ophiolite. The Sr–Nd isotopes of the basalts vary systematically among the three groups of basalts (Fig. 10; Table 2), with εNd(t) values decreasing from Group 1 to Group 3. We interpret these relations to indicate that the magma was progressively assimilated by island arc crustal components.
In summary, the LC is dominated by MORB-like rocks, which have diagnostic subduction-related geochemical signatures. To explain the full gamut of stratigraphic, structural and geochemical relations, we suggest that the LC formed in a fore-arc (Karsten, Klein & Sherman, Reference Karsten, Klein and Sherman1996; Guivel et al. Reference Guivel, Lagabrielle, Bourgois, Maury, Fourcade and Martin1999; Saccani & Photiades, Reference Saccani and Photiades2004). Subsequently, it was accreted to a trench, where it became incorporated into an accretionary prism.
7.b. Age constraints
7.b.1. Lower limit of age constraints
As mentioned above, both basalt and gabbro samples in the LC display a clear SSZ signature and are interpreted as a fragment or sliver of a fore-arc. One gabbro has an early Permian age (286 ± 3 Ma). Although it is difficult to obtain the precise age of basalts, regional relationships and isotopic ages can be used to constrain their age.
Based on the regional geology, we propose that the basalts most likely erupted in the period c. 286–300 Ma (Zhao et al. Reference Zhao, Guo, Han, Wang and Liu2006; Jiang et al. Reference Jiang, Xia, Yu, Dai, Wei and Ye2007). This conclusion is in agreement with the fact that the 286 Ma gabbro was intruded into the basalts (Fig. 4d), which accordingly should post-date them. Therefore, the mafic components of the LC are probably late Carboniferous to early Permian in age.
Considering the fact that all the basalts are thrust-imbricated against fossiliferous Permian limestone and tuffaceous sediments (Zuo et al. Reference Zuo, Zhang, Wang, Jin, He, Zhang, Li and Bai1990; Zhao et al. Reference Zhao, Guo, Han, Wang and Liu2006; Jiang et al. Reference Jiang, Xia, Yu, Dai, Wei and Ye2007), we propose that the youngest component of the LC is Permian in age. All the late Carboniferous or early Permian ages of the LC can be used to define a lower age limit, which should pre-date the termination of subduction-related accretion of the southernmost Altaids.
The Beishan contains several subducted-related magmatic complexes of Permian age, for example the Hongshishan and Pobei Alaskan-type mafic–ultramafic complexes (Ao et al. Reference Ao, Xiao, Han, Mao and Zhang2010), the Baishiquan complex with a zircon LA-ICP-MS U–Pb age of 281 ± 0.7 Ma, and the Pobei complex with a zircon SHRIMP U–Pb age of 278 ± 2 Ma (Li et al. Reference Li, Chen, Mei, Wu, Chen, Yang and Dai2006; Mao et al. Reference Mao, Xiao, Han, Sun, Yuan, Yan, Li, Yong and Zhang2006). Also there are arc-related, Permian granitic intrusions. A granite in the Beidashan area has an 40Ar–39Ar age on biotite of 277.0 ± 3.8 Ma, and on hornblende of 275 ± 4 Ma (Lai et al. Reference Lai, Jiang, Qiu, Liu, Hu and Zhang2007), and the Shanchakou granitic porphyry in the eastern Tianshan has a zircon SHRIMP age of 278 ± 4 Ma (Li et al. Reference Li, Chen, Lu, Yang, Guo and Mei2004).
7.b.2. Upper limit of age constraints
Published isotopic ages combined with regional tectonostratigraphic data can place an upper limit on the time of final accretion in the Beishan. Several syn-collisional and post-collisional intrusions are early Permian or later. For example, the Weiya syn-collisional granitic complex has a zircon SHRIMP U–Pb age range from 233 to 246 Ma (Zhang et al. Reference Zhang, Gu, Wu, Xi and Tang2005), the syn-collisional, a rare metal pegmatite deposit at Jingerquan has an 40Ar–39Ar early Triassic age of 243 ± 2 Ma on mica (Chen et al. Reference Chen, Wang, Gong, Chen and Chen2006), and post-collisional lamprophyre intrusions in the Liuyuan area have 40Ar–39Ar plateau ages of 218.7 ± 1.4 Ma and 220.6 ± 1.5 Ma on phlogopite (Liu, Zhao & Guo, Reference Liu, Zhao and Guo2006). Accordingly, the termination of orogenesis in the Beishan orogen should have been in early Triassic time. Finally, the Huaniushan and Huitongshan granites that have 40Ar–39Ar ages of 192 ± 2 Ma and 194 ± 1 Ma on potassium feldspar, respectively, were intruded in post-collisional times (Nie et al. Reference Nie, Jiang, Liu, Chen, Liu and Zhang2002b; Jiang et al. Reference Jiang, Nie, Chen, Liu, Bai, Liu and Zhang2003).
In the SW Tianshan, subduction took place after late Permian time. For example, subduction gave rise to eclogites that have zircon SHRIMP U–Pb metamorphic ages ranging from 230 Ma to 225 Ma (Zhang et al. Reference Zhang, Ai, Li, Rubatto, Song, Williams, Song, Ellis and Liou2007).
In late Permian and Triassic time, regional compression was extensive in the Beishan and adjacent areas. For example, Zheng et al. (Reference Zheng, Zhang, Wang, Liu, Wang, Zuo, Wang, Lkaasuren, Badarch and Badamgarav1996) demonstrated that major thrusts developed in the Jurassic. Further west, mylonites in a thrust zone in the eastern Tianshan have an 40Ar–39Ar age of 167–247 Ma on mica (Cunningham et al. Reference Cunningham, Owen, Snee and Li2003), and sericite in a thrust mylonite zone has an 40Ar–39Ar plateau age of 243.8 ± 1.8 Ma (Wang et al. Reference Wang, Chen, Han, Wang, Liu and Zhang2008).
7.c. Tectonic model
In early Permian time, the Liuyuan ocean, one branch of the Palaeo-Asian ocean, was being subducted to give rise to the active margin of the Huaniushan arc. To explain the relevant times of intrusion of syn-collisional and post-collisional magmatic rocks, we suggest that, when the ocean was closing, a mid-oceanic ridge was subducted below the trench on the southern margin of the Huaniushan arc; this is indicated by MORB and subduction-related geochemistry combined with field relationships. Our suggested evolution is illustrated in Figure 17.
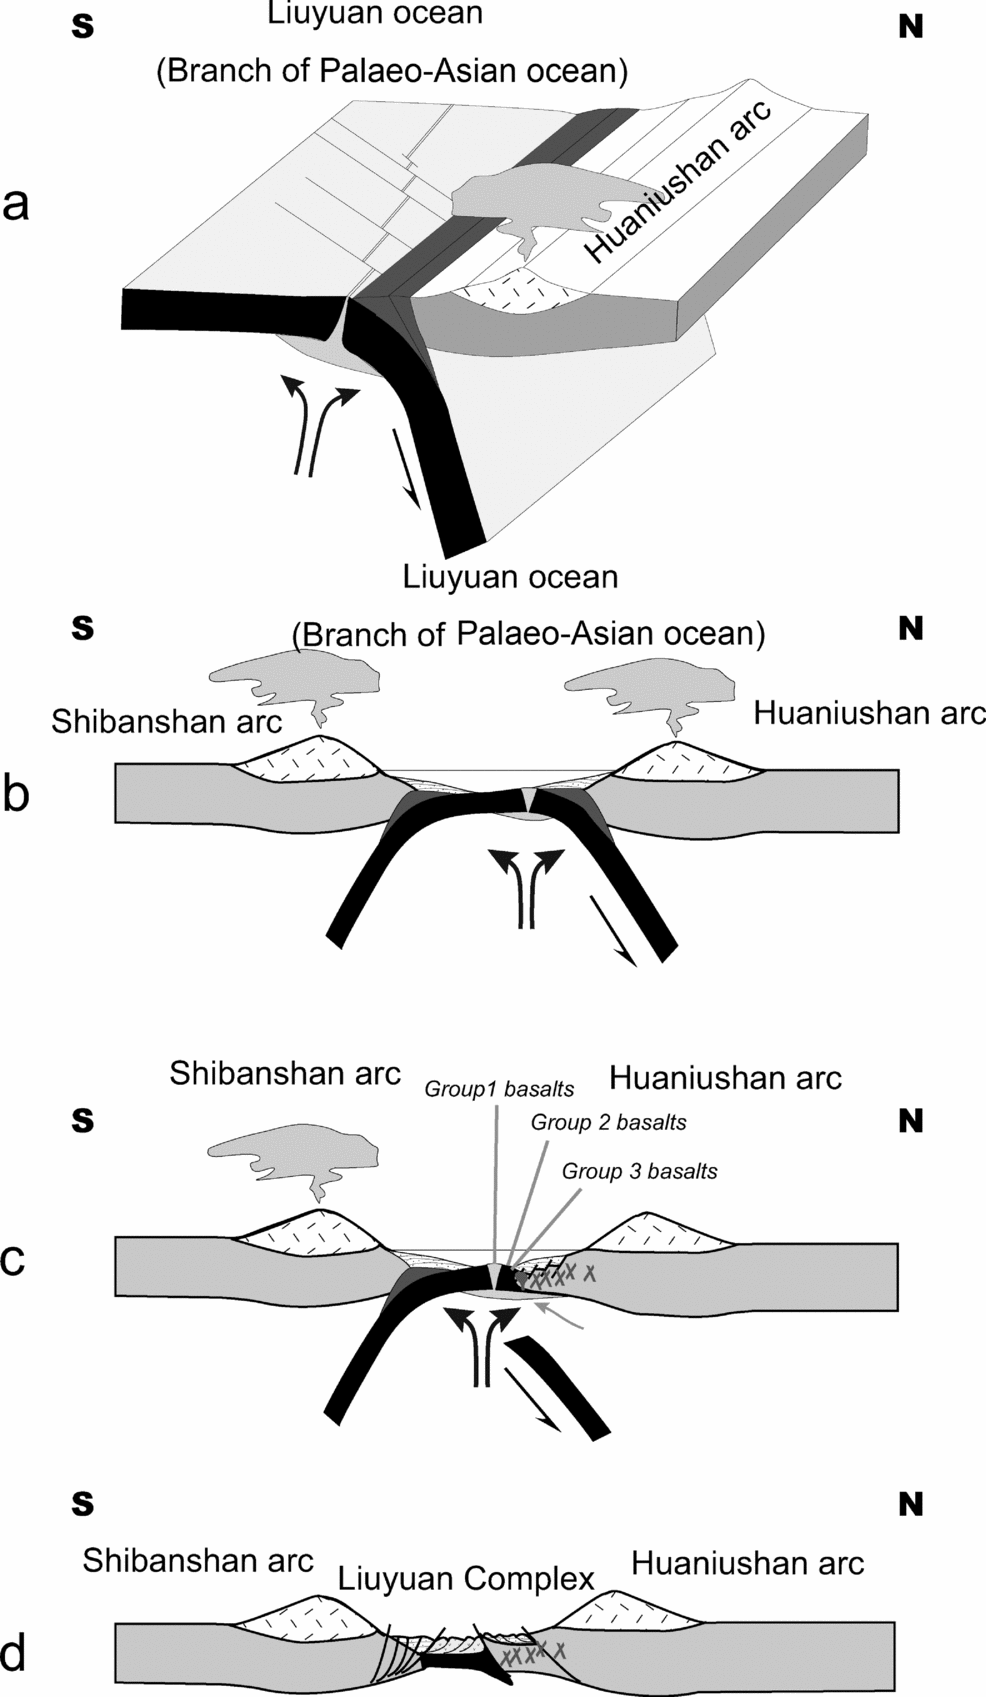
Figure 17. A three-dimensional tectonic model to explain the evolution of the Liuyuan complex from late Carboniferous to Permian time. (a) In the late Carboniferous to early Permian, a fore-arc was constructed by subduction of a spreading ridge of the Liuyuan ocean, a branch of the Palaeo-Asian ocean, beneath the Huaniushan arc to the south. (b) The Liuyuan ocean was subducted possibly both to the south and the north, giving rise to the Shibanshan arc and late phases of the Huaniushan arc, respectively. (c) Group 1, 2 and 3 basalts were generated in the fore-arc of the Huaniushan arc. (d) Final amalgamation of the Shibanshan and Huaniushan arcs possibly in late Permian time formed the Liuyuan ophiolitic complex.
The ridge subduction created a slab window, which induced a lateral flow of fertile material from the mantle wedge into the MORB-type mantle, resulting in mixing and formation of heterogeneous mantle. The coupling of mantle upwelling might have interacted with the subduction-related magma/fluid efflux from the subduction devolatilization, which in turn permitted formation of the Group 1 and 2 basalts and gabbros; the Group 3 basalts with an OIB-type geochemical signature developed through the slab window. A comparable tectonic scenario took place at the Chile Ridge in the Chile triple junction, and at the East Pacific Rise in the Mexico triple junction (Karsten, Klein & Sherman, Reference Karsten, Klein and Sherman1996; Guivel et al. Reference Guivel, Lagabrielle, Bourgois, Maury, Fourcade and Martin1999; Saccani & Photiades, Reference Saccani and Photiades2004).
In the slab window zone, asthenospheric material infiltrated the mantle wedge and induced the generation of mantle-derived magmas (Guivel et al. Reference Guivel, Lagabrielle, Bourgois, Maury, Fourcade and Martin1999; Ferrari, Petrone & Francalanci, Reference Ferrari, Petrone and Francalanci2001). The mid-ocean ridge subduction also led to formation of strike-slip faults in the supra-subduction region. The mantle-derived magma rose up and along the strike-slip fault channels and intruded or erupted. In consequence, widespread basalts and Alaskan-type complexes developed along these large strike-slip faults in the eastern Tianshan and Beishan, such as the Pobei complex in the Beishan (Ao et al. Reference Ao, Xiao, Han, Mao and Zhang2010), and the Huangshan and Baishiquan complexes in the eastern Tianshan (Xiao et al. Reference Xiao, Zhang, Qin, Sun and Li2004b; Mao et al. Reference Mao, Xiao, Han, Sun, Yuan, Yan, Li, Yong and Zhang2006). Extensive basalts erupted in the back-arc region of the Hongliuhe and Santanghu areas have OIB and E-MORB geochemical signatures (Zhao et al. Reference Zhao, Guo, Han, Wang and Liu2006; Pan et al. Reference Pan, Guo, Liu and Zhao2008), and Permian laser isochron 40Ar–39Ar ages of 278 ± 17 Ma and 305 ± 14 Ma (Pan et al. Reference Pan, Guo, Liu and Zhao2008).
In the following subduction-accretionary history, the LC was accreted onto a fore-arc. When the Liuyuan ocean closed, the LC was thrust as an imbricated ophiolitic stack between the Huaniushan and Shibanshan arcs. This sequence of events is well established in the evolution of many accretionary orogens (Cluzel, Aitchison & Picard, Reference Cluzel, Aitchison and Picard2001; Stern, Reference Stern2004, Reference Stern2008, Reference Stern, Kusky, Zhai and Xiao2009; Ueda & Miyashita, Reference Ueda and Miyashita2005).
7.d. Tectonic implications
The final closure time of the Palaeo-Asian ocean, and the time of formation of the terminal suture zone of the Altaids are subjects of current hot debate. The LC in the Beishan orogenic collage provides key evidence to address this controversy.
The main part of the LC has MORB geochemical signatures displaying high positive εNd(t) values (5.8–9.0) and low initial Sr ratios, and some OIB characteristics (Group 3 basalts), and yet some rocks exhibit subduction-related signatures such as depletion in Nb–Ta and Ti. Accordingly, we interpret the evolution of the LC as follows: MORB oceanic crust was created in a mid-oceanic ridge near a trench in early Permian time. It formed where fluids released from melted sediments from a deep subducting slab were injected into the ocean floor-ophiolitic magmas in a supra-subduction setting. The fore-arc was probably narrow, enabling volcaniclastic tuffs and fragments from a nearby arc volcano to be deposited on the cherts and basalts. Our new data demonstrate for the first time that the Palaeo-Asian ocean in the Beishan orogenic collage in the middle of the Southern Tien Shan-Solonker suture zone did not close until late Permian time or later.
Our results from the LC are consistent with and support well-documented floral, faunal and palaeomagnetic data. Faunal and floral data indicate that the Tarim plate collided with Palaeo-Asia in late Permian time. For example, Sun (Reference Sun1973) and Qu et al. (Reference Qu, Wu, Li and Li2002) reported late Permian–Triassic dicynodonts in the Turfan Basin, a group of reptiles that came from the Gondwana continent. Palaeobotanical data indicate that Angaran flora migrated into the Tarim in late Permian time, where the previous dominant flora were Pangaean of early Permian age (Ou et al. Reference Ou, Wang, Zhan and Zhou1993, Reference Ou, Zhu, Zhan and Wang2004; Wu, Reference Wu1993; Fang, Reference Fang1997; Zhu, Reference Zhu1997, Reference Zhu2001; Guo, Reference Guo2001; Li, Sun & Zheng, Reference Li, Sun and Zheng2002). The above authors documented a detailed history as follows: in early Permian time, Pangaean flora were still predominant in the Tarim plate; in middle Permian time, Angaran flora began to migrate into the Tarim plate forming a mixed floral species; from late middle Permian to late Permian time, the Tarim plate became dominated by Angaran flora. These relations indicate that close proximity and initial contiguity of the two plates began in middle Permian time, that collision between the two plates started by late Permian time, and the timing of these events is consistent with palaeomagnetic data (Li, Sun & Zheng, Reference Li, Sun and Zheng2002).
However, the final amalgamation was more complicated in late Permian to mid-Triassic time than we previously recognized (Xiao, Kröner & Windley, Reference Xiao, Kröner and Windley2009; Xiao et al. Reference Xiao, Huang, Han, Sun and Li2010a). Multiple linear components were probably amalgamated in a complex manner with oblique, orthogonal and parallel interactions (Xiao, Kröner & Windley, Reference Xiao, Windley, Huang, Han, Yuan, Chen, Sun, Sun and Li2009; Xiao et al. Reference Xiao, Huang, Han, Sun and Li2010a, Reference Xiao, Mao, Windley, Han, Qu, Zhang, Ao, Guo, Cleven, Lin, Shan and Lib). Large-scale oroclinal bending, rotation and strike-slip faulting occurred simultaneously or mutually overlapped. This gave rise to a complex tectonic scenario in which the final amalgamation time varied considerably along strike of the major suture zone of the southern Altaids (Xiao et al. Reference Xiao, Kröner and Windley2009, Reference Xiao, Huang, Han, Sun and Li2010a, Reference Xiao, Mao, Windley, Han, Qu, Zhang, Ao, Guo, Cleven, Lin, Shan and Lib). The terminal stages of the accretionary orogeny took place in late Permian to middle Triassic time (Xiao, Kröner & Windley, Reference Xiao, Windley, Huang, Han, Yuan, Chen, Sun, Sun and Li2009; Xiao et al. Reference Xiao, Kröner and Windley2009, Reference Xiao, Huang, Han, Sun and Li2010a, b).
Acknowledgements
This paper is part of the first author's Ph.D. thesis supervised by WJX. We thank Jiliang Li, Shoufa Lin, Yong Yong, Ji'en Zhang, Nathan Cleven and Dongfang Song for collaboration in the field. Guochao Zuo and Xueyi Xu are acknowledged for discussions on the tectonics of the Beishan. We appreciate the constructive comments of Sanzhong Li, an anonymous referee and the editor, Phil Leat. This study was financially supported by funds from the Chinese State 973 Project (2007CB411307), the Innovative Program of the Chinese Academy of Sciences (KZCX2-YW-Q04-08), Chinese State 305 Projects (2011BAB06B04-1, 2011BAB06B04-3) and the NSFC Projects (40725009, 40523003, 40973036). This paper is a contribution to the International Lithosphere Programs (ERAS and Topo-Central-Asia).
Appendix 1. Analytical methods
All chemical analyses were carried out in the Institute of Geology and Geophysics (IGG), Chinese Academy of Sciences, Beijing. The analytical procedures are described in detail below.
Geochemistry
The rocks were crushed into small pieces and cleaned with deionized water in an ultrasonic vessel for 15 minutes after removal of thin weathered surfaces, amygdales and veins. The dried rock chips were powdered in an agate mill to about 200 mesh for major, trace element and isotopic analyses. Major oxides were determined by X-ray fluorescence spectrometry (XRF) with analytical errors less than 5%. Loss on ignition (LOI) was determined after igniting sample powders at 1000°C for 1 hour. Trace elements, including rare earth elements (REEs), were analysed with an ICP-MS Element II. Whole-rock powders (40 mg) were dissolved in screw-top Teflon beakers using a HF + HNO3 mixture for five days at 200°C, then dried and digested with HNO3 at 150°C twice a day. Finally the dissolved samples were diluted to 50 ml with 1% HNO3 before analysis. An internal standard solution containing the single element indium was used to monitor drift in mass response during counting. The precision was generally 2–5%.
Rb–Sr and Sm–Nd isotopic ratios were measured by a Finnigan MAT262 thermal ionization mass spectrometer (TIMS). The measurements were carried out following the isotope dilution procedures of Zhou et al. (Reference Zhou, Sun, Zhang and Chen2002) and Chen, Hagner & Todt (Reference Chen, Hagner and Todt2000). A static multi-collection mode was used during the measurements. A traditional cation exchange technique was adopted for the chemical separation. Mass fractionation corrections for Sr and Nd isotopic ratios were based on 86Sr/88Sr = 0.1194 and 146Nd/144Nd = 0.7219. Repeated measurements of La Jolla Nd standard and NBS987 during the measurement period gave 143Nd/144Nd = 0.511861 ± 9 (2σ) and 87Sr/86Sr = 0.710254 ± 10 (2σ), respectively. Total procedural blanks for Sr and Nd were ~10−9 and ~10−11 g, respectively.
U–Pb zircon geochronology
Zircons crystals were separated by heavy liquid and magnetic techniques from 5–6 kg hornblende gabbro samples, and then hand-picked in alcohol under a binocular microscope and mounted on epoxy resin. The zircon mount was polished with a diamond compound to reveal the zircon midpoints. To identify the internal features of the zircons (zoning, structures, alteration, fractures), cathodoluminescent images were obtained with a Cameca electron microprobe. The analytical voltage and current for the CL was 50 kV and 15 nA, respectively. The zircon isotope analyses were undertaken with a Neptune MC-ICP-MS, which has a double focusing multi-collector ICP-MS and has the capability for high mass resolution measurements in multiple collector modes. The GeoLas 200M laser ablation system (MicroLas, Göttingen, Germany) was used for laser ablation using an ArF excimer 193 nm laser ablation system and a homogenizing, imaging optical system. The isotope measurements were carried out following the procedures of Xu et al. (Reference Xu, Wu, Xie and Yang2004), Wu et al. (Reference Wu, Yang, Xie, Yang and Xu2006) and Yuan et al. (Reference Yuan, Wu, Gao, Liu, Ma and Wang2003). Samples were analysed with the ablation of a single 40 μm spot with a laser repetition rate of 10 Hz, and the data were acquired in a peak-jumping-pulse counting mode with one-point measured per peak. Zircon 91500 was used as the external calibration standard, and we measured this zircon after finishing analyses of every four or five spots in order to keep the instrument in comparable conditions when measuring the standards. 207Pb/206Pb and 206Pb/238U ratios were calculated using GLITTER 4.0, which was then corrected using Harvard zircon 91500 as an external standard. The concordia ages and diagrams were calculated using Isoplot (ver. 2.0).


