


1. Introduction
Intraplate stresses play a significant role in the subsidence, architecture, stratigraphy and deformation of intraplate basins. However, these intraplate stresses are significantly controlled by changes in plate tectonic regimes and associated stress fields (Cloetingh & Kooi, Reference Cloetingh and Kooi1992; Tranos & Osman, Reference Tranos and Osman2021). Understanding the actual configuration of such a basin system and the role of plate tectonics requires a thorough comprehension of its past development. However, unravelling the intraplate stresses and interrelating them with the deformation along the plate boundaries is not an easy task when the intraplate system of sedimentary basins is huge and is characterized by a high complexity like the Shanxi rift in central North China (Fig. 1).
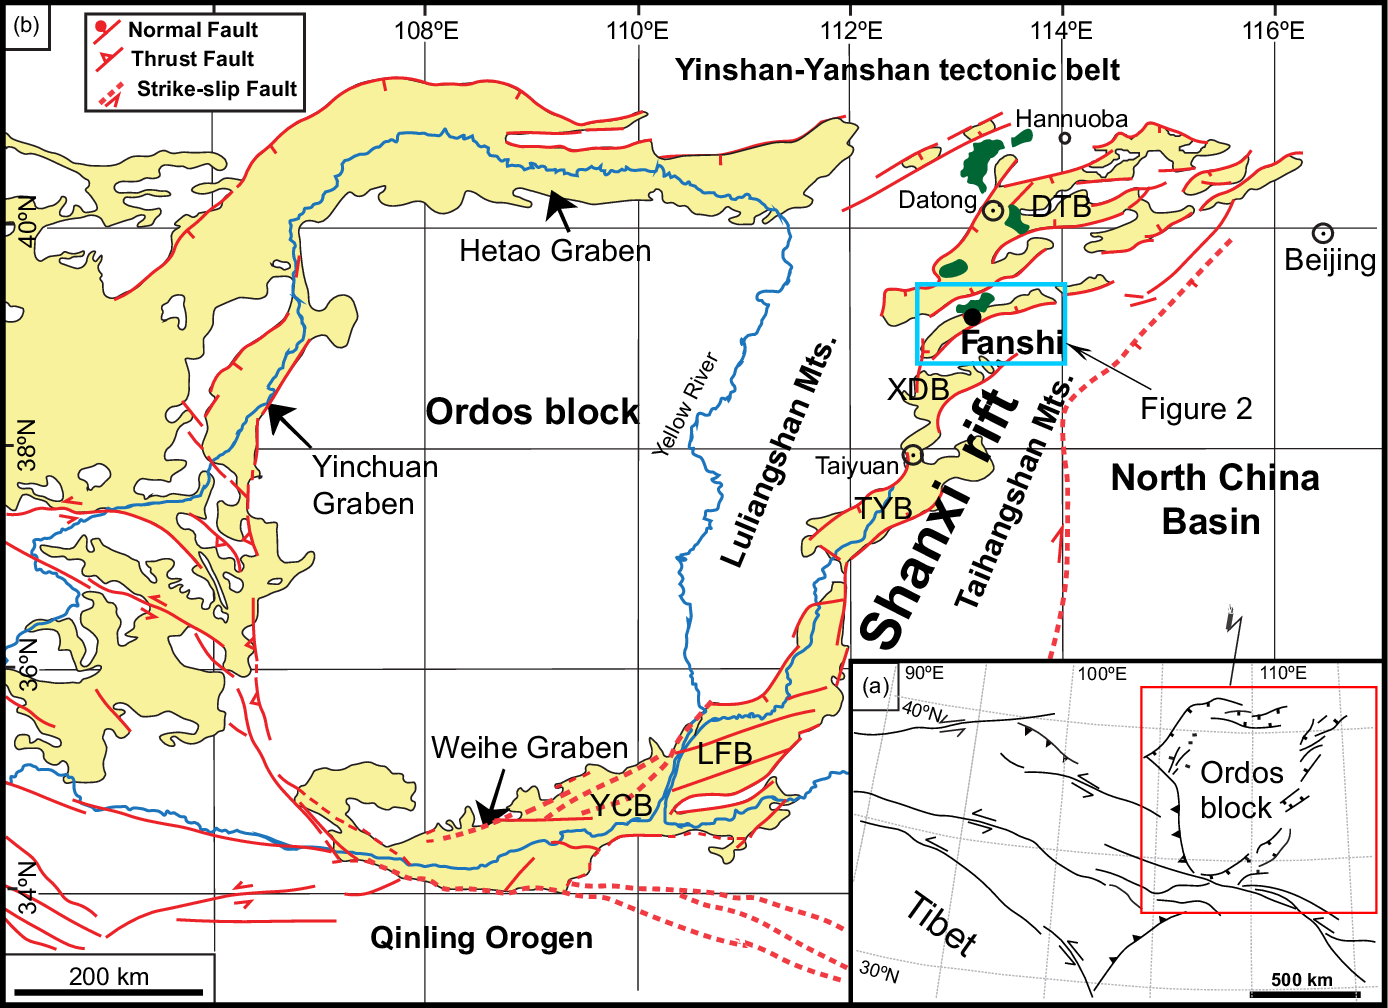
Fig. 1. (a) Simplified inset map of Asia showing the major tectonic background. (b) Location map of the Fanshi Basin (FB) (blue square), showing the distribution of the major active faults around the Ordos block; green colour indicates the exposure of the Cenozoic basalts of the northern Shanxi rift. DTB – Datong Basin; XDB – Xin-Ding Basin; TYB – Taiyuan Basin; LFB – Linfeng Basin; YCB – Yuncheng Basin.
The NNE–SSW-trending Shanxi rift is a late Cenozoic S-shaped depocentre system of complicated geometry between the Taihangshan Mountains to the east and the Lüliangshan Mountains to the west (Fig. 1). Separating the Ordos block from the North China Basin, it represents a huge intraplate tectonic structure that dominates central North China between the E–W-trending Yinshan–Yanshan tectonic belt to the north and the E–W-trending Qinling orogenic belt to the south (Fig. 1).
Numerous works have been conducted on the Shanxi rift, including the active extension rate of major faults (Jiang et al. Reference Jiang, Xie, Wang and Feng2003; Middleton et al. Reference Middleton, Elliott, Rhodes, Sherlock, Walker, Wang, Yu and Zhou2017), focal mechanisms (Li, B. et al. Reference Li, Atakan, Sørensen and Havskov2015) and contemporary crustal deformation from GPS measurements (Qu et al. Reference Qu, Lu, Zhang, Li, Peng, Wang and Zhang2014; Zhao et al. Reference Zhao, Huang, Zhang, Wang, Tan and Du2015; Wang & Shen, Reference Wang and Shen2020). Nonetheless, despite all this effort to understand how faulting and associated palaeostresses deformed this area and adjacent regions (Molnar & Tapponnier, Reference Molnar and Tapponnier1975; Wan, Reference Wan2010; Mercier et al. Reference Mercier, Vergely, Zhang, Hou, Bellier and Wang2013), the suggested stress regimes, especially in the northern Shanxi rift (Fig. 1), differ significantly in age, type and orientation, giving rise to different deformation models during Cenozoic time.
These models concerning the Cenozoic deformation and the driving forces in this part of the interior of the Eurasian continent have been attributed to the Indo-Asian collision and the Tibetan growth towards the N to NE (e.g. Molnar & Tapponnier, Reference Molnar and Tapponnier1975; Wang et al. Reference Wang, Dong, Zhang, Wang and Guo1984; Jolivet et al. Reference Jolivet, Davy and Cobbold1990; Avouac & Tapponnier, Reference Avouac and Tapponnier1993; Tapponnier et al. Reference Tapponnier, Xu, Francoise, Meyerm, Nicolas, Gerard and Yang2001; Liu et al. Reference Liu, Pan, Xie, Zhang and Li2004; Yin, Reference Yin2010; Xu et al. Reference Xu, Yang, Liu, Shi and Wei2013, Reference Xu, Ben-Avraham, Kelty and Yu2014; Zhao, W. et al. Reference Zhao, Hou and Hari2016; Zhao, X. C. et al. Reference Zhao, Liu, Zhao, Deng and Zhang2016), the Pacific–Asian convergence (Cui, Reference Cui, Xiao and Liu1997; Schellart & Lister, Reference Schellart and Lister2005) and the different convergence rates, or to a combined effect of the Indo-Asian collision and the Pacific–Eurasia convergence (e.g. Ren et al. Reference Ren, Tamaki, Li and Zhang2002; Li et al. Reference Li, Suo, Dai, Liu, Chong and Xin2010; Li, B. et al. Reference Li, Atakan, Sørensen and Havskov2015; Li, J. X. et al. Reference Li, Liu, Yue and Wang2015; Shi et al. Reference Shi, Dong, Liu, Hu, Chen and Chen2015 b; Liu et al. Reference Liu, Hu, Shi, Chen and Yan2020).
The narrow, ENE–WSW-trending Fanshi Basin lies along the Shanxi rift in the part where the latter starts to bend northward to the right striking NE–SW (Fig. 1). This feature makes the study of this basin crucial for defining the tectonic processes through which the northern Shanxi developed in the Cenozoic period. Nonetheless, it has not been studied as thoroughly as the other basins, possibly owing to its smaller size. Our effort is to unravel the formation and deformation of the Fanshi Basin based on a detailed palaeostress analysis, since understanding the tectonic processes, especially those on a regional scale, needs not only knowledge of the geometry and kinematics of the activated faults but also knowledge of the crustal driving stresses (Tranos, Reference Tranos2017). Moreover, knowledge of the palaeo- and active stress states in northern Shanxi is of significant concern because more than 35 million people live in proximal cities such as Beijing, Datong, Shijiazhuang and Taiyuan. For this reason, we studied the fault pattern of the faulted basin and accomplished a detailed fault-slip analysis and a stress inversion approach with the widely accepted and used Win-Tensor software (Delvaux, Reference Delvaux2011).
2. Geological setting
2.a. General framework
The Shanxi rift, with a length of more than 1200 km and a width that varies from 40 to 120 km, can be divided into three broad zones. Two are wide, NE–SW-trending extensional zones (in the north and the south) separated by a third, narrow, NNE–SSW-striking right-lateral transtensional zone in the central part (Middleton et al. Reference Middleton, Elliott, Rhodes, Sherlock, Walker, Wang, Yu and Zhou2017) (Fig. 1). The Shanxi rift consists of a series of en échelon basins, which are fault-bounded and, in their majority, half-grabens associated with intense seismicity (Xu & Deng, Reference Xu and Deng1996; Li et al. Reference Li, Yang, Xia and Mo1998). In particular, five large basins exist from north to south (i.e. the Datong Basin, Xin-Ding Basin, Taiyuan Basin, Linfeng Basin and Yuncheng Basin), with the Fanshi Basin lying between the Datong and Xin-Ding basins (Fig. 1). These basins are filled on average by 2800–3800 m thick Cenozoic sediments (GSBSX, 2002). The oldest syn-rift sediments in the grabens consist of Hipparion red clays, the Baode Formation, whose age was determined by Mammalia fossils to be latest Miocene or earliest Pliocene (Zhang et al. Reference Zhang, Ma, Yang, Shi and Dong2003). The Cenozoic sediments have been divided into five units: (1) The upper Miocene – Pliocene Kouzhai Formation, which is characterized by the deposition of grey-brown silty mudstone, interbedded marl and siltstone, pebbly mudstone, brownish-red mudstone, sandstone and conglomerate; (2) the Pliocene Nanyulin Formation, which consists of lacustrine interbedded coarse sandstone and green-grey mudstone, fine- and medium-grained sandstone, marl and siltstone; (3) the lower–middle Pleistocene Nihewan Formation, which is characterized by the occurrence of cross-stratified and horizontally bedded fluvio-lacustrine, grey-yellow sandstone and grey-green siltstone (Min et al. Reference Min, Zhang, Wang, Zheng and Zhu2006); (4) the upper Pleistocene Malan Formation, which is marked by the occurrence of aeolian and massive yellow sandy clay broadly distributed on hills; and (5) the Holocene sandy clay mainly deposited along river banks (GSBSX, 2002).
The sedimentary fill and the present crustal structure of the northern part of the Shanxi rift are well constrained by seismic, geophysical and geological data (Xu et al. Reference Xu, Ma and Deng1993; Zhang et al. Reference Zhang, Ma, Yang, Shi and Dong2003; Middleton et al. Reference Middleton, Elliott, Rhodes, Sherlock, Walker, Wang, Yu and Zhou2017; Shi et al. Reference Shi, Dong and Hu2020). The data showed that the Moho beneath the Shanxi rift is uplifted by 5–10 km along boundary faults, indicating a thinned lithosphere (Wang et al. Reference Wang, Huang, Mi, Xu, Wang, Li, Yu, Huang and Mao2014). Cenozoic basalts exposed in the northern Shanxi rift (Fig. 1) might reflect similar uplift of the Moho (Chen et al. Reference Chen, Li, Dai and Liu1992).
Pre-existing, NE–SW-striking, fold-and-thrust belt structures induced by the Late Triassic (235 to 200 Ma) Indosinian and the Middle Jurassic – Cretaceous (150 to 65 Ma) Yanshanian orogenies partly determine the location and geometry of the basins forming the Shanxi rift (Xu et al. Reference Xu, Ma and Deng1993; Zhang et al. Reference Zhang, Mercier and Vergely1998). The length and width of the grabens gradually decrease from south to north (Tapponnier & Molnar, Reference Tapponnier and Molnar1977). In contrast, graben floor elevations increase northward from 380 to 1010 m (Li et al. Reference Li, Guo, Chen, Yang and Huang2018) and are associated with low Bouguer gravity anomalies, which rise from east (−80 mGal) to west (−130 mGal) as shown by geophysical data (Xu & Ma, Reference Xu and Ma1992). The underlying crust is 32–39 km thick, thinner than the underlying crust of the surrounding mountains (Tang et al. Reference Tang, Feng, Chen, Zhou, Ning, Wei, Li, Yu, Fan and Wang2010), and the Moho depth laterally varies from 36 to 45 km beneath the axial zone (Shi et al. Reference Shi, Gao and Jing2014).
However, as defined from studies conducted in the basins mentioned above, the suggested stress regimes, especially in the northern Shanxi rift (Fig. 1), differ significantly in age, type and orientation. For example, Zhang et al. (Reference Zhang, Ma, Yang, Shi and Dong2003) suggested three successive extensional phases for North China. The oldest is an NW–SE extensional phase that occurred concomitantly with the early Tertiary rifting phase. It was initiated in a back-arc setting associated with the westward subduction of the Pacific plate under the Asian continent. A Miocene NE–SW to NNE–SSW extensional phase followed, though its dynamic origin is poorly understood. Finally, a NW–SE extensional phase since latest Miocene or earliest Pliocene times gave rise to the formation and development of the elongate graben systems around the rigid Ordos block. The latter is consistent with the mean extensional direction derived from individual focal solutions of local earthquake solutions (Zhang et al. Reference Zhang, Mercier and Vergely1998).
On the other hand, Shi et al. (Reference Shi, Cen, Chen, Wang, Chen, Li and Chen2015 a) defined a transtensional stress regime of NW–SE extension and NE–SW compression in late Miocene – early Pleistocene times, which was considered responsible for the opening of the Shanxi rift. This stress regime changed to a less intense and short-lived NE–SW extension in early late Pleistocene time. From late Pleistocene time onwards, a transtensional stress regime characterized by NNW–SSE extension and ENE–WSW compression caused the right-lateral shear deformation in the Shanxi rift. Similar NNW–SSE extension, but not transtension, has been defined in the northernmost Shanxi along the Huailai and Yanqing basins (Pavlides et al. Reference Pavlides, Zouros, Zhongjing, Shaoping, Tranos and Chatzipetros1999). Other studies on fault kinematic analysis in adjacent areas reported a transpressional deformation as the youngest regional tectonic regime (Shi et al. Reference Shi, Chen, Chen, Cen and Zhang2019; Assie et al. Reference Assie, Wang, Ma, Kouamelan, Branston, N’dri and Mondah2020).
2.b. Geology of the Fanshi Basin
The Fanshi Basin represents an ENE–WSW-trending half-graben of c. 20 km width formed between the Hengshan and Wutaishan mountains (Fig. 1). It lies between the Datong Basin in the north, i.e. the largest basin of the Shanxi rift, and the Taiyuan Basin exposed in the central Shanxi rift. It is linked to the similarly trending Xin-Ding Basin to the south through a narrow N–S-trending basin-corridor forming a curved geometry. The Fanshi Basin separates the mountainous terrain into two parts, characterized by differences in elevation and physiographic features (Fig. 2a). The terrain in the SE is most prominent with peaks no higher than 3058 m and consists of basement rocks. It is bordered to the north by the ENE–WSW-striking Fanshi or Wutai(shan) fault (Fig. 2a, b). The hydrographic network is mature, including kilometre-long streams draining the terrain towards the south and forming steep, elongated valleys.

Fig. 2. (a) Landsat imagery of the Fanshi Basin with the photolineaments showing the fault pattern of the region (USGS, EarthExplorer, https://earthexplorer.usgs.gov/), (b) Simplified geological-structural map of the study area based on the interpretation of the Landsat imagery, regional geological maps at scale 1:200 000 of the Shanxi Province and field observations. The location and number of the field stations are also shown. The lower right panel represents the geological cross-section of the study area along the transect A–B. FB – Fanshi Basin; DTB – Datong Basin.
On the other hand, the mountainous terrain in the NW forms a narrow strip trending NE–SW as it is limited to the north by the NW-dipping Hengshan normal fault (Fig. 2a, b), the fault that bounds the Datong Basin to the SE (Fig. 2a, b). The elevation of the terrain is no more than 2017 m, i.e. c. 1 km lower than the Wutaishan mountainous terrain. The hydrographic network includes smaller streams (Fig. 2a) than the streams in the Wutaishan Mountains. On the SE flank of the mountainous terrain, i.e. towards the Fanshi Basin, Miocene–Pliocene sediments cover the basement rocks and the basaltic rocks unconformably (Fig. 2b).
The basement rocks of the mountainous terrain are Neoarchaean to Palaeoproterozoic high-grade metamorphic rocks (i.e. gneisses, amphibolites) overlain in places by low-grade metamorphic rocks (i.e. quartz schist interbedded with siltstones, mudstones and mafic volcanic rocks) (Liu et al. Reference Liu, Pan, Xie, Zhang and Li2004; Zhang et al. Reference Zhang, Zhao, Li, Sun and Liu2012; Wan et al. Reference Wan, Dong, Liu, Kröner, Yang, Wang, Du, Xie and Ma2012; Zhao & Zhai, Reference Zhao and Zhai2013). The former rocks consist of a volcano-sedimentary sequence associated with granites and greenstones. This terrain was intruded by NW–SE-striking mafic dykes, and was affected by numerous E–W left-lateral and WSW–ENE right-lateral strike-slip shear zones that indicate intense ductile deformation (Zhao et al. Reference Zhao, Hu, Gong, Ren, Yang and Yang2019).
The Cenozoic stratigraphic evolution includes three main stages. The first corresponds to a lacustrine environment established in the Neogene period, characterized by lacustrine sediments, mud and silt; the second occurred in early Pleistocene time and is characterized by cross-bedded sands and braided fluvial and deltaic deposits; and the final sequence occurred in middle Pleistocene time and is marked by alluvial fans, coarse-grained sands and pebbles (Chen et al. Reference Chen, Chi, Dong, Yan, Yang, Shi and Yao2015). The Pleistocene sediments are the most widely distributed within the basin, while the Holocene deposits occupy the basin axis, which is closer to the SE boundary of the basin. In contrast, the Neogene sediments are mainly exposed in the northern part of the basin. The Fanshi Basin has been the site of several strong earthquakes. The most recent recorded earthquake along the fault was the Daixian Earthquake of a magnitude of 7.5 in ad 512 (Xu et al. Reference Xu, Ma and Deng1993). Two palaeoseismic swarms with M = 7.0 and M = 7.1 have been recorded along the northern flank of the Wutaishan Mountains (Hinrichs et al. Reference Hinrichs, Ding, Corley, Cochran, Zhang and Gomez2012).
An interesting feature of the Fanshi Basin is the Oligocene – early Miocene basaltic rocks (e.g. Liu et al. Reference Liu, Chen, Sun, Li and Liu1992) which intrude and overlie the basement rocks on the mountainous northern flank of the basin (Fig. 2). Cenozoic basalts occur in the northern segment of the Shanxi rift in three eruptive episodes giving rise to the Datong, Fanshi and Hannuoba basalts (named after the cities close to their exposures) (Fig. 1). They have played a significant role in understanding the timing of the tectonic events in central North China. The Fanshi basalts (Fig. 2) are dominantly alkaline ranging from basanites to trachybasalts. They consist of thick-bedded lava flows, dolerite and iddingsite, are associated with xenoliths of peridotite (Xu et al. Reference Xu, Chung, Ma and Shi2004) and are unconformably overlain by Neogene and Quaternary sediments. K–Ar dating indicates ages of these basalts ranging from 35 to 25 Ma (Liu et al. Reference Liu, Chen, Sun, Li and Liu1992) or 24–26 Ma for asthenosphere-derived basalts exposed in the southern Hengshan (Tang et al. Reference Tang, Zhang and Ying2006).
3. Structural analysis of the Fanshi Basin
3.a. Fault pattern and fault-slip data
Our investigation was based on the use and interpretation of Landsat imagery in association with the existing geological map (SBGMR, 1989) in order to define the main fault pattern and the large-scale fault zones of the Fanshi Basin and thus to properly collect the fault-slip data for the stress inversion method and palaeostress analysis. In particular, we used widely accepted morphotectonic features to interpret satellite lineaments as faults or fault zones, such as the fault linearity, abrupt fault scarps, triangular facets, the change of physiographic features, etc.
Two main faults dominate the fault pattern of the area, which prompt the half-graben geometry of the basin (Fig. 2). The first dipping to the NW is the Hengshan fault on the NW flank of the Hengshan Mountains and is the boundary fault of the Datong Basin in its eastern part. The second also dipping to the NW is the Fanshi (or Wutai) fault bounding the Fanshi Basin with the Wutaishan Mountains. The Fanshi fault consists of two main fault segments, which form a right-stepping geometry: the Xingaoxiang fault in the SW and the Dongshanxiang fault in the NE (cities shown in Fig. 2 are used for their names). In particular, the Xingaoxiang fault is rather rectilinear, juxtaposing Pleistocene alluvial fans against the mountain front, and in some subsegments towards the NE, the triangular facets are clearly visible and can be easily traced (Fig. 2). In contrast, the Dongshanxiang fault is less rectilinear and consists of smaller discontinuous subsegments that juxtapose the Pleistocene alluvial fans and the Holocene deposits against the mountain front (Fig. 2). The triangular facets (Fig. 3a) and scarps (Fig. 3b) are more prominent in this segment than the former, implying that the contemporary stress regime activates the Dongshanxiang fault segment more than the Xingaoxiang fault segment.

Fig. 3. Field photographs showing the general features of the faults exposed in the Fanshi Basin. (a) Triangular facets along the Dongshanxiang piedmont fault. (b) Fault scarp along the piedmont. (c) Fault affecting alluvial gravels and the underlying loess layer. (d) Synthetic normal faults affecting upper Pleistocene yellow sands. (e) Steep normal fault in the Holocene sands and gravels. (f) NE–SW-striking fault. (g) E–W-striking fault. (h) High-angle normal fault.
In contrast, the NW flank of the Fanshi Basin is not characterized by faults similar in length to those described on the SE flank of the basin (Figs 2, 3c–h). The elevation gradually decreases, and Neogene sediments juxtapose and cover the basement rocks and the Fanshi basalts unconformably. A few ENE–WSW- to E–W-striking faults have been mapped in the SE flank of the Hengshan mountainous terrain, but these faults do not form a large kilometre-long boundary fault like the aforementioned Fanshi fault. They trend subparallel to the faulted basin indicating substantial similarity with those mapped on the geological map (SBGMR, 1989). In the northernmost part of the basin, close to sites 23 and 28, some E–W faults juxtaposing the Quaternary sediments against the basement rocks affect the basement and Neogene sediments. Also, east of the Fanshi and SE of Huajitai city, a series of short, discontinuous ENE–WSW-trending faults, traced to affect Quaternary sediments (Fig. 2), form an antithetic fault zone in comparison to the NNW-dipping Fanshi fault. Moreover, some NNE–SSW-striking faults in the central part of the basin, possibly acting as linkage structures between the previously mentioned antithetic normal faults, have been traced to affect the Quaternary sediments. Finally, some ENE–WSW- and NW–SE-striking faults mapped at the northeastern edge of the basin juxtapose Pleistocene sediments against the basement.
We recorded faults and slickenlines, i.e. fault-slip data, at field stations essentially exposed along roads, valleys and abandoned quarries following, in general, the field measurement approach described in Sperner & Zweigel (Reference Sperner and Zweigel2010). Also, we used the mean representative fault plane and lineation if we measured the same fault plane more than once so as to not bias the assumption that the fault-slip data should be independent of each other (Tranos, Reference Tranos2009). In total, 381 mesoscale faults have been measured from stations within and around the Fanshi Basin (Fig. 2; online Supplementary Material Table S1).
Considering the Mohr–Coulomb fracture criterion and that experimentally obtained values for the internal friction ϕ of rocks range between 17° and 40° (e.g. Hubbert, Reference Hubbert1951; Byerlee, Reference Byerlee1968; Jaeger & Cook, Reference Jaeger and Cook1979 and references therein), a value of 30° for the angle (θ) between the greatest principal stress axis (σ1) and the fault plane is a reasonable approximation (Turner, Reference Turner1953; Sperner et al. Reference Sperner, Ratschbacher and Ott1993). For such an angle, as shown by the dip-slip, oblique-slip and strike-slip faults in Figure 4a, b, c, respectively, almost more than 82 % of the recorded faults define σ1 and σ3 principal stress axes in horizontal and vertical positions, respectively, thus suggesting Andersonian states of stress. In addition, two σ3 principal stress axes trending NW–SE and NE–SW were defined by the dip-slip and oblique-slip faults (Fig. 4a, b), whereas the strike-slip faults define σ1 and σ3 principal stress axes trending mostly NE–SW and NNW–SSE, respectively (Fig. 4c).

Fig. 4. Stereograms (equal-area projection, lower hemisphere) of the σ1 and σ3 axes of the recorded faults with slickenlines assuming an internal friction angle of 30°: (a) faults with slickenlines having pt ≤ 30°; (b) faults with slickenlines having 30° < pt < 60°; (c) faults with slickenlines having pt ≥ 60°. Red rhombs show σ1 axes; blue open squares show σ3 axes; the ‘N’ value indicates the number of faults.
It is worth mentioning that two generations of slickenlines, e.g. oblique and dip-slip slickenlines, were observed on fault planes along the Dongshanxiang fault at field station 8 (Fig. 5a, b). Slickenlines with different plunge angles related to different fault kinematics have also been observed mainly in the northern part of the Fanshi Basin, i.e. north of the cities of Daixian, Zaolin and Huajitai, and easterly (Fig. 5c–f) mainly on faults affecting the Neogene and lower Pleistocene sediments, but not the upper Pleistocene ones.
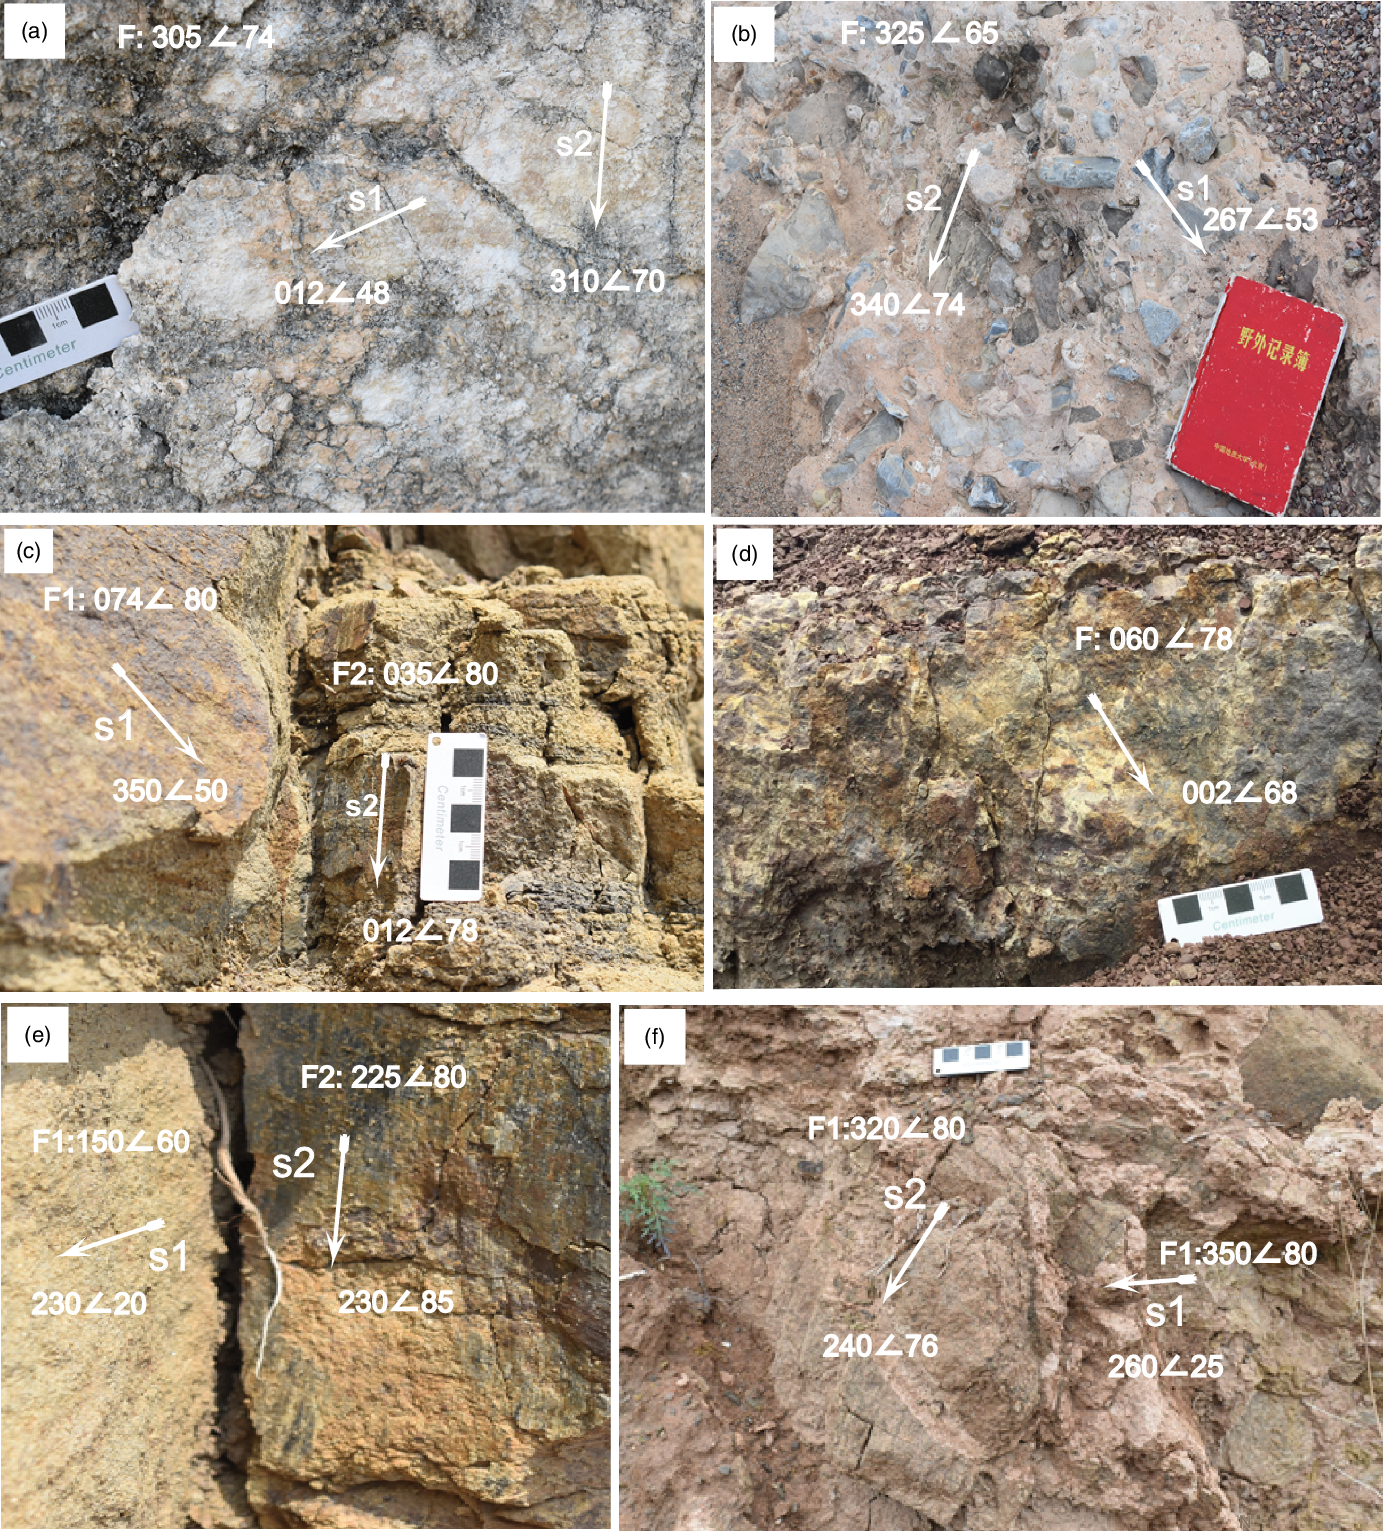
Fig. 5. Field photographs showing the multiphase faulting deformation of the Fanshi Basin. (a, b) Fault planes containing two slickenlines (s1) and (s2), or (c–f) fault planes exposed in the same areas and containing slickenlines of different kinematics.
3.b. Stress inversion of fault-slip data
Many studies have used stress inversion techniques to decipher the stress regimes in deformed regions worldwide for more than 40 years (Simón, Reference Simón2019). They use fault-slip data, i.e. the fault plane and the slip vectors defined by the observed slickenlines (or striations) and microstructures used as reliable kinematic indicators. Although stress inversion techniques use different algorithms, they aim at unravelling the driving stresses responsible for tectonic deformation and are expected to provide similar results (Lacombe, Reference Lacombe2012). They rely on a key assumption that any fault has a slip preference under a driving stress tensor (Tranos, Reference Tranos2012), which coincides with the maximum resolved shear stress (Bott, Reference Bott1959). In particular, collected fault-slip data are inverted to determine four parameters of the reduced stress tensor, which are the orientations of three mutually orthogonal principal stress axes σ1, σ2 and σ3 with σ1 ≥ σ2 ≥ σ3 and the shape of the stress ellipsoid or stress ratio R = (σ2 − σ3)/(σ1 − σ3), with 1 ≥ R ≥ 0 (Etchecopar et al. Reference Etchecopar, Vasseur and Daignieres1981).
Theoretically, at least four differently oriented fault-slip data points are necessary for determining a stress tensor with a best-fit stress inversion method (Tranos, Reference Tranos2009 and references therein). The only criterion is that the Misfit Angle (MA) (i.e. the angular difference between the observed slickenline and the resolved shear stress) is to be the smallest possible. However, the significance or credibility of the obtained stress tensor solution is under debate in many cases because of the small number of fault-slip data points (Tranos, Reference Tranos2017, Reference Tranos2018 a,b; Simón, Reference Simón2019). Orife & Lisle (Reference Orife and Lisle2006) established a method to discriminate between significant and non-significant stress tensors. They considered both the absolute number of fault-slip data points that define the stress tensor solution and the Mean Misfit Angle (MMA), and it is based on likening with artificial tensor solutions inverted from random datasets.
The collected fault-slip data are inverted with the aid of the Win-Tensor software (Delvaux, Reference Delvaux2011) and by using the procedure described in Delvaux & Sperner (Reference Delvaux, Sperner and Nieuwland2003). In brief, the four parameters of the stress tensor are first estimated with an improved version of the Right Dihedra method based on Angelier & Mechler (Reference Angelier and Mechler1977). They are more precisely determined with an iterative rotational stress optimization, which minimizes the slip deviation between the observed slip line and the resolved shear stress and favours slip on the fault planes (Delvaux & Sperner, Reference Delvaux, Sperner and Nieuwland2003). The iterative rotational approach separates data based mainly on the MA, which in most, if not all, of the studies up until now is considered smaller than 20° or 30° (Sperner et al. Reference Sperner, Ratschbacher and Ott1993; Nemcok et al. Reference Nemcok, Kovac and Lisle1999; Tranos, Reference Tranos2015).
However, the Right Dihedra cannot guarantee the homogeneity of the fault-slip data (Carey-Gailhardis et al. Reference Carey-Gailhardis, Vergely, Stäuble and Pfiffner1992), and the MA minimization criterion could not separate correctly heterogeneous fault-slip data (Nemcok & Lisle, Reference Nemcok and Lisle1995; Tranos, Reference Tranos2017, Reference Tranos2018 a). For these reasons, we consider MA = 20° for the iteration process, excluding all the data with MA > 20° from the input fault-slip dataset. In addition, the resolved stress tensor in the station was considered satisfactory if it could explain no less than 70 % of the input fault-slip data and there was no geological conflict among the fault-slip data. If there are more than four, the excluded fault-slip data are processed again, in the same way, to generate another reduced stress tensor if possible. Furthermore, in order to ensure the robustness of the stress tensor solutions, we applied to the resolved stress tensors the statistical criteria of Orife & Lisle (Reference Orife and Lisle2006) (Fig. 6) for defining the ‘significant’ and excluding the non-significant stress solutions, i.e. the solutions that can be generated by random fault-slip data and which might result from heterogeneous fault-slip data (Tranos, Reference Tranos2017, Reference Tranos2018 a).

Fig. 6. Plot of the calculated stress tensor solutions on the significance diagram of Orife & Lisle (Reference Orife and Lisle2006). Each colour represents solutions with similar stress parameters.
3.c. Resolved stress tensors and their chronology: stress regimes
Using the previously described approach, we defined 23 significant resolved stress tensors at 33 sites in the study (Figs 2, 5; Table 1). Most of them have a σ1 axis in a vertical position or subhorizontal trending NE–SW (Fig. 7a, b) and σ3 axis subhorizontal mainly trending either NW–NNW or NNE–NE (Fig. 7a, c). Therefore, all these stress tensors have one of the stress axes in a vertical position, so the stress tensors agree with the Andersonian stress state (Anderson, Reference Anderson1942), as already shown by the majority of the fault-slip data in Figure 4. In all solutions, any fault-slip datum shows MA ≤ 20°, and the MMA for each tensor solution is smaller than 10°.
Table 1. The resolved stress tensor results of the significant solutions and corresponding deformation events in the study area
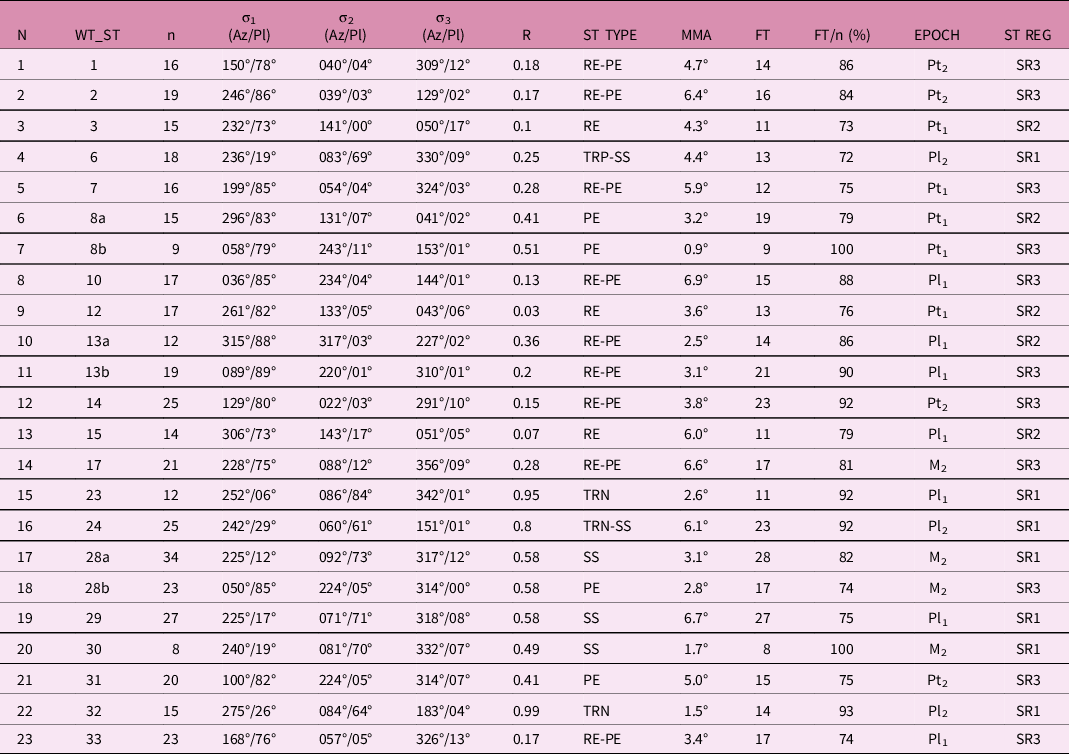
Stress types are according to Tranos et al. (Reference Tranos, Kachev and Mountrakis2008) classification.
N – order number; WT_ST – stress tensor resolved with the aid of the Win-Tensor software (Delvaux, Reference Delvaux2011); n – number of input fault-slip data; σ1, σ2, σ3 – maximum, intermediate and minimum principal stress axes, respectively; R – stress ratio of the resolved stress tensor; ST TYPE – stress type; MMA – Mean Misfit Angle; FT – number of fault-slip data points with Misfit Angle (MA) ≤ 20°; RE-PE – radial-pure extension; PE – pure extension; TRN – transtension; SS – pure strike-slip; TRP – transpression; EPOCH – age of the exposed lithology at a station; Pt1 – early Pleistocene; Pt2 – late Pleistocene; Pl1 – early Pliocene; Pl2 – late Pliocene; M2 – late Miocene; ST REG – stress regime.

Fig. 7. Equal-area, lower hemisphere projections of (a) the attitude of maximum σ1 (black dots) and minimum σ3 (squares) principal stress axes of the significant resolved stress tensors (red squares – σ3 axis of a stress tensor with (sub)horizontal σ1 axis; grey squares – σ3 axis of a stress tensor with (sub)vertical σ1 axis), and (b, c) the densities of σ1 and σ3 axes, respectively. (d, e) Coordinate diagrams showing the azimuth of the maximum and minimum horizontal stress axes σ1 and σ3, respectively, and the stress ratio (R) of the calculated stress tensors. Yellow circles represent solutions with σ2 = Sv (vertical stress) and blue circles with σ1 = Sv (vertical stress).
The relative age of the obtained resolved stress tensors must be determined in order to decipher the main stress regimes responsible for the tectonic evolution of the study area. In general, this target is very difficult, and it is usually based in the field with criteria like the overprinting between superposed slickenlines and cataclasites through which the separation of the different families of movements can be defined (Hancock, Reference Hancock1985; Petit, Reference Petit1987), and the age of the host rocks or sediments. In our case, the field overprinting criteria were insufficient for this purpose. For this reason, another strategy was mainly followed, including: (a) the grouping of the resolved stress tensors depending on the stress type and orientation of the horizontal principal stress axes (see stress types of Tranos et al. Reference Tranos, Kachev and Mountrakis2008), and (b) the age of the rocks or sediments of each station where a resolved stress tensor has been defined.
This approach permits us to group the resolved stress tensors into SR1, SR2 and SR3 groups, as shown in Figures 7 and 8, and Table 1. In particular, seven stress tensors, i.e. 6, 23, 24, 28a, 29, 30 and 32, have (sub)horizontal greatest principal stress axes (σ1) trending mainly NE–SW to ENE–WSW, intermediate principal stress axes (σ2) (sub)vertical and least principal stress axes (σ3) trending mainly NW–SE to NNW–SSE. They define strike-slip stress regimes and have been grouped into the SR1 group (Table 1). As shown in Table 2, the SR1 group affected sediments no younger than Pliocene. Five stress tensors, i.e. 3, 8a, 12, 13a and 15, have the greatest principal stress axes (σ1) in a (sub)vertical position and least principal stress axes (σ3) trending mainly NE–SW. They define extensional stress regimes varying from radial extension (RE) to pure extension (PE), and they have been grouped in the SR2 group (Table 1). They have been calculated from fault-slip data recorded in sediments no younger than early Pleistocene (Tables 1, 2). Eleven stress tensors, i.e. 1, 2, 7, 8b, 10, 13b, 14, 17, 28b, 31 and 33, have the greatest principal stress axes (σ1) in a (sub)vertical position and least principal stress axes (σ3) trending NW–SE and define mainly radial-pure extension (RE-PE) stress regimes. These stress tensors have been grouped into the SR3 group (Table 1) and calculated from fault-slip data recorded in sediments dated as late Pleistocene (Table 2). Moreover, as shown in Table 2, there are stations where two resolved stress tensors belonging to different groups have been calculated, such as stations 8 and 13, where the calculated stress tensors belong to SR2 and SR3, and station 28, where the SR1 and SR3 stress tensors have been defined. Therefore, we can interpret the SR1, SR2 and SR3 groups of stress tensors not as spatial stress perturbations in the area but more likely as temporal stress changes showing the multiple faulting deformation of the area.

Fig. 8. Relationship between orientations of palaeostress axes obtained and the age of geological units in which they are recorded: (a) compressional stress directions (σ1) only from strike-slip tensors; (b) extensional stress directions (σ3).
Table 2. The different Neogene and Quaternary sediments where the SR1, SR2 and SR3 resolved stress tensors shown in Table 1 have been defined

M2 – upper Miocene; Pl1 – lower Pliocene; Pl2 – upper Pliocene; Pt1 – lower Pleistocene; Pt2 – upper Pleistocene. In bold are shown the stress tensors calculated at the same station but that have been grouped into different groups.
The three groups of resolved stress tensors can be described as follows (Tables 1, 2):
(1) SR1 is a strike-slip (SS) stress regime with σ1 and σ3 subhorizontal trending NE–SW and NW–SE, respectively, into which transtensional (TRN) and transpressional (TRP) stress tensors are also included as local differentiations due to changes in the orientations of the input fault-slip data. In this stress regime, which is dated to late Miocene and Pliocene times, we also included the solution at site 32, although its σ1 axis is in a subhorizontal position, because it defines TRN (under which σ1 and σ2 stresses can be mutually interchanged). SR1 is mainly defined at the northern boundary of the study area (Fig. 9). It activated NNE–SSW-striking right-lateral strike-slip faults (Fig. 10a, b) and ENE–WSW- to E–W-striking left-lateral strike-slip and oblique-slip faults (Fig. 10c, d), respectively, implying that the former with the latter can be considered as conjugate faults. Along with them, some NE–SW-striking normal faults have been activated (Fig. 10e), as shown in solution 28a (Fig. 9). However, the faults mainly activated under this stress regime are the NNE–SSW- to NE–SW-striking right-lateral strike-slip faults, which dip with steep angles, as shown from most solutions (Fig. 9).

Fig. 9. Stress inversion results at the stations defining SR1 in the study area. Explanation: Equal-area, lower hemisphere projections showing fault planes, recorded slickenlines (black arrows), σ1, σ2 and σ3 principal stress axes of the resolved stress tensor, slip preferences (purple arrows) defined by the resolved stress tensor, the Misfit Angle (MA) histogram, and the horizontal stress axes SHmax and Shmin with blue and red arrows, respectively. Map abbreviations: DX – Daixian; ZL – Zaolin; DS – Dongshanxiang; FS – Fanshi; HT – Huajitai; XX – Xingaoxiang; WB – Wangzhuangbu; dashed line – boundary of the Neogene and Quaternary deposits with the basement rocks; red circles – measurement stations.
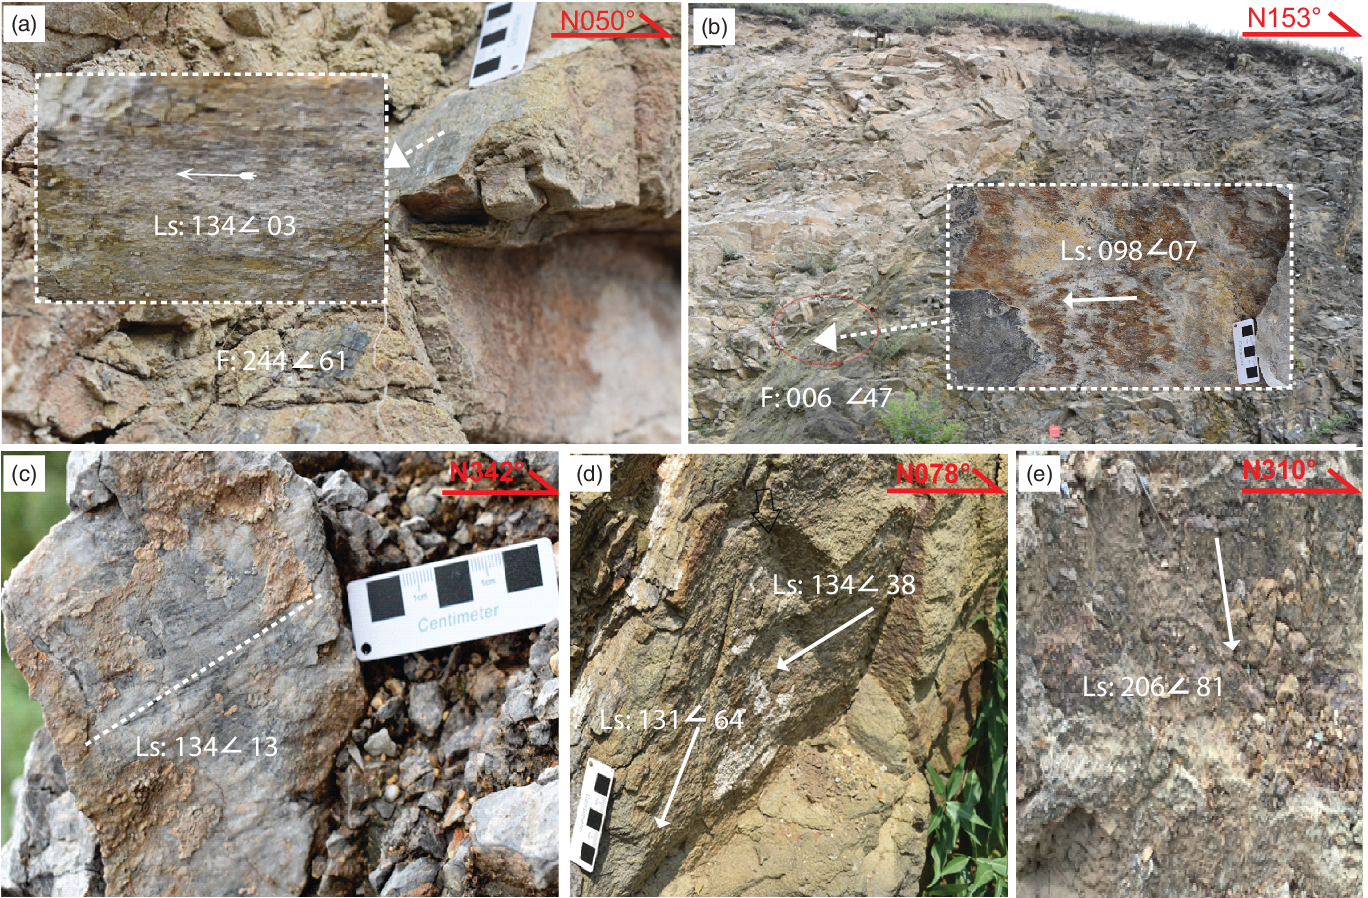
Fig. 10. Structural characteristics of SR1. (a, b) Strike-slip faults with horizontal slickenlines associated with right-lateral strike-slip movements. Inset photos show in detail the slickenlines. (c) Fault with oblique to strike-slip slickenlines associated with left-lateral sense of slip (note: the fault plane dip opposite to the viewer). (d) Slickenlines on a fault plane associated with left-lateral oblique to oblique normal displacements. (e) NW–SE-striking dip-slip fault plane.
(2) SR2 is a NE–SW extensional stress regime dated to early Pleistocene time. The stress tensor 17, being close to the other SR2 solutions, was incorporated in SR2 (Fig. 11), though the trend of its σ3 axis deviates almost equally from the σ3-trend defined by the solutions included either in SR2 or SR3. SR2 is defined mainly by fault-slip data recorded at the southern boundary of the Fanshi Basin along the Dongshanxiang segment, where the latter dies out, and the NW–SE-striking faults are more pronounced (Fig. 11). The latter faults under the SR2 were mainly activated as normal faults or left-lateral oblique normal faults.
(3) SR3 is a NW–SE to NNW–SSE radial to pure (RE-PE) extensional stress regime dated to late Pleistocene – Holocene times and has been defined mainly by fault-slip data recorded along the southern boundary of the Fanshi Basin (Fig. 11). This stress regime mainly activated the NE–SW- to E–W-striking faults as normal faults (Figs 3, 11) and, likewise, the similarly trending Fanshi (or Wutai) fault. It also seems that the SR3 drives the re-activation of some of the NNE–SSW-striking fault planes, which previously were activated as right-lateral strike-slip faults under the SR1, as normal faults as shown by the recent seismic activity and the analysis of focal mechanisms (Li et al. Reference Li, Atakan, Sørensen and Havskov2015) in the Shanxi rift.

Fig. 11. Stress inversion results at the stations defining SR2 (blue symbols) and SR3 (red symbols) in the study area. Red symbols with blue outline represent stations with two obtained solutions. Explanation as in Figure 9.
Solutions from sites 3, 12, 17, 30 and 33 show clustered orientations of both fault planes and slickenlines. Although this might reflect the redundancy of data that affects the reliability of the solution, the latter are considered valid because they are significant and similar to other solutions.
4. Structural interpretation and geodynamic implications
Our analysis in the area of the Fanshi Basin revealed three stress regimes related to the development of the northern segment of the Shanxi rift and the associated basins at least since Miocene time with three distinct stress regimes SR1, SR2 and SR3 (Fig. 12). The oldest SR1 is a strike-slip (SS) stress regime with σ1 and σ3 subhorizontal trending NE–SW and NW–SE, respectively, affecting the area before Pleistocene time. On the other hand, the youngest SR3 has caused an extensive NW–NNW extension to the area since late Pleistocene time, and it is still active, giving rise to strong earthquakes (Li et al. Reference Li, Atakan, Sørensen and Havskov2015). Such an extension has been defined to dominate the present-day deformation along the northern Shanxi (e.g. Li et al. Reference Li, Atakan, Sørensen and Havskov2015; Middleton et al. Reference Middleton, Elliott, Rhodes, Sherlock, Walker, Wang, Yu and Zhou2017) as far to the NE as the Yanqing–Huailai basins (Fig. 1; Pavlides et al. Reference Pavlides, Zouros, Zhongjing, Shaoping, Tranos and Chatzipetros1999). This event is consistent with the late Pliocene – Quaternary extension reported in the Qinling fault zone, where it postdated a NE–SW extension and is active until the present-day (Mercier et al. Reference Mercier, Vergely, Zhang, Hou, Bellier and Wang2013). Palaeomagnetic geochronology of the Fan-Wei Graben found NW–SE crustal extension within central North China since c. 2.6 Ma (Sun & Xu, Reference Sun and Xu2007). In contrast, similar stress regimes to the SR3 have been reported to affect the area in much older periods since Tertiary time along the Weihe graben (Zhang et al. Reference Zhang, Liao, Shi and Hu2006).

Fig. 12. Cenozoic deformation evolution of the northern Shanxi rift showing the deformation events associated with the (a) SR1, (b) SR2 and (c) SR3 stress regimes. SR1 is related to the growth of the Tibetan Plateau towards the N–NE (Xue & Yan, Reference Xue and Yan1984; Shi et al. Reference Shi, Dong, Liu, Hu, Chen and Chen2015 b) and the counterclockwise rotation of the Taihangshan mountain belt (THS) in respect to the Ordos block (Zhao et al. Reference Zhao, Zhang, Wang, Huang, Tan, Du and Liu2017). SR2 and SR3 are related to the growth of the Tibetan Plateau towards the N–NE (Xue & Yan, Reference Xue and Yan1984; Shi et al. Reference Shi, Dong, Liu, Hu, Chen and Chen2015 b) and its extrusion towards the east, as described by Schellart et al. (Reference Schellart, Chen, Strak, Duarte and Rosas2019) (see text for explanation).
In between SR1 and SR3, a short-lived SR2 extensional stress regime constrained to early Pleistocene time caused a NE–SW extension to the area. However, the origin of the SR2 is not clear. Such a NE–NNE extension was reported to have led to the formation of the Yuncheng-Linfen Basin in Miocene time (Zhang et al. Reference Zhang, Liao, Shi and Hu2006). Moreover, NE–SW extension has been reported to relate to a late Cenozoic short-term relaxation during a crustal shortening due to the northeastward development of the Tibetan Plateau (Xu et al. Reference Xu, Yue, Li, Sun, Sun, Zhang, Ma and Wang2012; Shi et al. Reference Shi, Liu, Liu, Chen, Chen, Cen, Huang and Li2013). The NE–SW extension has been interpreted to correspond to either the late Pleistocene stress regime in the Weihe graben (Shi et al. Reference Shi, Dong, Liu, Hu, Chen and Chen2015 b, Reference Shi, Chen, Chen, Cen and Zhang2019) or to late Miocene deformation responsible for the thermal subsidence in the Hefei and Bohai-Bay basins and the rifting subsidence in the Weihe graben and Qinling fault zone (Mercier et al. Reference Mercier, Vergely, Zhang, Hou, Bellier and Wang2013). It seems that the most favourable interpretation is the short-term relaxation during a crustal shortening due to the northeastward growth of the Tibetan Plateau (Xu et al. Reference Xu, Yue, Li, Sun, Sun, Zhang, Ma and Wang2012; Shi et al. Reference Shi, Liu, Liu, Chen, Chen, Cen, Huang and Li2013). However, the fact that the least principal stress axis (σ3) of SR2 trends as the intermediate principal stress axis (σ2) of SR3 strongly implies mutual permutations between them, possibly due to inherited fault patterns and particularly to the existence of NW–SE-striking faults (Fig. 2).
A similar shortening direction to that defined in the SR1 deformation event has been reported in the NE Tibetan Plateau to govern the periphery areas of the Ordos block from late Miocene to early Pleistocene times, responsible for regional shearing within central North China (Fig. 12a; Shi et al. Reference Shi, Chen, Chen, Cen and Zhang2019, Reference Shi, Dong and Hu2020). The Tibetan Plateau’s northeastward growth causes the shortening along the NE–SW direction, generating regional uplift, northeastward-convex basin-and-range structures and mountain exhumation related to a NE–SW compressive regional stress regime (Peizhen et al. Reference Peizhen, Burchfiel, Molnar, Weiqi, Decheng, Qidong, Yipeng, Royden and Fangmin1990; Shi et al. Reference Shi, Chen, Chen, Cen and Zhang2019, Reference Shi, Dong and Hu2020). This observation corroborates the kinematic interpretation of Shi et al. (Reference Shi, Cen, Chen, Wang, Chen, Li and Chen2015 a) but is at odds with the study of Zhang et al. (Reference Zhang, Ma, Yang, Shi and Dong2003) that argues for NW–SE extension in North China since latest Miocene or earliest Pliocene time. Kinematic analysis of basin boundary faults around the Ordos block (Shi et al. Reference Shi, Dong and Hu2020) and numerical simulations of the regional stress response to the NE–SW compression in North China indicated NE–SW-striking right-lateral shear stress in the periphery basins of the Ordos block (RGAFSO, 1988). Meanwhile, according to Northrup et al. (Reference Northrup, Royden and Burchfiel1995), Pacific–Eurasia convergence progressed at a relatively moderate average rate of 70–95 mm yr−1 from Oligocene to early Miocene times. After decreasing slightly to 65–70 mm yr−1 during early to middle Miocene times, the average convergence rate increased to 100–110 mm yr−1 from late Miocene time to the present.
In our opinion, the growth of the Tibetan Plateau towards the N–NE (Xue & Yan, Reference Xue and Yan1984; Shi et al. Reference Shi, Dong, Liu, Hu, Chen and Chen2015 b) and its extrusion towards the east, as described by Schellart et al. (Reference Schellart, Chen, Strak, Duarte and Rosas2019), i.e. extrusion facilitated by the Western Pacific and Sunda slab rollbacks, seem to have affected the development of the Shanxi rift by changing the driving stress regime from the strike-slip SR1 (Fig. 12a) to the extensional stress regimes from Quaternary time onwards (Fig. 12b, c). This significant change in the stresses led to the prolongation of the NNE-trending central part of the Shanxi rift towards its two edges trending NE–SW with the development of en échelon basins similarly trending NE–SW. Owing to this dominant NW–NNW extension, most basins are half-grabens bounded by large NE–SW-trending normal faults. Accordingly, boundary faults like the Fanshi (or Wutai) and Hengshan faults of the Fanshi and Datong basins, respectively, form a characteristic basin-and-range topography. The latter topography differs from the central part of the Shanxi rift, possibly, because transtensional stress regimes govern the central part, as shown recently in the Taiyuan Basin (Assie et al. Reference Assie, Wang, Ma, Kouamelan, Branston, N’dri and Mondah2020).
Therefore, the Fanshi area was subjected to strike-slip deformation along the NNE–SSW right-lateral strike-slip faults before the inception of the Fanshi Basin in a deformation associated with the counterclockwise rotation of the Taihangshan mountain belt in respect to the Ordos block (Zhao et al. Reference Zhao, Zhang, Wang, Huang, Tan, Du and Liu2017). In contrast, the entire North China Block has been moving coherently from WNW to ESE since Quaternary time, indicating that no significant block rotations presently exist along the two sides of the Shanxi rift, as shown by the GPS data (He et al. Reference He, Cai, Li and Gong2004).
5. Conclusion
The present study deals with the late Cenozoic evolution and deformation of the Fanshi Basin, which lies between the NNE-trending central and NE-trending northern zone of the Shanxi rift. It indicates that the Fanshi Basin has had a multiphase deformation history since late Cenozoic time, strongly influenced by the inherited faults from previous geological stages. The oldest deformation event was a regional strike-slip deformation (SR1) with NE–SW contraction and NW–SE extension that activated the faults of the region before Pleistocene time. However, the main deformation event (SR3) recognized in the Fanshi Basin is a NW–SE to NNW–SSE radial-pure extension (RE-PE), which is dated from late Pleistocene time to the present-day, giving rise to the current half-graben geometry of the Fanshi Basin as occurs nowadays by activating in its southern part the Fanshi (or Wutai) fault as a normal fault. In a broader sense, the SR3 event gave rise to the basin-and-range topography associated with the en échelon basins of half-graben geometry such as the Fanshi and Datong basins. Between the SR1 and SR3 events, a short-lived NE–SW extension (SR2) has been recognized and constrained to early Pleistocene time showing the inception of the Fanshi Basin’s extension. However, it seems that SR2 deformation causing extension perpendicular to the NW–SE to NNW–SSE extension of SR3 might have resulted from stress permutations to the crustal stresses while these changed from deformation event SR1 to SR3.
Supplementary material
To view supplementary material for this article, please visit https://doi.org/10.1017/S0016756822000085
Acknowledgements
The first author appreciates the Chinese Scholarship Council (CSC) for supporting the joint Ph.D. student project. This study received financial support from the National Natural Science Foundation of China (Grant No. 90914004). We would like to thank Alexandre Kounov and José L. Simón for their constructive comments and reviews, which helped greatly to improve the manuscript. Last but not least, we would like to thank Olivier Lacombe for his excellent editorial handling.
Conflict of interest
The authors declare that they have no known competing financial interests or personal relationships that could have appeared to influence the work reported in this paper.


