


1. Introduction
Indus Fan turbidites of the Laxmi Basin represent a huge sedimentary archive with which to investigate the palaeoenvironmental changes that took place in southern central Asia since the late Pliocene Epoch. The purpose of this study is to investigate the interplay between tectonic and climatic controls on the palaeogeographic evolution of the western Himalayan orogen by applying novel provenance approaches. We studied the Indus Fan sedimentary record, sampled during International Ocean Discovery Program (IODP) Expedition 355 to the Laxmi Basin, by comparing both siliciclastic and organic components of sediments, in order to retrieve independent and complementary provenance signals (Hahn et al. Reference Hahn, Miller, Andò, Bouimetarhan, Cawthra, Garzanti, Green, Radeff, Schefuß and Zabel2018). Biomarker analysis can provide insights into the depositional and post-depositional processes that occurred along the source-to-sink path that cannot be obtained by mineralogical analysis alone. In this paper we investigate the origin of the suspended sediment fraction by a new method of quantitative mineralogical analysis that can be applied to particles as fine grained as fine silt (5 μm). This study integrates previous work that has defined the petrographic, mineralogical and geochemical signatures of sediments generated within the huge Indus catchment onshore (Clift et al. Reference Clift, Lee, Hildebrand, Shimizu, Layne, Blusztajn, Blum, Garzanti and Khan2002, Reference Clift, Giosan, Carter, Garzanti, Galy, Tabrez, Pringle, Campbell, France-Lanord, Blusztajn, Allen, Clift, Tada and Zheng2010; Garzanti et al. Reference Garzanti, Vezzoli, Andò, Paparella and Clift2005) in order to unravel mineralogical changes during sediment transport from the Himalayan and Trans-Himalayan ranges to the deep ocean. This work contributes to the principal aim of IODP Expedition 355, which was to achieve a better understanding of the evolution of the Asian monsoon and to document the co-evolution of mountain building, climate, weathering and erosion over a range of timescales (Pandey et al. Reference Pandey, Clift, Kulhanek, Andò, Bendle, Bratenkov, Griffith, Gurumurthy, Hahn, Iwai, Khim, Kumar, Kumar, Liddy, Lu, Lyle, Mishra, Radhakrishna, Routledge, Saraswat, Saxena, Scardia, Sharma, Singh, Steinke, Suzuki, Tauxe, Tiwari, Xu, Yu, Pandey, Clift and Kulhanek2016).
2. Indus Fan
The Arabian Sea represents a major repository of sediment principally derived from the Indus River spanning most of the Cenozoic deposits. Channel and levee complexes are best developed in the Neogene System, following an increase in sedimentation rates since the early Miocene Epoch (Clift et al. Reference Clift, Shimizu, Layne, Blusztajn, Gaedicke, Schlüter, Clark and Amjad2001). The northern Arabian Sea is characterized by the presence of large structural blocks located between the western continental shelf of India and the deep floor of the Arabian Sea. The Laxmi Ridge, considered by most geoscientists as continental in origin (Talwani & Reif, Reference Talwani and Reif1998; Minshull et al. Reference Minshull, Lane, Collier and Whitmarsh2008), is separated from the western Indian margin by the Laxmi Basin (Fig. 1). The Indus River is the only major drainage system of the western Himalayas, including the High Himalayan range, as well as topographically elevated regions north of the Indus suture zone, such as the Kohistan arc and the Karakoram and Hindukush ranges (Clift et al. Reference Clift, Lee, Hildebrand, Shimizu, Layne, Blusztajn, Blum, Garzanti and Khan2002). Before extensive damming, largely since 1960 (Meadows & Meadows, Reference Meadows and Meadows1999; Garzanti et al. Reference Garzanti, Vezzoli, Andò, Paparella and Clift2005), sediment fluxes in the Indus River were among the highest on Earth (c. 400 × 106 t a–1; Hay, Reference Hay1998; Milliman & Farnsworth, Reference Milliman and Farnsworth2011). The Indus Fan, reaching a maximum thickness of greater than 9 km, covers an area of 1.1 × 10⁶ km2 and stretches 1500 km into the Indian Ocean from the present delta front (Fig. 1; Clift et al. Reference Clift, Shimizu, Layne, Blusztajn, Gaedicke, Schlüter, Clark and Amjad2001).

Fig. 1. Bathymetric map of the Arabian Sea and surrounding landmasses from GeoMapApp (Ryan et al. Reference Ryan, Carbotte, Coplan, O’Hara, Melkonian, Arko, Weissel, Ferrini, Goodwillie, Nitsche, Bonczkowski and Zemsky2009). The areal extent of Deccan Traps is shown in brown, yellow circles indicate the Expedition 355 sites, white lines correspond to major rivers and tributaries, and the pink line represents the approximate extent of the fan (after Kolla & Coumes, Reference Kolla and Coumes1987).
Since the onset of collision between the Indian passive margin and the Asian active margin, which took place during the middle Paleocene Epoch (59 ± 1 Ma in the central Himalaya, Hu et al. Reference Hu, Garzanti, Moore and Raffi2015; before 57–54 Ma in the western Himalaya, Garzanti et al. Reference Garzanti, Baud and Mascle1987, Najman et al. Reference Najman, Jenks, Godin, Boudagher-Fadel, Millar, Garzanti, Horstwood and Bracciali2017), the Indus River and its tributaries have represented the primary source of clastic sediment into the Arabian Sea, with turbidite sedimentation starting earlier in the north and progressing successively southwards (Clift et al. Reference Clift, Shimizu, Layne, Blusztajn, Gaedicke, Schlüter, Clark and Amjad2001). In the southern Arabian Sea, turbidite sedimentation began with muddy distal-fan deposits during the early Miocene Epoch (Davies et al. Reference Davies, Kidd and Ramsay1995).
The study area is located in the eastern Arabian Sea. Sites U1456 and U1457 lie in the 200–250-km-wide NW–SE-aligned Laxmi Basin, flanked by the Laxmi Ridge to the west and by the Indian continental shelf to the east (Krishna et al. Reference Krishna, Rao and Sar2006), 475 and 491 km offshore of the western Indian coast, respectively, and c. 820 and 750 km SE of the present mouth of the Indus River. Water depths are 3639 m for Hole U1456A and 3523 m for holes U1457A and U1457B (Fig. 2). The cored section at Site U1456 is subdivided into four lithologic units (Pandey et al. Reference Pandey, Clift, Kulhanek, Andò, Bendle, Bratenkov, Griffith, Gurumurthy, Hahn, Iwai, Khim, Kumar, Kumar, Liddy, Lu, Lyle, Mishra, Radhakrishna, Routledge, Saraswat, Saxena, Scardia, Sharma, Singh, Steinke, Suzuki, Tauxe, Tiwari, Xu, Yu, Pandey, Clift and Kulhanek2016). Our study focuses on the c. 240-m-thick lithologic Unit II, dated by combined biostratigraphy and magnetostratigraphy as being of late Pliocene – early Pleistocene age (c. 0.78–3.0 Ma). Unit II mainly consists of dark-grey to black sand and silt interbedded with thinly bedded clay rich in nannofossils. Erosive bases and graded bedding of sandy layers indicate turbidite deposition on sheet lobes (Pandey et al. Reference Pandey, Clift, Kulhanek, Andò, Bendle, Bratenkov, Griffith, Gurumurthy, Hahn, Iwai, Khim, Kumar, Kumar, Liddy, Lu, Lyle, Mishra, Radhakrishna, Routledge, Saraswat, Saxena, Scardia, Sharma, Singh, Steinke, Suzuki, Tauxe, Tiwari, Xu, Yu, Pandey, Clift and Kulhanek2016).
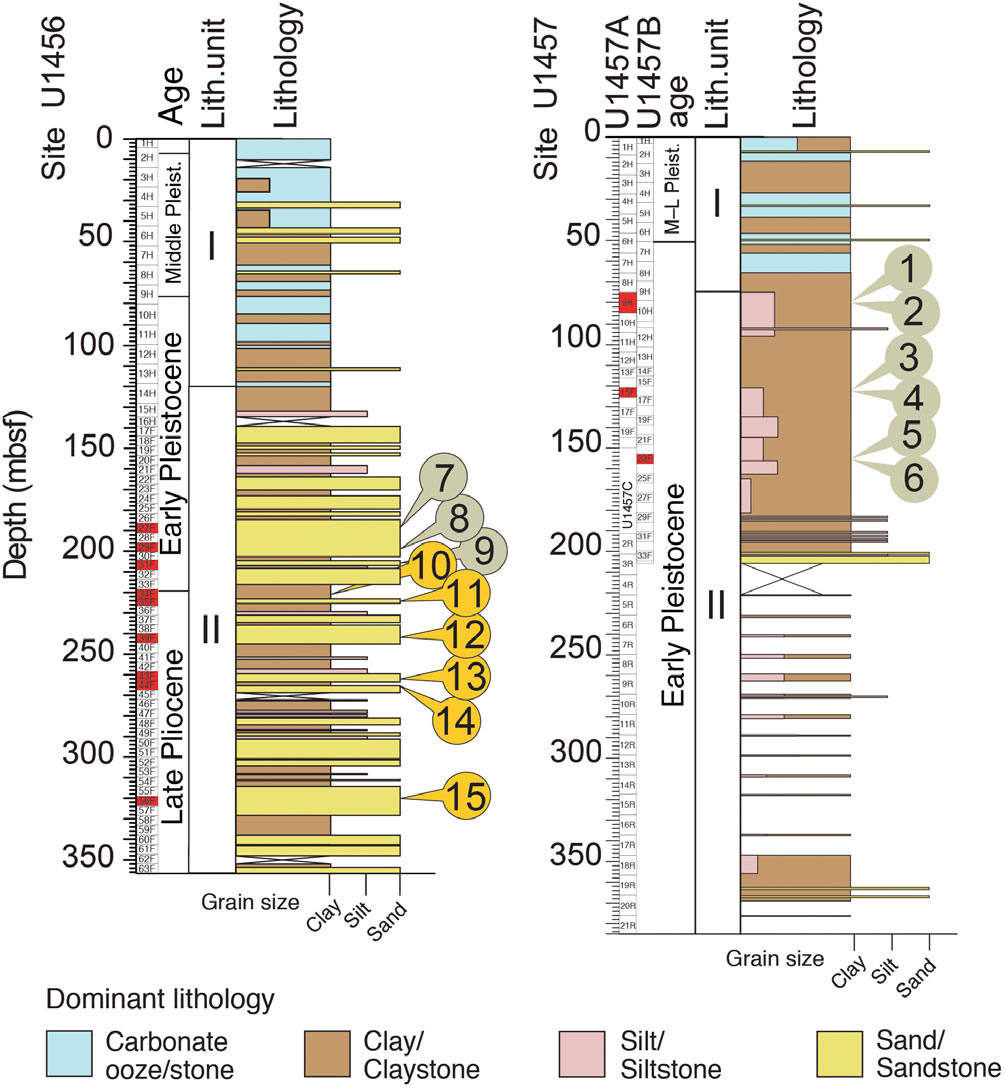
Fig. 2. Lithostratigraphic summary for the cored section with sampled intervals and sample positions for Unit II, in Hole U1456A at Site U1456 and in holes U1457A and U1457B at Site U1457 (for precise correspondence with stratigraphic position, see Pandey et al. Reference Pandey, Clift, Kulhanek, Andò, Bendle, Bratenkov, Griffith, Gurumurthy, Hahn, Iwai, Khim, Kumar, Kumar, Liddy, Lu, Lyle, Mishra, Radhakrishna, Routledge, Saraswat, Saxena, Scardia, Sharma, Singh, Steinke, Suzuki, Tauxe, Tiwari, Xu, Yu, Pandey, Clift and Kulhanek2016).
3. Sampling and analytical methods
Sampling of IODP cores was carried out during the post-cruise sampling party organized at the IODP repository in College Station, Texas (USA). Fourteen samples of undisturbed sediments collected by the half-length advanced piston core method (HLAPC, 4.8 m) were recovered from upper Pliocene – lower Pleistocene turbidites in holes U1456A, U1457A and U1457B (Fig. 2 and online Supplementary Table S1, available at http://journals.cambridge.org/geo). Because biomarker analysis requires a specific protocol to avoid contamination, c. 20 g of sediment were collected with a metal spatula, washed with distilled water and methanol, split into two equal parts (one for biomarker analysis and the other for x-ray fluorescence (XRF) and heavy-mineral analyses), and then covered by aluminium foil and stored in sealed plastic bags. The expertise developed on the JOIDES Resolution, and an accurate inspection of core images and sedimentological descriptions compared with semi-quantitative mineralogical analyses performed on smear slides onboard, inspired a sampling plan aimed at investigating interbed and intrabed compositional variability (i.e. differences in composition among different turbidite beds and within different layers of the same turbidite bed, respectively) as controlled by grain size and hydraulic sorting in different depositional environments. We focused on the upper Pliocene – lower Pleistocene interval, characterized by maximum sediment accumulation (45 and 58 cm ka–1, as obtained by the age model at sites U1456 and U1457) in order to minimize potential discrepancies caused by burial diagenesis.
We identified three groups of turbidites defined according to layer thickness (i.e. metric, decimetric or centimetric). Turbidite intervals of more than a metre thick correspond to channel fills, whereas decimetric and centimetric beds are interpreted to represent overbank deposits. Sampling principally focused on overbank beds ranging in size from medium silt to very fine sand, but the whole range of grain sizes present in cores was considered. In order to investigate intrabed mineralogical variability associated with both grain size and density, and therefore with the decreasing velocity and competence of the current, we collected both the coarser base and the finer top of three centimetric or decimetric graded beds from sites U1457A and U1457B. All chosen samples have a grain size suitable for XRF analysis and almost invariably include fine silt to clay, where biomarkers are concentrated.
3.a. Heavy minerals and geochemistry
A quartered aliquot of each bulk sample was wet-sieved using a standard 500 μm steel sieve and a 5 μm nylon mesh sieve with a 10 cm diameter. Such a wide grain size window (5–500 μm) was chosen to encompass a broad sediment size distribution (Garzanti et al. Reference Garzanti, Andò and Vezzoli2009). The remaining < 5 μm fraction was filtered and washed with deionized water into a beaker, dried, weighed and stored.
The gravimetric separation of dense grains from the chosen 5–500 μm size window was achieved with a centrifuge (3000 revs/min for 3 min) using Na-polytungstate (density, 2.90 g cm–3), followed by partial freezing in liquid nitrogen. An appropriate amount of the dense fraction obtained was split with a micro-riffle box and mounted with Canada balsam (n = 1.54). Heavy minerals were point-counted under the microscope at a suitable regular spacing (100 μm) to obtain real volume percentages (Galehouse, Reference Galehouse and Carver1971). Finer and suspect grains were systematically checked and identified by an inViaTM Renishaw Raman spectrometer equipped with a 532 nm laser and a 50 × long working distance objective (Andò & Garzanti Reference Andò, Garzanti, Scott, Smyth, Morton and Richardson2014). Heavy-mineral and transparent-heavy-mineral concentrations (HMC and tHMC indices of Garzanti & Andò Reference Garzanti, Andò, Mange and Wright2007), representing fundamental parameters for unravelling provenance and detecting hydraulic-sorting effects, allow us to distinguish between poor (tHMC < 1), moderately poor (1 ≤ tHMC < 2), moderately rich (2 ≤ tHMC < 5) and rich (5 ≤ tHMC < 10) transparent-heavy-mineral suites. The chemical composition of sediment samples was determined by energy-dispersive XRF spectroscopy, using a PANalyticalTM Epsilon 3-XL instrument equipped with a rhodium tube, several filters and a SSD5 detector at MARUM Center for Marine Environmental Sciences, University of Bremen, Bremen, Germany. The analytical quality and calibration of the measurements was assessed by repeated analyses of certified standard materials GBW07309, GBW07316 and MAG-1 (Govin et al. Reference Govin, Holzwarth, Heslop, Keeling, Zabel, Mulitza, Collins and Chiessi2012). XRF scanning of the entire section of an overbank deposit from U1457A-9H-4 (wet archive half) was performed at the IODP Gulf Coast Repository at 2 cm intervals using a third-generation Avaatech XRF core scanner (Kulhanek et al. Reference Kulhanek, Lyle, Bowen, Pandey, Clift and Kulhanek2018; Lyle et al. Reference Lyle, Kulhanek, Bowen, Hahn, Pandey, Clift and Kulhanek2018). The core section was covered with 4-mm-thick Ultralene film and scanned at 10 kV with a 0.8 mA current, no filter and a 15 s live time, as well as at 30 kV, 1.0 mA current and 20 s live time with a Pd filter. In order to correct for artefacts related to XRF scanning (Weltje & Tjallingi Reference Weltje and Tjallingii2008; Weltje et al. Reference Weltje, Bloemsma, Tjallingii, Heslop, Röhl, Croudace, Croudace and Rothwell2015), Al-ratios of the scanning data were used because aluminosilicates are present throughout the mineralogical suite independent of grain size.
3.b. Biomarkers
Samples were hand crushed using a ceramic pestle and mortar and passed through a 125 μm sieve. Samples were mixed with pre-extracted and baked sand (3 h at 450°C) and extracted using a DionexTM Accelerated Solvent Extractor (ASE 300) with 9:1 dichloromethane (DCM):methanol at 1500 bar and 100°C. Sulphur was removed from the extractable organic matter (EOM) of all samples by refluxing at 40°C with acid-activated copper turnings. Extractability was determined using gravimetry on a 1/10 aliquot (mg EOM/g sediment). The rest of the EOM was separated using a short silica column into three fractions: aliphatic hydrocarbons (n-hexane), aromatic hydrocarbons (n-hexane:DCM, 4:1) and polar compounds (DCM:methanol, 1:1). The aliphatic and aromatic fractions were spiked with a mixture of internal standards (IS) of known concentration (terphenyl d14, anthracene d10 and tetracosane d50), and analysed by gas chromatography – mass spectrometry (GC-MS) using an AgilentTM GC (6890N) coupled to an AgilentTM Mass Selective Detector (5975B). One microlitre of solution was injected onto a Programmable Temperature Vaporizing (PTV) inlet at 35°C, followed by a temperature increase at 700°C min–1 to 310°C. Separation was performed on a J&W DB5MS UI (60 × 250 × 0.25 μm) column with helium carrier gas at 1.5 mL min–1, constant flow rate and 155 KPa starting pressure. The MS was operated in full-scan mode (50–550 amu) for all samples and fractions. In addition, some samples were analysed using two selective ion monitoring (SIM) mode programmes. Target compounds were identified using retention times relative to known standards, and mass spectral comparison to NIST and WILEY library data.
4. Heavy minerals and geochemistry results
Lower Pleistocene turbidites from Site U1456 contain moderately rich to rich (tHMC, 4.4±1.1) amphibole-epidote suites with titanite, apatite, garnet, clinopyroxene, tourmaline and minor zircon, rutile, chloritoid and sillimanite (online Supplementary Table S2, available at http://journals.cambridge.org/geo). Upper Pliocene turbidites from Site U1456 contain rich (tHMC, 6.9±1.5) amphibole-epidote suites with garnet, clinopyroxene, titanite, apatite and minor tourmaline, kyanite, sillimanite and hypersthene. The sandy base and silty top of the three lower Pleistocene turbidite layers S1-S2, S3-S4 and S5-S6 were analysed to investigate intrabed mineralogical variability. These yielded suites moderately rich in epidote-amphibole with titanite, apatite, garnet, clinopyroxene, tourmaline, zircon, rutile, sillimanite and chloritoid. The studied Indus Fan sediments yielded virtually the same heavy-mineral suites as Holocene deltaic sands of the Indus River (Clift et al. Reference Clift, Giosan, Carter, Garzanti, Galy, Tabrez, Pringle, Campbell, France-Lanord, Blusztajn, Allen, Clift, Tada and Zheng2010), indicating negligible segregation of minerals by their density or shape during long-distance turbidite transport (Fig. 3).

Fig. 3. Grain size control of mineralogy of sediments in overbank and channel fill deposits. Symbols for heavy-minerals are after Kretz (Reference Kretz1983): Act – actinolite; Ap – apatite; Bt – biotite; Cld – chloritoid; Ep – epidote; Grt – garnet; Hbl – hornblende; Hy – hypersthene; Ky – kyanite; Sp – spinel; Tou – tourmaline; Ttn – titanite; Zrn – zircon.
In the studied sediment samples, the most abundant element is Si (200 g kg–1, roughly equivalent to 65 wt% SiO2), followed by Al (60 g kg–1c. 15 wt% Al2O3), Ca (80 g kg–1c. 10 wt% CaO), Fe (30 g kg–1c. 8 wt% Fe2O3) and K (30 g kg–1c. 4 wt% K2O) (online Supplementary Table S3, available at http://journals.cambridge.org/geo). This elemental composition reflects the abundance of quartz and aluminosilicates. Minor and trace elements (dry weight mass of trace elements is below 0.1 wt%) measured in the sediments were Ba, Br, Mg, Mn, Sr, Ti, Zr, Cr, Cu, Ni, Pb, Rb and Zn.
4.a. Interbed and intrabed compositional variability
Heavy-mineral concentrations, as well as the abundance of garnet and opaque Fe-Ti-Cr oxides, are systematically higher, and phyllosilicates notably lower in metre-scale sandy channel turbiditic intervals compared with those in centimetric to decimetric silty overbank turbidites. Grain-size control largely reflects suspension sorting (i.e. sorting by settling velocity during transport; Middleton, Reference Middleton1993), with fast-settling ultradense minerals concentrating in bedload and slow-settling platy phyllosilicates concentrating in suspended load (Figs 3 and 4) (Garzanti et al. Reference Garzanti, Andò, France-Lanord, Vezzoli, Censi, Galy and Najman2010).

Fig. 4. Hydraulic-sorting effects on the mineralogical and geochemical composition of Indus Fan turbidites (data for Indus Delta sediments after Clift et al. Reference Clift, Giosan, Carter, Garzanti, Galy, Tabrez, Pringle, Campbell, France-Lanord, Blusztajn, Allen, Clift, Tada and Zheng2010). Both multivariate observations (points) and variables (rays) are displayed in compositional biplots (Gabriel, Reference Gabriel1971). The length of each ray is proportional to the variance of the corresponding element in the data set; if the angle between two rays is close to 0, 90 or 180°, then the corresponding elements are directly correlated, uncorrelated or inversely correlated, respectively. (a) Higher transparent-heavy-mineral concentration (tHMC) and enrichment in fast-settling ultradense garnet and opaque Fe–Ti–Cr oxides in coarser-grained metric turbidite intervals, together with preferential segregation of phyllosilicates and carbonates in thinner and finer-grained turbidite beds, are chiefly the effects of suspension sorting. Upper Pliocene turbidites do not appear to be depleted in pyroxene relative to lower Pleistocene strata, suggesting minor diagenetic effects. (b) Silica and zirconium, largely associated with quartz and zircon, concentrate in sandy metric turbidites and anticorrelate with elements principally hosted in phyllosilicates (e.g. K, Rb, Fe, Mg and Ti), which concentrate instead at the top of thin graded beds and in finest sediments. Ca, Na, Sr and Ba are largely hosted in feldspar.
Only subtle compositional differences are observed between the base and top of turbidite beds. Heavy-mineral concentration is significantly higher at the base (S6) than at the top of decimetric bed (S5) (HMC 4.6 vs 3.0), reflecting higher settling velocities of denser grains, but is almost identical in the centimetric bed S3 and S4.
Most evident from the geochemical data is the enrichment of Zr in metre-scale sandy turbidites (e.g. S8, S13 and S15), as well as at the base of sandy turbidite beds (e.g. S4 and S6), which reveals the concentration of fast-settling, dense zircon grains (Fig. 5). Turbidite bases tend to be depleted in Fe, Mg, K, Ti, P, Mn, Rb, Ba, Nb, Cr, Ni, Cu, Zn and Pb. These chemical elements are all hosted preferentially in slow-settling phyllosilicates (Garzanti et al. Reference Garzanti, Andò, France-Lanord, Censi, Vignola, Galy and Lupker2011), are adsorbed on clay minerals or are associated with organic matter (e.g. Br; Thomson et al. Reference Thomson, Croudace, Rothwell and Rothwell2006).

Fig. 5. Elemental composition of a turbidite in section U1457A-9H-4 (presented as XRF scanning ratios). The core photo on the left-hand side shows a pile of overbank fining-upwards turbidite sequence (from coarser to finer), represented in the plot background using dark to light shading of grey. The distribution of terrigenous elements throughout the entire section reveals that the coarse-grained turbidite base is enriched in heavier elements such as Zr (plotted in black). Lighter elements (e.g. K plotted in grey) as well as Br, which is easily absorbed to organic matter (plotted in green), are depleted in each turbidite base. Al-ratios are used because aluminosilicates are present throughout the mineralogical suite independent of grain size, and are enriched in overbank turbidites.
Geochemical data confirm that fast-settling minerals concentrate in channel deposits, while slow-settling minerals are also transported laterally by turbid flow and are spread in the abyssal plain as overbank deposits.
5. Biomarkers results
5.a. n-Alkanes and isoprenoids
n-Alkanes are organic compounds constructed of a straight saturated chain of carbons. Their distribution provides information regarding the source of the organic matter (OM) and its level of preservation (Bray & Evans Reference Bray and Evans1961; Tissot & Welte Reference Tissot and Welte1978). The studied samples have good preservation of n-alkanes between C11 and C40, which suggests low levels of biodegradation, minor influence of post-depositional processes and possibly fast burial. The Site U1456 samples have strong odd-over-even carbon number predominance and a carbon preference index (Bray & Evans, Reference Bray and Evans1961) (CPI22–32) of 1.33–3.5, suggesting a relatively low thermal maturity and terrigenous source of OM (Table 1; online Supplementary Figures S1, S2, available at http://journals.cambridge.org/geo). Most of the Site U1457 samples have strong even-over-odd n-alkane carbon number predominance with a CPI22–32 of 0.37–0.69, except for samples S2 and S5 that have a CPI22–32 of 1.37, suggesting low thermal maturity and a dominantly marine source of OM (Albaigés et al. Reference Albaigés, Grimalt, Bayona, Risebrough, De Lappe and Walker1984; Saliot et al. Reference Saliot, Denant, Bigot and Zhang1998). The terrigenous/aquatic ratio (TAR; calculated after Bourbonniere & Meyers, Reference Bourbonniere and Meyers1996) is much higher in the Site U1456 samples (Table 1), also showing dominant terrigenous OM in Site U1456 samples and mainly marine OM in Site U1457 samples.
Table 1. Biomarker ratios calculated from gas chromatography – mass spectrometry (GC-MS) data for clay-rich turbidites and the silty and sandy fraction of sediments sampled in upper Pliocene – lower Pleistocene turbidites of the U1456A, U1457A and U1457B sites. Pr/Ph – Pristane/Phytane; CPI(22–32) – carbon preference index (n-C23+n-C25+n-C27+n-C29+n-C31)/(n-C22+2*Σ[n-C24+n-C26+n-C28+n-C30)]+n-C32) (after Bray & Evans, Reference Bray and Evans1961); TAR – terrigenous/aquatic ratio (n-C27+n-C29+n-C31)/(n-C15+n-C17+n-C19) (after Bourbonniere & Meyers, Reference Bourbonniere and Meyers1996); Extractability – Mg extractable organic matter per gram sediment; αααR = 5α,14α, 17α(H) 20R steranes; C29 ααα S/(S+R) = C29 5α,14α,17α(H) 20S/(20S+20R) sterane thermal maturity parameter; Ts/(Ts+Tm) = C27 hopane parameter; C29 αβ/(αβ+βα) = C29 hopane thermal maturity parameter; VReq – vitrinite reflectance equivalent derived from the C29 20S/20R ratio (Sofer et al. (Reference Sofer, Regan and Muller1993) calibration); ND – not determined

Pristane (2,6,10,14-tetramethylpentadecane; Pr) and phytane (2,6,10,14-tetramethylhexadecane; Ph) are most commonly derived from the chlorophyll in phototrophic organisms and bacteriochlorophyll in purple sulphur bacteria (Powell & McKirdy, Reference Powell and McKirdy1973), although there are other sources, and are commonly identified in marine sediments (Volkman, Reference Volkman1986). The depositional environment exerts a fundamental influence on the relative abundance of Pr and Ph: Pr/Ph < 0.8 is indicative of anoxic environments, whereas Pr/Ph > 3.0 suggests oxic environments or terrigenous OM input (Didyk et al. Reference Didyk, Simoneit, Brassell and Eglinton1978). However, Pr can also be derived from anaerobic bacterial degradation (Rontani et al. Reference Rontani, Nassiry, Michotey, Guasco and Bonin2010) or clay-catalysed degradation of the chlorophyll phytyl chain (Lao et al. Reference Lao, Korth, Ellis and Crisp1989; Rontani et al. Reference Rontani, Nassiry, Michotey, Guasco and Bonin2010), and Ph can also be derived from other sources (Rowland, Reference Rowland1990; Gelin et al. Reference Gelin, Damsté, Harrison, Maxwell and De Leeuw1995; Grossi et al. Reference Grossi, Hirschler, Raphel, Rontani, De Leeuw and Bertrand1998); the oxicity of the depositional environment based on Pr/Ph must therefore be interpreted with caution (ten Haven et al. Reference ten Haven, de Leeuw, Rullkötter and Sinninghe Damsté1987). The Pr/Ph of most of the Site U1456 samples is 3.2–5.3, which is consistent with an oxic depositional environment; the only exception is sample S8, which has a much lower value (0.2; Table 1). The Pr/Ph of the Site U1457 samples is 0.4–0.9, consistent with a dominantly anoxic depositional environment. The isoprenoid versus n-alkane ratios (Pr/n-C17, and Ph/n-C18) are typical of non-biodegraded samples; the exception is sample S9 with an anomalously large Pr/n-C17 ratio (21.1), which might indicate partial removal of low-molecular-weight n-alkanes by biodegradation.
5.b. Steranes
Steranes are source-specific biomarkers that are useful for correlating source rocks with their generated crude oils (e.g. Peters et al. Reference Peters, Walters and Moldowan2005). C27 steranes are produced by zooplankton, whereas C29 steranes are mainly derived from higher plants (Huang & Meinschein, Reference Huang and Meinschein1979), although there are other potential sources (e.g. Volkman, 1986, Reference Volkman2005). Sediments containing abundant diatoms, dinoflagellates and coccolithophores are typically rich in C28 steranes (Falkowski et al. Reference Falkowski, Schofield, Katz, Van de Schootbrugge, Knoll, Thierstein and Young2004). The C27/C29 and C28/C29, 5α, 14α, and 17α(H) sterane ratios and the C27–C28–C29 sterane ternary diagram (based on the 5α, 14α, 17α(H) and 20R [αααR] isomers) can therefore be used to evaluate the diversity of zooplankton and phytoplankton assemblages (e.g. Huang & Meinschein, Reference Huang and Meinschein1979; Moldowan et al. Reference Moldowan, Seifert and Gallegos1985; Grantham & Wakefield, Reference Grantham and Wakefield1988; Wójcik-Tabol & Ślączka, Reference Wójcik-Tabol and Ślączka2015). However, the proportion of C28 relative to C27 and C29 steranes tends to increase with decreasing geological age in Cenozoic strata (e.g. Grantham & Wakefield, Reference Grantham and Wakefield1988), and the origin of steranes is complex (e.g. Volkman, 1986, Reference Volkman2005). For example, C29 sterols are precursors of C29 steranes and have been identified in phytoplankton (Gagosian, Reference Gagosian1976), cyanobacterial mats (Volkman, Reference Volkman1986) and green algal blooms (Kodner et al. Reference Kodner, Pearson, Summons and Knoll2008).
In the studied IODP Expedition 355 samples, C27–C29 αααR steranes were identified in all Site U1457 samples but in only two Site U1456 samples (online Supplementary Figs S1, S2). The Site U1457 samples, with the exception of sample S5, have moderate C27/C29 ratios (0.79–1.01), consistent with a dominant zooplankton OM input and deposition in a deep marine environment as independently suggested by n-alkanes and isoprenoids. The two U1456 samples S7 and S12 and the U1457 sample S5 have lower C27/C29 ratios (0.43–0.51), consistent with a stronger influence of terrigenous OM (Table 1). The high C28/C29 ratio (2.3) in sample S7 is consistent with a higher contribution of diatoms, dinoflagellates or coccolithophorids. This variation is also shown by the C27–C28–C29 αααR sterane ternary diagram (Fig. 6), in which most of the U1457 samples (S1, S2, S3, S4 and S6) plot in the open marine field, whereas U1456 samples S7 and S12, and U1457 sample S5, plot in the deltaic-terrigenous field (Huang & Meinschein, Reference Huang and Meinschein1979; Xing et al. Reference Xing, Zhang, Yuan, Sun and Zhao2011).

Fig. 6. Ternary diagram showing the C27, C28 and C29 ααα 20R sterane distributions for the U1456A (red), U1457A (green) and U1457B (blue) site samples (after Huang & Meinschein, Reference Huang and Meinschein1979).
The C27 βα diasterane/C27 ααα sterane ratio provides information on rock characteristics. The low diasterane/sterane ratios prevailing in the Site U1457 samples (0.22–0.65) are typical of carbonates and clay-poor rocks, whereas the generally higher diasterane/sterane ratios prevailing in the U1456 samples (0.63–2.1) indicate clay-rich and/or acid-catalysed rocks (Moldowan et al. Reference Moldowan, Seifert and Gallegos1985; Peters et al. Reference Peters, Walters and Moldowan2005). The diasterane/sterane ratio can be affected by high thermal maturation and/or biodegradation (Seifert & Moldowan, Reference Seifert and Moldowan1978), but other biomarker data show that these influences are not applicable to the IODP Expedition 355 samples.
5.c. Thermal maturity
Bacteria are considered to be the main source of hopanes in rocks (Ourisson et al. Reference Ourisson, Albrecht and Rohmer1984). The overall distribution of hopanes at sites U1456 and U1457 is characterized by high abundances of thermally unstable isomers, including ββ hopanes, βα hopanes and C27 17β(H)-trisnorhopane (online Supplementary Figs S1, S2), consistent with the sediments having a low thermal maturity. Because C27 17α-trisnorhopane (Tm) is a less thermally stable isomer than C27 18α-trisnorneohopane (Ts) (Seifert & Moldowan, Reference Seifert and Moldowan1978), the Ts/(Ts+Tm) ratio can be used as a maturity indicator. This ratio is also dependent on the source of the OM (Moldowan et al. Reference Moldowan, Sundararaman and Schoell1986) and can be influenced by clay-catalysed reactions. In our samples, the Ts/(Ts+Tm) ratio varies between 0.17 and 0.43 (Table 1), indicating thermal maturities in the early oil window or lower, but show little intrasite and depth variation. Another hopane maturity parameter is the C29 hopane/moretane ratio (αβ/(αβ+βα)), which maximizes at 0.95 in the middle of the oil window. This ratio is mostly lower for the Site U1457 samples (0.59–0.78) than for the Site U1456 samples (0.65–0.92), and generally increases with depth (Table 1). These values are consistent with immature, pre-oil window thermal maturities for Site U1457 and early oil window thermal maturities for Site U1456.
The steranes are dominated by the αααR isomers, but also contain small amounts of the 5β-steranes that partially co-elute with some αββ isomers (online Supplementary Figs S1, S2), consistent with low thermal maturity. Thermal maturity can also be revealed by the 20S/(20S+20R) isomerization ratio of C29 ααα steranes, which varies from 0 to 0.52–0.55 at thermal equilibrium (Seifert & Moldowan, Reference Seifert and Moldowan1986). This ratio is mostly lower for the Site U1457 samples (0.19–0.42) than for the Site U1456 samples (0.28–0.50; Table 1). The C29 20S/20R ratio was used to calculate vitrinite reflectance equivalent (VReq), based on the Sofer et al. (Reference Sofer, Regan and Muller1993) calibration (Table 1). These sterane ratios suggest a somewhat higher thermal maturity for U1456, equivalent to temperatures of approximately 90–127°C, reflecting its slightly greater depth, and showing that the deepest analysed sample at Site U1456 has reached the early oil window with a VReq of 0.82%. In contrast, the shallowest analysed sample from Site U1457 has a VReq of 0.45%, meaning it is immature for oil generation and reached a temperature of no greater than about 80°C. These inferred temperature values from the biomarkers are higher than expected from the measured present-day geothermal gradients, which are 53°C km–1 and 57°C km–1 for the upper parts and 38°C km–1 and 35°C km–1 for the deeper sections of U1457 and U1456, respectively (Pandey et al. Reference Pandey, Clift, Kulhanek, Andò, Bendle, Bratenkov, Griffith, Gurumurthy, Hahn, Iwai, Khim, Kumar, Kumar, Liddy, Lu, Lyle, Mishra, Radhakrishna, Routledge, Saraswat, Saxena, Scardia, Sharma, Singh, Steinke, Suzuki, Tauxe, Tiwari, Xu, Yu, Pandey, Clift and Kulhanek2016).
6. Discussion
Coupling different observations from the same sediment samples provides independent and complementary information essential for performing accurate provenance analysis of Indus Fan turbidites. Matching mineralogical and geochemical data from IODP Expedition 355 samples has shown that heavy minerals concentrate preferentially in sandy turbidites. Segregation of minerals with different density or shape – and therefore different settling velocity (Komar, Reference Komar, Mange and Wright2007; Garzanti et al. Reference Garzanti, Andò and Vezzoli2008) – during transport and deposition are best revealed by geochemical data, which are powerful tools for refining information obtained by heavy-mineral analyses. In particular, Zr concentration is higher in metre-scale sandy intervals and systematically decreases from the base to the top of decimetric to centimetric turbiditic beds. Finer-grained bed tops are enriched in K and other metals (e.g. Rb, Fe, Mg and Ti). These elements are hosted preferentially in the phyllosilicate lattice, adsorbed on clay particles or associated with organic matter.
The study of biomarkers helps us to read the organic fingerprint, which is linked to the original biogenic realm that is strongly influenced by climate change, and thus opens a new window in provenance research. In the IODP Expedition 355 samples, n-alkanes indicate limited degradation of the OM during burial. This is positive news, because heavy-mineral and geochemical data can therefore be considered to faithfully reflect the sediment composition as originally deposited.
Biomarkers in the Site U1456 samples indicate a largely terrigenous source of the OM and mostly oxic depositional environment. This site lies slightly closer to the coast of peninsular India. Biomarkers in the Site U1457 samples show a marine source of the OM and an anoxic depositional environment. This site lies further offshore and closer to the Laxmi Ridge. The presence of immature hopane and sterane isomers, together with most biomarker ratios, suggests a low thermal maturity for the sediment at both sites, with slightly higher maturity for Site U1456 samples. However, there is considerable variation in some of the thermal maturity parameters, which could be due to mixing of indigenous organic matter, reflecting early diagenesis with transported and previously matured sediment. This mixing process is known to sometimes significantly alter thermal maturity ratios (Ourisson et al. Reference Ourisson, Albrecht and Rohmer1984).
These data suggest potentially different dispersal pathways for the siliciclastic sediments and the OM within them. The siliciclastic sediments were mostly derived axially from the Himalayas via the Indus River in the north. In contrast, the OM may have been derived from the Indian peninsula or the Indus River at Site U1456, and was at least partly derived within the open ocean at Site U1457. This case study shows how a multidisciplinary approach to provenance analysis can fruitfully reveal the effect of multiple superimposed sedimentary processes and complex dispersal pathways in sedimentary basins.
7. Conclusions
In this study of turbidites recovered by IODP Expedition 355 we coupled heavy-mineral and geochemical analyses with the study of biomarkers. Heavy minerals analyses are best performed on sand fractions, but can extend to size fractions as fine as fine silt, whereas geochemical analyses are applicable to the entire clay to sand range. Biomarkers are concentrated in the finest sediments.
In this way we have establish a Himalayan source for the studied Plio-Pleistocene Indus Fan turbidites and obtain information on both terrigenous and marine inputs to siliciclastic and hemipelagic deposits of the Indus Fan. The studied samples yield diverse heavy-mineral assemblages in all size fractions. Heavy-mineral concentration is higher in thicker sandy intervals and tends to decrease with grain size. Hydraulic-sorting effects are best revealed by geochemical data, indicating clear differentiation between fast-settling minerals (e.g. ultra-dense zircon) in coarser-grained channel fills or at the base of overbank turbidite beds, and of slow-settling minerals (e.g. platy phyllosilicates) at the top of overbank turbidite beds. Biomarker analysis allows us to identify the distinct origins of OM in Site U1456, lying slightly closer to the Indian coast and supplied with largely terrigenous material, compared with that from Site U1457, lying further offshore closer to the Laxmi Ridge. The samples from Site U1457 are characterized by n-alkanes, isoprenoids and steranes, reflecting an abundance of zooplankton and therefore indicating an open-marine origin of OM. The biomarkers also show that the thermal maturity is lower in the shallower buried Site U1457 samples (immature for oil generation; about 80°C), increases with depth, and is highest in the deepest Site U1456 sample (early oil window; 127°C). The joint consideration of both organic and inorganic compositional fingerprints of sediments opens up a new frontier for future studies of the largely unexplored deep-marine sedimentary record. Coupling heavy-mineral and biomarker analyses with the study of the huge natural sedimentary archive in the deep ocean and in fine silt and clay fractions could provide a useful tool for future provenance studies, and might also be useful in exploration for oil and gas accumulations.
Acknowledgments
This research used samples and data provided by the International Ocean Discovery Program (IODP). Funding for this research was provided by projects MIUR-PRIN 2015EC9PJ5 (The subduction and exhumation of the continental lithosphere: their effects on the structure and evolution of the orogens) and MIUR – Dipartimenti di Eccellenza 2018–2022, Department of Earth and Environmental Sciences, University of Milano-Bicocca. This research was also funded by Australian and New Zealand International Ocean Discovery Program Consortium (ANZIC) Post Cruise Special Analytical Funding. Clift acknowledges support from the Charles T. McCord chair in petroleum geology at LSU. We thank Alberto Resentini for invaluable graphic advice.
Supplementary material
To view supplementary material for this article, please visit https://doi.org/10.1017/S0016756819000773.


