1. Introduction
δ13C chemostratigraphy has been accepted as a powerful tool for correlation of carbonate successions on a regional as well as global scale. A large number of studies focusing on the Ordovician Period have been published over the last ten years in order to clarify the framework of carbon isotope chemostratigraphy (Ludvigson et al. Reference Ludvigson, Jacobson, Witzke and González1996, Reference Ludvigson, Witzke, Schneider, Smith, Emerson, Carpenter and González2004; Patzkowsky et al. Reference Patzkowsky, Slupik, Arthur, Pancost and Freeman1997; Ainsaar, Meidla & Martma, Reference Ainsaar, Meidla and Martma1999; Brenchley et al. Reference Brenchley, Carden, Hints, Kaljo, Marshall, Martma, Meidla and Nõlvak2003; Buggisch, Keller & Lehnert, Reference Buggisch, Keller and Lehnert2003; Saltzman, Reference Saltzman2005; Saltzman & Young, Reference Saltzman and Young2005; Young, Saltzman & Bergström, Reference Young, Saltzman and Bergström2005; Kaljo, Martma & Saadre, Reference Kaljo, Martma and Saadre2007; Bergström et al. Reference Bergström, Chen, Gutiérrez-Marco and Dronov2009, Reference Bergström, Lehnert, Calner and Joachimski2012; Ainsaar et al. Reference Ainsaar, Kaljo, Martma, Meidla, Männik, Nõlvak and Tinn2010; Azmy et al. Reference Azmy, Stouge, Christiansen, Harper, Knight and Boyce2010; Munnecke et al. Reference Munnecke, Zhang, Liu and Cheng2011; Zhang et al. Reference Zhang, Munnecke, Chen, Cheng and Liu2011). Based on previously published data, Bergström et al. (Reference Bergström, Chen, Gutiérrez-Marco and Dronov2009) compiled a composite δ13C curve for the Ordovician showing six short-lived positive excursions from the Upper Ordovician, whereas only a single one was demonstrated from the Middle Ordovician and none from the Lower Ordovician. This is in part because relatively few studies have specifically dealt with Lower and Middle Ordovician strata. Recently, Albanesi et al. (Reference Albanesi, Bergström, Schmitz, Serra, Feltes, Voldman and Ortega2013) demonstrated that the MDICE (Middle Darriwilian Isotope Carbon Excursion) is present in the Precordillera of Argentina. Edwards & Saltzman (Reference Edwards and Saltzman2014) documented two detailed δ13C curves through the Lower–Middle Ordovician of the Great Basin, United States. In addition, Lehnert et al. (Reference Lehnert, Meinhold, Wu, Calner and Joachimski2014) named several small positive and negative carbon isotope excursions in the Lower and Middle Ordovician based on data from the Siljan district, Central Sweden, and from data previously published from Argentina (Buggisch, Keller & Lehnert, Reference Buggisch, Keller and Lehnert2003). However, the global significance of some of these newly named excursions still needs to be verified.
In Baltoscandia, Ordovician δ13C chemostratigraphy is especially well investigated in Estonia and Latvia (Ainsaar, Meidla & Tinn, Reference Ainsaar, Meidla, Tinn, Hints and Ainsaar2004; Meidla et al. Reference Meidla, Ainsaar, Backman, Dronov, Holmer, Sturesson, Hints and Ainsaar2004; Ainsaar et al. Reference Ainsaar, Meidla, Tinn, Martma and Dronov2007, Reference Ainsaar, Kaljo, Martma, Meidla, Männik, Nõlvak and Tinn2010; Kaljo, Martma & Saadre, Reference Kaljo, Martma and Saadre2007). There are only a few studies from this area, however, that specifically focus on the Lower and Middle Ordovician. In Sweden, a thin suite of Ordovician strata is locally well exposed, including the very uniform so-called ‘orthoceratite limestone’ of Early and Middle Ordovician age (Jaanusson, Reference Jaanusson and Bassett1976). Conodonts from these strata have been investigated in detail and many studies have resulted in a standard conodont zonation for the Ordovician of Baltoscandia (e.g. Lindström, Reference Lindström1971; Bergström, Reference Bergström1971; Löfgren, Reference Löfgren1994; Reference ZhangZhang, 1998a ). Thus, the strata in Sweden provide an ideal record for integrating carbon isotope geochemistry with conodont biostratigraphy. In order to perform such studies in stratigraphically continuous sections, two drill cores have been recovered: one from the province of Östergötland in 2007 that covered the uppermost Middle Ordovician through Upper Ordovician, and one from the island of Öland in 2010 that covered the Lower–Middle Ordovician. These two cores together cover the entire Ordovician of southern Sweden, which in these areas is only a bit more than 100 m thick. The integrated carbon isotope chemostratigraphy and conodont biostratigraphy of the former core, representing the uppermost Middle Ordovician through Upper Ordovician, has been published recently by Bergström et al. (Reference Bergström, Calner, Lehnert and Noor2011, Reference Bergström, Lehnert, Calner and Joachimski2012) and we will not comment more on this part of the succession. The latter core is the Tingskullen core that was drilled in 2010 in the northeastern part of the island of Öland. The first preliminary stratigraphic data from this core were published in conference proceedings by Calner et al. (Reference Calner, Lehnert, Wu, Dahlqvist and Joachimski2014). In this paper, we have expanded the original δ13C dataset by more than 200 samples (Table 1) and, in addition, processed and analysed 29 conodont samples in order to add a detailed conodont biostratigraphy to the succession. We have also added plates showing the carbonate microfacies of the succession. The combined data help to put the Swedish Ordovician in a global context and add important data for global correlation of Lower–Middle Ordovician strata in general.
Table 1. Stable carbon and oxygen isotope data from the Ordovician succession in the Tingskullen drill core from Öland, southeastern Sweden. Data published in Calner et al. (Reference Calner, Lehnert, Wu, Dahlqvist and Joachimski2014) are included in this table.
Gillberga Fm * – Gillberga Fm (Formation A+B)
2. Geological setting and stratigraphy
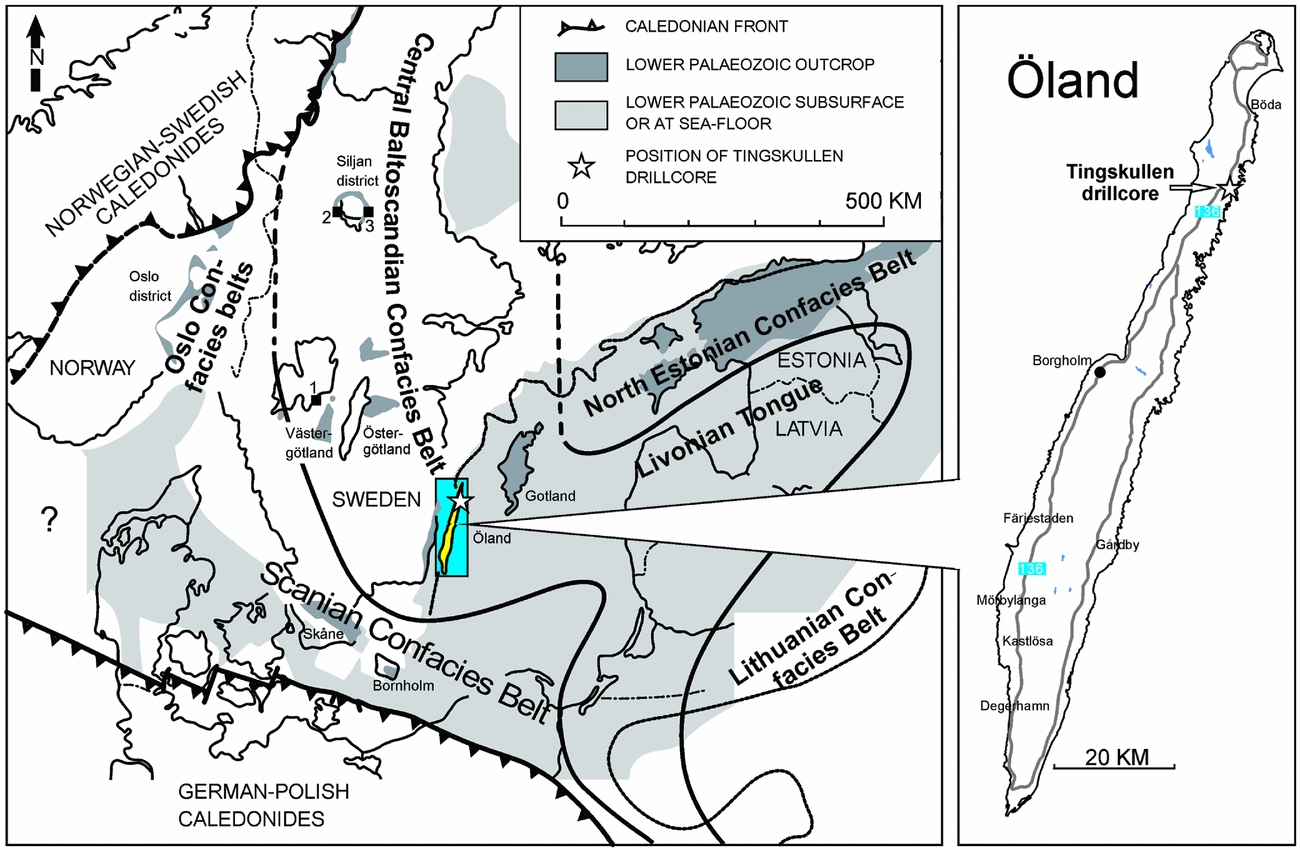
During Middle–Late Ordovician times, the Baltic palaeoplate was situated between 60° and 30°S (Torsvik et al. Reference Torsvik, Smethurst, Van der Voo, Trench, Abrahamsen and Halvorsen1992), moving towards the equator and covered by a shallow epicontinental sea. Based on lithofacies distribution and faunal composition in the Middle Ordovician, the sediments have been subdivided into three broad facies belts representing the Early through Middle Ordovician bathymetry of the basin (the confacies belts of Jaanusson, Reference Jaanusson and Bassett1976, Reference Jaanusson1995; Fig. 1). The island of Öland in the Baltic Sea lies within the Central Baltoscandian Confacies Belt, where the Ordovician succession is largely composed of ‘orthoceratite limestone’, characterized by low sedimentary rates and numerous hardgrounds (Jaanusson, Reference Jaanusson1961).

Figure 1. Ordovician palaeogeography of the Baltoscandian Basin modified from Pärnaste, Bergström & Zhou (Reference Pärnaste, Bergström and Zhou2013) and Bergström, Pärnaste & Zhou (Reference Bergström, Pärnaste and Zhou2013) showing the location of the Tingskullen drill core on Öland, southern Sweden and other Swedish core and outcrop sections mentioned in the text. 1 – Hällekis, Västergötland; 2 – Mora 001 core, Siljan district; 3 – Solberga 1 core, Siljan district.
The island of Öland is one of the classic areas for research on the Ordovician of Sweden. Limestone of Lower–Middle Ordovician age is distributed across the entire island with many natural exposures and abandoned as well as active quarries, especially along the western coastline of the island. Stouge (Reference Stouge, Munnecke, Servais and Schulbert2004) provided an overview on the stratigraphic terminology for the sedimentary succession on Öland, which is followed herein (Fig. 2). The Tingskullen core records the entire Lower and Middle Ordovician succession that is preserved on the island, including in ascending order the Djupvik, Köpingsklint, Bruddesta and Horns Udde formations, the Gillberga Formation (Formation A+B), Formation C+D, and the Segerstad, Skärlöv, Seby, Folkeslunda, Källa and Persnäs limestones (Fig. 3). All these formations are dominated by a fine-grained limestone with a bioclast composition typical for cool-water carbonates, i.e. devoid of reef-building biota or precipitated carbonate grains such as ooids. Calner et al. (Reference Calner, Lehnert, Wu, Dahlqvist and Joachimski2014) included a description of the lithological succession of this core and we only briefly outline the lithofacies for each formation herein.
Figure 2. Stratigraphic subdivision and unit names previously proposed for the Ordovician in Öland. lst – limestone.

Figure 3. Stratigraphy, distribution of conodont taxa and biostratigraphic subdivision of the Ordovician succession in the Tingskullen drill core from Öland.
The Djupvik Formation is composed of brownish shale with a thickness of 2 m, while the overlying Köpingsklint Formation is 0.5 m thick and dominated by grey, slightly pink lime mudstone and wackestone rich in trilobite and brachiopod bioclasts and a few glauconitic beds (Fig. 4a). The Bruddesta Formation consists of grey, reddish wackestone to packstone with many discontinuity surfaces and hardgrounds (Fig. 4b). Here, the most remarkable bed is the colourful ‘Blommiga Bladet’ hardground complex, which is widespread in Baltoscandia. The 2.5 m thick Horns Udde Formation is characterized by pale red to grey wackestone and packstone (Fig. 4c), which is overlain by the 6.7 m thick Gillberga Formation (Formation A+B) mainly composed of wackestone with abundant glauconite (Fig. 4d). Formation C+D (6.3 m) is dominated by grey packstone and grainstone with some coarser glauconite distributed in the lower part of the formation (Fig. 4e). The Segerstad Limestone is ~6.3 m thick and mainly comprises reddish wackestone and packstone (Figs 4f, 5a), while the overlying 3.3 m thick succession with red nodular wackestone and subordinate mudstone and packstone is referred to as the Skärlöv Limestone (Fig. 5b, c). The Seby Limestone is ~0.4 m thick and characterized by variegated, pale reddish wackestone. The Folkeslunda Limestone is composed of grey packstone with a thickness of 2.9 m (Fig. 5d). The Källa Limestone is ~3.1 m thick and comprises grey wackestone and packstone interbedded with finely nodular limestone (Fig. 5e). The topmost unit in the core and on the island is the Persnäs Limestone (~5.9 m in the core). It is characterized by grey wackestone with interbeds of finely nodular limestone. (Fig. 5f)

Figure 4. Photoplate showing typical microfacies of the Tingskullen drill core. The width of each photograph is 40 mm, corresponding to the diameter of the core. (a) Skeletal wackestone with abundant glauconite grains in the Köpingsklint Formation (TKS-18). (b) Skeletal wackestone with thin clay seams, a hardground surface and borings. Note abundant, delicate bioclasts from trilobites (TKCS-11); lower part of the Bruddesta Formation. (c) Mudstone–wackestone with bioturbation (TKCS-9); lower part of the Horns Udde Formation. (d) Wackestone with abundant glauconite (TKCS-8); middle part of the Gillberga Formation (Formation A+B). (e) Packstone–grainstone with abundant glauconite (TKCS-7); lower part of Formation C+D. (f) Reddish grainstone of the lower Segerstad Limestone (TKCS-5).

Figure 5. Photoplate showing typical microfacies of the Tingskullen drill core. The width of each photograph is 40 mm, corresponding to the diameter of the core. (a) Reddish packstone–grainstone from the upper Segerstad Limestone (TKS-27). (b) Argillaceous, reddish wackestone with thin, irregular clay seams (TKCS-3); lower part of the Skärlöv Limestone. (c) Bioturbated skeletal packstone with borings (TKCS-4); upper part of the Skärlöv Limestone. (d) Bioturbated wackestone of the Folkeslunda Limestone (TKCS-2). (e) Argillaceous, bioturbated and nodular mudstone–wackestone with thin clay partings in the Källa Limestone (TKS-30). (f) Argillaceous, nodular wackestone–packstone with thin clay partings in the Persnäs Limestone (TKCS-1).
3. Material and methods
The Tingskullen core was recovered in 2010 from the northeastern part of the island of Öland (about 700 m NE of the church ruin at Källa Hamn, and south of Tingskullsgatan at N57.116172, E16.993013; Fig. 1). The total length of the core is 111 m (Ø 40 mm) and drilling was terminated a few metres down in quartz arenites of the Cambrian Series 2. The Ordovician part of the core is ~46 m thick. The core is stored at the Department of Geology, Lund University.
A total of 29 conodont samples were collected from the core in order to constrain the carbon isotope chemostratigraphy. The conodont samples were processed at the Department of Geology, Lund University, with diluted, buffered acetic acid, and the residues were separated by use of heavy liquid (sodium polytungstate) following the techniques proposed by Jeppsson, Anehus & Fredholm (Reference Jeppsson, Anehus and Fredholm1999). All residues were hand-picked for conodonts, and all conodont elements were well preserved exhibiting a Colour Alteration Index (CAI) of 1 (cf. Epstein, Epstein & Harris, Reference Epstein, Epstein and Harris1977). The photographs of the figured specimens were taken in a Scanning Electron Microscope (Hitachi 3400N). All figured elements (LO12096t through LO12162t; repository number LO – for Lund Original) are stored in the type collection at the Department of Geology, Lund University.
For δ13Ccarb analysis, sample powders were recovered from the fresh core surface by use of a handheld electric drill with a drill bit that had a diameter of ~1–2 mm. Samples were recovered from the matrix of the rock while larger bioclasts and calcite veins were avoided.
Carbonate powders were reacted with 100% phosphoric acid at 70°C using a Gasbench II connected to a ThermoFinnigan Five Plus mass spectrometer. The analyses were carried out at the Geocentre of Northern Bavaria in Erlangen (Germany), and all values are reported in per mil relative to the V-PDB (Vienna Pee Dee Belemnite) by assigning δ13C and δ18O values +1.95‰ and −2.20‰ to international standard NBS19 and −46.6‰ and −26.7‰ to international standard LSVEC, respectively. Uncertainties of better than ± 0.05‰ (1σ) for δ13C and better than ± 0.07‰ (1σ) for δ18O analyses were checked by replicate analyses of laboratory standards calibrated to NBS19 and LSVEC.
4. Results
4.a. Conodont biostratigraphy
In the Ordovician limestone succession of the Tingskullen core, more than 50 conodont species belonging to 29 genera have been identified, and 12 conodont zones and 6 subzones have been recognized. These are the Oepikodus evae, Trapezognathus diprion, Baltoniodus triangularis, B. navis, B. norrlandicus, Lenodus antivariabilis, L. variabilis, Yangtzeplacognathus crassus, Eoplacognathus pseudoplanus, E. suecicus, Pygodus serra and P. anserinus zones in ascending order. In addition, the E. pseudoplanus Zone is subdivided into two subzones, i.e. the Microzarkodina hagetiana Subzone and the overlying M. ozarkodella Subzone, while the P. serra Zone comprises the E. foliaceus, E. reclinatus, E. robustus and E. lindstroemi subzones in ascending order (Fig. 3).
4.a.1. Oepikodus evae Zone (c. 42.27‒43.24 m)
Lindström (Reference Lindström1971) introduced the O. evae Zone in the Baltoscandian succession. In the present study, the definition of the Oepikodus evae Zone agrees with that of Bagnoli & Stouge (Reference Bagnoli and Stouge1997), characterized at the base by the first appearance (FAD) of the index species and at the top by the FAD of Trapezognathus diprion (Fig. 6u). The O. evae Zone in the Tingskullen core can be correlated to the lower part of the O. evae Zone of Lindström (Reference Lindström1971), where O. evae (Fig. 7q, r) is abundant. Besides O. evae, Drepanoistodus forceps (Fig. 7s, t), Paroistodus proteus, Oistodus lanceolatus (Fig. 7x, y) and Stolodus stola are quite common in this zone. In addition, Periodon flabellum (Fig. 7aa), Protopanderodus rectus (Fig. 7ad, ae) and Paroistodus parallelus (Fig. 7ab, ac) are present. The O. evae Zone has been reported from South China, Argentina and North America (Serpagli, Reference Serpagli1974; An, Reference An1987; Stouge & Bagnoli, Reference Stouge and Bagnoli1988). This zone is middle Floian in age.
Figure 6. Conodonts from the Tingskullen drill core. (a, b) Eoplacognathus reclinatus (Fåhræus): (a) Pa element from sample TKS-29, LO12096t; (b) Pb element from sample TKS-29, LO12097t. (c, d) Eoplacognathus robustus (Bergström), Pb elements from sample TKS-31, LO12098t, LO12099t. (e, f) Eoplacognathus lindstroemi (Hamar): (e) Pb element from sample TKS-32A, LO12100t; (f) Pa element from sample TKS-32A, LO12101t. (g) Histiodella kristinae Stouge, P element from sample TKS-26A, LO12102t. (h–j) Eoplacognathus pseudoplanus (Viira): (h) M element from sample TKS-23A, LO12103t; (i) Pb element from sample TKS-23A, LO12104t; (j) Pa element from sample TKS-23A, LO12105t. (k, l) Lenodus antivariabilis (An): (k) Sb element from sample TKS-22A1, LO12106t; (l) M element from sample TKS-22B1, LO12107t. (m–o) Lenodus variabilis (Sergeeva): (m) Pa element from sample TKS-22C, LO12108t; (n) Sc element from sample TKS-22C, LO12109t; (o) Pb element from sample TKS-22C, LO12110t. (p, q) Microzarkodina parva Lindström: (p) P element from sample TKS-22A1, LO12111t; (q) P element from sample TKCS-9, LO12112t. (r) Microzarkodina flabellum (Lindström), P element from sample TKCS-10, LO12113t. (s) Microzarkodina hagetiana Stouge & Bagnoli, P element from sample TKS-23A, LO12114t. (t) Microzarkodina ozarkodella Lindström, P element from sample TKS-24A, LO12115t. (u) Trapezognathus diprion (Lindström), P element from sample TKS-20, LO12116t. (v) Eoplacognathus foliaceus (Fåhræus), Pb element from sample TKS-28A, LO12117t. (w) Sagittodontina? cf. kielcensis (Dzik), Pb element from sample TKS-27B, LO12118t. (x, y) Lenodus sp.: (x) Pb element from sample TKS-22D, LO12119t; (y) Sc element from sample TKS-22D, LO12120t. (z) Pygodus serra (Hadding), Pa element from sample TKS-31, LO12121t. (aa) Pygodus anserinus Lamont & Lindström, Pa element from sample TKS-32A, LO12122t. (ab, ac) Oslodus semisymmetricus (Hamar): (ab) M element from sample TK-TOP, LO12123t; (ac) S element from sample TK-TOP, LO12124t. (ad) Panderodus sulcatus (Fåhræus), S element from sample TK-TOP, LO12125t. (ae) Venoistodus venustus (Stauffer), M element from sample TKS-27, LO12126t. (af) Costiconus costatus (Dzik), S element from sample TKS-27, LO12127t. (ag, ah) Protopanderodus calceatus Bagnoli & Stouge: (ag) S element from sample TKS-27, LO12128t; (ah) M element from sample TKS-27, LO12129t.
Figure 7. Conodonts from the Tingskullen drillcore. (a–e) Baltoniodus triangularis (Lindström): (a) Pb element from sample TKCS-11, LO12130t; (b) Pa element from sample TKCS-11, LO12131t; (c) Pa element from sample TKCS-11, LO12132t; (d) M element from sample TKCS-11, LO12133t; (e) Sa element from sample TKCS-11, LO12134t. (f–h) Baltoniodus navis (Lindström): (f) M element from sample TKS-21C, LO12135t; (g) Pa element from sample TKCS-10, LO12136t; (h) Pa element from sample TKS-21A, LO12137t. (i, j) Baltoniodus norrlandicus (Löfgren): (i) Pb element from sample TKCS-9, LO12138t; (j) Sc element from sample TKCS-9, LO12139t. (k–n) Baltoniodus prevariabilis (Fåhræus): (k) M element from sample TK-TOP, LO12140t; (l) Sc element from sample TK-TOP, LO12141t; (m) Pb element from sample TK-TOP, LO12142t; (n) Pa element from sample TK-TOP, LO12143t. (o, p) Baltoniodus medius (Dzik): (o) Pa element from sample TKS-24A, LO12144t; (p) Sc element from sample TKS-24A, LO12145t. (q, r) Oepikodus evae (Lindström): (q) P element from sample TKS-16, LO12146t; (r) S element from sample TKS-17, LO12147t. (s, t) Drepanoistodus forceps (Lindström): (s) M element from sample TKS-17, LO12148t; (t) S element from sample TKS-17, LO12149t. (u) Drepanoistodus basiovalis (Sergeeva), M element from sample TKCS-10, LO12150t. (v, w) Paroistodus originalis (Sergeeva): (v) M element from sample TKCS-10, LO12151t; (w) S element from sample TKCS-10, LO12152t. (x, y) Oistodus lanceolatus Pander: (x) M element from sample TKS-18, LO12153t; (y) Sb element from sample TKS-19, LO12154t. (z) Dapsilodus viruensis (Fåhræus), S element from sample TKS-26B, LO12155t. (aa) Periodon flabellum (Lindström), Pa element from sample TKS-17, LO12156t. (ab, ac) Paroistodus parallelus (Pander), S elements from sample TKS-18, LO12157t, LO12158t. (ad, ae) Protopanderodus rectus (Lindström): (ad) S element from sample TKCS-11, LO12159t; (ae) M element from sample TKCS-11, LO12160t. (af, ag) Triangulodus brevibasis (Sergeeva): (af) Sb element from sample TKS-21A, LO12161t; (ag) P element from sample TKS-21A, LO12162t.
4.a.2. Trapezognathus diprion Zone (c. 41.14‒42.27 m)
Bagnoli & Stouge (Reference Bagnoli and Stouge1997) defined this zone as representing the interval ranging from the FAD of Trapezognathus diprion to the FAD of Microzarkodina russica according to the succession on Öland, Sweden. However, Microzarkodina russica is absent in our material from the Tingskullen core, which may be owing to the small number of core samples. The top of the present T. diprion Zone, however, is marked by the base of the overlying Baltoniodus triangularis Zone. The associated fauna includes D. forceps, Oistodus lanceolatus, Stolodus stola, Cornuodus longibasis, etc. O. evae disappears in this zone. This zone in the present study is interpreted to be late Floian in age, coinciding with the upper O. evae Zone of Lindström (Reference Lindström1971), and including the T. diprion and M. russica zones of Bagnoli & Stouge (Reference Bagnoli and Stouge1997). The same zone was also reported from South China (Li et al. Reference Li, Stouge, Chen, Wang, Wang and Zeng2010).
4.a.3. Baltoniodus triangularis Zone (c. 38.9‒41.14 m)
This zone starts with the FAD of Baltoniodus triangularis, while its top is marked by the FAD of B. navis. Only one sample (TKCS-11) yielding the index taxon (Fig. 7a–e) was recovered from the Tingskullen core. Other species in this level are represented by Protopanderodus rectus, T. diprion, Scolopodus rex, D. forceps and C. longibasis. B. triangularis, which has a wide palaeogeographic distribution, has been ratified as the index species of the basal Dapingian (Wang et al. Reference Wang, Stouge, Erdtmann, Chen, Li, Wang, Zeng, Zhou and Cheng2005, Reference Wang, Stouge, Chen, Li, Wang, Finney, Zeng, Chen and Erdtmann2009). Thus, the B. triangularis Zone in this study could be correlated to the B. triangularis and Microzarkodina flabellum zones of Bagnoli & Stouge (Reference Bagnoli and Stouge1997), and indicates an early Dapingian age.
4.a.4. Baltoniodus navis Zone (c. 37.45‒38.9 m)
The base of the B. navis Zone is marked by the FAD of B. navis (Fig. 7f–h), and its top by the FAD of B. norrlandicus. Except for B. navis, five other important species, i.e. Paroistodus originalis (Fig. 7v, w), Drepanoistodus basiovalis (Fig. 7u), M. flabellum (Fig. 6r), Scalpellodus latus and Trapezognathus quadrangulum, occur in this zone in the Tingskullen core for the first time. An abundance of P. originalis may indicate that the present interval of the B. navis Zone can be correlated to the P. originalis Zone of Löfgren (Reference Löfgren1994).
4.a.5. Baltoniodus norrlandicus Zone (c. 34.95‒37.45 m)
Bagnoli & Stouge (Reference Bagnoli and Stouge1997) introduced this zone for the Ordovician succession on Öland, characterized at the base by the FAD of B. norrlandicus (Fig. 7i, j). Its top is defined by the FAD of Lenodus antivariabilis. This zone is recorded in the Horns Udde Formation. Protopanderodus calceatus appears in this zone, and other associated species including P. rectus, D. basiovalis, Microzarkodina parva (Fig. 6p, q) and S. latus are common. A similar faunal assemblage, i.e. the B. norrlandicus–M. parva Zone, was observed on the Yangtze Platform succession by Wang & Bergström (Reference Wang and Bergström1999). They argued that the base of the Darriwilian is located in the upper part of this zone.
4.a.6. Lenodus antivariabilis Zone (c. 31.5‒34.95 m)
The Lenodus antivariabilis Zone was established by An (Reference An1981) based on the material from the Yangtze Platform. This zone can also be traced to Baltoscandia (Reference ZhangZhang, 1998b ). The L. antivariabilis Zone was defined by the FAD of the index species (Fig. 6k, l). Bagnoli & Stouge (Reference Bagnoli and Stouge1997) reported this zone from Öland. In the Tingskullen core, a few elements of L. antivariabilis are found in three samples (TKS-22, TKS-22A1, TKS-22B1) from the lower part of the Gillberga Formation (Formation A+B). The conodont fauna is dominated by advanced elements of B. norrlandicus, D. basiovalis and Semiacontiodus cornuformis. Other important taxa, i.e. M. parva (Fig. 6p, q), Triangulodus brevibasis (Fig. 7af, ag) and Scalpellodus gracilis, appear in this zone, but are not frequent in this interval. This zone was interpreted to be earliest Darriwilian in age (Reference ZhangZhang, 1998b ; Wang & Bergström, Reference Wang and Bergström1999).
4.a.7. Lenodus variabilis Zone (c. 28.8‒31.5 m)
Lenodus variabilis is present in sample TKS-22C (Fig. 6m–o) from the middle part of the Gillberga Formation (Formation A+B). The L. variabilis Zone is marked at the base by the FAD of the nominate species, and its top is characterized by the FAD of Y. crassus. This zone has been widely reported from the Baltoscandian and Yangtze platforms (Reference ZhangZhang, 1998a ,b; Löfgren, Reference Löfgren2003). Only one sample from the upper part of the Gillberga Formation (Formation A+B) yields a few elements of L. variabilis, indicating the presence of the L. variabilis Zone. Besides the index taxon, the conodont fauna includes Baltoniodus medius, S. cornuformis and D. basiovalis. Reference ZhangZhang (1998b) documented that B. medius occurred in the upper L. variabilis Zone on the Yangtze Platform for the first time. Thus, it may indicate that the interval of the L. variabilis Zone present in the Tingskullen core only represents the upper part of the zone.
4.a.8. Yangtzeplacognathus crassus Zone (c. 27.0‒28.8 m)
Reference ZhangZhang (1998b) introduced the Y. crassus Zone based on the Middle Ordovician succession on the Yangtze Platform. The Y. crassus Zone is characterized by the FAD of the nominate species. The Y. crassus Zone has been reported by Löfgren (Reference Löfgren2000) in the uppermost Gillberga Formation from the Gillberga quarry, northern Öland. In the Tingskullen core, however, we have not found Y. crassus, which may be owing to the small sampling size herein. However, a few advanced elements of Lenodus (Lenodus sp., Fig. 6x, y) occurred in sample TKS-22D. Thus, we provisionally locate the Y. crassus Zone just above the level of TKS-22D with a thickness of 1.8 m in the uppermost Gillberga Formation (Formation A+B). The conodont fauna is dominated by B. medius. Other species present include Microzarkodina bella, S. gracilis, D. basiovalis and Drepanodus arcuatus.
4.a.9. Eoplacognathus pseudoplanus Zone: Microzarkodina hagetiana Subzone (c. 23.75‒27.0 m)
The E. pseudoplanus Zone was introduced by Viira (Reference Viira1974) for the upper Kunda Stage. It can be subdivided into two subzones, i.e. the M. hagetiana and M. ozarkodella subzones in ascending order (Reference ZhangZhang, 1998a ). According to the material from the Yangtze Platform, Reference ZhangZhang (1998b) correlated the E. pseudoplanus Zone with the Dzikodus tablepointensis Zone. The M. hagetiana Subzone is marked by the disappearance of Y. crassus (Reference ZhangZhang, 1998b ). This subzone yields E. pseudoplanus (Fig. 6h–j) and is represented by two samples (TKS-23A, TKS-24) in the Tingskullen core and has a thickness of approximately 3.25 m. B. medius and S. cornuformis are common. Other associated species are M. hagetiana (Fig. 6s), D. arcuatus, C. longibasis, D. basiovalis, S. latus, S. gracilis, Venoistodus venustus and Dapsilodus viruensis.
4.a.10. Eoplacognathus pseudoplanus Zone: Microzarkodina ozarkodella Subzone (c. 18.4‒23.75 m)
The base of this subzone is defined by the FAD of M. ozarkodella (Fig. 6t). The characteristic M. ozarkodella was recovered in sample TKS-24A. This subzone has a thickness of 5.35 m, ranging from 18.4 m to 23.75 m in the Tingskullen core. B. medius, D. basiovalis and D. viruensis are quite common in this subzone. Other taxa appearing in this subzone for the first time include Protopanderodus graeai, Dzikodus tablepointensis, Baltoniodus prevariabilis (Fig. 7k–n), Histiodella kristinae (Fig. 6g) and Costiconus costatus. Dapsilodus viruensis (Fig. 7z) is present in this subzone and ranges up to the top of the core section.
4.a.11. Eoplacognathus suecicus Zone (c. 12.05‒18.4 m)
Bergström (Reference Bergström1971) established the E. suecicus Subzone within the Pygodus serra Zone. However, the following studies proposed a separate E. suecicus Zone, marked by the FAD of the nominate species (Löfgren, Reference Löfgren1978; Zhang & Sturkell, Reference Zhang and Sturkell1998). This definition is followed herein. The E. suecicus Zone is about 6.35 m thick in the Tingskullen core, including the upper Segerstad, Skärlöv and Seby limestones. Apart from E. suecicus, Sagittodontina? cf. kielcensis (Fig. 6w) and Panderodus sulcatus (Fig. 6ad) occur in this zone for the first time. Other taxa, such as B. prevariabilis, P. graeai, D. viruensis and S. cornuformis, are very common and associated with C. costatus (Fig. 6af), V. venustus (Fig. 6ae) and P. calceatus (Fig. 6ag, ah).
4.a.12. Pygodus serra Zone: Eoplacognathus foliaceus Subzone (c. 9.45‒12.05 m)
We follow the definition of the E. foliaceus Subzone by Bergström (Reference Bergström1971). Its base is marked by the FAD of the nominate species (Fig. 6v), while its top is characterized by the FAD of E. reclinatus. A few specimens of E. foliaceus occur in sample TKS-28A. Besides E. foliaceus, P. graeai, D. basiovalis, S. cornuformis, B. prevariabilis, D. viruensis and P. sulcatus are common in this interval. Most of the taxa extend into the following zone. P. serra is absent in this subzone.
4.a.13. Pygodus serra Zone: Eoplacognathus reclinatus Subzone (c. 7.0‒9.45 m)
The E. reclinatus Subzone is marked by the FAD of the index species (Fig. 6a, b). In the Tingskullen core, the E. reclinatus Subzone has a thickness of 2.45 m. The conodont fauna is dominated by B. prevariabilis, P. graeai and D. viruensis. The E. reclinatus Subzone is quite common in Baltoscandia.
4.a.14. Pygodus serra Zone: Eoplacognathus robustus and E. lindstroemi subzones (c. 4.5‒7.0 m)
As demonstrated by Bergström (Reference Bergström1971), the base of the E. robustus Subzone is characterized by the FAD of the nominate species (Fig. 6c, d). In the Tingskullen core, this subzone is 2.5 m thick. Apart from E. robustus, P. serra (Fig. 6z) occurs in this subzone in the Tingskullen core for the first time. Other commonly associated species include B. prevariabilis, C. costatus, D. viruensis, S. cornuformis and D. basiovalis.
The overlying E. lindstroemi Subzone is not recorded from the Tingskullen core, which presumably is caused by too widely spaced samples. But the index species of the E. lindstroemi Subzone of the P. serra Zone has been recovered only from the base of the overlying P. anserinus Zone where E. lindstroemi co-occurs with P. anserinus in sample TKS-32A.
4.a.15. Pygodus anserinus Zone (c. 0‒4.5 m)
The topmost 4.5 m in the Tingskullen core are correlated to the P. anserinus Zone. This zone was introduced by the FAD of P. anserinus (Fig. 6aa). Most of the species that occurred in this zone are extended from the underlying P. serra Zone. P. sulcatus, B. prevariabilis, D. basiovalis and S. cornuformis are quite common in this part of the succession. Except for the index species, Oslodus semisymmetricus (Fig. 6ab, ac) and E. lindstroemi (Fig. 6e, f) are recorded at the base of this zone for the first time (sample TKS-32A).
4.b. δ13Ccarb chemostratigraphy
The carbon isotope stratigraphy of the Tingskullen core was first dealt with by Calner et al. (Reference Calner, Lehnert, Wu, Dahlqvist and Joachimski2014). Their dataset is herein expanded and related to the conodont biostratigraphy presented above (Fig. 8).

Figure 8. High-resolution δ13C chemostratigraphy of the Ordovician succession in the Tingskullen drill core from Öland, southeastern Sweden. The Middle Darriwilian Isotope Carbon Excursion (MDICE) is exceptionally well preserved, showing a rising limb through the Eoplacognathus pseudoplanus conodont Zone, a distinct peak interval scattering around 1.5–2.0‰ in the Eoplacognathus suecicus Zone, and a falling limb that corresponds to the Pygodus serra and Pygodus anserinus conodont zones.
A low variability in the δ13Ccarb dataset can be seen in the interval spanning the Köpingsklint Formation to the Gillberga Formation (Formation A+B). There, the values vary between c. 0 and 0.8‰. A prominent positive trend is detected in the Bruddesta Formation in which δ13Ccarb values increase from c. 0.05‰ to c. 0.6‰ in the O. evae and B. triangularis zones. Another positive trend is present from the upper Bruddesta Formation to the lower Horns Udde Formation, corresponding to the upper B. triangularis through the lower B. norrlandicus zones. A minor negative shift in δ13Ccarb values is observed in the upper Horns Udde Formation, biostratigraphically corresponding to the upper B. norrlandicus Zone. Low values, scattering between 0.2‰ and 0.5‰, are recorded from an interval spanning the L. antivariabilis and Y. crassus zones in the Gillberga Formation (Formation A+B).
The complete MDICE with a clear rising limb, peak interval and falling limb is observed through the middle and upper parts of the Tingskullen core. δ13Ccarb values of the MDICE start to increase within the M. hagetiana Subzone in the middle part of Formation C+D, and reach a first peak with values of about 1.2‰ in the lowermost Segerstad Limestone (middle M. ozarkodella Subzone). This first peak is followed by a minor negative shift in the upper M. ozarkodella Subzone. Thus, the rising limb of the MDICE largely covers the E. pseudoplanus Zone. The major positive shift of the MDICE, reaching between c. 1.5 and 2.0‰ (peak value at 1.95‰), occurs in the E. suecicus Zone. The peak interval of the MDICE spans the upper Segerstad, Skärlöv and Seby limestones. The falling limb of the MDICE starts in the E. foliaceus Subzone of the P. serra Zone, while lower δ13Ccarb values scattered around the baseline values of about 1‰ are recognized in the interval correlated to the E. reclinatus and E. robustus subzones of the P. serra Zone just before a continuous negative trend in the δ13Ccarb values is documented from the P. anserinus Zone in the topmost part of the Tingskullen core.
5. Discussion
5.a. Diagenesis in the Tingskullen succession
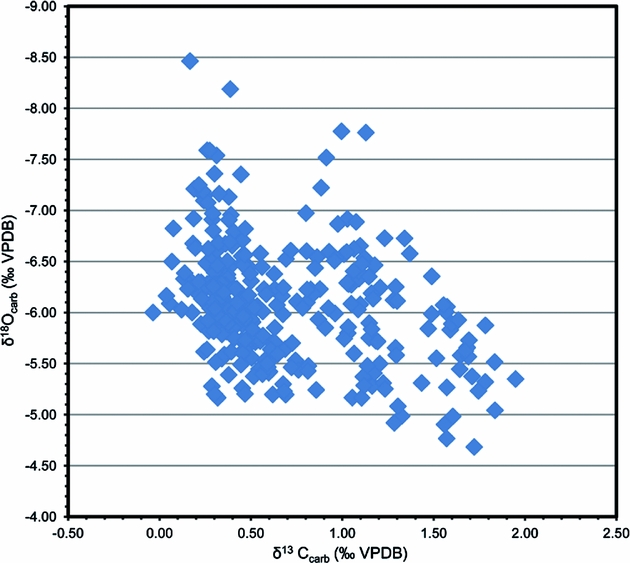
Our petrographic observations demonstrate that the analysed samples include lime mudstone, wackestone and some packstone, with bioclasts dominated by trilobites, brachiopods, cephalopods and echinoderms. Conodont elements from the Tingskullen core display CAI values of 1, suggesting that the Ordovician succession in this core is thermally nearly unaltered. The cross-plot of δ13Ccarb and δ18Ocarb shows no obvious correlation between them (R2 = 0.1136), and the values of δ18Ocarb are from 4.5‰ to 8.5‰ (Fig. 9), indicating that the samples from the Tingskullen core have great potential to preserve primary carbon isotope signatures (cf. Banner & Hanson, Reference Banner and Hanson1990; Marshall, Reference Marshall1992).

Figure 9. Cross-plot of δ13C and δ18O data from the Tingskullen drill core.
5.b. Potential for correlation of the δ13Ccarb record
In this section we evaluate the potential for correlation of the Tingskullen core δ13Ccarb record. Ainsaar et al. (Reference Ainsaar, Kaljo, Martma, Meidla, Männik, Nõlvak and Tinn2010) documented a composite carbon isotope curve for the Middle and Upper Ordovician of Baltoscandia based on data from drill cores and outcrop sections in Estonia, Latvia and Sweden. They subdivided their δ13Ccarb composite profile into 17 carbon isotopic zones, referred to as Baltic Carbon (BC) 1–17, of which BC1 marked the base of the Dapingian. With the exception of those from the Köpingsklint and lower Bruddesta formations, the data from the Ordovician succession in the Tingskullen core are largely assigned to the lowermost four isotopic zones of Ainsaar et al. (Reference Ainsaar, Kaljo, Martma, Meidla, Männik, Nõlvak and Tinn2010), i.e. BC1–BC4. The BC1 zone includes the lower part of the Tingskullen core with low values of δ13Ccarb spanning the upper Bruddesta Formation through Gillberga Formation, an interval that comprises the B. triangularis to Y. crassus conodont zones. Although there is only little variation in the δ13Ccarb values in the lower part of the Tingskullen core, it merits making a detailed intra- and intercontinental correlation when supported by conodont biostratigraphy. A positive shift in δ13Ccarb values occurs during the upper Floian through lower Dapingian in the succession including the Köpingsklint and lower Bruddesta formations in the Tingskullen core (O. evae and B. triangularis zones). This excursion has been well documented in coeval strata from the Siljan area in central Sweden (Lehnert et al. Reference Lehnert, Meinhold, Wu, Calner and Joachimski2014), the Precordillera of western Argentina (Buggisch, Keller & Lehnert, Reference Buggisch, Keller and Lehnert2003) and possibly in North China (Guo et al. Reference Guo, Zhao, Xu, Shi, Gao, Bao, Liu, Zhang and Zhang2014) (Figs 10, 11). Edwards & Saltzman (Reference Edwards and Saltzman2014) observed a similar trend in the same stratigraphical interval in the Shingle Pass and Ibex sections in western North America (Fig. 10).
Figure 10. Comparison of the δ13C records from the Tingskullen core (this study), Precordillera (Buggisch, Keller & Lehnert, Reference Buggisch, Keller and Lehnert2003), Nevada, USA (Edwards & Saltzman, Reference Edwards and Saltzman2014), Maryland, USA (Leslie et al. Reference Leslie, Saltzman, Bergström, Repetski, Howard, Seward, Gutiérrez-Marco, Rábano and Diego2011) and North China (Guo et al. Reference Guo, Zhao, Xu, Shi, Gao, Bao, Liu, Zhang and Zhang2014). The numbers 1–3 in the δ13C record from the Tingskullen core refer to the rising limb, the peak interval and the falling limb of the MDICE, respectively. Note the very high condensation of strata in the Tingskullen core, as indicated by scale bars.

Figure 11. Comparison of the δ13C records from the Tingskullen core (this study), Hällekis quarry of southern Sweden (Schmitz, Bergström & Wang, Reference Schmitz, Bergström and Wang2010), Mora 001 and Solberga 1 cores from the Siljan area of central Sweden (Lehnert et al. Reference Lehnert, Meinhold, Wu, Calner and Joachimski2014), Mehikoorma 421 core of Estonia (Ainsaar et al. Reference Ainsaar, Kaljo, Martma, Meidla, Männik, Nõlvak and Tinn2010) and South China (Schmitz, Bergström & Wang, Reference Schmitz, Bergström and Wang2010). The numbers 1–3 in the δ13C record from the Tingskullen core refer to the rising limb, the peak interval and the falling limb of the MDICE, respectively.
As indicated by a few earlier studies (Kaljo, Martma & Saadre, Reference Kaljo, Martma and Saadre2007; Schmitz, Bergström & Wang, Reference Schmitz, Bergström and Wang2010; Ainsaar et al. Reference Ainsaar, Kaljo, Martma, Meidla, Männik, Nõlvak and Tinn2010; Leslie et al. Reference Leslie, Saltzman, Bergström, Repetski, Howard, Seward, Gutiérrez-Marco, Rábano and Diego2011; Albanesi et al. Reference Albanesi, Bergström, Schmitz, Serra, Feltes, Voldman and Ortega2013) and as further strengthened by our data, the MDICE reflects a global anomaly in the global carbon cycle within the Darriwilian and thus is a useful chemostratigraphic marker for global correlation. The tripartite subdivision of the MDICE in the Tingskullen core, showing a rising limb, a peak interval and a falling limb, can be correlated with the BC2, BC3 and part of the BC4 zones of Ainsaar et al. (Reference Ainsaar, Kaljo, Martma, Meidla, Männik, Nõlvak and Tinn2010), respectively. Schmitz, Bergström & Wang (Reference Schmitz, Bergström and Wang2010) documented the MDICE from the Hällekis quarry, southern Sweden, and the Maocaopu and Puxi river sections, South China, where only the rising and falling limbs are preserved (Fig. 11). These sections seem to lack the peak interval of the MDICE when compared to the detailed δ13Ccarb record from the Tingskullen core. Guo et al. (Reference Guo, Zhao, Xu, Shi, Gao, Bao, Liu, Zhang and Zhang2014) documented one δ13Ccarb curve from the Ordos Basin on the North China Palaeoplate, showing one significant excursion with an offset of c. 2.5‰ within the Klimoli Formation, whose age falls in the Darriwilian, with the conodont Histiodella kristinae Zone and the graptolite Pterograptus elegans and Didymograptus murchisoni zones recorded (Wang et al. Reference Wang, Bergström, Zhen, Chen and Zhang2013) (Fig. 10). As such, we suggest that the positive shift in the Klimoli Formation represents the MDICE in the North China Palaeoplate. Furthermore, a Darriwilian δ13Ccarb curve was reported from the Precordillera of Argentina (Albanesi et al. Reference Albanesi, Bergström, Schmitz, Serra, Feltes, Voldman and Ortega2013), where only the rising limb of the MDICE and the probable lower part of the peak interval are observed. The classic curve by Buggisch, Keller & Lehnert (Reference Buggisch, Keller and Lehnert2003) from the same region may only record the rising limb of the MDICE (Fig. 10). In addition, Leslie et al. (Reference Leslie, Saltzman, Bergström, Repetski, Howard, Seward, Gutiérrez-Marco, Rábano and Diego2011) observed a complete MDICE from the southern Appalachians spanning from the Histiodella holodentata to the Cahabagnathus sweeti conodont zones, while the peak interval of the MDICE is present in the uppermost H. holodentata and Phragmodus polonicus zones (Fig. 10). The δ13Ccarb record documented by Lehnert et al. (Reference Lehnert, Meinhold, Wu, Calner and Joachimski2014) from the Mora 001 and Solberga 1 cores clearly shows that the complete MDICE is preserved in the Siljan area of central Sweden (Fig. 11).
5.c. Concluding remarks about the MDICE
This paper does not attempt to explain the cause(s) for the MDICE, but should be seen as a stratigraphic paper providing the necessary data to confirm and further refine the MDICE as a global phenomenon useful for regional and intercontinental correlations. The Tingskullen core should be useful for continued study about the MDICE, and a few concluding remarks to put the MDICE in a wider context are necessary.
A series of studies now imply that the MDICE is of global significance, meaning that global processes account for its formation. Increased sequestration and burial of 12C started in the E. pseudoplanus Zone (or even in the Y. crassus Zone) and reached a maximum during the E. suecicus Zone before the process reversed. This global perturbation in the ocean–atmosphere system is of particular importance because it overlaps in time with important segments of one of the largest biodiversification events of the Phanerozoic: the Great Ordovician Biodiversification Event (GOBE; Webby et al. Reference Webby, Droser, Paris and Percival2004; Harper, Reference Harper2006; Servais et al. Reference Servais, Owen, Harper, Kröger and Munnecke2010). During the GOBE the marine biodiversity tripled at the family, genus and species levels, and it has been demonstrated that the increase in biodiversity was especially profound in the Darriwilian Age (Webby et al. Reference Webby, Droser, Paris and Percival2004; Harper, Reference Harper2006) corresponding in time with the MDICE. The cause for this major advance of marine life is debated and direct causal relationships remain unexplained. Among the proposed explanations are cooling of the global oceans following the demise of the Early–Mid Ordovician greenhouse world (Trotter et al. Reference Trotter, Williams, Barnes, Lécuyer and Nicoll2008), biological triggers such as increased levels of phytoplankton and primary production in the global oceans (Servais et al. Reference Servais, Lehnert, Li, Mullins, Munnecke, Nützel and Vecoli2008) and extraterrestrial forcing mechanisms (Schmitz et al. Reference Schmitz, Harper, Peucker-Ehrenbrink, Stouge, Alwmark, Chronholm, Bergström, Tassinari and Wang2008). Furthermore, it is worthy to note that acritarchs, possibly representing the marine primary productivity, reached their major biodiversity peak during Darriwilian time (Servais et al. Reference Servais, Lehnert, Li, Mullins, Munnecke, Nützel and Vecoli2008). Thus, we suggest that the increased primary productivity, induced by the concurrent phytoplankton (e.g. acritarch) diversification during Darriwilian time, may play an important role in the development of the MDICE.
6. Conclusions
Based on the cool-water carbonate succession (‘orthoceratite limestone’) of the Tingskullen core from Öland, southeastern Sweden, this study presents a high-resolution, integrated conodont biostratigraphy and carbon isotope chemostratigraphy for the Lower–Middle Ordovician of southern Sweden.
The major results can be concluded as follows:
(1) Based on the analysis of conodonts, the carbonate succession in the Tingskullen core ranges from the Oepikodus evae Zone through Pygodus anserinus Zone.
(2) The lower part of the core, including the succession from the Köpingsklint Formation through Gillberga Formation (Formation A+B), is characterized by only little variation in δ13Ccarb values. One positive excursion, however, with high potential for global correlation can be observed spanning the upper Köpingsklint and lower Bruddesta formations, an interval corresponding to the upper O. evae Zone and lower B. triangularis Zone.
(3) The Tingskullen core preserves one of the few and most complete records of the MDICE globally. This δ13Ccarb anomaly appears to be exceptionally well preserved and shows a rising limb in the E. pseudoplanus Zone, ranging from Formation C+D through most of the Segerstad Limestone, a peak interval (peak value 1.95‰) in the E. suecicus Zone, in the upper Segerstad, Skärlöv and Seby limestones, and a falling limb during the P. serra and P. anserinus zones, corresponding to the Folkeslunda, Källa and Persnäs limestones. Correlation is made to several other basins.
(4) The development of the MDICE is likely related to an increase in organic carbon burial rates as a result of a synchronous enhanced primary productivity, which may be indirectly extrapolated by the radiation of phytoplankton and diversification in major faunal groups. The cause for this radiation remains debated.
Acknowledgements
RCW and MC acknowledge the support by the Swedish Research Council. Crafoord Foundation grants 20050748 and 20080860 to MC made the recovery of the Borenshult and Tingskullen drill cores, respectively, possible. OL is very grateful for the support of this research by the Deutsche Forschungsgemeinschaft (DFG project LE 867/8-1 and 8-2). RCW acknowledges the support from the National Natural Science Foundation of China (41521061 and 41290260). We thank Prof. Michael Joachimski for excellent help with running the carbon isotope samples in his stable isotope laboratory at the Geocentre of Northern Bavaria in Erlangen (Germany). We acknowledge Prof. Birger Schmitz (Lund University) and one anonymous referee for their comments that have improved our manuscript. This paper is a contribution to the IGCP 591 project ‘The Early to Middle Paleozoic Revolution’.