1. Introduction
The combination of rapid evolution, high numerical abundance, and in many cases wide geographical distribution has resulted in the planktonic graptoloid graptolites assuming pre-eminent significance in the biostratigraphical division of strata, particularly those representing outer shelf and deeper marine facies, of Ordovician to Early Devonian age.
At the 2008 meeting of the International Palaeontological Association's Graptolite Working Group (GWG) in the Czech Republic it was decided that it would be desirable and useful to produce a set of correlation charts of the graptolite biozonal schemes used on different (palaeo-)continents. The task fell to the author who distributed in the spring of 2009 preliminary versions of charts to GWG members for their comments. Minor corrections and additions were suggested and the resultant revised charts were presented at the 2009 meeting of the GWG in Sardinia. Following discussion at that meeting, a few further minor changes were made to the charts. Since the Sardinia meeting, further papers have been published (Feng et al. Reference Feng, Li, Zhang, Erdtmann, Li and Wang2009; Maletz, Egenhoff & Alonso Reference Maletz, Egenhoff and Alonso2010; Maletz & Ahlberg, in press) and modifications made, resulting in the versions that are presented here.
It is hoped that these charts will prove useful to both graptolite workers and all those who require precise and accurate correlations for their Palaeozoic research.
2. The charts
In the charts (Figs 1–8), columns are provided by series for those areas that have been most intensively studied; these may or may not be those with the best graptolite record. In many areas much fundamental descriptive taxonomic and biostratigraphical research remains to be done. The charts represent the current state of knowledge, to be improved upon as new research is undertaken and published.

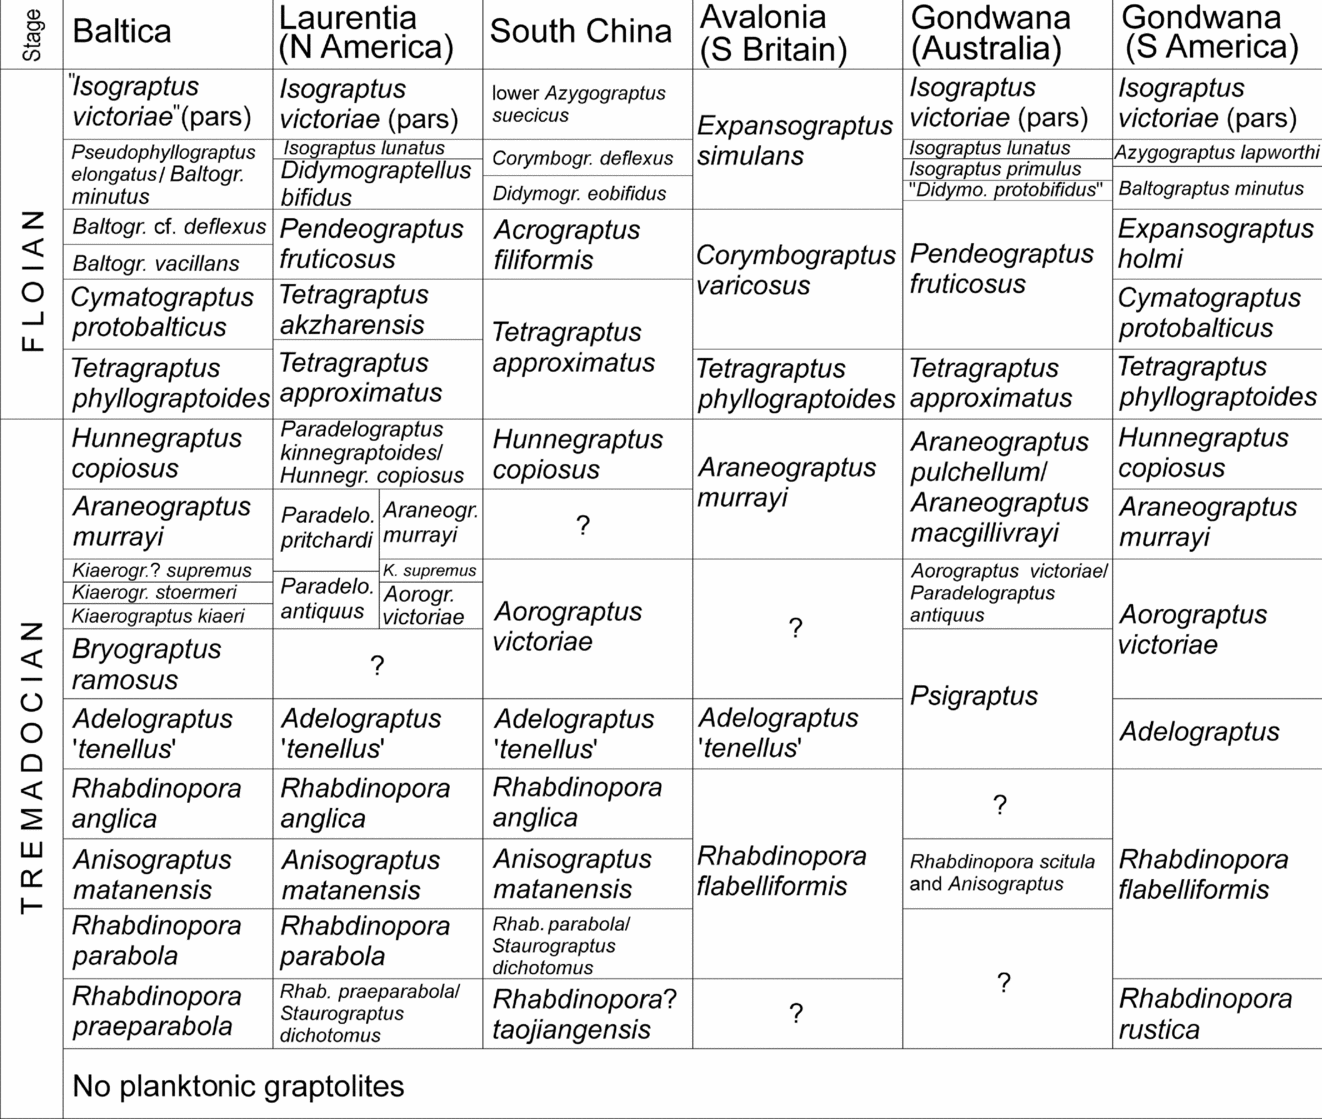
Figure 1. Correlation of Lower Ordovician graptolite biozones. Key references used in construction of the chart, in addition to those mentioned in the text: Albanesi & Ortega (Reference Albanesi and Ortega2002), Cooper (Reference Cooper1999), Egenhoff, Maletz & Erdtmann (Reference Egenhoff, Maletz and Erdtmann2004), Jackson & Lenz (Reference Jackson and Lenz2003), Lindholm (Reference Lindholm1991), Maletz & Ahlberg (in press), Maletz & Egenhoff (Reference Maletz and Egenhoff2001), Maletz, Egenhoff & Alonso (Reference Maletz, Egenhoff and Alonso2010), Toro & Maletz (Reference Toro and Maletz2008), Williams & Stevens (Reference Williams and Stevens1988).

Figure 2. Correlation of Middle Ordovician graptolite biozones. Key references used in construction of the chart, in addition to those mentioned in the text: Gutiérrez-Marco et al. (Reference Gutiérrez-Marco, Robardet, Rábano, Sarmiento, San José Lancha, Araújo, Pieren Pidal, Gibbons and Moreno2002), Kraft & Kraft (Reference Kraft and Kraft1999), Maletz (Reference Maletz1997a, Reference Maletzb, Reference Maletz2005), Maletz & Egenhoff (Reference Maletz and Egenhoff2001), Maletz & Ahlberg (in press).

Figure 3. Correlation of Upper Ordovician graptolite biozones. Key references used in construction of the chart, in addition to those mentioned in the text: Finney et al. (Reference Finney, Berry, Cooper, Ripperdan, Sweet, Jacobsen, Soufiane, Achab and Noble1999), Goldman et al. (Reference Goldman, Leslie, Nõlvak, Young, Bergström and Huff2007), Gutiérrez-Marco et al. (Reference Gutiérrez-Marco, Robardet, Rábano, Sarmiento, San José Lancha, Araújo, Pieren Pidal, Gibbons and Moreno2002), Koren', Ahlberg & Nielsen (Reference Koren', Ahlberg and Nielsen2003), Pålsson (Reference Pålsson2001, Reference Pålsson2002), Štorch & Leone (Reference Štorch and Leone2003), Štorch & Loydell (Reference Štorch and Loydell1996), VandenBerg & Cooper (Reference VandenBerg and Cooper1992). The Avalonian graptolite biozonation (Zalasiewicz et al. Reference Zalasiewicz, Taylor, Rushton, Loydell, Rickards and Williams2009, fig. 1) combines elements of the biozonations used in Baltica (Nemagraptus gracilis to Pleurograptus linearis biozones), in Scotland (Dicellograptus anceps Biozone) and globally (Normalograptus persculptus Biozone).

Figure 4. Correlation of Llandovery (Silurian) graptolite biozones. Key references used in construction of the chart, in addition to those mentioned in the text: Chen (Reference Chen1984), Chen, Rong & Fan (Reference Chen, Rong and Fan2003), Fu, Zhang & Geng (Reference Fu, Zhang and Geng2000), Legrand (Reference Legrand2003), Loydell, Männik & Nestor (Reference Loydell, Männik and Nestor2003), Melchin (Reference Melchin1989), Štorch (Reference Štorch1994), Štorch & Massa (Reference Štorch and Massa2006).

Figure 5. Correlation of Wenlock (Silurian) graptolite biozones. Key references used in construction of the chart, in addition to those mentioned in the text: Lenz & Kozłowska-Dawidziuk (Reference Lenz and Kozłowska-Dawidziuk2002), Lenz & Melchin (Reference Lenz and Melchin1991), Loydell, Männik & Nestor (Reference Loydell, Männik and Nestor2003), Piras, Simonetto & Corradini (Reference Piras, Simonetto and Corradini2008), Štorch (Reference Štorch1994), Urbanek & Teller (Reference Urbanek and Teller1997).
The base of the Wenlock Series is taken here for convenience as the base of the Cyrtograptus murchisoni Biozone. Based on chitinozoan evidence, the base of the Wenlock Series lies somewhere within the upper Cyrtograptus centrifugus to lower Cyrtograptus murchisoni Biozone interval (Mullins & Aldridge Reference Mullins and Aldridge2004).

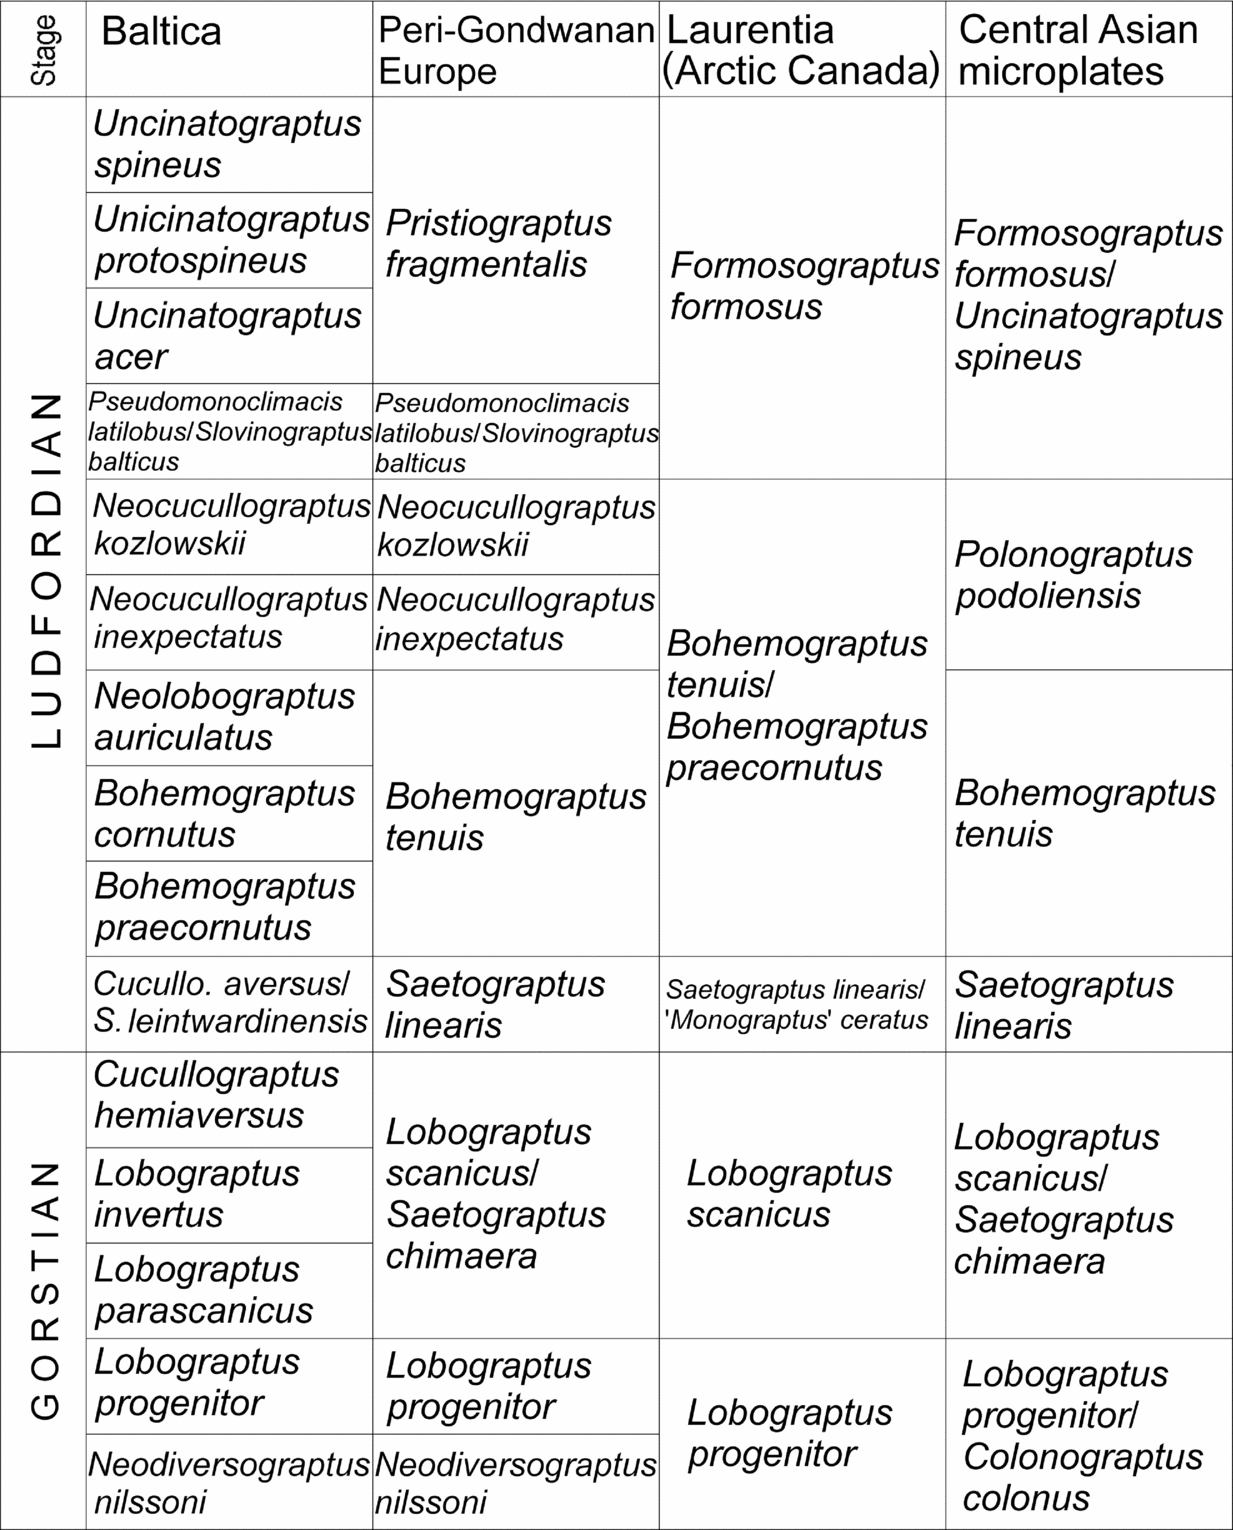
Figure 6. Correlation of Ludlow (Silurian) graptolite biozones. Key references used in construction of the chart, in addition to those mentioned in the text: Koren' & Sujarkova (Reference Koren' and Sujarkova2004), Lenz & Kozłowska-Dawidziuk (Reference Lenz and Kozłowska-Dawidziuk2004), P. Štorch (pers. comm.), Urbanek & Teller (Reference Urbanek and Teller1997).

Figure 7. Correlation of Přídolí (Silurian) graptolite biozones. Key references used in construction of the chart, in addition to those mentioned in the text: Koren' & Sujarkova (Reference Koren' and Sujarkova1997), Kříž et al. (Reference Kříž, Jaeger, Paris and Schönlaub1986), Lenz & Kozłowska-Dawidziuk (Reference Lenz and Kozłowska-Dawidziuk2004), Urbanek & Teller (Reference Urbanek and Teller1997).

Figure 8. Correlation of Lower Devonian graptolite biozones. Key references used in construction of the chart, in addition to those mentioned in the text: Chlupáč in Chlupáč et al. (Reference Chlupáč, Havlíček, Kříž, Kukal and Štorch1998), Koren' (Reference Koren'1975, Reference Koren'1978), Lenz (Reference Lenz1988), Lenz et al. (Reference Lenz, Robardet, Gutiérrez-Marco and Piçarra1996), Porębska (Reference Porębska1984).
In the majority of cases the column for any one series is a composite of biozones from a number of sections within the region indicated, e.g. for the Lower Ordovician of Laurentia (North America) the column combines the biozonations used in Newfoundland, Quebec and northern Yukon. The charts were constructed based upon data and correlations published within the references cited (and papers cited therein) in the figure captions for each chart. For Great Britain, the main source was the recent compilation by Zalasiewicz et al. (Reference Zalasiewicz, Taylor, Rushton, Loydell, Rickards and Williams2009) of the published stratigraphical ranges (excluding those in abstracts) of all graptolite species. The global correlations in Gradstein, Ogg & Smith (Reference Gradstein, Ogg and Smith2004) and for the Ordovician in Webby et al. (Reference Webby, Paris, Droser and Percival2004) have, where necessary, been amended and/or updated. The Chinese Ordovician columns are derived primarily from Zhan & Jin (Reference Zhan and Jin2007) and Zhang et al. (Reference Zhang, Chen, Yu, Goldman and Liu2007). For the Middle Ordovician and Katian some correlations of graptolite biozones are based upon chitinozoans, using the data in Webby et al. (Reference Webby, Paris, Droser and Percival2004). Definitions of the various graptolite biozones in the charts can be found in the literature cited; the bases of the majority of graptolite biozones are defined by the first appearance of the index species: this is true, for example, of every one of the Llandovery biozones in the Avalonia+Baltica column (Fig. 4). In very rare cases an interval is defined by the disappearance of a biozonal index (at its base) and the lack of any diagnostic taxa within it. A good example is the Pristiograptus dubius Biozone of the Wenlock (Fig. 5), characterized by extremely low diversity graptolite assemblages of long-ranging species (P. dubius itself appears in the Monograptus firmus Biozone). It is in intervals such as these that other fossil groups, particularly chitinozoans, have the potential to provide more precise biostratigraphical subdivision of graptolitic strata. Both of these types of graptolite biozones are interval zones as defined by the International Stratigraphic Guide (Salvador, Reference Salvador1994). A few, less precisely defined assemblage zones still exist, for example the Diplograptus foliaceus Biozone of the Sandbian (Fig. 3), but these are very much in the minority.
Where columns are split vertically (e.g. in Fig. 1, Laurentia; Fig. 2, South China), two different biozonal schemes, of different resolution, are used in the region concerned. A slash (/) is used to indicate biozones of approximate biostratigraphical equivalence. Single quotation marks around species’ names and double quotation marks around taxon names indicate that taxonomic revision of the material upon which the biozone is based in the region concerned is required or that the biozonal index species is absent or identification is uncertain. Sub-biozones are not included in the charts: in some regions, at some stratigraphical levels (e.g. the Telychian), several of the biozones can be divided into a number of sub-biozones (see Zalasiewicz et al. (Reference Zalasiewicz, Taylor, Rushton, Loydell, Rickards and Williams2009) for examples).
As research progresses, the stratigraphical resolution of graptolite biozones and precision in correlation will undoubtedly improve.
3. Average graptolite zone (chron) duration
There are very few reliable radiometric dates for the Ordovician–Early Devonian interval. Using the timescale in Ogg, Ogg & Gradstein (Reference Ogg, Ogg and Gradstein2008) and the biozonation for Baltica as an example, approximate average graptolite zone (or chron) durations for each epoch/age are as follows: Early Ordovician: c. 1 Ma; Middle Ordovician: c. 1 Ma; Late Ordovician: c. 2 Ma; Llandovery: c. 800000 years; Wenlock: c. 500000 years; Ludlow: c. 300000 years; Přídolí: c. 350000 years; Lochkovian: c. 2.4 Ma; Pragian: c. 1 Ma. It is not known the extent to which these apparent variations in duration are a result of inadequacies in the construction of the time scale used and radiometric age dates upon which it is based, the amount of work conducted on graptolites from the series concerned, variations in rates of graptolite evolution, ease of identifying biostratigraphically useful taxa, and/or eustatic sea-level change, which in part controls the geographical extent of graptolite-bearing strata available for study.
Acknowledgements
The members of the Graptolite Working Group are thanked for their comments on earlier versions of the charts presented here. I thank also three anonymous referees for their constructive reviews.


