1. Introduction
During the Late Cretaceous and earliest Palaeogene (100–61 Ma) the Chalk Group sediments were deposited in the North Sea Basin (Ziegler, Reference Ziegler1990). After several rifting pulses during the Triassic and Jurassic, post-rift thermal relaxation occurred in the North Sea Basin, starting in the Early Cretaceous (Coward et al. Reference Coward, Dewey, Hempton, Holroyd, Evans, Graham, Armour and Bathurst2003; De Jager, Reference De Jager, Wong, Batjes and de Jager2007; Herngreen & Wong, Reference Herngreen, Wong, Wong, Batjes and de Jager2007). Subsidence, combined with an eustatic sea-level rise, caused a transgression in NW Europe. From the Cenomanian onwards (earliest Late Cretaceous), large amounts of coccolith skeletons accumulated at the sea floor, forming the Chalk Group sediments (Hancock, Reference Hancock1975; Kennedy, Reference Kennedy1987a). Continental convergence at the end of the Danian (Early Palaeogene) ended the chalk deposition. The influx of erosional material into the oceans increased, leading to less clear water conditions. From this time onward, siliciclastic sediments replaced the accumulation of chalk (Ziegler, Reference Ziegler1990).
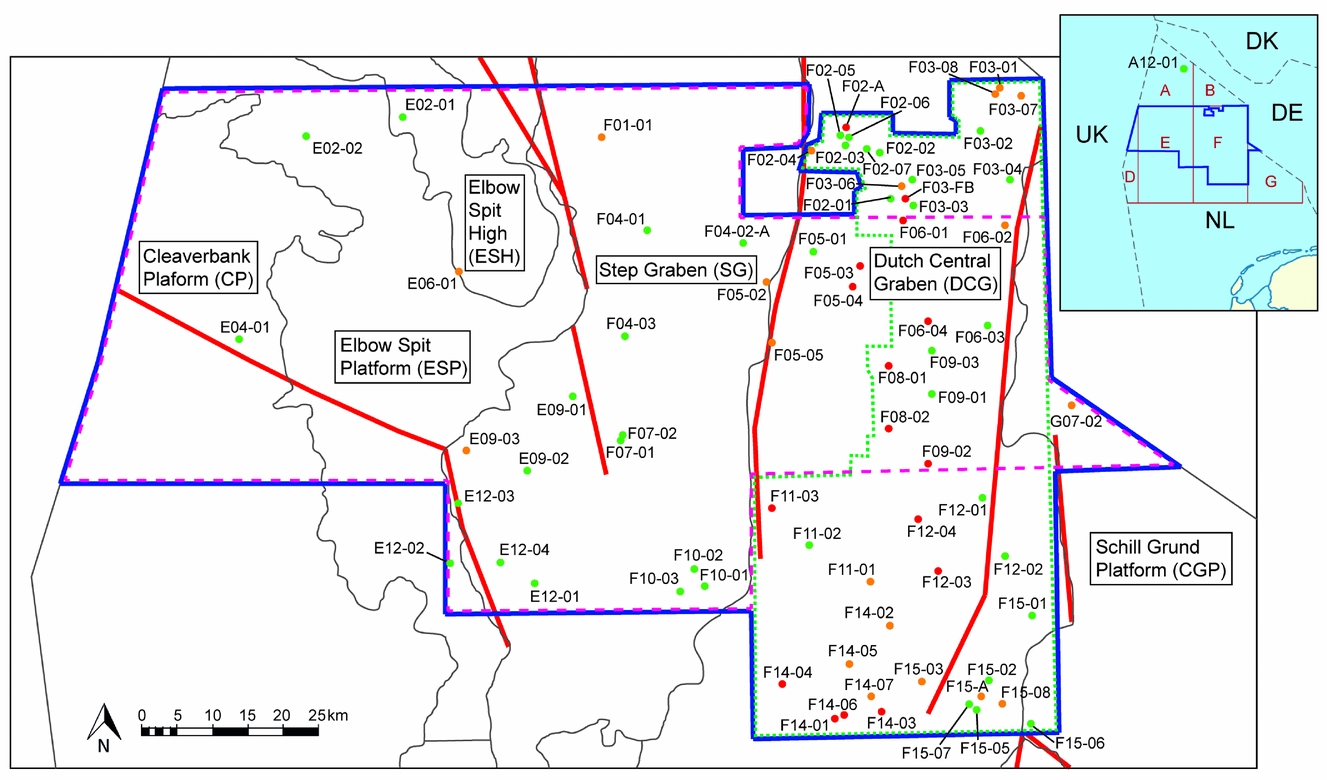
Many known large hydrocarbon fields in the Danish and Norwegian North Sea are situated in chalk reservoirs, for instance the Ekofisk, Dan and Kraka oil fields (Megson, Reference Megson and Hardman1992; Bramwell et al. Reference Bramwell, Caillet, Meciani, Judge, Green, Adam, Fleet and Boldy1999; Megson & Hardman, Reference Megson and Hardman2001; Gautier & Klett, Reference Gautier and Klett2005; Megson & Tygesen, Reference Megson, Tygesen, Doré and Vining2005). These findings attracted attention to the Chalk Group in the central North Sea area. However, the Chalk Group remained a poorly understood and possibly underestimated hydrocarbon play in the Netherlands. Relatively little is known on the Late Cretaceous to earliest Palaeogene tectonics and related stratigraphic records. Therefore, this study examines the geological evolution of the Chalk Group in the northern Dutch North Sea by integrating seismic and well data. The study area covers parts of the D, E, F and G quadrants in the Dutch North Sea (Fig. 1). It contains parts of five structural elements characterizing the Mesozoic development: Cleaver Bank Platform, Elbow Spit High and Platform, Step Graben, Central Graben and Schill Grund Platform. All of these structural elements are approximately N–S oriented and are separated by faults and salt walls (Kombrink et al. Reference Kombrink, Doornenbal, Duin, Den Dulk, Ten Veen and Witmans2012).

Figure 1. Location of the study area in the northern Dutch North Sea. The outline of the study area is indicated by the blue line and licence blocks are shown in the overview map in red. The names refer to the structural elements (after Kombrink et al. Reference Kombrink, Doornenbal, Duin, Den Dulk, Ten Veen and Witmans2012), which are delineated by thin grey lines. The general Late Jurassic to Early Cretaceous fault framework identified by Kombrink et al. (Reference Kombrink, Doornenbal, Duin, Den Dulk, Ten Veen and Witmans2012) is shown as solid red lines. The wells that transected the Chalk Group are subdivided into groups with good (green), less good (orange) and poor (red) biostratigraphic information. Outline of the two seismic surveys: the DEF survey (dashed pink) and the Terracube Area 3 survey (dotted green).
This seismic interpretation study re-evaluates geological events that influenced the stacking patterns and thickness variations of the Chalk sedimentary sequence in the Dutch North Sea.
2. Geological setting
The tectonic elements of the northern Dutch North Sea Basin consist of a range of sub-basins, platforms and highs that resulted from a series of tectonic phases of Palaeozoic to Palaeogene age (Kombrink et al. Reference Kombrink, Doornenbal, Duin, Den Dulk, Ten Veen and Witmans2012). The above-mentioned structural elements are bounded by faults (Fig. 1) and salt structures. They characterized the morphology of the basin in the study area when the chalk deposition started.
During the Triassic, Pangaea started to break up. While the Southern Permian Basin was still subsiding, initial extensional faulting occurred in the Netherlands (Van Wijhe, Reference Van Wijhe1987; Ziegler, Reference Ziegler1990; De Jager, Reference De Jager, Wong, Batjes and de Jager2007).
In the middle Jurassic, the thermal Central North Sea Dome developed (Mid-Kimmerian phase) (Herngreen & Wong, Reference Herngreen, Wong, Wong, Batjes and de Jager2007). This dome caused extensive uplift and erosion in the North Sea. During the Late Kimmerian Phase, major rifting took place and rift structures formed in the Southern North Sea; the Dutch Central Graben is one of them. Post-rift thermal relaxation combined with an eustatic sea-level rise caused the infill of the rift basins with Jurassic and Early Cretaceous sediments, overstepping the margins of the basins (Olsen, Reference Olsen, Brooks and Glennie1987; Ziegler, Reference Ziegler1990; Herngreen & Wong, Reference Herngreen, Wong, Wong, Batjes and de Jager2007). The transgression proceeded and at the end of the Early Cretaceous, large areas were flooded, which caused a reduced input of erosion material (Hancock, Reference Hancock1975; Ziegler, Reference Ziegler1990). During that period the global sea level was c. 100–300 m higher than today. In the warm and clear seas of the wider Southern and Central North Sea area, large amounts of calcareous nannoplankton (coccoliths) were produced. The skeletons of these organisms accumulated on the sea floor, forming the Chalk Group sediments of Late Cretaceous to earliest Palaeogene age (Hancock, Reference Hancock1975; Hancock & Scholle, Reference Hancock, Scholle and Woodland1975).
During Oceanic Anoxic Events (OAEs) large amounts of organic material accumulated as a result of widespread anoxic conditions. One of these worldwide OAEs occurred at the Cenomanian to Turonian boundary, c. 93.5 million years ago (Schlanger & Jenkyns, Reference Schlanger and Jenkyns1976; Mort et al. Reference Mort, Adatte, Föllmi, Keller, Steinmann, Matera, Berner and Stüben2007; Turgeon & Creaser, Reference Turgeon and Creaser2008). This episode is referred to as OAE2 and resulted in the deposition of the Plenus Marl Member. Turgeon & Creaser (Reference Turgeon and Creaser2008) claim that OAE2 was triggered by a massive magmatic episode with the emplacement of large igneous provinces and/or development of mid-ocean ridges.
While Mesozoic times were dominated by rifting and sagging phases, compressional phases occurred during the Late Cretaceous and Palaeogene (Van Wijhe, Reference Van Wijhe1987; Van der Molen, Reference Van Der Molen2004; De Jager, Reference De Jager, Wong, Batjes and de Jager2007). During the deposition of the chalk, two important compressional phases occurred. The first phase is referred to as the ‘Sub-Hercynian’ phase, which started in the early Turonian and continued to the early Maastrichtian. The second phase took place during the middle Palaeocene (latest Danian and Selandian; Deckers, Reference Deckers2015), the so-called ‘Laramide’ pulse. During this phase, several Jurassic basins became inverted, while continental to shallow marine siliciclastics were deposited elsewhere (Deckers, Reference Deckers2015). In parts of the Dutch Central Graben, the entire chalk succession was eroded (Herngreen & Wong, Reference Herngreen, Wong, Wong, Batjes and de Jager2007).
Continental convergence at the beginning of the Tertiary resulted in the influx of erosional material into the oceans, which terminated the chalk deposition and initiated widespread siliciclastic sedimentation (Ziegler, Reference Ziegler1990).
3. Integrated stratigraphy of the North Sea
The Chalk Group in general has a very homogeneous lithology and is comprised of three formations in the northern Netherlands (Fig. 2): the Texel (Cenomanian), Ommelanden (Turonian to Maastrichtian) and Ekofisk formations (Danian) (Van Adrichem Boogaert & Kouwe, Reference Van Adrichem Boogaert and Kouwe1994; Van der Molen, Reference Van Der Molen2004; Herngreen & Wong, Reference Herngreen, Wong, Wong, Batjes and de Jager2007). In the Danish and Norwegian part of the North Sea, where the chalk is an important reservoir for hydrocarbon production, a more detailed subdivision is used (references below and Fig. 2).
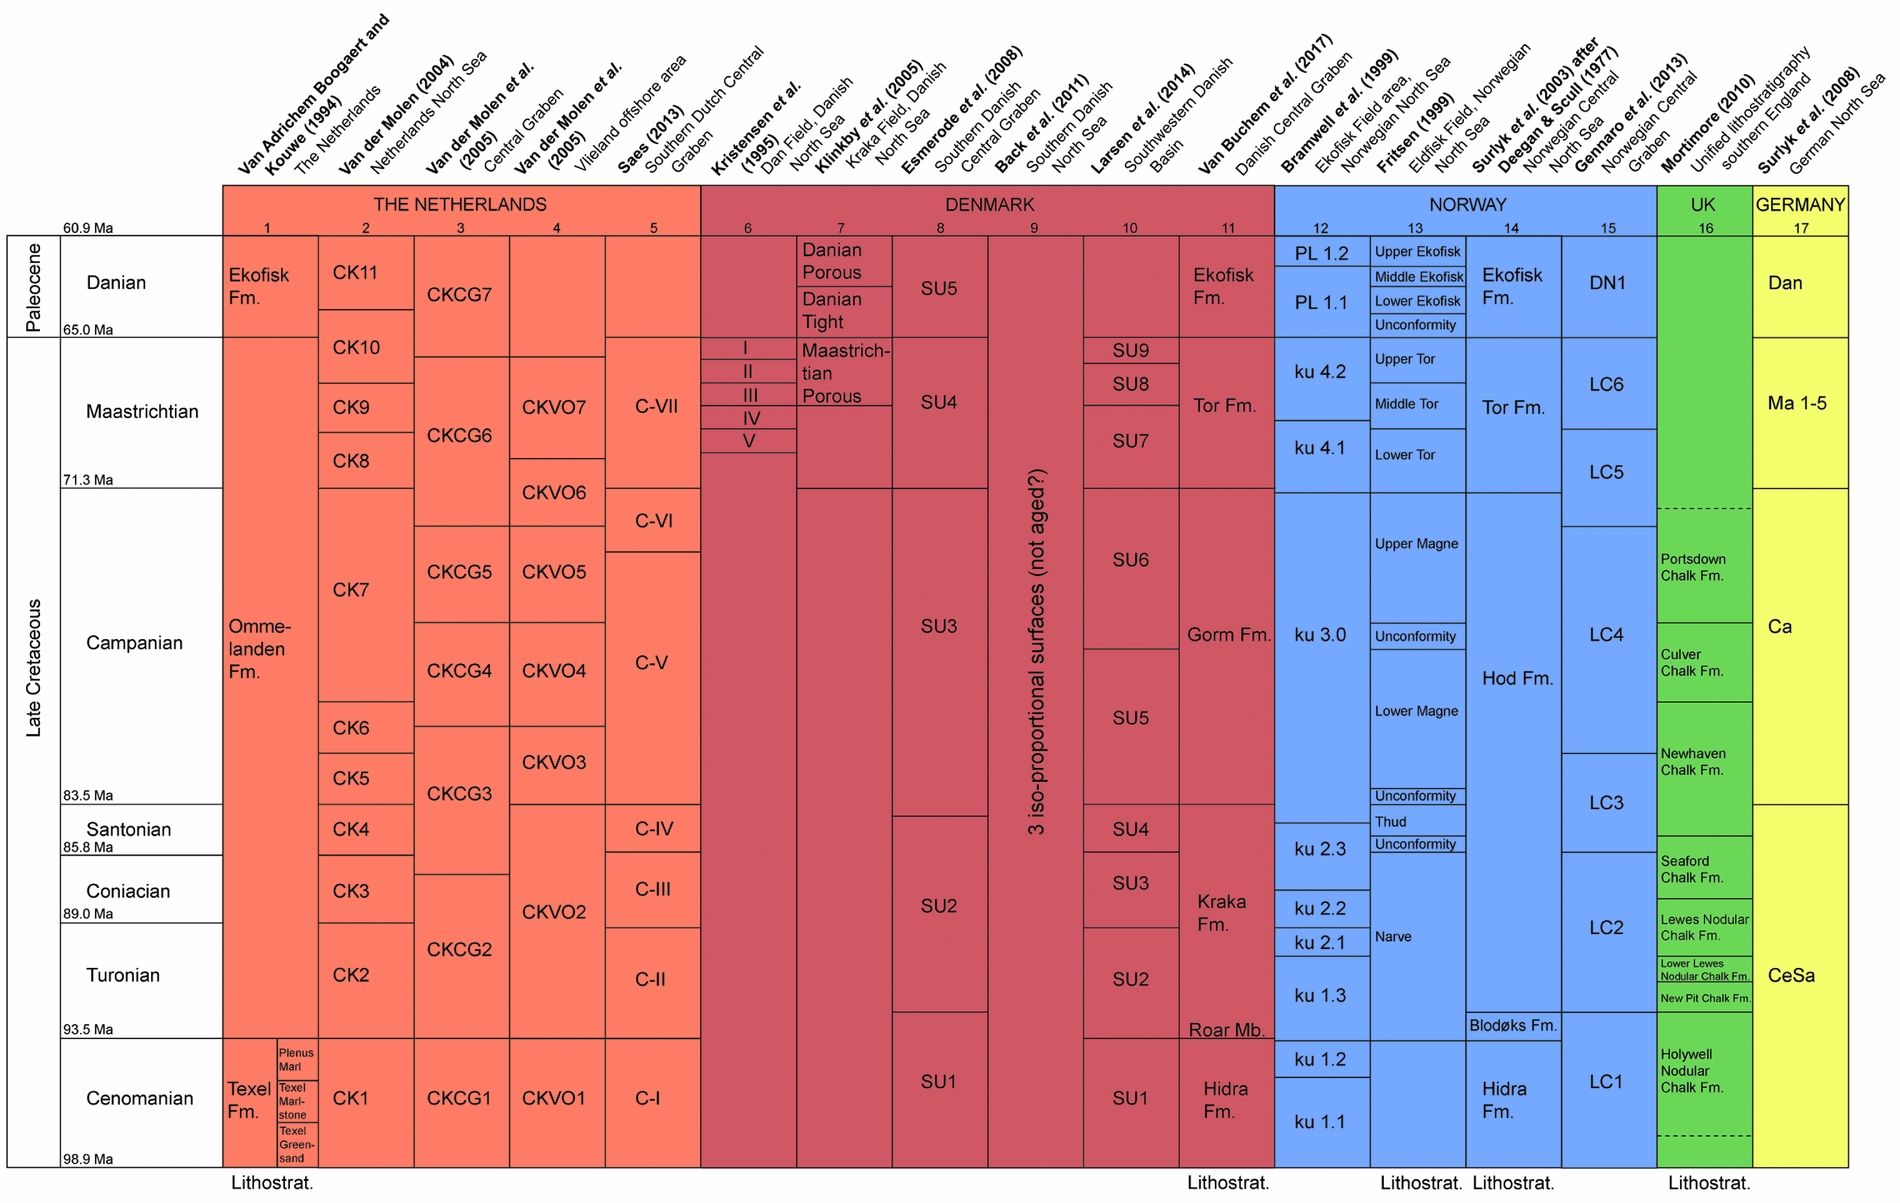
Figure 2. Comparison of the multiple biostratigraphic and/or seismic subdivisions of the North Sea Chalk in the Netherlands, Denmark, Norway, the United Kingdom and Germany. Four of the subdivisions are based on lithostratigraphy (as indicated on the previous page).
Recently, a series of studies have been carried out on redefining the subdivision of the Chalk Group, not only in Norway and Denmark, but also in the United Kingdom, Germany and the Netherlands (references below and Fig. 2). These studies identified different units, mostly based on biostratigraphic and seismic data, which are summarized in Figure 2. Many subdivisions correlate to the chronostratigraphic stages (Cenomanian to Danian).
3.a. Denmark (columns 6 to 11 in Fig. 2)
Multiple seismic studies were carried out on the Chalk Group in Denmark. Subdivisions of seismic units were made by Kristensen et al. (Reference Kristensen, Dons, Gunn Maver and Schiøler1995) in the Dan Field, by Esmerode, Lykke-Andersen & Surlyk (Reference Esmerode, Lykke-Andersen and Surlyk2008) in the southern Danish Central Graben, by Klinkby et al. (Reference Klinkby, Kristensen, Nielsen, Zinck-Jørgensen and Stemmerik2005) and Back et al. (Reference Back, Van Gent, Reuning, Grötsch, Niederau and Kukla2011) in the Danish Central Graben and by Larsen, Ineson & Boldreel, (Reference Larsen, Ineson and Boldreel2014) in SW Denmark. The unconformity best recognized on seismic in the Danish sector of the North Sea is likely of intra-Campanian age (Megson & Tygesen, Reference Megson, Tygesen, Doré and Vining2005) and most likely comparable to the Late Campanian unconformity in the United Kingdom (Errat et al. Reference Errat, Thomas, Wall, Fleet and Boldy1999). Van Buchem et al. (Reference Van Buchem, Smit, Buijs, Trudgill and Larsen2017) proposed the first formal lithostratigraphic subdivision of the Chalk Group in the Danish Central Graben, introducing two new formations: Kraka and Gorm.
3.b. Norway (columns 12 to 15 in Fig. 2)
The Shetland Group comprises the Cenomanian to Danian chalk deposits in the northern North Sea and is traditionally subdivided into five lithostratigraphic formations (Deegan & Scull, Reference Deegan and Scull1977; Surlyk et al. Reference Surlyk, Dons, Clausen, Higham, Evans, Graham, Armour and Bathurst2003): Ekofisk, Tor, Hod, Blod¢ks (which correlates to the Dutch Plenus Marl Member) and Hidra. Another subdivision of the chalk was proposed by Fritsen (Reference Fritsen1999) for the North Sea Eldfisk field and was based on the presence of four unconformities. Subdivisions of the Norwegian chalk based on seismic data, linked to litho- and biostratigraphic data, were made by Bramwell et al. (Reference Bramwell, Caillet, Meciani, Judge, Green, Adam, Fleet and Boldy1999) for the Greater Ekofisk area and by Gennaro et al. (Reference Gennaro, Wonham, Gawthorpe and Saelen2013) for the southern Norwegian sector of the North Sea.
3.c. The United Kingdom (column 16 in Fig. 2)
Mortimore (Reference Mortimore2010) published a very detailed stratigraphic description and subdivision of the Late Cretaceous in England, based on biostratigraphic and wireline log data. He also compared the stratigraphy to global sea-level data and tectonic events, but did not use any seismic data.
3.d. Germany (column 17 in Fig. 2)
Surlyk, Jensen & Engkilde (Reference Surlyk, Jensen and Engkilde2008) subdivided the Chalk Group of the German North Sea into eight seismostratigraphic sequences, based on mapping onlapping, downlapping and truncated reflectors.
4. Methodology
4.a. Seismic reflection data
Parts of two 3D seismic surveys were studied, namely the DEF survey and the Terracube Area 3 survey. The DEF survey (acquired in 2012) is a survey of c. 150 by 80 km, located in the D-, E- and F-blocks of the Dutch North Sea, and includes a small part of the G-block (Fig. 1). The second 3D seismic cube is called Terracube Area 3 (2011) and covers the F- and G-blocks of the study area (Fig. 1). The part of this cube that was used for this study is c. 100 by 70 km and partly overlaps with the DEF survey. Only seismic data between c. 1 and 3 s two-way travel time (TWT) were used. The Petrel software (Schlumberger) was used for the seismic interpretation. An increase in acoustic impedance results in a positive seismic response (peak) and a blue loop (polarity standard of the Society of Exploration Geophysicists; SEG). The average resolution of the seismic data on the chalk level is c. 16–20 m.
4.b. Well data
In the study area, 82 wells are present which contain at least some lithostratigraphic and/or biostratigraphic information on the Chalk Group. Well logs were available for almost all of these wells (see NLOG database, www.nlog.nl). An internal report of Wintershall Noordzee (WINZ) (J. P. G. Fenton et al. 2014) provided additional biostratigraphic information on 11 wells.
All wells contain at least two lithostratigraphic tops (i.e. the top of the underlying formation at the location of the well). The mapped lithostratigraphic tops are based on the subdivision of the chalk by Van Adrichem Boogaert & Kouwe (Reference Van Adrichem Boogaert and Kouwe1994), being: Top Chalk, Top Ekofisk Formation, Top Ommelanden Formation, Top Plenus Marl Member, Top Texel Formation and Base Chalk (Fig. 2).
Subsequently, chronostratigraphic ‘tops’ of the Cenomanian, Turonian, Coniacian, Santonian, Campanian, Maastrichtian and Danian were deduced from biostratigraphic data. For several wells, exact depths of these horizons are unavailable, but ranges are reported. When this uncertainty applied, the mid value of the range was used as the ‘top’ and a lower confidence level was assigned to this data point. Each top was evaluated with one of the three confidence levels, one being a top that is located no more than 10 m higher or lower than the depth that is given to it; two or three could be 50 and 100 m higher or lower, respectively.
Only the density, gamma-ray and sonic logs were used for this study. To correlate possible lithological changes or erosional events with the seismic response, both the density and gamma-ray logs were studied as an extra indication for the location of these transitions.
Time–depth relations were used for the well-to-seismic match to correlate reflections to the tops of the units. For wells without checkshot or Vertical Seismic Profile (VSP) data, the sonic log was the most important source of time–depth information. The easily recognizable top and base of the Chalk Group itself were also used to tie the wells to the seismic. The TWT and the depth of the top and the base of the chalk were extracted from the seismic and the well tops. The sonic log was used for time–depth conversion within the chalk.
4.c. Seismic interpretation
The aim of the seismic interpretation was to identify the distribution and thickness variations of the sedimentary sequences within the Chalk Group and to determine the age of unconformities that link to geological events. To achieve this, the seven chronostratigraphic tops of Van Adrichem Boogaert & Kouwe (Reference Van Adrichem Boogaert and Kouwe1994) were interpreted throughout the study area (Fig. 2). These horizons were chosen because of their relatively good biostratigraphic well ties and regional correlation. Furthermore, the mapped seismic horizons could also help improve the time–depth conversion within the chalk in order to predict the depth of certain formations.
Flattening of an under- or overlying surface was used for interpretation purposes. Tuning occurrences were interpreted as an indication of the vicinity of a reflection termination. Several seismic attributes were extracted at different surfaces, for instance Root Mean Square Amplitude and Average Negative Amplitude to reveal thickness variations of seismic units. Anomalies on these attribute maps were compared to the seismic. If the anomaly was caused by tuning, it was used to define the boundaries of an interpreted horizon. In other cases, the anomalies were assigned to a lithology change. The interpreted horizons were used to produce thickness maps of the seismic units (Fig. 3).

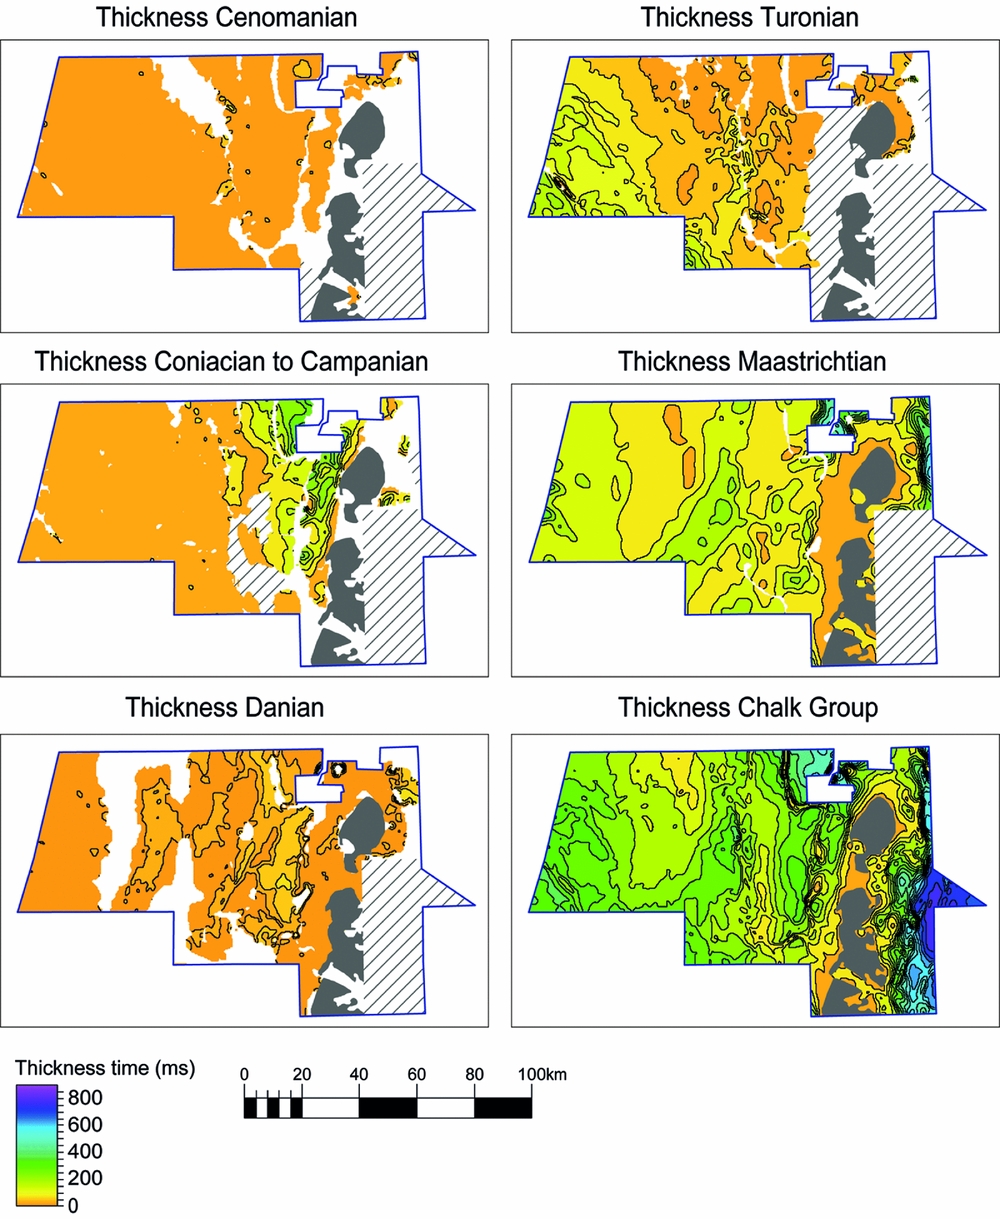
Figure 3. Thickness maps of five (combinations of) units and the complete Chalk Group, measured in two-way travel time (TWT; ms). No thickness maps were created for the separate Coniacian unit and Santonian unit because the areal extent of these units is very limited. The Chalk Group is absent in the grey areas, and the grey striped areas indicate where no reliable thicknesses could be interpreted. The particular units are absent in the white areas.
5. Results of seismic interpretation
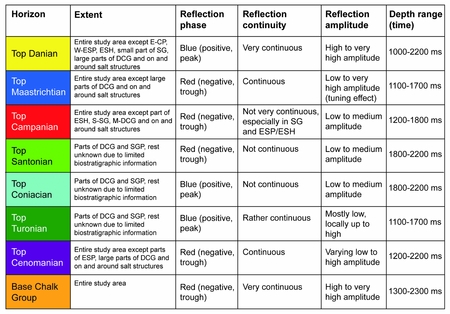
The seismic characteristics of the seven interpreted horizons are described in Figure 4. The seismic facies were also analysed in detail, resulting in a subdivision of 17 sub-units (Fig. 5). The seismic character of the Cleaverbank Platform chalk differs significantly from the other structural elements, showing very continuous and parallel reflections.
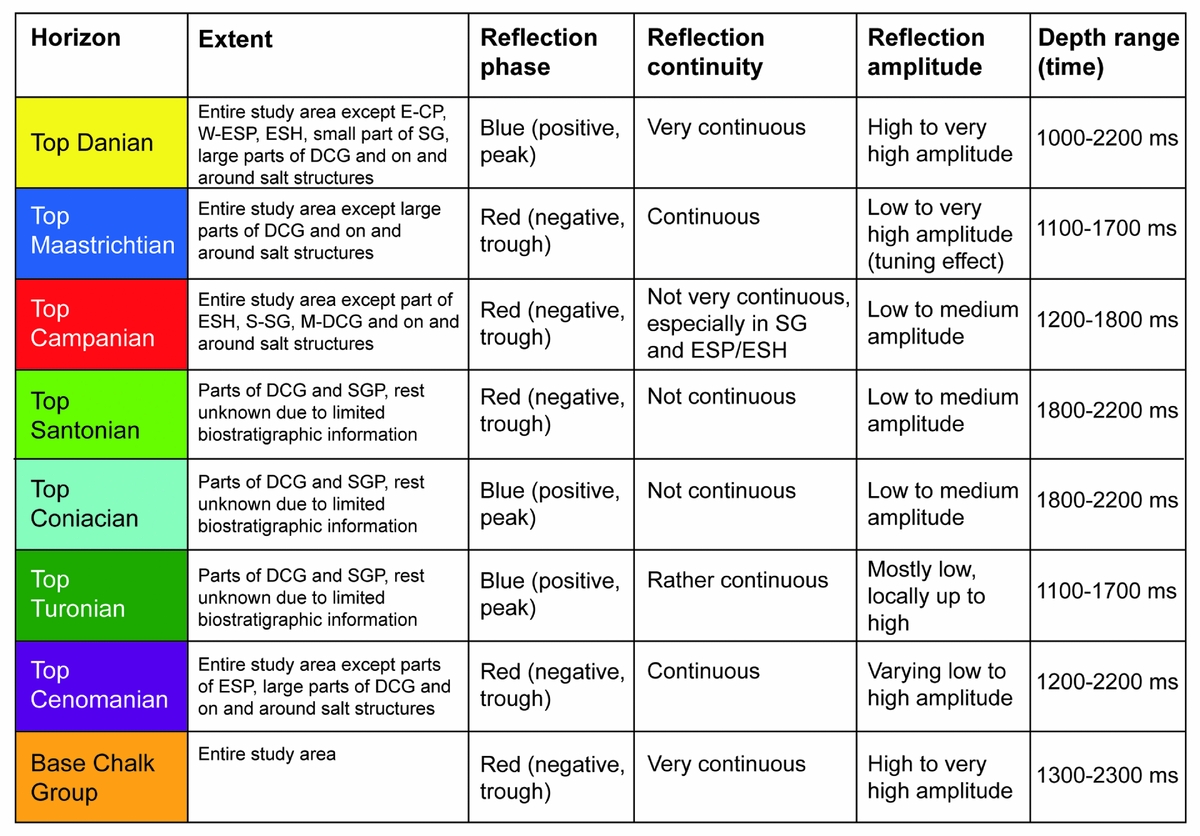
Figure 4. Seismic reflectivity characteristics of the interpreted horizons and their extent and depth range (ms) throughout the study area.
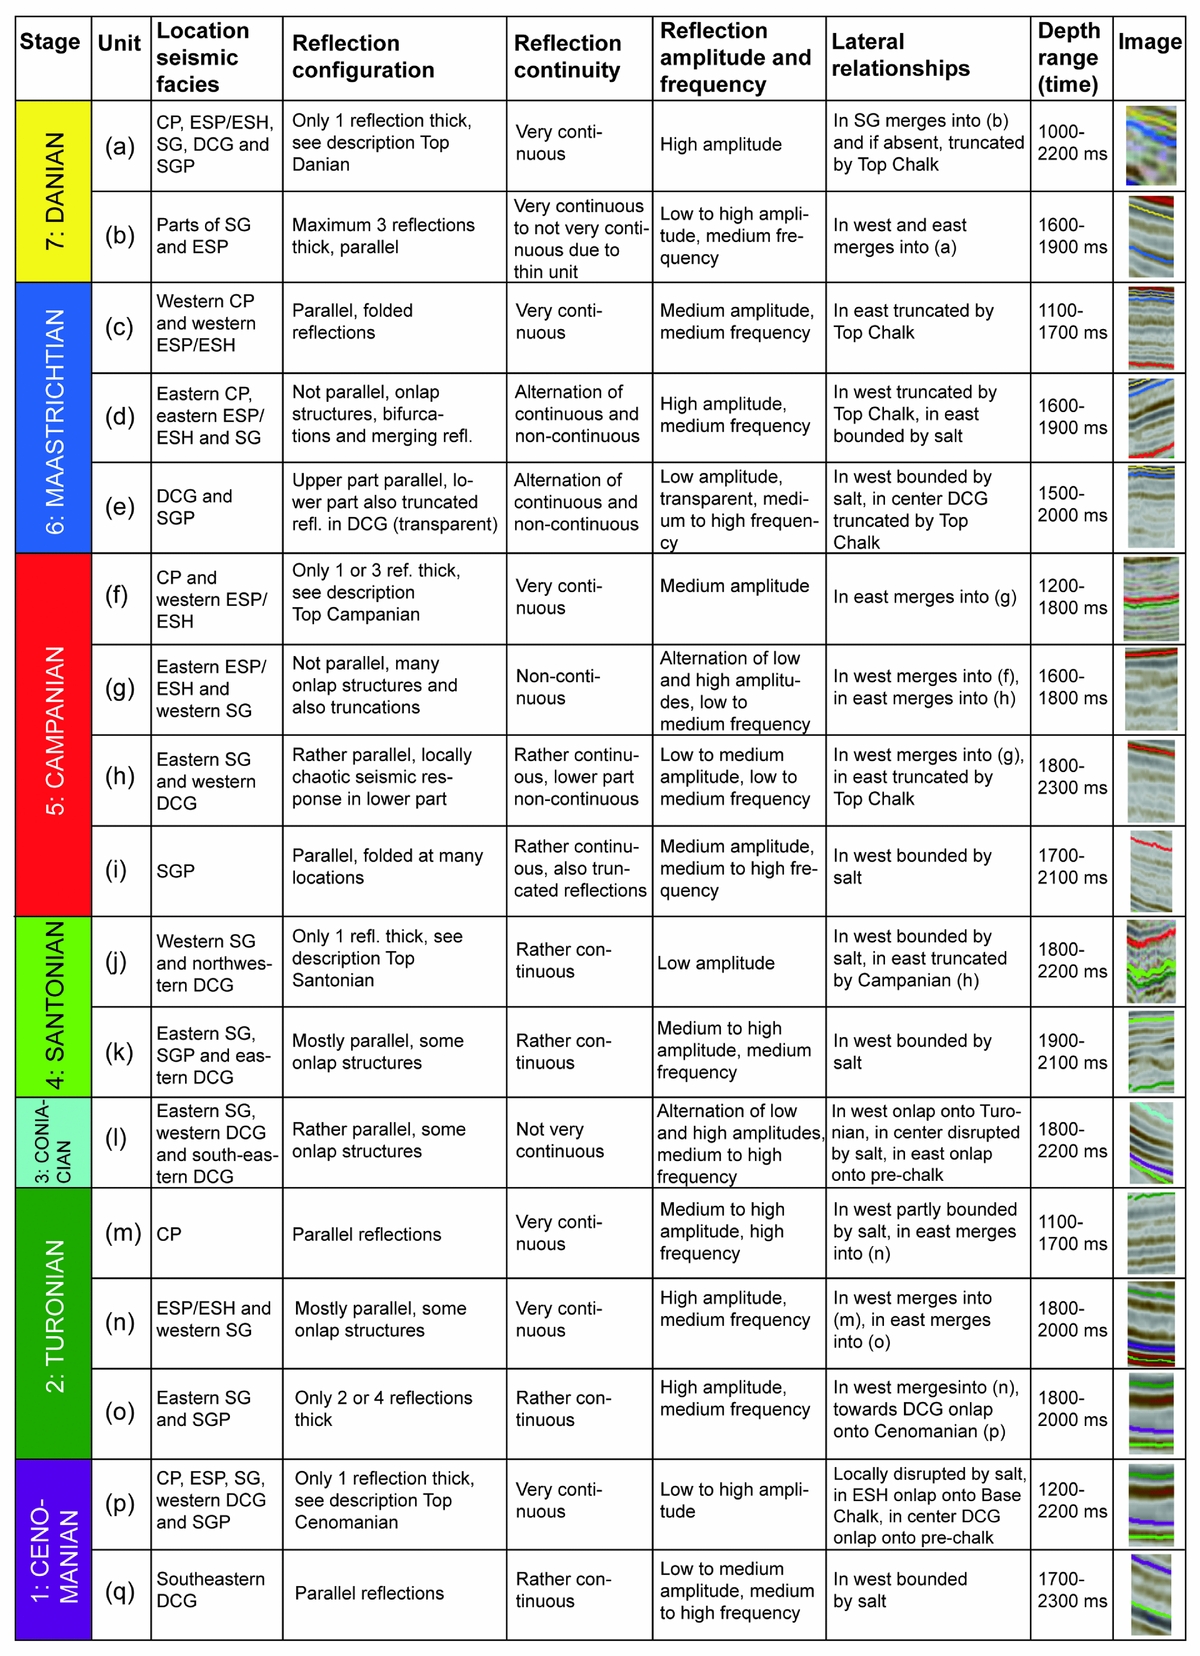
Figure 5. Seismic facies subdivision of the seven chronostratigraphic units with their locations in the study area, lateral relationships, reflection characteristics and depth range (ms). Each seismic facies is illustrated with an image from the study area.
Figure 3 shows the thickness maps of the units that could be interpreted throughout the study area. Due to limited biostratigraphic information on the Coniacian and Santonian, unit 3 shows the combined thickness of the Coniacian, Santonian and Campanian. The Chalk Group is the thickest on the Schill Grund Platform and absent in a few parts of the Dutch Central Graben. At the western and eastern boundaries of the Step Graben, close to the salt walls that form the boundaries of the Step Graben, the Chalk Group is thicker than in the centre.
The Cenomanian unit is generally very thin, mostly only one reflection, and onlaps onto pre-chalk deposits at the Elbow Spit High. The Turonian sequence is thickest in the SW and becomes gradually thinner towards the NE, with an exception at the boundary between the Elbow Spit Platform and Step Graben (Figs 3 and 6). Similar to the Cenomanian, Turonian deposits onlap onto a part of the Elbow Spit High. Turonian reflections are truncated by Campanian/Maastrichtian reflections in the central Step Graben. Coniacian and Santonian deposits could only be interpreted in a relatively small part of the study area, due to limited biostratigraphic well control. However, the Coniacian and Santonian are interpreted to be absent or thinner than the seismic resolution (16–20 m) at the Cleaverbank Platform (Fig. 7). In the Chalk Group of the Elbow Spit Platform, the Step Graben and the Dutch Central Graben, clear reflection truncations were recognized within the chalk. In the Step Graben (Fig. 8) and western Dutch Central Graben (Fig. 9) truncations occur below and within the Campanian chalk. At the Elbow Spit Platform (Fig. 10) and in the eastern Dutch Central Graben (Fig. 11), truncations are present below and within the Maastrichtian chalk. The Maastrichtian is generally the thickest unit of the Chalk Group in the study area. In contrast, the Danian unit is very thin, mostly only one reflection. Distinct reflection terminations are also visible in the upper part of the Chalk Group below the Palaeogene clastics (Fig. 12). In many parts of the study area, the Danian reflection is truncated at the top of the chalk. On parts of the Cleaverbank Platform and Elbow Spit Platform, the Danian is absent and even upper Maastrichtian reflections are truncated.
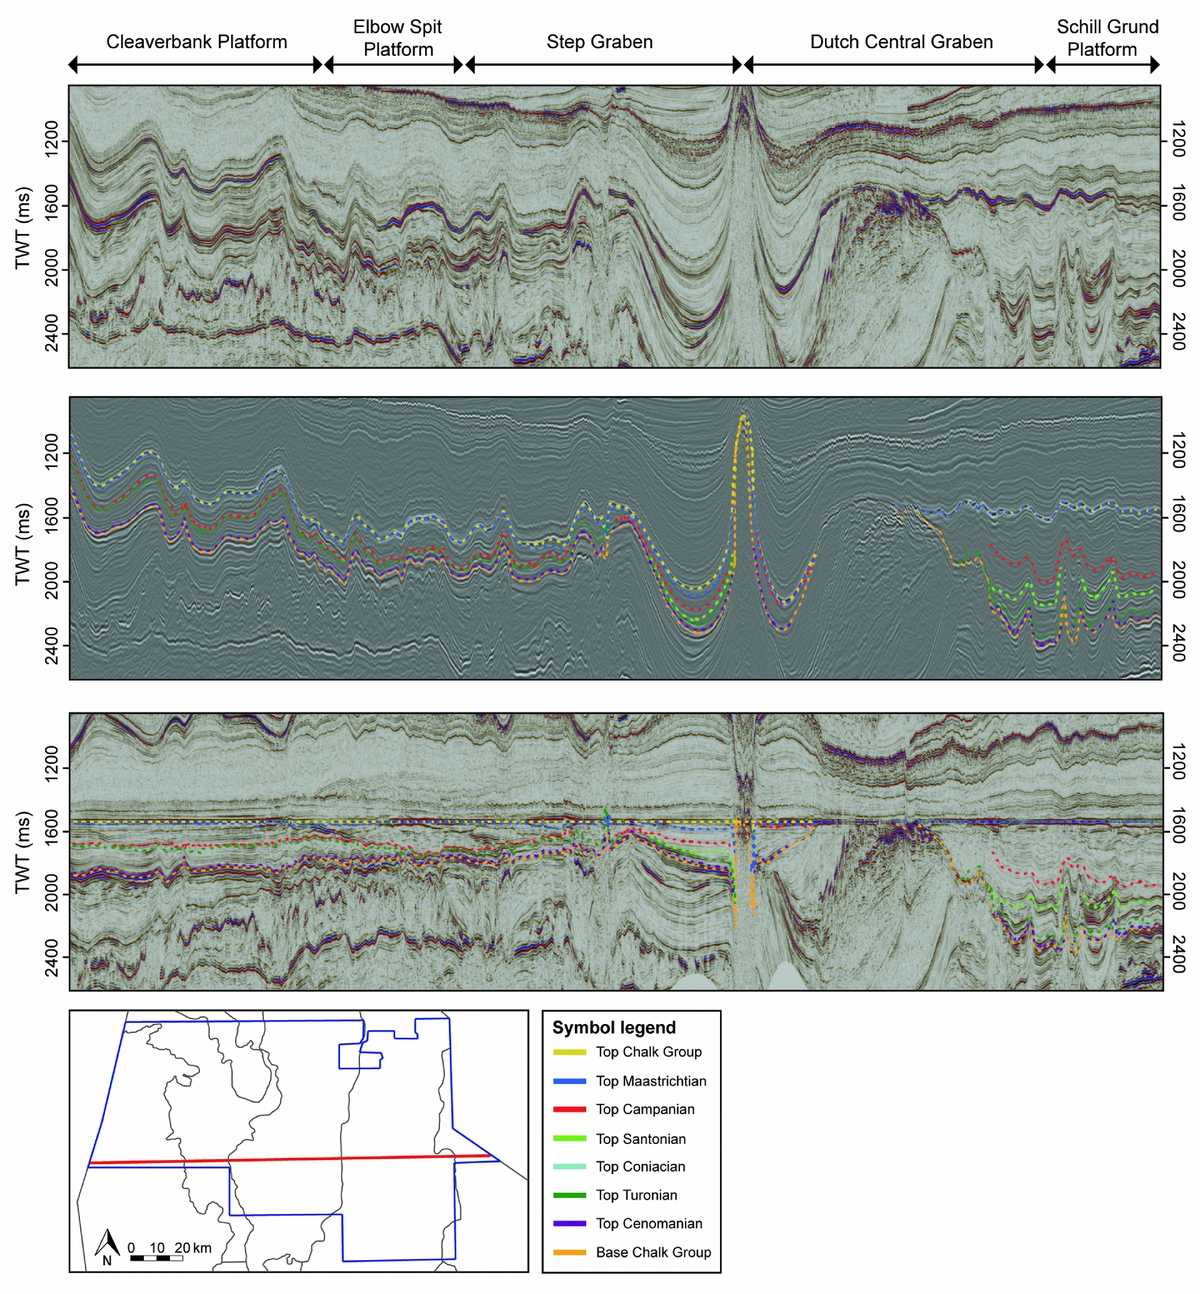
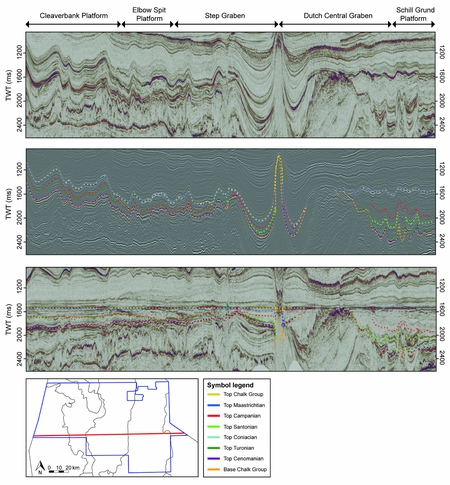
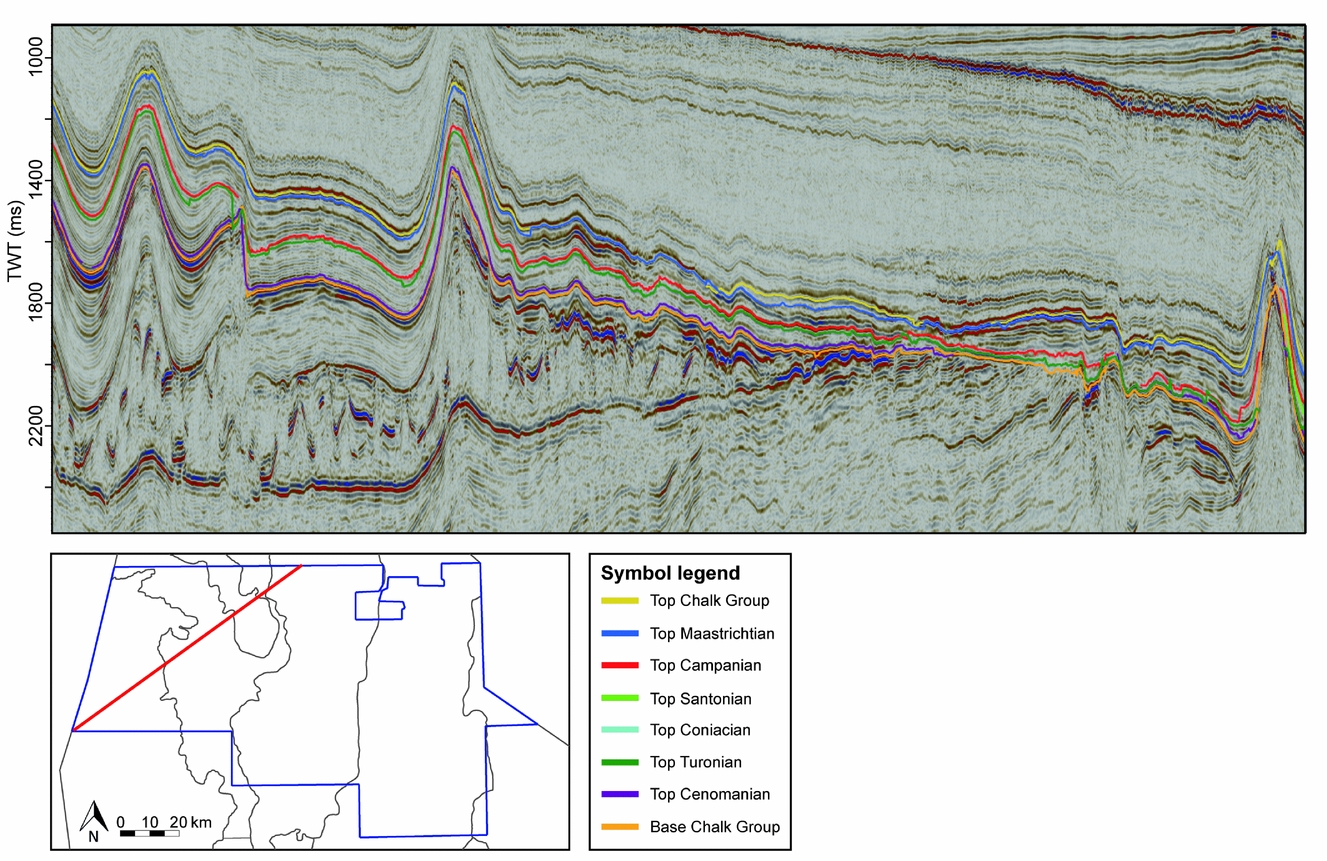
Figure 6. W–E seismic section through the middle part of the study area: without interpretations (above), with dotted lines as interpretations of the unit tops (middle) and flattened on the Top Chalk (below). The location of the section is indicated by the red line on the map. Where the interpretation of a unit is not presented, the unit is either absent or not possible to interpret due to a lack of biostratigraphic well control or due to barriers such as salt diapirs. The arrangement of the different structural elements and their seismic characteristics are visible, as well as the presence of salt structures and general interpretations of the seismic units.

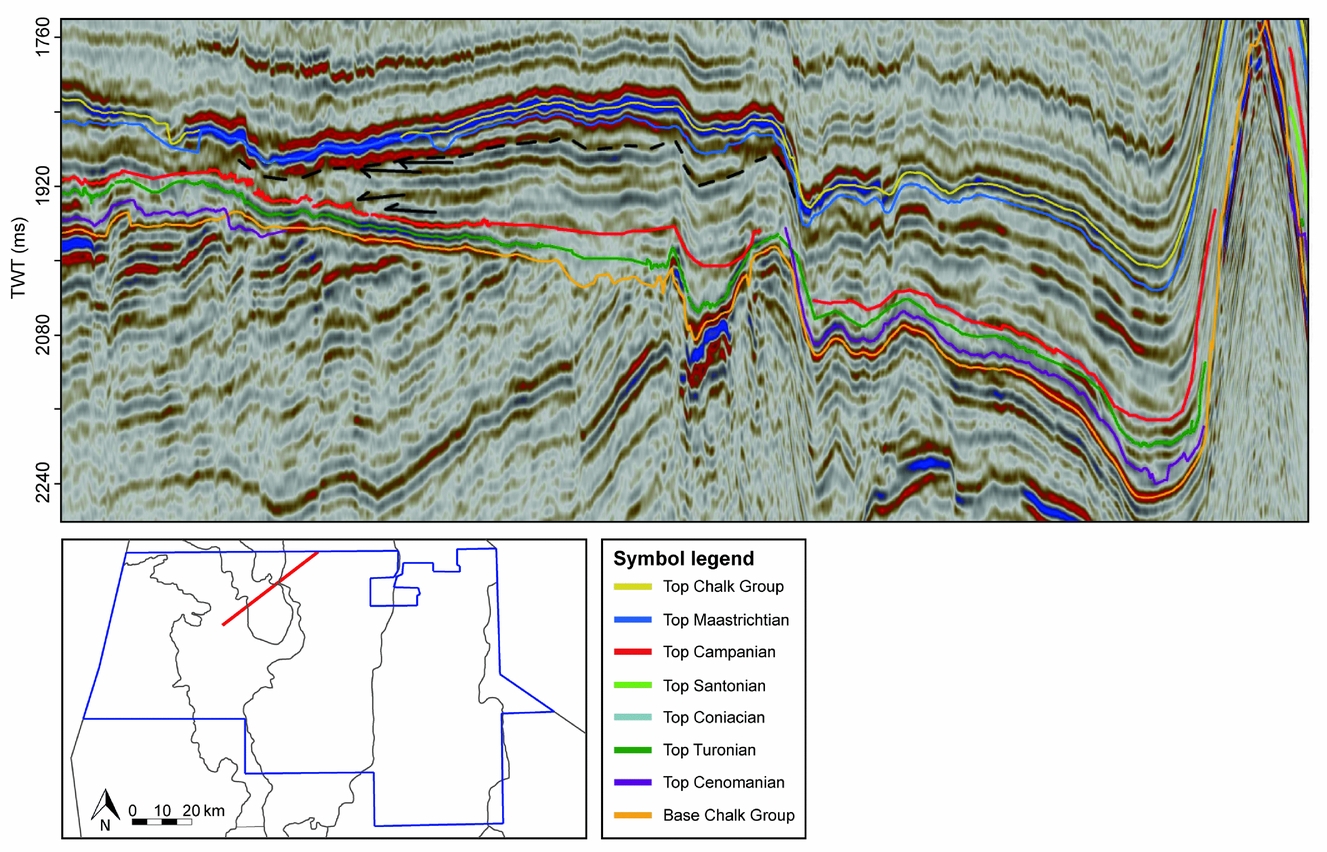
Figure 7. SW–NE section through the Cleaverbank Platform, the Elbow Spit Platform and Elbow Spit High and a small part of the Step Graben. The red line on the map indicates the location of the section in the study area. A salt wall is visible at the SW part of the section, at the Cleaverblank Platform, with Turonian reflections onlapping to this local high. Coniacian to Santonian deposits are absent on the Cleaverbank Platform and parts of the Elbow Spit Platform.

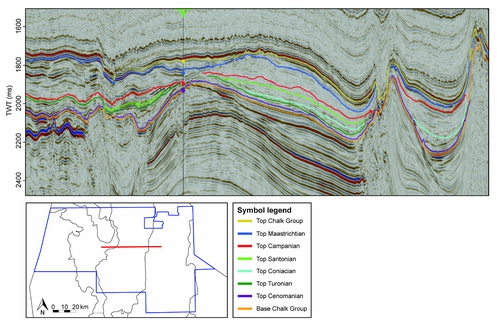
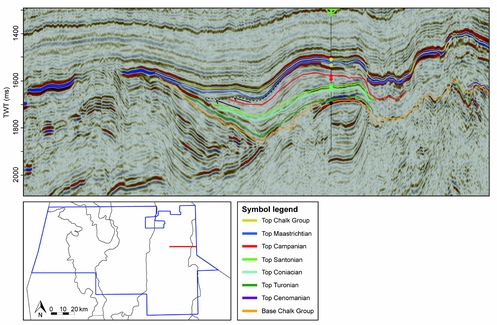
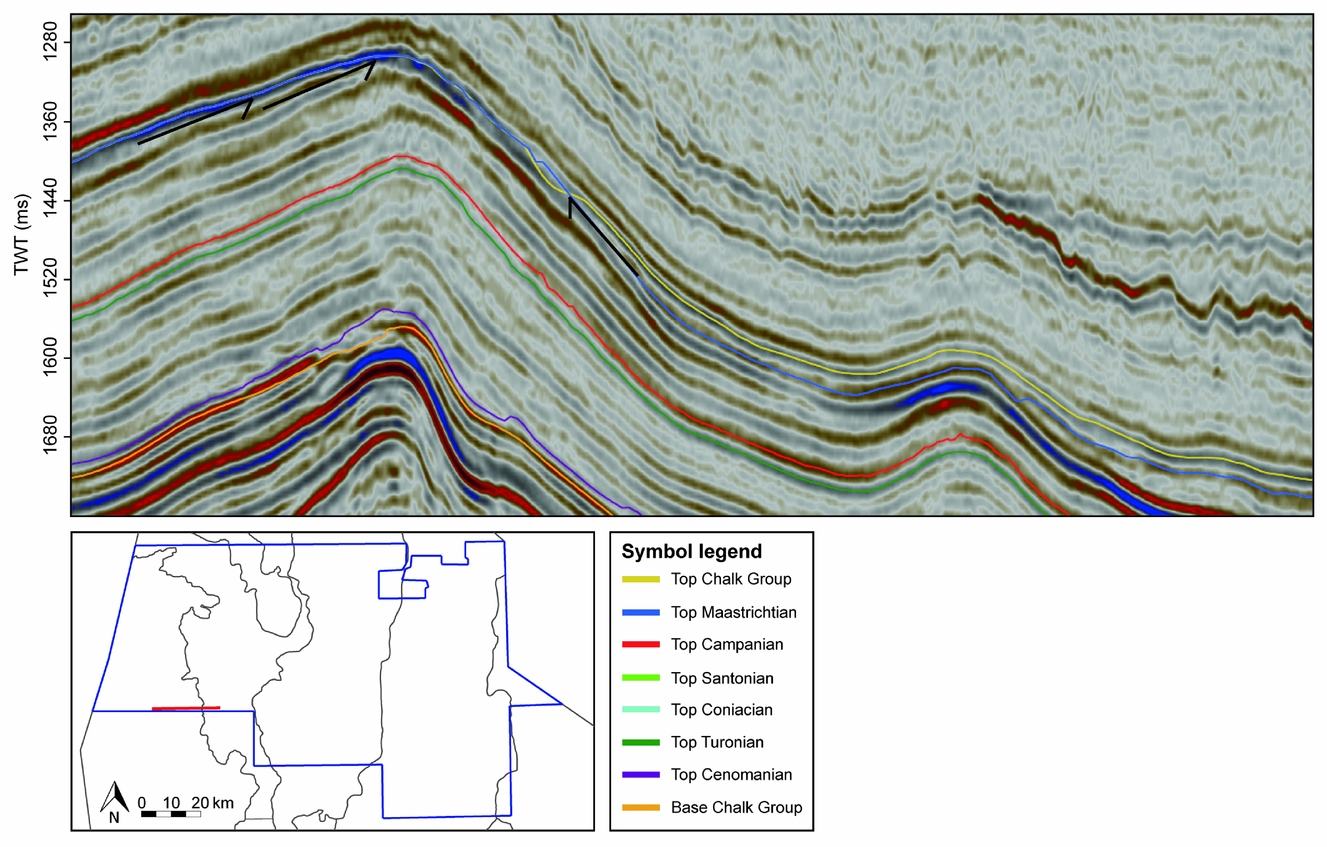
Figure 8. W–E section through the central part of the Step Graben with the interpreted units. The red line on the map indicates the location of the section in the study area. The visible well is F04-03. The black arrows show truncations below the top of the Campanian, which indicate that inversion occurred during the late Campanian.

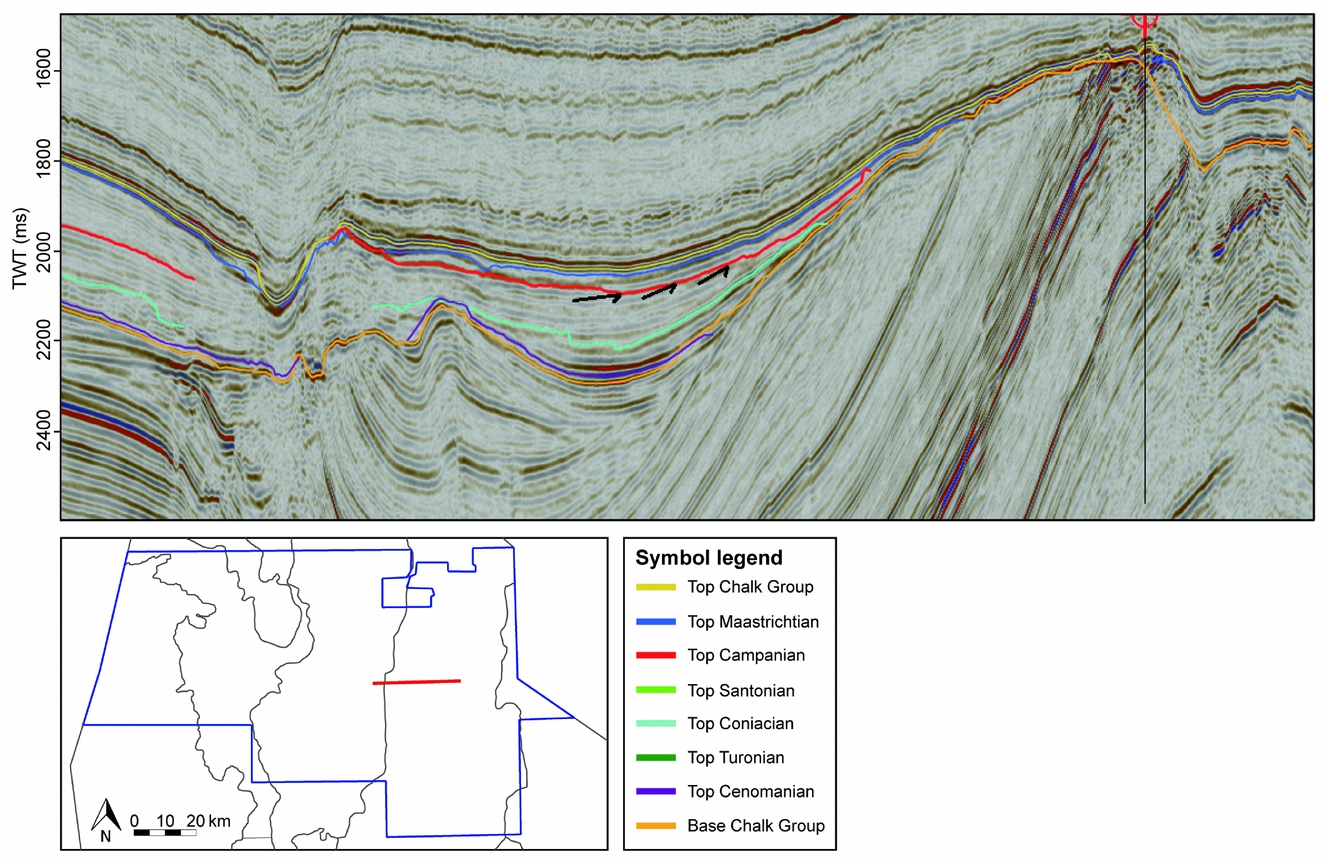
Figure 9. W–E section through the western Dutch Central Graben, with black arrows indicating reflection truncations that show the Campanian erosion due to inversion. The red line on the map indicates the location of the section in the study area.

Figure 10. Zoom-in on the SW–NE section of Figure 7 through the Elbow Spit Platform and Elbow Spit High. Reflection terminations are illustrated with black arrows and indicate Maastrichtian onlap and truncations, of which the latter is evidence of erosion due to Maastrichtian inversion. The red line on the map indicates the location of the section in the study area.

Figure 11. W–E section through the eastern Dutch Central Graben. The visible well is F06-03. The black arrows illustrate reflection truncations that indicate erosion due to uplift of the Maastrichtian inversion phase. The red line on the map indicates the location of the section in the study area.

Figure 12. W–E section in the SE part of the Cleaverbank Platform. The black arrows illustrate reflection truncations that indicate erosion due to uplift of the Danian inversion phase. The red line on the map indicates the location of the section in the study area.
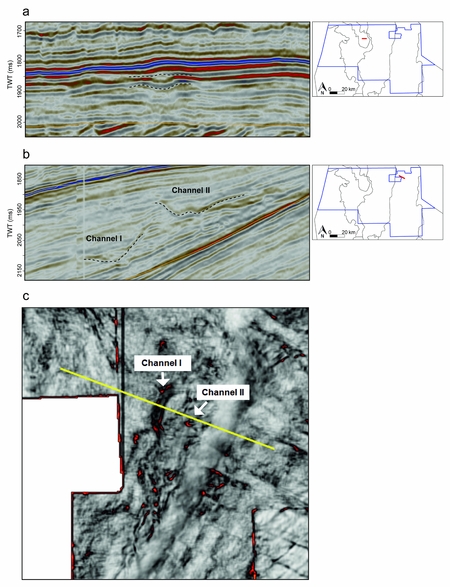
Besides thickness variations, smaller-scale structures such as incision features are also recognized in the study area at different scales. Relatively small structures are c. 300 m wide and are present in the Dutch Central Graben as well as on the Elbow Spit High (Fig. 13a). Larger incision features were found mainly in the Dutch Central Graben, for instance in the F2 block (Fig. 13b). The variance attribute map (Fig. 13c) visualizes these structures, which are oriented parallel to the contours of the slope and are up to 1200 m wide. The features are sinuous and V-shaped or W-shaped and seem to be mostly present in Maastrichtian and Danian sequences but were also recognized in older structures. In a zone of c. 2–10 km width, stretching from north to south to southwest along the central part of the Step Graben, the Danian thickness shows a clear positive anomaly with respect to the rest of the study area. Well F04-03 is located in the middle of this feature and contains a Danian sequence of c. 90 m thick (Figs 8 and 14). Another relatively thick Danian sequence is located in a N–S-trending zone of c. 10 km wide on the Elbow Spit Platform. Unfortunately, no wells have been drilled in this particular feature. The thickness map of the Danian clearly shows these anomalies (Figs. 3 and 14).

Figure 13. Incision features interpreted as channels. (a) Relatively small-scale channel at the Elbow Spit High, (b) larger-scale channels in the NW part of the Dutch Central Graben, (c) variance attribute map of the NW Dutch Central Graben, showing the same two channels as indicated in (b).
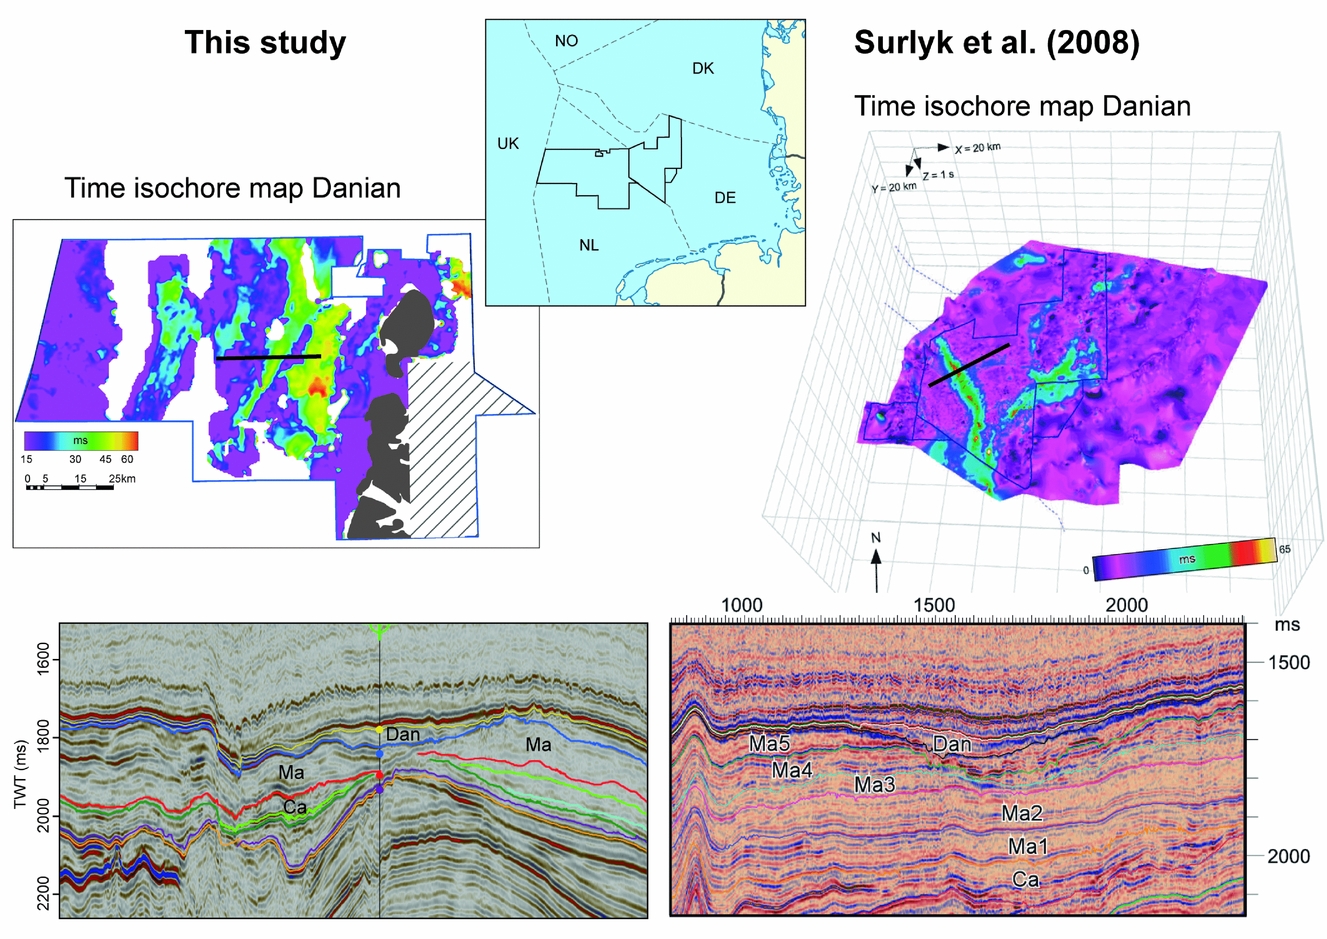
Figure 14. Comparison of the Danian channel found in this study (left) and the Danian channel identified by Surlyk, Jensen & Engkilde (Reference Surlyk, Jensen and Engkilde2008) in the German Schill Grund High (right). Both study areas are indicated on the map. The time isochore maps of the Danian Ekofisk Formation show anomalies that are visible in the seismic sections below as deep Danian channels that cut into the top of the Maastrichtian. The black lines show the locations of the seismic sections, and the grey areas on the left map indicate the absence of the Chalk Group. The grey striped areas indicate where no reliable Danian thicknesses could be interpreted and the Danian is absent in the white areas. Abbreviations: Dan = Danian, Ma = Maastrichtian, Ca = Campanian.
Complexes of chaotic and distorted reflections were found in many parts of the Dutch Central Graben. Two examples of such chaotic and distorted reflection features are shown in Figure 15. Such complexes are up to 7 km in length along the axis of displacement.
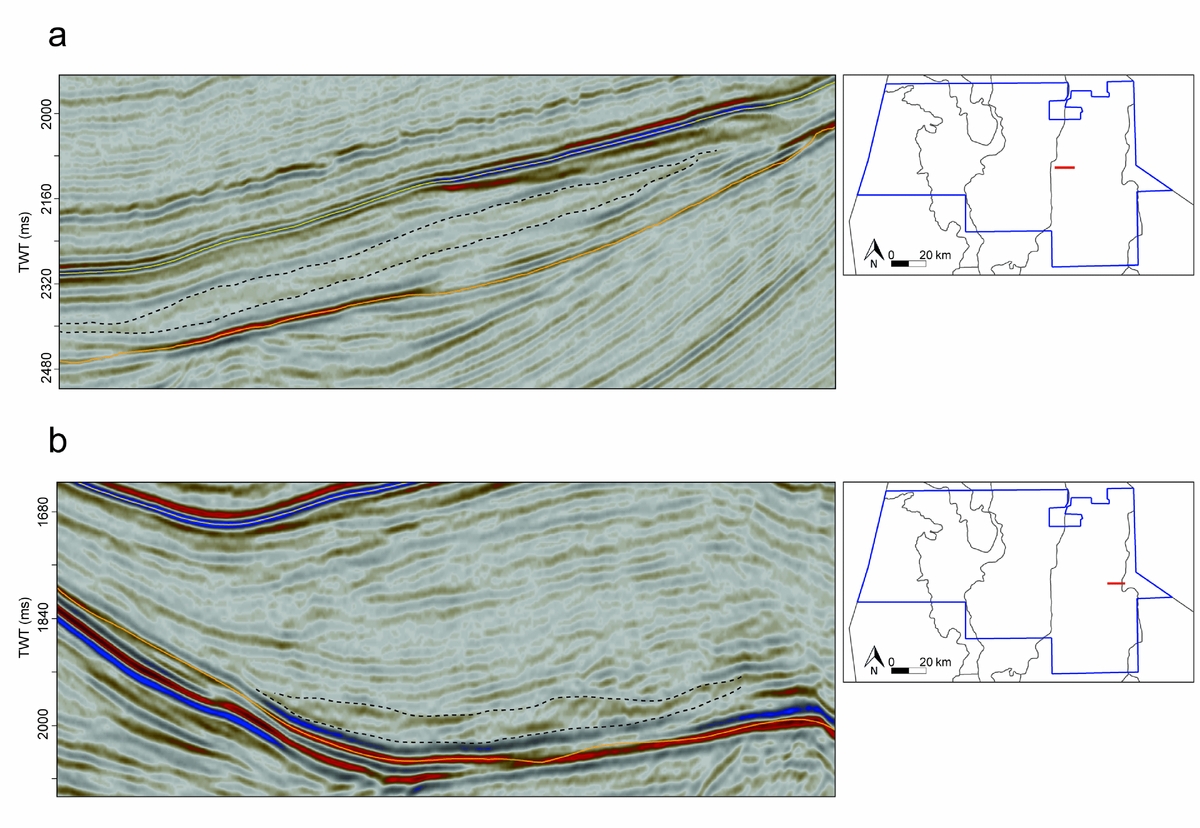
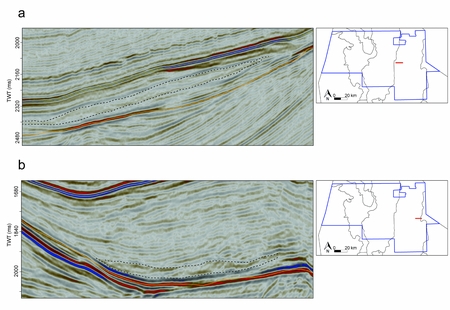
Figure 15. W–E seismic sections through the western (a) and eastern (b) Dutch Central Graben, showing chaotic and distorted reflection complexes, interpreted as slumps.
6. Discussion of intra-chalk geological events
Based on the seismic interpretation, a series of intra-chalk events were discovered in the study area.
6.a. Turonian tilting
The gradual thickening of the Turonian deposits towards the SW is interpreted as the result of tilting during the Turonian. The SW part of the Cleaverbank Platform subsided with respect to the NE part. Van der Molen (Reference Van Der Molen2004) proposed a sea-level rise during the Turonian that could have caused the thick Turonian sequence in the western part of the study area, but did not discuss a tilting or subsidence process that could explain the thickness differences observed in this study.
6.b. Halokinesis
During the deposition of the Chalk Group, local subsidence mainly resulted from halokinesis processes related to the Zechtstein salt (Remmelts, Reference Remmelts, Rondeel, Batjes and Nieuwenhuijs1996; Ten Veen, Van Gessel & Den Dulk, Reference Ten Veen, Van Gessel and Den Dulk2012; Van Winden et al. Reference Van Winden, De Jager, Jaarsma, Bouroullec, Kilhams, Kukla, Mazur, McKie, Mijnlieff and van Ojik2018). The salt diapirs and walls are located mainly in the Step Graben and Dutch Central Graben. During the development of these structures, salt was removed from the adjacent areas, which led to local subsidence at those positions. Accommodation space in these rim synclines was filled up with sediments, resulting in a thicker sequence (Ten Veen, Van Gessel & Den Dulk, Reference Ten Veen, Van Gessel and Den Dulk2012; Van Winden et al. Reference Van Winden, De Jager, Jaarsma, Bouroullec, Kilhams, Kukla, Mazur, McKie, Mijnlieff and van Ojik2018). At the western and eastern boundaries of the Step Graben, the Chalk Group is thicker than in the centre (Fig. 8). This is mainly the result of Campanian inversion and erosion (see discussion below), but the effect was possibly strengthened by rim synclines of the salt structures. Halokinesis also resulted in erosion of the chalk on top of the salt diapirs (Ten Veen, Van Gessel & Den Dulk, Reference Ten Veen, Van Gessel and Den Dulk2012; Van Winden et al. Reference Van Winden, De Jager, Jaarsma, Bouroullec, Kilhams, Kukla, Mazur, McKie, Mijnlieff and van Ojik2018).
In the SW Cleaverbank Platform, a major salt wall is present. Salt activity started here during the late Turonian, creating onlap structures onto a local high (Fig. 7). This salt wall continued growing until the earliest Maastrichtian.
6.c. Coniacian–Santonian uplift of the Cleaverbank platform
The absence of Coniacian and Santonian deposits on the Cleaverbank Platform (Figs. 6 and 7) probably resulted from non-deposition, caused by tectonic uplift of the Cleaverbank Platform from Coniacian time onwards. The alternative explanation of uplift during the Campanian and erosion of Coniacian to Santonian deposits seems less likely in the absence of evidence of erosion in seismic and well data.
Van der Molen (Reference Van Der Molen2004) stated that at least the southern Cleaverbank Platform (K-quadrant, outside the study area) subsided rapidly during Coniacian to Campanian times and that the entire Cleaverbank Platform was tilted south-southeastwards during the early Campanian. Uplift in the NW section (which is located in the study area) could have caused erosion. However, Campanian and post-Campanian deposits lie conformably on top of the Turonian, while onlap structures on the early Campanian are expected in case of early Campanian tilting.
Van Hoorn (Reference Van Hoorn1987) studied the structural evolution of the Sole Pit High in the British part of the Southern North Sea, located c. 50 km SW of the Cleaverbank Platform. Van Hoorn (Reference Van Hoorn1987) dated the first inversion in this area as intra-Turonian. This inversion led to thinning and onlap of Turonian–early Campanian deposits onto the Sole Pit High. A similar tectonic evolution could explain the missing Coniacian–Campanian on the Cleaverbank Platform. However, no onlap features on the Cleaverbank Platform were present in the study area. It is therefore concluded that the Cleaverbank Platform in the study area showed uniform uplift during Coniacian–Campanian times.
6.d. The Sub-Hercynian inversion phase
Clear reflection truncations were recognized below and within the Campanian (Step Graben and western Dutch Central Graben), and below and within the Maastrichtian (Elbow Spit Platform and eastern Dutch Central Graben). These unconformities indicate that the earlier tectonic stability ended during the Campanian. A significant uplift and erosion phase occurred in two pulses during late Campanian and Maastrichtian times in most parts of the study area, except on the Cleaverbank Platform and the Schill Grund Platform, where no evidence of erosion was found. The uplift started at the end of the Campanian in the Step Graben (Fig. 8) and western Dutch Central Graben (Fig. 9). The uplift of the Elbow Spit Platform (Fig. 10) and eastern Dutch Central Graben (Fig. 11) occurred later, during the Maastrichtian.
Van der Molen (Reference Van Der Molen2004) discussed a large uplift and erosion phase in the same area and proposed that the Campanian/Maastrichtian uplift phase did not affect the Cleaverbank Platform and the Schill Grund Platform in the study area. He stated that most of the Dutch North Sea area was uplifted at the end of the Campanian and that uplift continued during the Maastrichtian in the Central Graben, Step Graben and Elbow Spit Platform. This only partly agrees with the interpretations of this study, since the eastern Dutch Central Graben and Elbow Spit Platform appeared to be affected during Maastrichtian times. However, in the western Dutch Central Graben, the erosional surface coincides clearly with the top of the Campanian, which indicates that uplift within that part of the basin did not continue into the Maastrichtian.
A widely recognizable regional unconformity in the southeastern part of the study area was identified by M. Huijgen (unpub. M.Sc. thesis, Vrije Universiteit, Amsterdam, 2014). It comprises parts of the Step Graben, Dutch Central Graben and Schill Grund Platform. Huijgen interpreted the erosive unconformity to be of late Campanian age, which slightly differs from the interpretation proposed in this study which is based on a more extensive analysis of the biostratigraphic data of a higher number of wells.
A large erosive unconformity of late Campanian age, similar to the one in the western Dutch Central Graben of the study area, was determined by M. Saes (unpub. M.Sc. thesis, Utrecht Univ., 2013) in the southern part of the Dutch Central Graben, c. 50 km south of the area of this study.
According to De Jager (Reference De Jager, Wong, Batjes and de Jager2007), inversion in the Dutch Central Graben started at the onset of chalk deposition and peaked during the Late Campanian, creating post-Campanian onlapping unconformities. This means that uplift did not continue during the Maastrichtian, which contrasts with the results of this study supported by new and detailed seismic data.
A widespread erosional unconformity was not only recognized in the Dutch North Sea but also in Germany, Denmark, Norway and the United Kingdom. Anderskouv & Surlyk (Reference Anderskouv and Surlyk2011) found evidence of erosion near the Campanian–Maastrichtian boundary in the Danish North Sea and explained it by an inversion pulse or a significant sea-level drop. Vejbӕk & Andersen (Reference Vejbæk and Andersen2002) stated that continuous inversion took place and identified three different Sub-Hercynian phases of increased intensity: latest Santonian, mid Campanian and late Maastrichtian. The latter two roughly coincide with the two inversion pulses found in the Dutch northern North Sea of this study.
In the Chalk Group in the Norwegian North Sea three different phases were identified: a pre-inversion phase, a syn-inversion phase and a post-inversion phase (Gennaro et al. Reference Gennaro, Wonham, Gawthorpe and Saelen2013). The inversion initiated in the Norwegian Central Graben during the latest Coniacian-to-earliest Santonian and ended at the end of the Campanian. The inversion culminated during the Santonian. The Sub-Hercynian inversion phase thus ended earlier in the Norwegian North Sea than in the Dutch and Danian North Sea, where Maastrichtian inversion occurred.
Evidence of local inversion was also found in the German sector of the North Sea. A major phase of inversion during the Santonian and Campanian affected especially the eastern part of the German Central Graben (Kockel, Reference Kockel1995; Arfai et al. Reference Arfai, Jähne, Lutz, Franke, Gaedicke and Kley2014). Surlyk, Jensen & Engkilde (Reference Surlyk, Jensen and Engkilde2008) studied the Chalk Group of the Schillgrund High and discussed that the Cenomanian to Campanian deposits were tilted towards the SW at the Campanian–Maastrichtian boundary, overlain by onlapping deposits. No evidence for such tilting was found in the present study area.
6.e. The Laramide inversion phase
Reflection truncations are also visible in the upper part of the Chalk Group below the Palaeogene clastics (Fig. 12). Danian and even upper Maastrichtian reflections are truncated at the Top Chalk on parts of the Cleaverbank Platform and Elbow Spit Platform. These truncations indicate that uplift and erosion occurred at the end of the Danian in almost the entire study area. This inversion phase is referred to as the Laramide phase (Van der Molen, Reference Van Der Molen2004; De Jager, Reference De Jager, Wong, Batjes and de Jager2007). As stated, the Danian sequence is very thin, mostly only one reflection (which is c.16–20 m), except for some anomalies on the Elbow Spit Platform and in the Step Graben. It is not possible to constrain the initial thickness of the Danian from the available data and thus it is unknown how much of the Danian sequence was removed by the Late Danian uplift and erosion phase in this area. On the Cleaverbank Platform and on the Elbow Spit Platform, the Danian inversion took place along a N–S axis and removed Danian and Late Maastrichtian deposits. Danian deposits are also absent in the SE part of the study area (Fig. 3). It is uncertain whether this is a result of the Laramide inversion and erosion, or a result of non-deposition. No evidence of erosion was found.
Van der Molen (Reference Van Der Molen2004) argued that the Laramide phase affected the Dutch Central Graben more than the Elbow Spit High and the Cleaverbank Platform, based on the abundance of reworked chalk found in seismic data. This may be in agreement with this study because the Danian is absent in a large part of the Dutch Central Graben. However, the cause of this absence is uncertain. Van der Molen et al. (Reference Van Der Molen, Dudok Van Heel and Wong2005) stated that the Laramide inversion phase led to the complete removal of the Chalk Group in parts of the Dutch Central Graben, but they did not show clear seismic reflection truncations that support this strong Danian inversion phase.
6.f. Comparison of the inversion phases
According to De Jager (Reference De Jager, Wong, Batjes and de Jager2007), the Laramide inversion in the Dutch Central Graben was stronger than the Sub-Hercynian phase, because of the deep truncation of older deposits below the Palaeogene. Based on the data of this study, it is not easy to compare these events, for two reasons. Firstly, the original thickness of the Danian deposits in the study area is unknown, although the sequence most likely was relatively thin. Biostratigraphic data of the well A12-01, located 50 km north of the study area (Fig. 1), show a Danian thickness of c. 60 m (NLOG). In this well, the lower Palaeocene chalk is conformably overlain by upper Palaeocene deposits, so the Danian sequence was not affected by inversion. Secondly, the Sub-Hercynian phase did not have the same timing in the western and eastern Dutch Central Graben. However, the Sub-Hercynian phase is known to have eroded at least Santonian to Campanian deposits in the west and Campanian to lower Maastrichtian deposits in the east (Figs 9 and 11). It is unlikely that the Santonian to Campanian sequence or the Campanian to lower Maastrichtian sequence (removed by the Sub-Hercynian inversion) was originally thinner than the upper Maastrichtian to Danian sequence (removed by the Laramide inversion). This idea is based on the periods of deposition time that these eroded sequences cover, which is c. 14–15 million years for the Sub-Hercynian phase and 7–8 million years for the Laramide phase (Cohen et al. Reference Cohen, Finney, Gibbard and Fan2013). When assuming similar deposition rates, the Sub-Hercynian inversion must have had a stronger impact. However, this hypothesis is not confirmed by the thicknesses of the units on the Schill Grund Platform, where no evidence was found for a Sub-Hercynian inversion phase and deposition could thus have been continuous. In the latter area the Danian is absent while the Maastrichtian sequence is extremely thick and even thicker than the Santonian and Campanian sequence together. Therefore, it is likely that on the Schill Grund Platform the original Maastrichtian–Danian sequence was thicker than the original Santonian–Campanian sequence and thus the Laramide phase was stronger than the Sub-Hercynian phase. On the other hand, the thicknesses or deposition rates on the Schill Grund Platform could be different from the other structural elements, so it is uncertain if the Schill Grund Platform is a good analogue for the entire area. In addition, the thicknesses of the Maastrichtian sequence may be strongly influenced by an irregular sea floor morphology during deposition and by redeposition processes.
M. Saes (unpub. M.Sc. thesis, Utrecht Univ., 2013) concluded that in the southernmost part of the Dutch Central Graben the intensity of the Laramide phase was smaller than that of the Sub-Hercynian phase. This contradicts the conclusions from Van der Molen (Reference Van Der Molen2004) and also the outcome of this study, when assuming that the absence of the Danian is a result of erosion.
The results show that the Laramide phase had the lowest impact on the Step Graben, where the Sub-Hercynian phase was possibly strongest compared to the rest of the study area. The late Campanian Sub-Hercynian inversion phase eroded not only the Campanian and Santonian, but also the Coniacian and parts of the Turonian. The Danian sequence is relatively thick in the Step Graben, indicating a limited effect of the Laramide phase. Based on these observations, it is likely that the Sub-Hercynian phase was stronger than the Laramide phase in the Step Graben.
On the Elbow Spit Platform, the Laramide phase removed the entire Danian sequence along two N–S inversion axes and locally also a part of the Maastrichtian (Figs 3, 7 and 10). The Sub-Hercynian phase eroded a lower Maastrichtian sequence, preserving older sequences (Fig. 10). It is not known how much of the Maastrichtian was eroded. Therefore, it is not possible to evaluate which inversion phase had a larger influence on the Elbow Spit Platform.
The Cleaverbank Platform and Schill Grund Platform contain no evidence of a Sub-Hercynian erosive event in the study area and likely have been inverted only at the end of the Danian (Figs 6 and 7).
Deckers & Van der Voet (Reference Deckers and Van der Voet2018) identified a distinction between the structural styles of the Sub-Hercynian and Laramide inversion phases in the southern North Sea, which is supported by the results from this study. They showed that the Sub-Hercynian phase was characterized by strong uplift and erosion, which is also visible in the Step Graben, Elbow Spit Platform and Dutch Central Graben (Figs 8–11) while the Laramide phase caused only mild domal uplift, as visible on the Cleaverbank Platform (Fig. 12).
7. Discussion of sedimentary and redeposition features
Besides thickness variations as a result of tectonic events, smaller-scale seismic discontinuities are present which are interpreted to result from either bottom currents or gravity-related resedimentation processes.
7.a. Incision features
The incision features described in Section 5 (Fig. 13) were interpreted to result from bottom currents of different scales. Evidence of channels of 300 m up to 1200 m wide was mainly found in the Dutch Central Graben. The channels are oriented parallel to the slope and hence may represent contour current features (e.g. Faugères et al. Reference Faugères, Stow, Imbert and Viana1999).
A series of studies were published during the last two decades on the sedimentary and redeposition features present within the Chalk Group in the North Sea (above-mentioned references and Evans & Hopson, Reference Evans and Hopson2000; Evans et al. Reference Evans, Hopson, Kirby and Bristow2003; Lykke-Andersen & Surlyk, Reference Lykke-Andersen and Surlyk2004; Surlyk, Damholt & Bjerager, Reference Surlyk, Damholt and Bjerager2006; Anderskouv, Damholt & Surlyk, Reference Anderskouv, Damholt and Surlyk2007; Esmerode, Lykke-Andersen & Surlyk, Reference Esmerode, Lykke-Andersen, Surlyk, Vianna and Rebesco2007; Surlyk & Lykke-Andersen, Reference Surlyk and Lykke-Andersen2007; Esmerode, Lykke-Andersen & Surlyk, Reference Esmerode, Lykke-Andersen and Surlyk2008; Surlyk, Jensen & Engkilde, Reference Surlyk, Jensen and Engkilde2008; Back et al. Reference Back, Van Gent, Reuning, Grötsch, Niederau and Kukla2011; Gennaro & Wonham, Reference Gennaro, Wonham, Martinius, Howell, Steel and Wonham2014; Masoumi et al. Reference Masoumi, Reuning, Back, Sandrin and Kukla2014; Gale et al. Reference Gale, Anderskouv, Surlyk and Whalley2015; Arfai et al. Reference Arfai, Lutz, Franke, Gaedicke and Kley2016).
Syn-sedimentary channel features were first imaged in seismic data within the chalk of southern England, by Evans & Hopson (Reference Evans and Hopson2000) and Evans et al. (Reference Evans, Hopson, Kirby and Bristow2003). These channels are oriented parallel to the bathymetric contours. Lykke-Andersen & Surlyk (Reference Lykke-Andersen and Surlyk2004) described a major contour current system in the Danish Basin with channels up to 20 km wide. Evidence of contour-parallel bottom currents with contourite deposits and a very irregular sea floor topography was also found in seismic data from eastern Denmark (Surlyk & Lykke-Andersen, Reference Surlyk and Lykke-Andersen2007) and the Danish Central Graben (Esmerode, Lykke-Andersen & Surlyk, Reference Esmerode, Lykke-Andersen and Surlyk2008). Back et al. (Reference Back, Van Gent, Reuning, Grötsch, Niederau and Kukla2011) discussed multiple channel incisions on seismics in the southern Danish North Sea. However, these were mainly slope-perpendicular and interpreted as gravity-driven. The previously described contourite deposits caused by contour currents in the Danish and British North Sea largely resemble the incision features found in this study which are up to kilometre-scale, sinuous and slope-parallel (Fig. 13).
The anomaly of the Danian thickness in the Step Graben (Fig. 14) may be the result of a large channel incision during the Danian. In parts of the Step Graben, this idea of incision is supported by angular unconformities. This evidence is absent in other parts, which makes the interpretation of a channel not very certain. On the other hand, Surlyk, Jensen & Engkilde (Reference Surlyk, Jensen and Engkilde2008) identified a very similar feature on the German Schillgrund High and also interpreted this as a deep channel, up to 15 km wide and 200 m deep (Fig. 14). The channel is interpreted to be of the same age as the feature in the Step Graben.
7.b. Distorted reflection features
The described complexes of chaotic and distorted reflections are interpreted as slope failure features caused by gravity-induced processes. Indications for mass transport deposits (MTDs) are visible in many parts of the Dutch Central Graben. These deposits mostly include slumps that transport slope material downhill and show a detachment surface. Two examples of such slumps are illustrated in Figure 15. The slumps that were found in the study area are up to seven km in length along the axis of displacement.
Especially in the Dutch Central Graben, relatively steep slopes must have been present during the deposition of the Chalk Group due to inversion. Multiple kinds of mass movement were recognized in the chalk in many areas of the North Sea, from both seismic data and drill cores (Kennedy, Reference Kennedy1980, Reference Kennedy1987Reference Kennedya, Reference Kennedy, Brooks and Glennieb; Evans et al. Reference Evans, Hopson, Kirby and Bristow2003; Lykke-Andersen & Surlyk, Reference Lykke-Andersen and Surlyk2004; Van der Molen et al. Reference Van Der Molen, Dudok Van Heel and Wong2005; Surlyk, Jensen & Engkilde, Reference Surlyk, Jensen and Engkilde2008; Anderskouv & Surlyk, Reference Anderskouv and Surlyk2011; Back et al. Reference Back, Van Gent, Reuning, Grötsch, Niederau and Kukla2011).
Esmerode, Lykke-Andersen & Surlyk (Reference Esmerode, Lykke-Andersen and Surlyk2008) discussed the link between bottom currents and slope failure and stated that the current activity caused erosion, which caused slope instability and triggered slumping. Such slumping as a result of channel margin collapse has also been described from Late Cretaceous chalk outcrops in S England by Gale et al. (Reference Gale, Anderskouv, Surlyk and Whalley2015).
Most sedimentary and redeposition features in the study area were found in the Dutch Central Graben. This may be a result of the strong inversion that took place in this area and the sea floor topography that already existed at the onset of chalk deposition, as interpreted based on onlapping Cenomanian reflections (Fig. 9). Steep slopes may have been present in the Dutch Central Graben during almost the entire Late Cretaceous and Early Palaeogene, partly due to salt movement. As a result, the chalk was exposed to syn-sedimentary processes such as contour-parallel bottom current activity and downslope mass movements. Hence, internal disconformities and pinchouts are features that frequently occur within these chalk deposits.
8. Conclusions
The development of the Chalk Group in the northern Dutch North Sea was reconstructed by interpreting seven chronostratigraphic units based on the integration of 3D seismic data and biostratigraphic well data. The chalk evolution is influenced by multiple processes, generally subdivided into tectonic and sedimentation processes or redeposition events.
The first period of chalk deposition was a phase of relative tectonic quiescence and lasted from the Cenomanian to approximately the Campanian. Evidence of two exceptions to this tranquillity was found. First, southwestward tilting took place during the Turonian and created accommodation space in the SW. Next, little or no deposition of Coniacian and Santonian sediments occurred on the Cleaverbank Platform, while subsidence continued in the Step Graben and western Dutch Central Graben.
Widespread inversion and erosion affected the Chalk Group showing two pulses during the Late Campanian and Maastrichtian (Sub-Hercynian phase). The timing of the uplift differs between the structural elements in the study area, starting in the western Dutch Central Graben and Step Graben during the Late Campanian, and ending in the Elbow Spit Platform and eastern Dutch Central Graben during the Maastrichtian. The second Maastrichtian pulse was never reported before in this area.
After the Campanian/Maastrichtian inversion phase, subsidence took place and Late Maastrichtian and Danian sediments were deposited. At the end of the Danian, renewed uplift occurred and parts of the Danian sequence were eroded, leading to very thin Danian deposits in the study area. The inversion was strongest in two N–S strips of the Elbow Spit Platform and Cleaverbank Platform, where the entire Danian sequence was removed as well as parts of the Maastrichtian sequence.
Halokinesis caused subsidence at a smaller scale influencing the chalk deposition, especially in the Step Graben and Dutch Central Graben where a series of salt diapirs and walls are present.
Evidence of channel incisions was found in the study area at different scales. A prominent Danian thickness increase through the centre of the Step Graben was interpreted as a large channel. In addition, evidence of slope failure was found in the form of slumps or slides. These observations indicate that the chalk sea in the study area was obviously far from quiet and flat, and chalk reworking occurred at a large scale.
Acknowledgements
The geoscientists of the technical department of EBN are thanked for sharing their valuable knowledge for this study, and for their helpful feedback and discussions. Furthermore, we thank Prof. Dr Jan de Jager (Vrije Universiteit Amsterdam) and Jef Deckers (VITO) for the inspiring discussions and their support improving the manuscript. Eva van der Voet was supported by the MSc programme of the Vrije Universiteit Amsterdam. John Reijmer acknowledges the support of the College of Petroleum Engineering & Geosciences (King Fahd University of Petroleum & Minerals, Dhahran, Saudi Arabia). This is CPG – CarbSedGroup publication no. 21. The manuscript has been significantly improved thanks to constructive reviews by Prof. Dr Kresten Anderskouv, an anonymous reviewer and the editor (Prof. Dr Stephen Hubbard).