1. Introduction
Corona structure between olivine and plagioclase is a common phenomenon in mafic rocks (Griffin & Heier, Reference Griffin and Heier1973; Ambler & Ashley,Reference Ambler and Ashley1977; Esbensen, Reference Esbensen1978; Van Lamoen, Reference Van Lamoen1979; Turner & Stüwe, Reference Turner and Stüwe1992; de Haas et al. Reference de Haas, Nijland, Valbracht, Maijer, Verschure and Andersen2002; Lang et al. Reference Lang, Wachter, Peterson and Ryan2004; Larikova & Zaraisky, Reference Larikova and Zaraisky2009; Gallien et al. Reference Gallien, Mogessie, Hauzenberger, Bjerg, Delpino and Castro de Machuca2012; Jašarová et al. Reference Jašarová, Racek, Jeřábe and Holub2016; Kendrick & Jamieson, Reference Kendrick and Jamieson2016; Banerjee et al. Reference Banerjee, Dutta, Anand and Atlas2019). Pyroxenes ± spinel and amphiboles ± spinel occur commonly as layers in such coronae. In addition, clinopyroxene and garnet are reported as product phases in coronae between olivine and plagioclase (Frodesen, Reference Frodesen1968; Gallien et al. Reference Gallien, Mogessie, Hauzenberger, Bjerg, Delpino and Castro de Machuca2012; Faryad et al. Reference Faryad, Kachlík, Sláma and Hoinkes2015; Kendrick & Jamieson, Reference Kendrick and Jamieson2016). Some authors have attributed the formation of such coronae to magmatic processes in which the initially crystallized phase of olivine reacts with the residual melt to form the subsequent layers (Joesten, Reference Joesten1986; de Haas et al. Reference de Haas, Nijland, Valbracht, Maijer, Verschure and Andersen2002). However, many researchers have inferred the coronae to have formed through metamorphic reactions in a sub-solidus state (Reynolds & Frederickson, Reference Reynolds and Frederickson1962; Morton et al. Reference Morton, Batey and O’Nions1970; Van Lamoen, Reference Van Lamoen1979; Zeck et al. Reference Zeck, Shenouda, Rønsbo and Poorter1982; Mongkoltip & Ashworth, Reference Mongkoltip and Ashworth1983; Tuisku & Makkonen, Reference Tuisku and Makkonen1999; Kendrick & Jamieson, Reference Kendrick and Jamieson2016; Banerjee et al. Reference Banerjee, Dutta, Anand and Atlas2019). Auto-metasomatism is also considered as a probable mechanism of coronae formation by many workers (Sederholm, Reference Sederholm1916; Frodesen, Reference Frodesen1968; Esbensen, Reference Esbensen1978). A combined origin, that is, a magmatic origin for the orthopyroxene ± magnetite layer of the coronae succeeded by a metamorphic amphibole ± spinel rim, has also been proposed for coronae between olivine and plagioclase (Gallien et al. Reference Gallien, Mogessie, Hauzenberger, Bjerg, Delpino and Castro de Machuca2012). However, preservation of the coronae texture suggests that, no matter which process was responsible for its formation, very little to no deformation occurred after the formation of the coronae (Wayte et al. Reference Wayte, Worden, Rubie and Droop1989; Lang & Gilotti, Reference Lang and Gilotti2001).
The genesis of coronae may occur under a variety of metamorphic conditions. Coronae formation has been reported to occur over a wide temperature range of 550–800°C (Barton & Van Gaans, Reference Barton and Van Gaans1988; Candia et al. Reference Candia, Mazzucchelli and Siena1989; Claeson, Reference Claeson1998; Gallien et al. Reference Gallien, Mogessie, Hauzenberger, Bjerg, Delpino and Castro de Machuca2012; Jašarová et al. Reference Jašarová, Racek, Jeřábe and Holub2016; Kendrick & Jamieson Reference Kendrick and Jamieson2016; Banerjee et al. Reference Banerjee, Dutta, Anand and Atlas2019). Some authors have even suggested temperatures close to 900°C for the process (Johnson & Carlson, Reference Johnson and Carlson1990; Lang et al. Reference Lang, Wachter, Peterson and Ryan2004). Similarly, coronae texture has been reported for a broad pressure range, from pressures as low as 1 kbar (Turner & Stüwe, Reference Turner and Stüwe1992) to 5–10 kbar (Griffin Reference Griffin1971; Gill Reference Gill, Wyllie, El Goresy, von Engelhardt and Hahn1981; Rivers & Mengel, Reference Rivers and Mengel1988; Dasgupta et al. Reference Dasgupta, Sengupta, Mondal and Fukuoka1993; Claeson, Reference Claeson1998; Gallien et al. Reference Gallien, Mogessie, Hauzenberger, Bjerg, Delpino and Castro de Machuca2012). However, irrespective of the pressure–temperature (P-T) conditions of coronae formation, the presence and role of fluids is understood to be a major controlling factor (Gaidies et al. Reference Gaidies, Milke, Heinrich, Abart and Heinrich2017).
The formation of corona textures is generally attributed to either a steady, single-stage diffusion process (Ashworth & Sheplev, Reference Ashworth and Sheplev1997) or to a multi-stage discontinuous process (Joesten, Reference Joesten1986; Banerjee et al. Reference Banerjee, Dutta, Anand and Atlas2019). The single-stage model explains the formation of the zoned layers found in coronae through attainment of local equilibrium and movement of elements in response to a chemical potential gradient across coronae layers at a constant P-T (Korzhinskiĭ, Reference Korzhinskiĭ1959; Joesten, Reference Joesten1977; Mongkoltip & Ashworth, Reference Mongkoltip and Ashworth1983; Grant, Reference Grant1988; Johnson & Carlson, Reference Johnson and Carlson1990). The multi-stage process also takes place in response to changing chemical potential gradients, but in a stepwise and sequential manner. Under this model, new layers are formed and old layers are resorbed, causing overprinting signatures. This method is triggered either through changing P-T or changes in component movement caused by an evolving local bulk composition (Griffin, Reference Griffin, Doe and Smith1972; Griffin & Heier, Reference Griffin and Heier1973; Joesten, Reference Joesten1986; Indares, Reference Indares1993; White et al. Reference White, Powell and Clarke2002; Banerjee et al. Reference Banerjee, Dutta, Anand and Atlas2019).
Replacement textures in rocks develop at the boundaries of reactant phases that were initially in equilibrium, but become unstable as an assemblage due to changing conditions. Corona-like replacement textures form as concentric zones along the contact of the reactant phases, representing a state of partial equilibration, and are a manifestation of arrested reactions. Changes in pressure and temperature and the development of chemical potential gradients across reactant phase boundaries are common controlling factors for the formation of the coronae; however, the extent of their development depends on reaction duration, diffusion rates, etc. (Ogilvie & Gibson, Reference Ogilvie and Gibson2017). The presence of such partially equilibrated textures is important because, if the rock had reached total equilibrium, the change in physicochemical signatures during metamorphism would become unclear (Mueller et al. Reference Mueller, Watson and Harrison2010; White & Powell, Reference White and Powell2011; Ogilvie & Gibson, Reference Ogilvie and Gibson2017). Partial replacement textures such as corona can therefore play a key role in understanding the evolution of a rock in P-T-X space.
With this background, our study is an integrated approach of field, petrography, mass balance and thermodynamic modelling to evaluate the genesis of a layered coronal structure developed in a mafic rock from the Chotanagpur Granite Gneissic Complex (CGGC), India. The CGGC played a pivotal role in the assembly of Rodinia (Hoffman, Reference Hoffman1989; Dalziel, Reference Dalziel1991; Dasgupta & Sengupta, Reference Dasgupta, Sengupta, Yoshida, Windley and Dasgupta2003; Li et al. Reference Li, Bogdanova, Collins, Davidson, De Waele, Ernst, Fitzsimons, Fuck, Gladkochub, Jacobs and Karlstrom2008; Chatterjee et al. Reference Chatterjee, Banerjee, Bhattacharya and Maji2010; Mukherjee et al. Reference Mukherjee, Dey, Sanyal, Sengupta and Mukherjee2019). Most research publications on the CGGC have generally focused on the northern and central part of the terrane (Roy, Reference Roy1977; Bhattacharyya & Mukherjee, Reference Bhattacharyya and Mukherjee1987; Mukherjee et al. Reference Mukherjee, Ghose and Chatterjee2005; Maji et al. Reference Maji, Goon, Bhattacharya, Mishra, Mahato and Bernhardt2008; Chatterjee & Ghose, Reference Chatterjee and Ghose2011; Das et al. Reference Das, Sanyal, Karmakar, Sengupta and Sengupta2019). Some recent publications on the SE CGGC (Chatterjee et al. Reference Chatterjee, Banerjee, Bhattacharya and Maji2010; Karmakar et al. Reference Karmakar, Bose, Sarbadhikari and Das2011) have dealt with the petrological, geochemical and tectonic evolution of the area, but there still exists a dearth of geological information from the SE extremities (Mukherjee et al. Reference Mukherjee, Dey, Sanyal, Sengupta and Mukherjee2019). The location of the studied sample is the SE part of the CGGC. Petrological information on the corona-forming process and the physicochemical condition in which it developed is therefore expected to contribute to the understanding of the geological evolution of this terrain during the later stages of Rodinia amalgamation.
2. Regional geology and field setting
2.a. Regional geology of Chotanagpur Granite Gneissic Complex, India
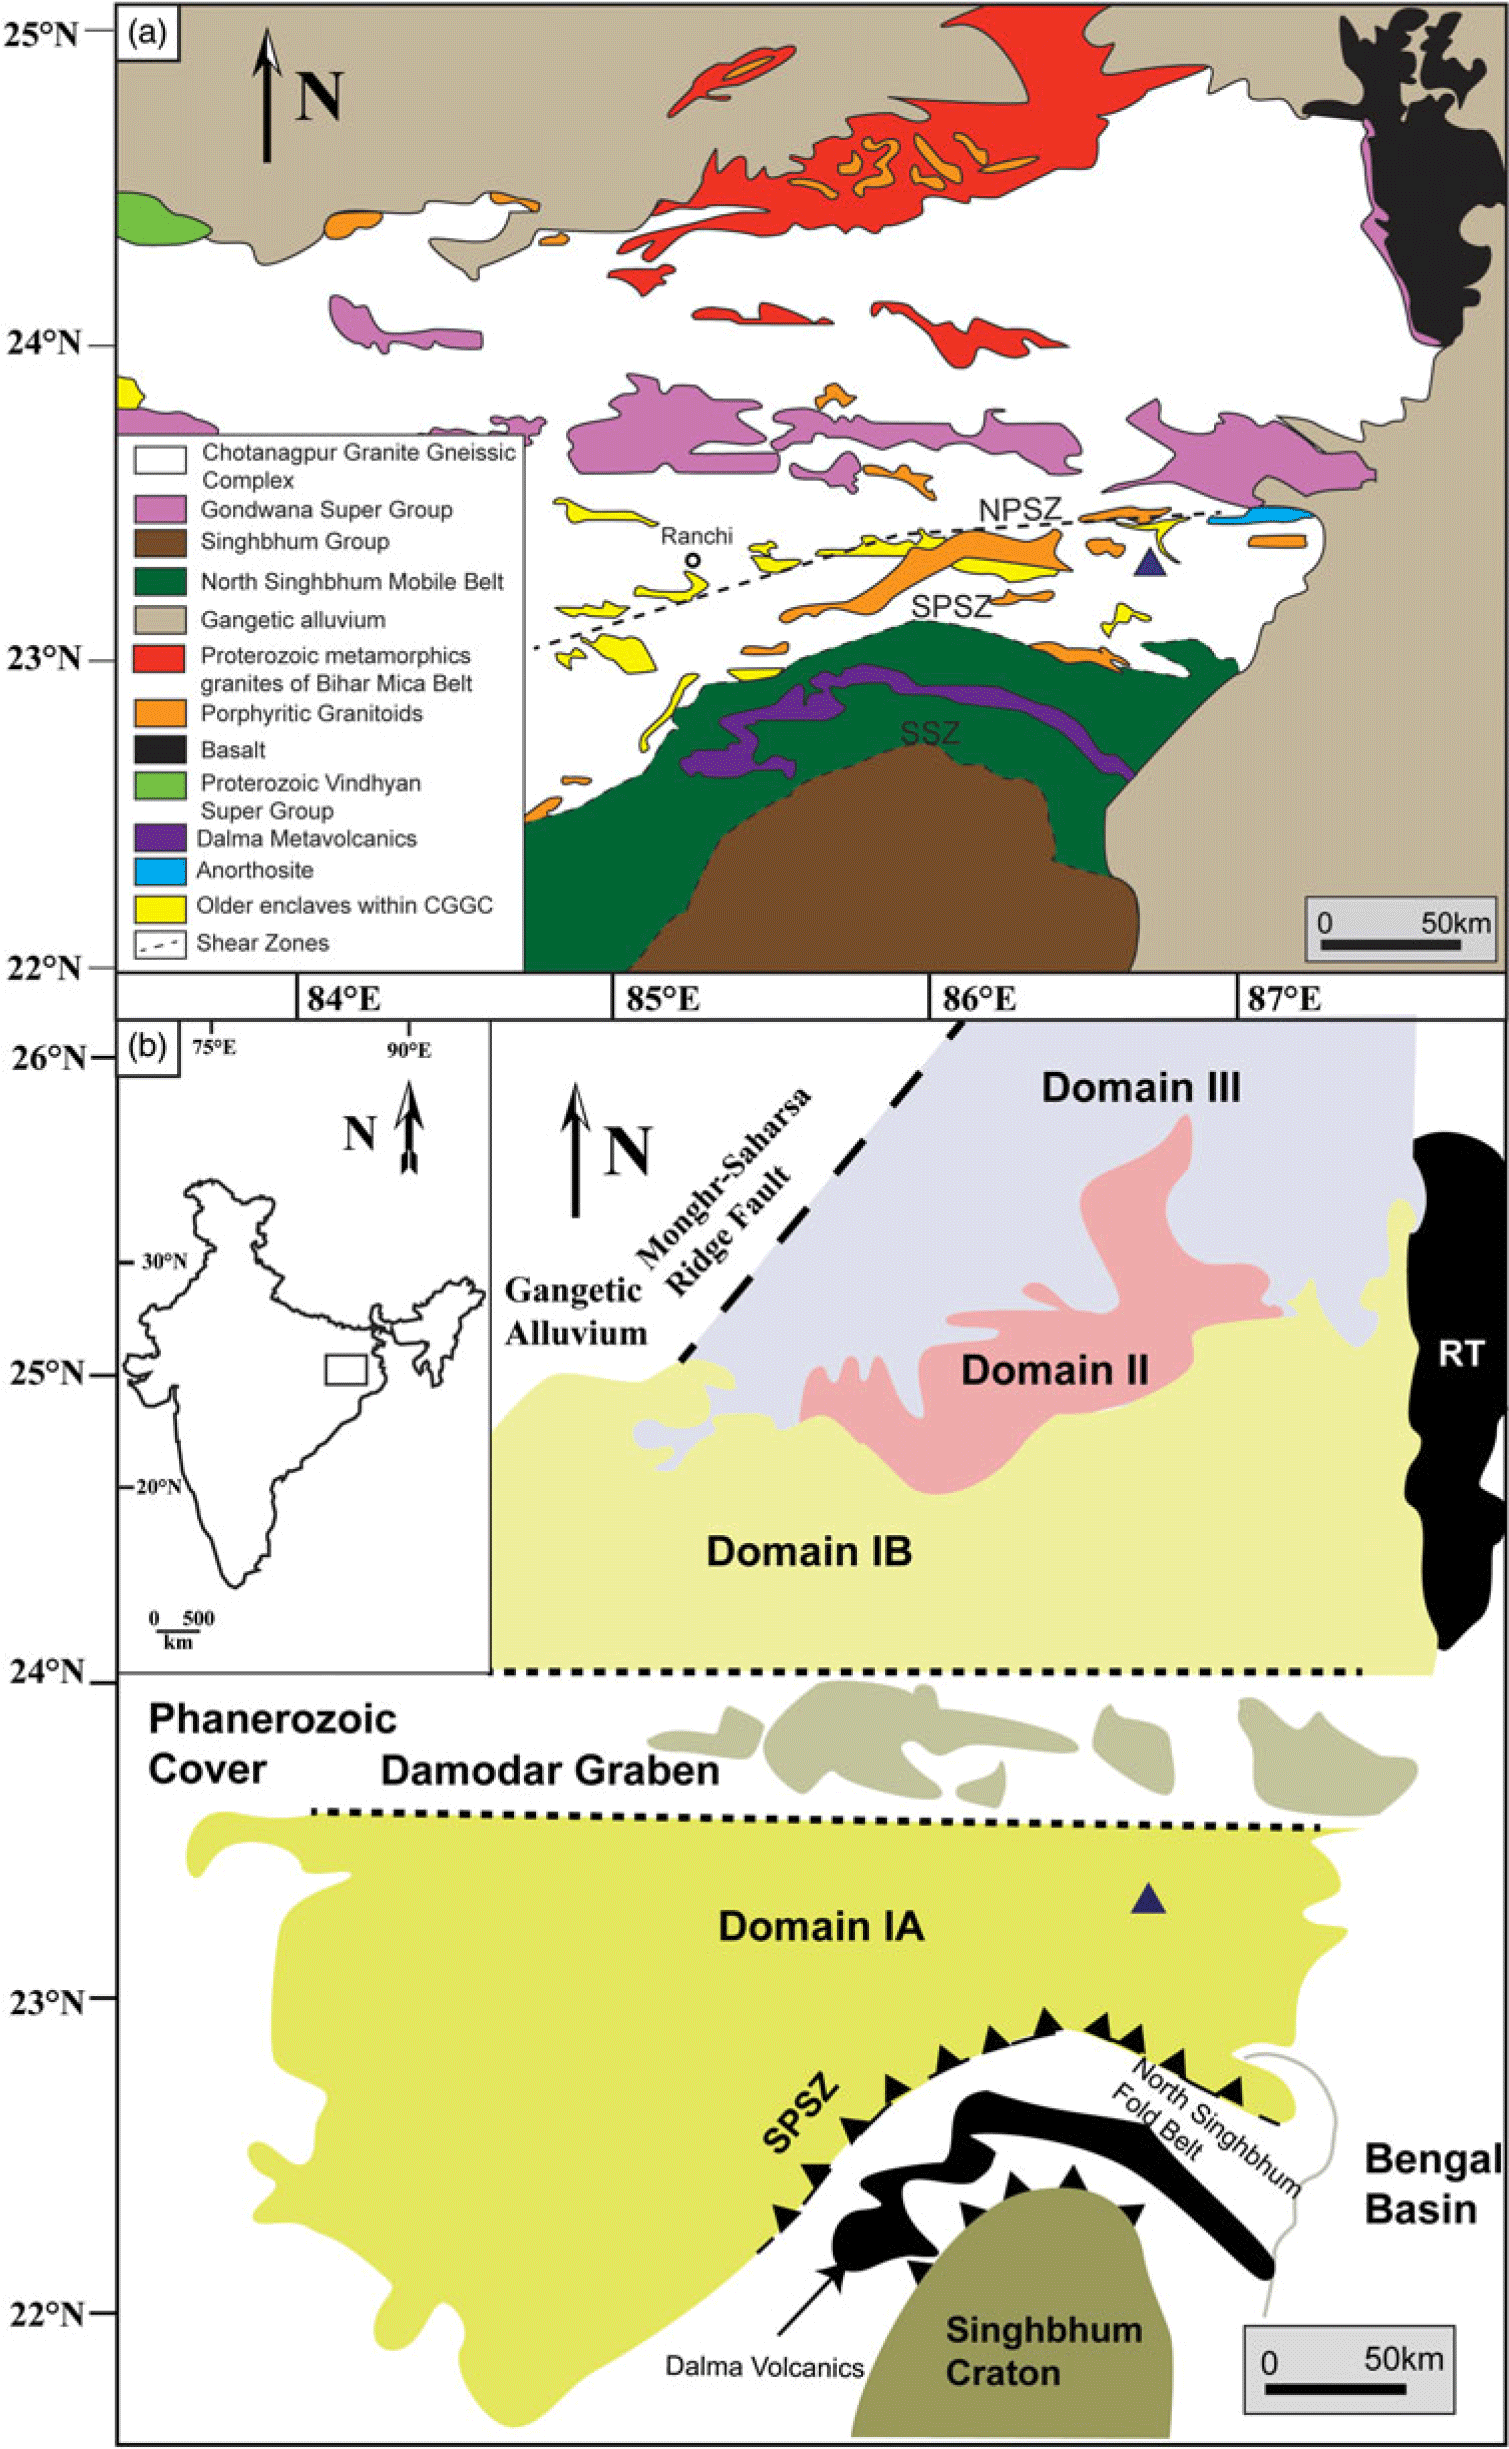
The CGGC is a majorly E–W-trending Proterozoic mobile belt (Meert et al. Reference Meert, Pandit, Pradhan, Banks, Sirianni, Stroud, Newstead and Gifford2010; Mukherjee et al. Reference Mukherjee, Dey, Sanyal, Sengupta and Mukherjee2019) located in eastern India, covering an area of c. 100 000 km2 (Fig. 1a). It is bounded on the eastern and western margins by the Bengal Basin and the Gondwana deposits, respectively (Mahadevan, Reference Mahadevan2002). Its NE boundary is marked by the Mesozoic volcanic rocks of Rajmahal Trap. The Vindhyan sediments and the Mahakoshal group of rocks mark its NW limits. The southern boundary of the CGGC is with the North Singhbhum Mobile Fold Belt (NSMB). This contact is marked by the South Purulia Shear Zone (SPSZ) (Fig. 1a). A broad assortment of mantle- and crustal-derived rocks are hosted within the CGGC (Meert et al. Reference Meert, Pandit, Pradhan, Banks, Sirianni, Stroud, Newstead and Gifford2010), which have all been metamorphosed or tectonically deformed to varying degrees (Mahmoud et al. Reference Mahmoud, Mitra, Dhar, Sarkar, Mandal and Srivastava2008). The major rock types comprising the CGGC are granitoid gneisses, migmatites, porphyritic granites, older enclaves of metapelitic gneisses, amphibolites, calc-granulites, anorthosites, mafic granulites and leptynites, which have all suffered varying degrees of metamorphism and deformation (Mahadevan, Reference Mahadevan2002; Sanyal & Sengupta, Reference Sanyal, Sengupta, Mazumder and Saha2012; Goswami & Bhattacharyya, Reference Goswami and Bhattacharyya2013; Mandal & Ray, Reference Mandal and Ray2015; Mukherjee et al. Reference Mukherjee, Dey, Sanyal, Sengupta and Mukherjee2019). The scarcity of detailed lithological, petrological and geochronological data has proven to be a major hindrance in obtaining a plausible classification of the CGGC. No geological information is available for a vast expanse of the CGGC (Mukherjee et al. Reference Mukherjee, Dey, Sanyal, Sengupta and Mukherjee2019). Dispersed distribution of exposures, tropical weathering and urbanization further complicates the issue. Mukherjee et al. (Reference Mukherjee, Dey, Sanyal, Sengupta and Mukherjee2019) divided the CGGC into three domains based on lithology, metamorphic evolution and geochronological data (Fig. 1b): Domain I (includes IA and IB), Domain II and Domain III. However, intra- and inter-domain correlation of metamorphic and deformational events is problematic as the available geological information is discontinuous, disseminated across large areas and lacks precise geochronological data (Mukherjee et al. Reference Mukherjee, Dey, Sanyal, Sengupta and Mukherjee2019). The mafic rocks of this study lies within Domain IA of this classification (Fig. 1b).

Fig. 1. (a) Regional geological map of CGGC (modified after Goswami & Bhattacharyya, Reference Goswami and Bhattacharyya2013) showing the spatial disposition of various lithologies. The study area is highlighted by a triangle. (b) Regional map of CGGC (modified after Mukherjee et al. Reference Mukherjee, Dey, Sanyal, Sengupta and Mukherjee2019) showing the three geological domains; the triangle represents the study area. The rectangle on the inset map of India delimits the area shown. EITZ – Eastern Indian Tectonic Zone; NPSZ – North Purulia Shear Zone; RT – Rajmahal Trap; SPSZ – South Purulia Shear Zone; SSZ – Singhbhum Shear Zone.
Domain I makes up the southernmost part of the CGGC. The major rock type is migmatitic felsic orthogneiss, containing dispersed bodies of other rock types. The lithounits occurring as dismembered bodies within this country rock are mafic granulites, calc-silicate gneisses, khondalites, metapelites, anorthosite and others in the eastern part (Maji et al. Reference Maji, Goon, Bhattacharya, Mishra, Mahato and Bernhardt2008; Bhattacharyya & Mukherjee Reference Bhattacharyya and Mukherjee1987; Chatterjee et al. Reference Chatterjee, Crowley and Ghose2008; Mukherjee et al. Reference Mukherjee, Dey, Sanyal, Sengupta and Mukherjee2019). In the southern part, different granitic bodies are found in association with pelitic schist, garnetiferous gneisses, quartzites and dolerite intrusives. The western part contains migmatites and granite gneisses interlaced with graphite-bearing pelitic schists, limestones and quartzites. The area has been intruded by mafic–ultramafic, anorthositic–komatiitic rocks (Bhattacharya et al. Reference Bhattacharya, Mukherjee and Barla2010). Domain I has suffered three major tectonothermal events, namely: D1-M1 (1650–1600 Ma); D2-M2 (1000–950 Ma); and D3-M3 (c. 900 Ma) (Mukherjee et al. Reference Mukherjee, Dey, Sanyal and Sengupta2018). The regional foliation is dominantly E–W-trending, except along the eastern margin where N–S-oriented open folds formed during D3-M3 are found as a dominant structural feature (Chatterjee et al. Reference Chatterjee, Banerjee, Bhattacharya and Maji2010; Chatterjee, Reference Chatterjee2018). While D1-M1 is indicative of ultra-high-temperature (UHT) metamorphism, the second tectonothermal event (D2-M2) resulted in P-T conditions of c. 9–12 kbar and 800°C. Debate exists around the P-T conditions of metamorphism related to D3-M3 (Mukherjee et al. Reference Mukherjee, Dey, Sanyal and Sengupta2018, Reference Mukherjee, Dey, Sanyal, Sengupta and Mukherjee2019).
Domain II of the CGGC is an ENE–WSW-trending body sandwiched between Domain I and Domain III. It is also known as the Bihar Mica Belt and exposes a distinct lithological package (Mahadevan, Reference Mahadevan2002; Sanyal & Sengupta, Reference Sanyal, Sengupta, Mazumder and Saha2012; Mukherjee et al. Reference Mukherjee, Dey, Sanyal, Sengupta and Mukherjee2019). It is majorly composed of muscovite–biotite schists interbedded with other meta-sedimentary rocks such as conglomerates, micaceous quartzites, calc-silicates and hornblende schists. These rocks have been intruded by different generations of mica-bearing pegmatites along with granitoids and mafic dykes (Mukherjee et al. Reference Mukherjee, Dey, Sanyal, Sengupta and Mukherjee2019). The high-grade rocks of CGGC form the basement of this metasedimentary ensemble, with an erosional conglomerate base separating them (Ghose & Mukherjee, Reference Ghose, Mukherjee, Trivedi, Sarkar, Ghose and Dhar2000).
Domain III forms the northernmost part of the CGGC and is mainly composed of migmatitic quartzofeldspathic gneisses and supracrustal rocks. The supracrustal rocks are mostly quartzite, phyllite and metamorphosed mafic–ultramafic intrusives (Mukherjee et al. Reference Mukherjee, Dey, Sanyal, Sengupta and Mukherjee2019). The entire eastern region of the CGGC comprising the three domains was subsequently metamorphosed under granulite conditions around c. 750 Ma during the formation of the Eastern Indian Tectonic Zone (Chatterjee et al. Reference Chatterjee, Banerjee, Bhattacharya and Maji2010).
2.b. Geology and field setting of the study area
The studied rocks were sampled from a mafic body near Hura, West Bengal, India (Fig. 1a). The study area is located at the southern part of the eastern margin of Domain I of CGGC (Fig. 1b). This region underwent three major phases of deformation: D1, D2 and D3. D1 and D2 are represented by regional E–W-aligned fabrics within the felsic orthogneiss (Chatterjee, Reference Chatterjee2018; Mukherjee et al. Reference Mukherjee, Dey, Sanyal, Sengupta and Mukherjee2019), which is the dominant litho-type of this domain. The D1–D2 composite fabrics were refolded into N–S-trending folds during a later tectonic event, D3 (Chatterjee, Reference Chatterjee2018). Published literature from this domain reported mafic enclaves (Maji et al. Reference Maji, Goon, Bhattacharya, Mishra, Mahato and Bernhardt2008; Dey et al. Reference Dey, Karmakar, Mukherjee, Sanyal, Dutta and Sengupta2019) as well as some younger mafic intrusives (< 950 Ma, Mukherjee et al. Reference Mukherjee, Dey, Sanyal and Sengupta2018) hosted within the felsic orthogneiss country rock. Dey et al. (Reference Dey, Karmakar, Mukherjee, Sanyal, Dutta and Sengupta2019) found that the mafic enclaves locally preserve a fabric developed even earlier than the emplacement of magmatic protolith of the host felsic orthogneiss. At places, this fabric cross-cuts the host rock foliation at a high angle. On the contrary, mafic intrusives display imprints of only the latest deformation events (D3) within them, as these rocks were co-folded with the host gneiss during D3 (Mukherjee et al. Reference Mukherjee, Dey, Sanyal and Sengupta2018). These mafic bodies intruded between the D2 and D3 events (950–920 Ma, intrusion age; Mukherjee et al. Reference Mukherjee, Dey, Sanyal and Sengupta2018) and the intrusion was angular to the fabric formed during D2 within the host (1000–950 Ma; Mukherjee et al. Reference Mukherjee, Dey, Sanyal and Sengupta2018). In microscale, the paragenetic relation indicates that the mafic enclaves suffered multiple stages of metamorphism (M1–M4; Maji et al. Reference Maji, Goon, Bhattacharya, Mishra, Mahato and Bernhardt2008; Dey et al. Reference Dey, Karmakar, Mukherjee, Sanyal, Dutta and Sengupta2019), whereas the intrusives witnessed only one metamorphic event (Bhattacherjee et al. Reference Bhattacharjee, Ray, Ganguly and Saha2012; Mukherjee et al. 2018). The intrusives also display relict igneous textures such as intergranular texture as well as deformation signatures (Bhattacharjee et al. Reference Bhattacharjee, Ray, Ganguly and Saha2012; Mukherjee et al. Reference Mukherjee, Dey, Sanyal and Sengupta2018). Detailed petrography of the studied mafic rock is discussed in Section 4, and the detailed field relation is described in the following.
In the field, the studied mafics completely lack any mesoscopically defined directional feature, whereas the mafic enclaves in and around the study area contain well-preserved foliation within them. The enclaves reveal a cross-cutting relationship between internal foliation and host-rock fabric (Fig. 2a) similar to those reported from Domain I of the CGGC (Maji et al. Reference Maji, Goon, Bhattacharya, Mishra, Mahato and Bernhardt2008; Dey et al. Reference Dey, Karmakar, Mukherjee, Sanyal, Dutta and Sengupta2019). The mafic rocks occur as detached bodies within the felsic orthogneiss and, in some cases, it is present as hillock covering an area of a few hundred square metres. The rocks are massive, medium- to coarse-grained, and mostly homogeneous on the scale of an outcrop (Fig. 2b). The direct contact between these detached bodies and the enclosing gneiss is not seen due to tropical weathering. The largest mafic outcrop (c. 0.1 km2) cross-cuts the regional E–W-aligned fabric of the host felsic orthogneiss and occurs as an elliptical intrusion with its long axis oriented c. N–S. The host rock of the mafic body shows development of gneissosity trending 015–040 (Fig. 2c,d) and tight folds (Fig. 2e) with an axial plane along 020 formed during the D3 event. This gneissosity related to D3 in the host felsic orthogneiss wraps around the mafic body. The field relation of the studied rocks with their host gneiss suggests that the mafic intrusion was a pre-D3 event, and the wrapping of host-rock gneissosity around the intrusive occurred during the D3 event.

Fig. 2. (a) Field photograph of mafic enclave showing fabrics that cross-cut the host felsic orthogneiss foliation. The red line marks the host-rock foliation direction. Note how the internal fabric of the mafic enclave (marked with a yellow line) cross-cuts the host-rock foliation. The arrow shows the direction of movement during deformation. (b) Field photograph of the coronae-bearing mafic rock. (c) The host rock, formed of felsic orthogneiss, has been intruded by the mafic body. (d) Gneissic foliation developed in the country rock. (e) Tight N–S-trending folds in the host rock.
3. Analytical methods
A total of 16 samples were collected from the mafic rock for petrography. Representative samples were chemically analysed for various minerals using a Cameca SX-Five electron microprobe, using four wavelength-dispersive spectrometers at the Central Research Facility, Indian Institute of Technology (Indian School of Mines), Dhanbad, India. The operating voltage and current of the electron beam was 15 kV and 15 nA, respectively. The standards used were: Albite (Na), MgO (Mg), Almandine (Al), Almandine (Si), Orthoclase (K), Apatite (Ca), TiO2 (Ti), Cr2O3 (Cr), Rhodonite (Mn) and Hematite (Fe). Matrix corrections of the raw data were carried out using the ZAF procedure. Backscattered electron images were obtained from the same machine and under the same conditions. Elemental X-ray maps were also generated from the Cameca SX-Five with an operating voltage of 15 kV and current of 20 nA. The dwell time for the X-ray maps was 100 milliseconds per point. The stepping distance for the X-ray map was 4 μm. Mineral abbreviations used are according to Whitney & Evans (Reference Whitney and Evans2010).
4. Petrography
The primary minerals present in the mafic rocks from this study are olivine (Ol), plagioclase (Pl), orthopyroxene (Opx) and clinopyroxene (Cpx). Orthopyroxene also occurs as a secondary phase along with amphibole (Amp) and spinel (Spl), and rarely with ilmenite (Ilm) and magnetite (Mag). The rock shows an inter-granular texture, in which the interstitial spaces between the plagioclase laths are occupied by orthopyroxene and clinopyroxene (Fig. 3a). Clinopyroxene grains almost always contain exsolution lamellae of orthopyroxene (Fig. 3b). Plagioclase grains at some places show prominent zoning (Fig. 3c). Deformation twinning and bending of lamellae are present in plagioclase (Fig. 3d).

Fig. 3. (a) Photomicrograph showing plagioclase laths and interstitial texture. Viewed under cross-polarized light (CPL). (b) BSE image of interstitial clinopyroxene, showing exsolution lamellae of orthopyroxene. (c) Plagioclase showing compositional zoning. Viewed under CPL. (d) Plagioclase showing deformation twinning and bending of twin lamellae. Viewed under CPL. (e) Photomicrograph showing corona structure with olivine at core under CPL. Orthopyroxene occurs beside olivine, followed by amphibole + spinel. Plagioclase is the outermost rim of the corona. (f) Corona structure with rims of orthopyroxene and amphibole + spinel symplectite. Viewed in CPL. (g) Photomicrograph showing olivine in contact with primary orthopyroxene, viewed under CPL. Note that both the orthopyroxene and amphibole + spinel layer do not occur along the olivine–primary orthopyroxene contact, but are only present along olivine boundaries that were previously surrounded by plagioclase. (h) Photomicrograph showing corona structure, viewed under CPL. The orthopyroxene layer has formed adjacent to olivine, while amphibole + spinel has formed beside plagioclase. The orthopyroxene layer shows epitaxial growth. (i) Photomicrograph showing opaque minerals within the orthopyroxene layer. Viewed under plane-polarized light (PPL). (j) Worm-like growth of spinel grains, visible under CPL. The zone with the low abundance of spinel grains lies within the dashed rectangle, present along the centre of the rectangle oriented in an approximately E–W direction. (k) BSE image showing a roughly bimodal size distribution of spinel grains. Coarser grains are present near the plagioclase – amphibole + spinel contact, while finer grains are present towards the orthopyroxene – amphibole + spinel boundary. The dashed rectangle represents the zone of sparse spinel grain distribution. The dashed rectangle in (j) and (k) represents the same zone, viewed under CPL and via BSE imaging, respectively. (l) BSE image of the amphibole + spinel symplectite layer showing pods of orthopyroxene + spinel symplectites. The pods are circled for easy reference. A thin spinel layer can be seen present along the amphibole + spinel – orthopyroxene contact in the NW part of the photo. (m) Enlargements of the circled portion of (l). BSE image of orthopyroxene + spinel symplectic pods. Spinel grains are coarse-grained along the contact between the amphibole and pods, and fine-grained within the pods. (n) BSE image showing the high-angle relationship between spinel grain orientation and layer contacts. Yellow lines represent the contact between respective coronal layers, and red lines denote the direction of elongation of spinel grains. (o) BSE image showing orientation of spinel symplectites. The yellow line represents the elongation direction of spinel grains present within orthopyroxene pods as symplectites. The red line shows the direction of elongation of spinel grains present within the amphibole layer as symplectites. The dashed circle marks the Opx–Spl pods. (p) BSE image of the corona in (f). All the mineral layers of the corona show a sharp boundary. The thickness of the corona layers is different along different sides. (q) BSE image shows clouding in plagioclase. The clouding feature is defined by spinel grains dispersed parallel to the plagioclase lamellae. The dashed lines represent the orientation of the lamellae along which the spinel grains have formed. (r) BSE image showing brown amphibole (Br-Amp in figure) along the grain boundary of clinopyroxene.
Coronal layers between olivine and plagioclase has a mineral sequence of Opx | Amp + Spl symplectite (Fig. 3e, f). The corona texture develops only at places where the olivine grain is in contact with plagioclase, and is absent where the olivine grain is in contact with a primary pyroxene (Fig. 3g). The corona layer adjacent to olivine is composed of orthopyroxene, while the layer beside plagioclase is made up of Amp (green in colour) + Spl symplectites (Fig. 3h). The Opx layer shows an epitaxial growth (Fig. 3h). The Opx layer beside olivine sometimes contains a fine layer of ilmenite/magnetite (Fig. 3i). The Amp + Spl symplectite layer contains vermicular grains of spinel (Fig. 3j). These spinel grains show a variation in their grain size. Spinel grains present near the coronal layers of Amp + Spl and plagioclase boundary are coarse-grained, while the spinel grains present at the Amp + Spl – orthopyroxene coronal phase contact are fine-grained (Fig. 3k). This difference in distribution is visible under an optical microscope, and the boundary between them is marked by a zone where the abundance of spinel grains is fairly scarce (Fig. 3j, k). Although the Amp + Spl symplectite layer is dominated by these two phases, the layer also contains some pods of Opx + Spl symplectite near the Amp + Spl – Opx boundary (Fig. 3l). In terms of grain size, the spinel grains present within the Opx + Spl symplectites and those present near the Opx – Amp + Spl boundary are similarly fine-grained (Fig. 3k–m). In some cases, coarsening of spinel grains is also observed along the contacts between amphibole and the Opx + Spl symplectite pods (Fig. 3m). Occasionally a coarser spinel layer is present along the boundary of the Opx – Amp + Spl symplectite layer (Fig. 3k, l). Spinel grains present near the plagioclase – Amp + Spl boundary appear to have their long axis perpendicular to the contact between the layers (Fig. 3n). The spinel grains that are present near the orthopyroxene – Amp + Spl boundary are oriented perpendicular to the Opx and Amp + Spl layer contact (Fig. 3n). The orientation of the spinel grains within the Opx – spinel symplectite pods is similar to the orientation of the spinel grains present in the Amp + Spl symplectic layer (Fig. 3o). The contacts among the olivine, orthopyroxene, spinel (when present), Amp + Spl and plagioclase layers are sharp (Fig. 3p). The thickness of each of the layers not only varies among different coronae but also within a single corona (Fig. 3p). The thickness of the individual layers varies over the range 70–350 μm (Opx and Amp layers only).
At places where the plagioclase grains are in contact with the olivine coronae, clouding, defined by very fine grains of amphibole/spinel (mostly spinel), occurs parallel to the plagioclase lamellae (Fig. 3q). Such clouding in plagioclase has also been reported by Murthy (Reference Murthy1958) and Larikova & Zaraisky (Reference Larikova and Zaraisky2009). A brown-coloured amphibole is found as a reaction rim. They are found to be present along the grain boundaries of clinopyroxene (Fig. 3r).
5. Mineral chemistry
Representative chemical analyses for all the major phases are provided in Tables 1 and 2.
Table 1. Representative mineral analysis of olivine (Ol), orthopyroxene (Opx) and clinopyroxene (Cpx). Fe3+ was calculated using the method outlined in Droop (Reference Droop1987). Subscripts: c – core; r – rim; i – interstitial; s – secondary mineral

a Data used in textural modelling.
Table 2. Representative mineral analysis of spinel (Spl), amphibole (green, Amp; brown, Brown Amp) and plagioclase (Pl). Fe3+ was calculated using the method outlined in Droop (Reference Droop1987). The number following the column header represents the pair number used in Pl–Hbl geothermometry

aData used in textural modelling; bdata used for geothermobarometry.
Primary olivine belongs to the forsterite – fayalite solid solution with XMg (Mg+2/(Mg+2+Fe+2)) ranging from 0.68 to 0.72. Olivine grains do not show any compositional zoning. Clinopyroxene is part of the diopside – hedenbergite series with an XMg range of 0.83–0.96. Al2O3 varies in the range 1.60–3.50 wt%. Primary interstitial orthopyroxene is enstatite with XMg varying over 0.71–0.75, with a TiO2 content of ≤ 0.1 wt%. Al2O3 wt% and CaO wt% in the mineral has a range of 1.57–1.93 and 0.21–2.17, respectively. Orthopyroxene present as exsolution lamellae within clinopyroxene has a wider XMg range of 0.64–0.73. Al2O3 and CaO percentage in exsolved orthopyroxene varies over 1.5–2.2 wt% and 0.4–1.2 wt%, respectively. Neither the primary orthopyroxenes nor the clinopyroxenes show any zoning within individual grains. Plagioclase grains show zoning with a Ca-rich core compared with the rim. XCa (Ca+2/(Ca+2+Na+1+K+1)) of the plagioclase core varies over the range 0.75–0.81. The XCa of plagioclase rim, on the other hand, has a range of 0.60–0.74. Plagioclase grains with a higher XCa core value also have a higher XCa rim value, and vice versa.
Secondary orthopyroxene is also enstatite with XMg ranging from 0.72 to 0.78. The XMg of orthopyroxene present in the pods lies within the same range. The Al2O3 weight percentage has a value ranging from 1.14 to 3.52%. All green and brown amphiboles are pargasite as per the Leake classification (Leake et al. Reference Leake, Wooley, Arps, Birch, Gilbert, Grice, Hawthorne, Kato, Kisch, Krivovichec and Linthout1997). The XMg of green amphiboles varies from 0.67 to 0.78, and for brown amphiboles from 0.64 to 0.74. TiO2 content in brown amphibole varies over the range 1.32–2.46 wt%, while in green amphiboles the value is ≤ 0.6%. AlIV of green amphibole ranges over 1.59–2.58 atoms per formula unit (apfu), while that for brown amphibole is slightly lower and in the range 1.2–1.78 apfu. The (Na+K)total of green amphiboles and brown amphiboles are similar, and lie within the range 0.70–0.86 apfu and 0.75–0.89 apfu, respectively. Spinel grains of both amphibole and orthopyroxene symplectite belong to the spinel–hercynite series with a minimum XMg of 0.49 and a maximum XMg of 0.53.
6. Reaction microstructures and textural modelling
In the studied rock, the occurrence of multilayer coronae only at the olivine–plagioclase contact and their conspicuous absence at other Fe–Mg mineral–plagioclase interfaces suggests that olivine and plagioclase reacted to form the coronal minerals orthopyroxene, spinel and amphibole. Formation of such multilayer coronae can occur either through a single-stage reaction (Whitney & McLelland, Reference Whitney and McLelland1973, Reference Whitney and McLelland1983; Esbensen, Reference Esbensen1978; Mongkoltip & Ashworth, Reference Mongkoltip and Ashworth1983; Grant, Reference Grant1988) or through a multistage evolution (Joesten, Reference Joesten1986; Johnson & Carlson, Reference Johnson and Carlson1990; Gallien et al. Reference Gallien, Mogessie, Hauzenberger, Bjerg, Delpino and Castro de Machuca2012; Banerjee et al. Reference Banerjee, Dutta, Anand and Atlas2019). To determine the stages involved in corona formation in the studied rock, we used two parameters: mineral composition and texture. Regarding mineral composition, orthopyroxene in the layer near olivine and in the pods within the Amp + Spl layer have very similar XMg values. The XMg values of spinel grains in Opx – Spl pods and Amp – Spl symplectites are also comparable. Such similarity in mineral chemistry between different forms and associations is likely to indicate concurrent growth of the textural varieties. Regarding texture, the occurrence of Opx and Spl as symplectites in Opx – Spl pods suggests their growth in a single stage (Vernon, Reference Vernon2004). Similarly, the presence of Spl as symplectites in the Amp layer suggests the simultaneous growth of these two phases. Mineral composition combined with textural features therefore indicates that the growth of Opx, Spl and Amp in the coronae occurred in a single stage.
Zoning in plagioclase (Fig. 3c) is observed near coronae and also at the contact with other magmatic mineral. X-ray elemental maps show that the zoning observed in plagioclase does not follow the boundary of the corona (Figs 3c, 4a–e). If the zoning was caused by the corona-forming process, it was expected that the zoning pattern would follow the amphibole–plagioclase boundary. Figures 3c and 4a–e show the truncation of the zoning pattern in plagioclase against the corona feature. These features together suggest that the zoning is likely to be of magmatic origin and did not develop as a part of the corona-forming reactions. The plagioclase composition beside the Amp + Spl – Pl contact was therefore considered for textural modelling.

Fig. 4. (a–d) X-ray elemental maps showing corona and zoning in plagioclase. The elements analysed are Al, Ca, Na and Mg, respectively. The dashed circle shows the zone where the plagioclase zoning truncates at the corona boundary. (e) BSE image of the same region, showing corona and zoning in plagioclase.
It may therefore be presumed that the corona formation occurred in a single stage as per the qualitative reaction: olivine + plagioclase + H2O = orthopyroxene + amphibole + spinel. Algebraic analyses of the mineral chemistry (Tables 1 and 2) provided mass-balanced reaction(s) that concur with the observed textural features. To obtain such reactions with regards to the phases concerned, linear algebra was used to evaluate the composition space of the corona-forming minerals. On defining a composition matrix M (m × n), where m is the number of phases represented by n components, we used matrix calculations to solve for balanced chemical reactions. To achieve solutions to such matrix calculations, the most common matrix decomposition or matrix factorization process used by metamorphic petrologists is singular value decomposition (SVD) (Lang & Rice, Reference Lang and Rice1985; Lang et al. Reference Lang, Wachter, Peterson and Ryan2004; Chowdhury et al. Reference Chowdhury, Talukdar, Sengupta, Sanyal and Mukhopadhyay2013; Banerjee et al. Reference Banerjee, Dutta, Anand and Atlas2019). SVD checks for linear dependencies and shows the possible reactions in the given composition space. For this study, the computer application CSpace (Torres-Roldan et al. Reference Torres-Roldan, Garcia-Casco and Garcia-Sanchez2000) was used to solve the composition matrix using the SVD method.
For textural modelling of the abovementioned qualitative reaction, an input matrix in SVD analysis was used with 15 phases (m) including the mineral phases and mobile constituents. These phases were expressed in terms of 10 components (n). Olivine, plagioclase, orthopyroxene, spinel and green amphibole were considered for modelling the coronal reactions. Clinopyroxene and brown amphibole were excluded as they were not part of the system defining the corona texture. The mobile phases used were Mg, Fe, Na, Ca, K, Al, Ti, O2, H2O and aqueous SiO2.
Textural modelling using the CSpace application generates a large number of mass-balanced reactions. From the reactions, the selection was made as per the following criteria: (1) reactants (olivine and plagioclase) were present on the opposite sides of the product assemblage (orthopyroxene + amphibole + spinel) in reaction(s); and (2) the volume ratio of products calculated from a reaction was compared with their modal proportions calculated from backscattered electron (BSE) images using ImageJ (Spl: Opx: Amp = 9–14: 44–56: 35–46). The volume change of reaction (ΔVs) has been calculated for each reaction (Table 3). The volume proportion of the product phases (Spl: Opx: Amp) are provided for each reaction (see Table 3 for the volume of these product phases in each reaction). SiO2 (aq) represents SiO2 in aqueous solution.
The following reactions were found to be the most representative of the observed texture.
-
1. 304.08 Ol + 144.91 Pl + 31.03 Mg+2 + 2.71 K+ + 1.01 Ti+4 + 39.19 H2O = 198.67 Opx + 39.19 Amp + 70.56 Spl + 1.00 Na+ + 38.85 Ca+2; where ΔVs = −6.90% and Spl: Opx: Amp = 10.85: 48.25: 40.90.
-
2. 281.29 Ol +141.44 Pl + 28.03 Mg+2 + 2.77 K+ + 1.00 Ti+4 + 39.58 H2O = 174.64 Opx + 39.58 Amp + 67.80 Spl+ 35.75 Ca+2 + 13.66 aqueous SiO2 (aq); where ΔVs = −7.83% and Spl: Opx: Amp = 11.07: 45.05: 43.88.
-
3. 291.34 Ol + 139.43 Pl + 28.16 Mg +2 + 2.71 K+ + 1.00 Ti+4 + 39.02 H2O = 186.36 Opx + 39.02Amp + 66.31 Spl + 1.15 Fetot + 35.00 Ca+2; where ΔVs = −6.71% and Spl: Opx: Amp = 10.60: 47.06: 42.34.
-
4. 326.18 Ol + 136.35 Pl + 2.61 K+ + 1.00 Ti+4 + 38.18 H2O = 203.52 Opx + 38.18 Amp + 64.02 Spl + 14.51 Fetot + 33.81 Ca+2 + 20.02 O2; where ΔVs = −8.12% and Spl: Opx: Amp = 9.93: 49.87: 40.20.
-
5. 288.33 Ol + 139.70 Pl + 30.59 Mg+2 + 2.72 K+ + 1.00 Ti+4 + 1.73 O2 + 39.09 H2O = 184.88 Opx + 39.09 Amp + 66.51 Spl + 35.10 Ca+2; where ΔVs = −6.58% and Spl: Opx: Amp = 10.66: 46.81: 42.53.
-
6. 286.50 Ol + 139.84 Pl + 31.27 Mg+2 + 2.73 K+ + 1.00 Ti+4 + 39.13 H2O = 183.96 Opx + 39.13 Amp + 65.22 Spl + 35.16 Ca+2 + 2.71 Al+3; where ΔVs = −6.72% and Spl: Opx: Amp = 10.50: 46.76: 42.74.
-
7. 335.15 Ol + 135.70 Pl + 2.59 K+ + 24.52 Al+3 + 1.00 Ti+4 + 37.98 H2O = 208.05 Opx + 37.98 Amp + 76.11 Spl + 11.60 Fetot + 33.57 Ca+2; where ΔVs = −6.68% and Spl: Opx: Amp = 11.49: 49.60: 38.91.
Calculations of change in volume from the modelled reactions (Table 3) show that the corona-forming process is associated with a loss in volume (volume of products less than volume of reactants) of c. 7–8%. The reactions suggest that the corona texture formed in a system that was open to fluid and also to other elements such as Mg+2 and Ca+2. For highly charged and small ions such as Ti+4, the molar amount in reactions are insignificant and the value may be a result of slight chemical variation associated with the analysed phases and/or the uncertainty associated with estimating them (Gallien et al. Reference Gallien, Mogessie, Hauzenberger, Bjerg, Delpino and Castro de Machuca2012). Various authors have shown that the mobile elements required to form the product phases in a single-stage open system vary with the composition of the initial reactants and those of the products (Mongkoltip & Ashworth, Reference Mongkoltip and Ashworth1983; Gallien et al. Reference Gallien, Mogessie, Hauzenberger, Bjerg, Delpino and Castro de Machuca2012); reaction bulk composition can therefore vary between micro-domains. Preferential growth of the aluminium-bearing phase spinel near plagioclase may indicate the relative immobility of Al+3 as a mobile component. We therefore propose that reactions (1–5) are the most suitable in terms of representing coronae formation in the studied rock.
Table 3. Volume of reactants and products, and the change in volume associated with reactions (1–7) in Section 6. Molar volumes calculated from the thermodynamic dataset hp622ver (Holland & Powell, Reference Holland and Powell2011) at 860°C and 7 kbar

Ab – albite; An – anorthite; En – enstatite; Fa – Fayalite; Fo – forsterite; Fs – ferrosilite; Hc – hercynite; Prg – pargasite; RC – reaction coefficient; Spl – spinel.
a Change in volume ΔVs, defined as [(Vp–Vr)/Vr]×100 where Vp and Vr are total volume of product minerals (VOpx + VAmp + VSpl) and total volume of reactant minerals (VOl + VPl), respectively.
b Data from Holland & Powell (2011).
c Volume of solids (cm3), defined as molar volume multiplied by reaction coefficient for each mineral (e.g. for olivine, Vs = VOl × RC = 4.55 × 304.08).
7. Pressure–temperature estimation of corona formation
7.a. Conventional thermobarometry
Conventional thermobarometry is used to derive the P-T conditions of the corona formation event. As the P-T conditions are determined from the corona texture, only the coronal green amphibole composition was used in the Al-in-hornblende geobarometer (Johnson & Rutherford, Reference Johnson and Rutherford1989). Although Al-in-hornblende geobarometers were formulated for determining the emplacement pressure of igneous calc-alkaline rocks, they have also been used by researchers to estimate pressure from amphibole-bearing metamorphic assemblages (Bolin et al. Reference Bolin, Mingguo, Carswell, Wilson, Qingchen, Zhongyan and Windley1995; Daogong et al. Reference Daogong, Zhenhan, Wan and Peisheng2004; Liu et al. Reference Liu, Gerdes, Zeng and Xue2008; Srivastava et al. Reference Srivastava, Heaman, French and Ferreira Filho2011; Dey et al. Reference Dey, Karmakar, Mukherjee, Sanyal, Dutta and Sengupta2019). Zoning in the coronae-bearing mafic rocks developed prior to the coronae-forming metamorphic event. The coronal green amphibole therefore reached equilibrium with the adjacent plagioclase composition irrespective of zoning. For the hornblende–plagioclase thermometer (Holland & Blundy, Reference Holland and Blundy1994), temperature was determined using green amphibole and the plagioclase composition adjacent to the Amp – Pl contact. Results for pressure and temperature estimated using conventional geothermobarometry are given in Table 4. The Al-in-hornblende geobarometer yields a pressure of 7.7 ± 0.2 kbar. The hornblende–plagioclase thermometer suggests a temperature of 816 ± 40°C (at 5 kbar).
Table 4. Results from Al in amphibole barometry (Johnson & Rutherford, Reference Johnson and Rutherford1989) and hornblende-plagioclase temperatures (at P = 5 kbar) from the equations in Holland & Blundy (Reference Holland and Blundy1994)

7.b. Pseudosection analysis
P-T pseudosection was constructed using the thermodynamic modelling program Perple_X 6.8.5 (Connolly, Reference Connolly2005) in the NCFMASH (Na2O, CaO, FeO, MgO, Al2O3, SiO2, H2O) system. The thermodynamic database used is that of hp622ver (Holland & Powell, Reference Holland and Powell2011) and the solution models are: O(HP) (olivine; Holland & Powell, Reference Holland and Powell1998); Opx(W) (orthopyroxene; White et al. Reference White, Powell, Holland, Johnson and Green2014); Gt(W) (garnet; White et al. Reference White, Powell, Holland, Johnson and Green2014); Omph(GHP) (clinopyroxene; Green et al. Reference Green, Holland and Powell2007); Pl(I1, HP) (plagioclase; Holland & Powell, Reference Holland and Powell2003); Sp(WPC) (spinel; White et al. Reference White, Powell and Clarke2002); cAmph(G) (amphibole; Green et al. Reference Green, White, Diener, Powell, Holland and Palin2016); and melt(G) (melt; Green et al. Reference Green, White, Diener, Powell, Holland and Palin2016).
During the metamorphic evolution of a rock, a corona (or any reaction texture) develops between minerals that were initially at equilibrium but, due to changing P-T conditions, are no longer thermodynamically stable with respect to each other. As the equilibrium phase relationship is a function of the P-T conditions, the equilibrium volume (volume across which equilibrium exists) is modified by the change in P-T conditions (Stüwe, Reference Stüwe1997; Carlson, Reference Carlson2002; White et al. Reference White, Powell and Baldwin2008; White & Powell, Reference White and Powell2011). When this equilibration volume operates at the scale of mineral grains, coronae and other reaction textures start to form (White & Powell, Reference White and Powell2011). Although preservation of reaction textures such as coronae signifies the existence of disequilibrium at a rock scale, this would not impede the existence of equilibrium within the local domain where the texture forms (Thompson, Reference Thompson and Abelson1959; White et al. Reference White, Powell and Baldwin2008; White & Powell, Reference White and Powell2011). This assumption of equilibration over proper length scales is a necessity to make any headway in terms of modelling and establishing phase relationships related to reaction textures such as coronae (Khorzhinskiĭ, Reference Korzhinskiĭ1959; Thompson, Reference Thompson and Abelson1959; Powell et al. Reference Powell, Guiraud and White2005). Although coronae textures generally suggest disequilibrium, equilibrium thermodynamics can therefore be applied for modelling and interpreting these textures over suitable equilibration volume (White & Powell, Reference White and Powell2011; Ogilvie & Gibson, Reference Ogilvie and Gibson2017). This leads to the concept of effective bulk rock composition, which has been used in combination with the idea of equilibration volume (Korshizhinskiĭ, Reference Korzhinskiĭ1959; Stüwe, Reference Stüwe1997) for chemico-mineral-based modelling of metamorphic rocks. The idea of effective bulk composition using only the volume of phases that took part in the reaction has been used in many studies to estimate the P-T conditions associated with reaction textures (e.g. Nasipuri et al. Reference Nasipuri, Bhattacharya and Das2009; Gallien et al. Reference Gallien, Mogessie, Hauzenberger, Bjerg, Delpino and Castro de Machuca2012; Goergen & Whitney, Reference Goergen and Whitney2012; Faryad et al. Reference Faryad, Kachlík, Sláma and Hoinkes2015; Palin et al. Reference Palin, Weller, Waters and Dyck2016; Mukherjee et al. Reference Mukherjee, Dey, Sanyal, Ibanez-Mejia, Dutta, Sengupta, Pant and Dasgupta2017; Baharifar, Reference Baharifar2019; Banerjee et al. Reference Banerjee, Dutta, Anand and Atlas2019).
Corona texture can represent the final stability of the reactant minerals with kinetic factors being responsible for the preservation of the reactants, or they may represent an equilibrium assemblage where the mineral modes of the reactants and products change until the attainment of equilibrium (Vernon et al. Reference Vernon, White and Clarke2008; Kelsey & Hand, Reference Kelsey and Hand2015). A corona-forming reaction that indicates terminal stability of a reactant suggests disequilibrium between reactant and product, and an ‘effective reaction bulk’ in such a case involves only product composition (Kelsey & Hand, Reference Kelsey and Hand2015). However, in cases where the reactants and products change their modal volume proportion during the reaction, the effective reaction bulk is likely to be represented by all the phases (Kelsey & Hand, Reference Kelsey and Hand2015). In such cases, the representative reaction bulk should include all of the product phases along with only a part of the reactants, as the cores/inner parts of the reactant minerals were most likely not involved in the corona-forming reaction (Kelsey & Hand, Reference Kelsey and Hand2015). Additionally, if a system behaves as ‘open’ during the reaction, the determination of effective reaction bulk requires this to be taken into account (Putnis & Austrheim, 2011; Kelsey & Hand, Reference Kelsey and Hand2015). Reactions that involve the addition of mobile components, as well as the release of components, suggest that only product composition is a partial representation of equilibrium reaction bulk (Putnis & Austrheim, 2011). In a closed system, consideration of only product phases as reaction volume may therefore be rational (Nasipuri et al. Reference Nasipuri, Bhattacharya and Das2009); however, in an open system, the most conservative estimate of the effective reaction bulk is likely to be represented by a combined contribution of both reactants and products. The reactant composition can then also reflect the excess mass after forming product solids, whereas the product composition can provide an estimation of the additional components required along with the components from the reactants.
In this study, most of the rock volume did not participate in the corona formation (as the interstitial pyroxenes, plagioclase at the contact of other Fe–Mg minerals, etc. did not participate) as the texture formed only at the contact of the olivine and plagioclase. Under such circumstances, an effective bulk chemistry for corona formation is more logical than whole-rock bulk composition in determining P-T conditions for corona formation. The modelled reactions (see reactions (1–7) in Section 6) also suggest that the coronae were formed by Ol + Pl + fluidin = Opx + Amp + Spl + fluidout, which signifies the presence of fluid (incoming and outgoing) during the reaction. Considering these rationale, the combined reactant and product proportion is likely to provide the most realistic effective reaction bulk for the corona-forming reaction of this study. A similar approach was taken by Banerjee et al. (Reference Banerjee, Dutta, Anand and Atlas2019) in calculating the effective reaction bulk to model coronae texture in an open system.
Since the thickness of the coronal layers shows variation, effective reaction bulk compositions for multiple domains were calculated and the average effective reaction bulk composition was used for phase equilibria modelling. The domains selected to represent the effective reaction bulk include the entire orthopyroxene and amphibole layer along its length, along with some amount of the reactants (olivine and plagioclase). To calculate the effective reaction bulk, high-resolution BSE images were used to determine the modal proportions of the various minerals present in the coronal layers using ImageJ software. These proportions were then multiplied by the microprobe analyses of those minerals from the respective corona. Each chosen domain was rectangular in shape (length of the rectangle running normal to the layer boundaries), with the width being proportional to the length of the domain in all cases.
To calculate the molar proportion of H2O present in the system, a phase diagram was constructed considering temperature (T) and the molar proportion of water (M(H2O)) as independent variables (Fig. 5a) at a fixed pressure of 7.5 kbar. The results from conventional geobarometry were used to fix the pressure (Table 4). The effective bulk composition as estimated from the volume proportion of minerals used to calculate the molar proportion of H2O was Na2O = 0.99: CaO = 5.24: FeO = 11.77: MgO = 29.12: Al2O3 = 7.83: SiO2 = 42.29. The field marked with a dashed outline in Figure 5a represents the corona assemblage. The molar proportion of H2O varies from 0% to slightly higher than 2% in the field representing the corona assemblage (Fig. 5a). Volume isopleths of the product phases were plotted in the field and the relative proportions of the product phases were calculated. The relative proportion of the product phases (Spl: Opx: Amp) at 1 mol% is 7: 63: 30, while the proportion at 2 mol% is 5: 53: 42. These values were compared with the proportions of the product phases as measured from the BSE images (9–14: 44–56: 35–46). The ratio of the product phases at 2 mol% H2O resembles the proportion measured through image analysis more closely than that at 1 mol%; the P-T pseudosection was therefore calculated using 2 mol% H2O.

Fig. 5. (a) T v. M(H2O) pseudosection showing stable assemblages at different water content with changing temperature. The corona assemblage field is in the top left corner (Amp Spl Opx Ol Pl). Volume proportion isopleths of spinel, orthopyroxene and amphibole are shown with red, green and yellow lines, respectively. The proportion of the product phases at 2% H2O is closer to that measured through image analysis. Effective bulk composition used was Na2O = 0.99: CaO = 5.24: FeO = 11.77: MgO = 29.12: Al2O3 = 7.83: SiO2 = 42.29). (b) P-T pseudosection showing stable assemblages. The field representing the corona assemblage is marked by a dashed line. XMg isopleths of spinel, orthopyroxene and amphibole are shown. Spinel, orthopyroxene and amphibole isopleths are represented by red, green and yellow lines, respectively. The isopleths with XMg ranges as measured in the studied mafic rock (±0.01) converge within an area highlighted by the rectangle. Effective bulk composition used was Na2O = 0.99: CaO = 5.24: FeO = 11.77: MgO = 29.12: Al2O3 = 7.83: SiO2 = 42.29: H2O = 2.0. XMg isopleths of (c) spinel, (d) orthopyroxene and (e) amphibole. (f) Modal proportion isopleths intersecting at the proposed P-T of 860°C and 7 kbar (white star) and at the P-T derived from pseudosection analysis (900°C and 6.6 kbar; white circle) are shown. The recalculated proportion of the product phases (Spl: Opx: Amp) under both these P-T conditions is also shown.
In Figure 5b, the field with the equilibrium mineral assemblage for corona, comprising olivine + orthopyroxene + amphibole + spinel + plagioclase, is marked with a dashed boundary. P-T conditions of the corona-forming reaction were determined using XMg (XMg = Mg+2/(Mg+2 + Fe(tot))) isopleths of Opx, Spl and Amp (Fig. 5c–e). The blue box in Figure 5b represents the only area where the XMg isopleths that match the composition (XMg ± 0.01) of all three product phases in the studied rock pass through the field containing the equilibrium assemblage. The white circle in the centre of the blue box (Fig. 5b) represents conditions of 6.6 kbar and 900°C. The result from the P-T pseudosection suggests P-T conditions of nearly 6.6 ± 0.5 kbar and 900 ± 50°C (area shown with the blue box) for the formation of coronae in the studied rock. Figure 5f shows the topology of modal volume isopleths of the product phases. At 900°C and 6.6 kbar (marked with a white circle), the volume proportion of Spl: Opx: Amp is 5: 53: 42. This matches well with the modal proportion ranges of spinel, orthopyroxene and amphibole calculated from image analysis (Spl: Opx: Amp = 9–14: 44–56: 35–46). Combining P-T results from pseudosection calculation and conventional geothermobarometry, we propose P-T conditions of 860 ± 50°C and 7 ± 0.5 kbar for coronae formation in the studied rock. The volume proportion of the product phases at these conditions (Spl: Opx: Amp = 6: 53: 41) also closely matches the actual proportion of products in the rock (Fig. 5f).
8. Chemical potential constraints
The two main factors affecting the development of reaction textures such as corona are: the change in P-T conditions that initiate the reaction; and the diffusional regime that determines the spatial arrangement of minerals in such textures. The simultaneous use of pseudosections and chemical potential diagrams to understand P-T conditions and spatial arrangement of minerals, respectively, provides a strong framework for studying reaction textures such as corona (White & Powell, Reference White and Powell2011). Despite the fact that P-T condition changes are the trigger for corona formation, the textures themselves develop as a result of the diffusion of chemical components between phases, which ultimately changes the modal proportions of phases (Carmichael, Reference Carmichael1969; Fisher, Reference Fisher1973; Joesten, Reference Joesten1977; Carlson, Reference Carlson2002; White et al. Reference White, Powell and Baldwin2008; White & Powell, Reference White and Powell2011). This diffusion takes place in response to chemical potential gradients (White & Powell, Reference White and Powell2011). In this scenario, studying coronae textures in terms of chemical potential gradients helps to understand the sequence of minerals that formed due to the change in P-T conditions.
To understand the changes in chemical potential gradients between olivine and plagioclase and their effects on the corona formation process, chemical potential diagrams are constructed in a simplified CaO–MgO–Al2O3–SiO2–H2O (CMASH) system. We investigate the sequence of reactant and product phases and the reactions responsible for them in the studied rock through these diagrams. The chemical potential diagrams were constructed using the thermodynamic modelling program Perple_X 6.8.5 (Connolly, Reference Connolly2005). End-member activities of phases from the mafic rocks of this study were calculated using the AX program (https://www.esc.cam.ac.uk/research/research-groups/research-projects/tim-hollands-software-pages/ax): forsterite (Fo = 0.52), tschermakite (Ts = 0.005), enstatite (En = 0.55), spinel (Spl = 0.53) and anorthite (An = 0.84). As the coronae only develop along the olivine–plagioclase contact, it may be assumed that the sources of components for the corona-forming reaction are olivine and plagioclase. The composition of olivine and plagioclase suggests that diffusive components are likely to be MgO and FeO from olivine and CaO from plagioclase. Assuming that the coronal layers developed as a response to chemical potential gradients between olivine and plagioclase, μMgO–μCaO grids were constructed to understand the phase relations of the products and reactants. MgO (from olivine) and CaO (from plagioclase) are taken to be the mobile elements whose movement across grain boundaries, in response to a chemical potential gradient, resulted in the formation of the product phases. MgO and CaO are therefore taken as the axes for the μMgO–μCaO phase diagrams, while Al2O3, SiO2 and H2O are considered as unconstrained components.
The activity calculated through the AX program for the chemical potential diagrams stabilizes tschermakite at very high temperatures compared with the P-T predicted from pseudosection analysis and conventional geothermobarometry. A similar discrepancy was reported by (Gallien et al. Reference Gallien, Mogessie, Hauzenberger, Bjerg, Delpino and Castro de Machuca2012) while addressing the corona formation process in their rocks. The purpose of the μMgO–μCaO diagrams in our study is mainly to verify the sequence of coronae layers generated as a response to changing chemical potential gradients with changes in temperature (at a constant pressure of 7 kbar) between the reactant minerals (olivine and plagioclase). The absolute temperature predicted from this method would therefore not be considered as the stabilizing temperature of the coronae in the studied mafic rock.
Figure 6a shows that olivine and plagioclase are thermodynamically stable at high temperatures and share a stable contact marked by a circle in Figure 6a. Figure 6b shows the initiation of the reaction at the olivine–plagioclase contact with decreasing temperature, resulting in the start of the corona-forming process. The An + H2O = Ts + Spl reaction marks the onset of the corona formation. The reaction begins at the point marked with a circle in Figure 6b. Figure 6c shows an enlarged version of the circled zone in Figure 6b, which is similar to the marked portion in Figure 6a representing the olivine–plagioclase contact. With further change in temperature, the field of Ts + Spl gradually grows (Fig. 6c, d). In Figure 6d, the field shaded green represents the Amp + Spl layer from the coronae, while the field shaded blue represents the Opx layer and the Opx + Spl pods. Of the numerous possible chemical potential gradients across olivine and plagioclase, four are shown in Figure 6d (highlighted with grey arrows) (White et al. Reference White, Powell and Baldwin2008). Figure 6d suggests that the presence of chemical potential gradients along only the highlighted directions can explain the concurrent occurrence of Opx, Amp and Spl. Figure 6b–d shows that between Ol and Pl, Opx always occurs near Ol, whereas Spl + Amp occurs near Pl and Opx + Spl occurs between the Opx and Amp + Spl fields. Figure 6d suggests that a corona assemblage between Ol and Pl will only form when a chemical potential gradient exists in terms of both MgO and CaO (highlighted with arrows).

Fig. 6. (a) μMgO–µCaO diagram (in a CMASH system) showing topologies of the reaction lines and anorthite and forsterite fields before corona formation takes place. The contact between olivine and plagioclase is shown with a circle. (b) Initiation of the corona-forming process. The circled area is where the corona-forming reaction initiates. (c) Enlarged view of the circled area in (b), in which the Ts + Spl field is shaded in green. The field shaded blue represents the Opx layer and Opx + Spl symplectites. (d) With a further decrease in temperature, the Ts + Spl field increases in size. The grey arrows show the possible chemical potential gradients.
9. Discussion
9.a. Single- or multi-stage corona formation?
The development of corona only at the contact of olivine–plagioclase, and its conspicuous absence from any other mineral contact, suggest the layers comprising orthopyroxene, amphibole and spinel developed due to reactions between the two minerals only. Early workers have reported such coronae development by both single- (Ashworth & Sheplev, Reference Ashworth and Sheplev1997; Lang et al. Reference Lang, Wachter, Peterson and Ryan2004; Ikeda et al. Reference Ikeda, Nishiyama, Yamada and Yanagi2007; Ogilvie & Gibson, Reference Ogilvie and Gibson2017) and multi-stage processes (Joesten, Reference Joesten1986; Gallien et al. Reference Gallien, Mogessie, Hauzenberger, Bjerg, Delpino and Castro de Machuca2012; Banerjee et al. Reference Banerjee, Dutta, Anand and Atlas2019). Textural features such as symplectitic growth of Opx + Spl within pods and Amp + Spl as layers suggest the symplectite assemblages in the studied rock formed simultaneously (Vernon, Reference Vernon2004). Similar XMg values for Spl grains occurring as symplectites with both Opx and Amp corroborates the theory that spinel from both occurrences formed concurrently. Similarly, the compositional match between orthopyroxene in layers and pods indicate that only the Opx grains in the Opx layer and in the Amp + Spl layer are coeval. Together the features suggest orthopyroxene–amphibole–spinel all formed in a single stage. Spinel grains are generally coarser along the contact of Opx – Amp as seen at the Opx – Amp layer contact or Opx pod – Amp contact (Fig. 3k–m). Such coarsening is also observed near the Amp – Pl boundary but, in this case, the texture does not exactly form at the contact of the phases (Fig. 3k, l). Interestingly, spinel distribution also shows a major break near this contact. The textural changes across the Amp layer are defined by symplectites of Opx + Spl pods in a symplectic Amp + Spl layer giving way to a Amp + Spl symplectite layer, to an Amp layer (Spl absent) and, finally, to a coarse Spl + Amp symplectite layer near plagioclase. A lack of spinel in a zone and then distinct coarsening of the mineral probably indicate that the spinel, which nucleated as a tiny symplectite grain, later combined to grow as a larger/coarser grain. This coarsening possibly occurred while the rock was at peak metamorphic conditions (Joanny et al. Reference Joanny, van Roermund and Lardeaux1991) over a certain period at the final stage of corona texture formation in the rock.
9.b. Where was the original olivine–plagioclase contact?
The Kirkendall plane, or initial interface between reacting phases, is generally marked by discontinuous compositional zoning and textural discontinuity (Gaidies et al. Reference Gaidies, Milke, Heinrich, Abart and Heinrich2017). Such a discontinuity results from an unbalanced flux of components between reactants (Gaidies et al. Reference Gaidies, Milke, Heinrich, Abart and Heinrich2017). In the studied sample, a major textural discontinuity is observed at the Opx – Amp layer contact as the epitaxial growth of Opx changes over to symplectite Opx with Spl occurring as pods in a symplectite Amp + Spl layer. The boundary also marks the distinct composition break in the layered corona, whereas compositional and textural changes in amphibole layer are gradual. Considering the immobility of Al+3, and plagioclase being the only source of the element in the reaction, we propose that the Opx – Amp + Spl layer contact (some cases manifested by a thin spinel layer between them) represents the original olivine–plagioclase interface in the studied rock (Fig. 3k, l, o). The textural relationship could be very well explained by the chemical potential diagrams. Figure 6d shows that the chemical gradient across μMgO and μCaO will lead to orthopyroxene only near olivine and Amp + Spl only near plagioclase, with a Opx + Spl assemblage in between. This sequence exactly matches the mineral banding present in the studied coronal layer.
9.c. Was the process definitely metamorphic?
Growth of the coronae texture on deformed reactant grains (Fig. 3c, e) and preservation of the texture on all sides unequivocally suggest that the corona-forming event post-dated the deformation events experienced by the rocks after their emplacement. The evidence also firmly establishes the genesis of the coronae in this rock by a solid-state reaction during metamorphism, and invalidates its origin by any other process (e.g. magmatic or auto-metasomatism; Esbensen, Reference Esbensen1978; Joesten, Reference Joesten1986; de Haas et al. Reference de Haas, Nijland, Valbracht, Maijer, Verschure and Andersen2002). The absence of crucial features of magmatic origin, such as the presence of primary amphibole (Polat et al. Reference Polat, Fryer, Samson, Weisener, Appel, Frei and Windley2012; Johansson et al. Reference Johansson, Andersson and Hålenius2012) and exsolution of ilmenite in magnetite (Ambler & Ashley, Reference Ambler and Ashley1977; McSween & Nystrom, Reference McSween and Nystrom1979; Zeck et al. Reference Zeck, Shenouda, Rønsbo and Poorter1982), also negates the possibility of an igneous origin for the coronae.
9.d. Open- or closed-system changes?
The mass-balance equations suggest the coronae grew in an open system, which is also obvious from the formation of hydrous mineral assemblage after anhydrous reactants. The occurrence of aluminium-containing phases (spinel and amphibole) closer to plagioclase suggests the relative immobility of Al+3 during the reaction. The possible reactions that model the observed coronae are therefore reactions that do not require the addition or removal of Al+3 from the reaction site. Reactions (1–5) (Section 6) meet the criteria but show that, for the corona-forming reaction, an influx of Mg+2 into the system along with fluids is required. The reactions suggest a volume loss of c. 7–8% during the corona assemblage growth. Multiple studies show the importance of porosity caused as a result of the reaction helping mass transfer under high P-T conditions (Svahnberg & Piazolo, Reference Svahnberg and Piazolo2013; Mukai et al. Reference Mukai, Austrheim, Putnis and Putnis2014; Spruzeniece et al. Reference Spruzeniece, Piazolo, Daczko, Kilburn and Putnis2017). Experimental studies (Milke et al. Reference Milke, Neusser, Kolzer and Wunder2013), show that the presence of water even in minuscule amounts (tens of ppm of an entire sample) facilitates reaction kinematics by providing the necessary medium for transfer of components across the reaction boundary.
9.e. Pressure–temperature conditions of corona formation
Conventional thermobarometry on multiple amphibole–plagioclase pairs gives a mean temperature of 816 ± 40°C (Holland & Blundy, Reference Holland and Blundy1994). Al-in-hornblende barometry indicates a pressure of 7.7 ± 0.2 kbar (Johnson & Rutherford, Reference Johnson and Rutherford1989). Pseudosection analysis of the product and reactant phases in a NCFMASH system suggests peak P-T conditions of 900°C and 6.6 kbar. Since coronae indicate disequilibrium across the layers, the application of conventional geothermobarometry to estimate the P-T conditions has many pitfalls (Ogilvie & Gibson, Reference Ogilvie and Gibson2017). A combined approach – using both conventional thermobarometry and pseudosection analysis – is observed here to better constrain the P-T conditions of coronae formation. The P-T conditions for the coronae formation obtained by using the combined approach are 860 ± 50°C and 7 ± 0.5 kbar.
9.f. Implication on tectonic evolution of the Chotanagpur Granite Gneissic Complex
The CGGC and the Eastern Ghats Mobile Belt (EGMB) of India share a similar tectonic history to that of east Antarctica during 1000–900 Ma (Hoffman, Reference Hoffman1989; Dalziel, Reference Dalziel1991; Li et al. Reference Li, Bogdanova, Collins, Davidson, De Waele, Ernst, Fitzsimons, Fuck, Gladkochub, Jacobs and Karlstrom2008). The CGGC and EGMB juxtapose against the east Antarctic Precambrian basement in reconstructions of Rodinia (Dasgupta & Sengupta, Reference Dasgupta, Sengupta, Yoshida, Windley and Dasgupta2003; Chatterjee et al. Reference Chatterjee, Banerjee, Bhattacharya and Maji2010; Mukherjee et al. Reference Mukherjee, Dey, Sanyal, Ibanez-Mejia, Dutta, Sengupta, Pant and Dasgupta2017). Knowledge of the role of the CGGC is therefore crucial to understand the suturing of the Greater Indian landmass with Antarctica during the formation of Rodinia. The CGGC has undergone multiple phases of metamorphism and deformation, some of which have been related to the formation of Rodinia (reviewed in Mukherjee et al. Reference Mukherjee, Dey, Sanyal, Sengupta and Mukherjee2019).
The coronae-bearing mafic rock of this study belongs to Domain I of the CGGC (Fig. 1b). Domain I underwent three major tectonothermal events: D1–M1 at 1650–1600 Ma; D2–M2 at 1000–950 Ma; and D3–M3 at c. 900 Ma. D1 and D2 resulted in E–W-aligned fabrics across the CGGC. D3 also lead to the development of E–W-aligned fabrics in most parts of the CGGC, except for the eastern margin where the fabrics are aligned N–S. The present study area is located in the southern part of the eastern boundary of CGGC. A number of recent studies have reported the occurrence of post-D2 intrusive rocks from Domain I of CGGC (Bhattacharjee et al. Reference Bhattacharjee, Ray, Ganguly and Saha2012; Mukherjee et al. Reference Mukherjee, Dey, Sanyal and Sengupta2018; Das et al. Reference Das, Sanyal, Karmakar, Sengupta and Sengupta2019). Some of these studies have suggested tectonic evolution models for these intrusives, considering detailed structural patterns and petrology. Recently, Mukherjee et al. (Reference Mukherjee, Dey, Sanyal and Sengupta2018) proposed a model involving two phases of continent–continent collision with intermittent rifting for the tectonic evolution of the mafic intrusive rocks of their study from Domain I. They argued that the domain witnessed two major orogeneses (D2 before 950 Ma and D3 after 920 Ma) that were separated by a period of lithospheric extension, during which the protolith of the intrusives was emplaced. Mukherjee et al. (Reference Mukherjee, Dey, Sanyal and Sengupta2018) reported only one phase of metamorphism and deformation from these rocks related to the D3 event of CGGC, and also described relict igneous texture within the deformed rocks. The field relation of coronae-bearing mafics of this study shows that it cross-cuts the regional E–W-aligned D2 fabrics of the host rock, but that wrapping of the gneissosity around it is related to D3. These features indicate the intrusion was prior to D3 but after D2. This rock preserves relict igneous texture well, but shows metamorphic corona development at the expense of the primary minerals. Although the rock lacks mesoscopic directional fabric, it displays a microscale deformation signature similar to that of the bending of plagioclase lamellae. The non-development of significant deformation features on a larger scale could be related to the higher competency of the mafic rock compared with the host gneiss. The preservation of the delicate corona texture and its growth on the deformed primary mineral suggest that the deformation suffered by the rock was prior to the corona formation process, as any deformation during or after coronae formation would destroy such delicate textures (Wayte et al. Reference Wayte, Worden, Rubie and Droop1989; Lang & Gilotti, Reference Lang and Gilotti2001). This possibly indicates that the corona formation took place during the waning stages of deformation.
The metamorphic and deformation pattern of the coronae-bearing mafic rock shows similarity to the mafic intrusives reported by Mukherjee et al. (Reference Mukherjee, Dey, Sanyal and Sengupta2018). The pressure estimated by Mukherjee et al. (Reference Mukherjee, Dey, Sanyal and Sengupta2018) for the M3 metamorphic event (c. 7.5 kbar) is close to that estimated in this study (7 ± 0.5 kbar), although Mukherjee et al. (Reference Mukherjee, Dey, Sanyal and Sengupta2018) proposed a lower temperature (c. 700°C) compared with this study (860 ± 50°C) for this event. Considering the overall similarity between the outcome of this study and the findings and interpretations of Mukherjee et al. (Reference Mukherjee, Dey, Sanyal and Sengupta2018), we propose a tectonic model similar to these authors for the evolution of the studied mafic rocks. The intrusion of the protolith of the coronae-bearing mafic bodies was related to rifting, comparable to the 950–920 Ma event of Mukherjee et al. (Reference Mukherjee, Dey, Sanyal and Sengupta2018); the coronae-bearing mafic bodies were subsequently deformed and metamorphosed during continent–continent collision, similar to the event of Mukherjee et al. (Reference Mukherjee, Dey, Sanyal and Sengupta2018) after 920 Ma. These events are most possibly related to the post-Grenvillian history of CGGC during the India–Antarctica amalgamation in the course of the formation of Rodinia. In the absence of geochronological data from the studied rock, the exact age of the intrusion and its subsequent metamorphism could not be established.
10. Conclusions
-
(1) A petrographic study of the mafic intrusive in the SE CGGC indicates that orthopyroxene, amphibole and spinel formed as layers in the corona texture between olivine and plagioclase by a single-stage process during metamorphism.
-
(2) Mass-balanced reactions suggest that the coronae developed in an open system.
-
(3) Conventional thermobarometry and results from P-T pseudosection indicate that corona formation took place under P-T conditions of 860 ± 50°C and 7 ± 0.5 kbar.
-
(4) Correlation with existing geological data describing Domain I of the CGGC suggests that the intrusion of the coronae-bearing mafic rocks and their subsequent metamorphism possibly took place in the latter stages of the formation of Rodinia following the Grenvillian orogeny (1000–950 Ma).
Acknowledgements
The authors would like to acknowledge the CRF Facility at IIT (ISM), Dhanbad, and are grateful to IIT (ISM), Dhanbad for providing the required facilities, infrastructure and financial support during this work. We thank Professor Tapas Bhattacharyya for his valuable suggestions regarding the manuscript. The authors are grateful to Jillian Kendrick and an anonymous reviewer, whose comments and queries helped to improve the quality of this work. We thank our editor Dr Kathryn Goodenough for her valuable suggestions. VA is also grateful to Meenakshi Banerjee, Niladri Bhattacharjee, Aniruddha Mitra and Suraj Sen for their help with various aspects of this work.
Declaration of interest
None.