


1. Introduction
The southern Great Xing’an Range (SGXR), located in the eastern segment of the Central Asian Orogenic Belt (CAOB) (Fig. 1a, b), is one of the most economically important Cu–Mo–Fe–Sn–Pb–Zn–Ag metallogenic provinces in China (Chen & Li, Reference Chen and Li2009; Zeng et al. Reference Zeng, Liu, Yu, Ye and Liu2011; Ouyang et al. Reference Ouyang, Mao, Zhou and Su2015). It comprises numerous porphyry Mo(–Cu), skarn Fe(–Sn), epithermal Au-Ag and hydrothermal vein-type Cu–Pb–Zn–Ag ore deposits (e.g. Wang et al. Reference Wang, Wang, Wang and Uemoto2001; Zeng et al. Reference Zeng, Liu, Yu, Ye and Liu2011, Reference Zeng, Qin, Liu, Li, Zhai, Chu and Guo2015; Ouyang et al. Reference Ouyang, Mao, Santosh, Wu, Hou and Wang2014, Reference Ouyang, Mao, Zhou and Su2015; Shu et al. Reference Shu, Chang, Lai, Zhou and Yan2016; Chen et al. Reference Chen, Zhang, Wang, Pirajno and Li2017; Zhai et al. Reference Zhai, Liu, Tombros and Williams-Jones2018 a, b; Ma et al. Reference Ma, Wang, Zhou, Li, Li, Shi, Wang, Yang and Lai2019). The region can be divided into the Xilinhaote-Xilinguole Ag–Pb–Zn, Huanggangliang-Ganzhuermiao Fe–Sn–Cu–Pb–Zn and Tianshan-Tuquan Cu polymetallic sub-metallogenic belts (from NW to SE) (Fig. 1c; Liu et al. Reference Liu, Zhang and Zhang2004). Earlier studies primarily focused on the mineralogy and geochronology as well as the nature, origin and evolution of the ore-forming fluids of ore deposits in the first two metallogenic belts (e.g. the Hashitu Mo porphyry, Baiyinnuoer Pb–Zn skarn, Huanggang Sn–Fe skarn, Haobugao Fe–Zn skarn, Weilasituo Zn–Cu–Ag vein, Bairendaba Ag–Zn–Pb vein and Bianjiadayuan Ag–Pb–Zn vein deposits; Zhou et al. Reference Zhou, Mao and Lyckberg2012; Ouyang et al. Reference Ouyang, Mao, Santosh, Wu, Hou and Wang2014; Mei et al. Reference Mei, Lü, Liu, Tang, Ai, Wang and Cisse2015; Shu et al. Reference Shu, Lai, Sun, Wang and Meng2013, Reference Shu, Chang, Lai, Zhou and Yan2016, Reference Shu, Chang and Mavrogenes2020; Liu et al. Reference Liu, Jiang and Bagas2016 b, Reference Liu, Jiang, Bagas, Han, Chen and Kang2017; Zhai et al. Reference Zhai, Liu, Zhang and Sun2017, Reference Zhai, Liu, Zhang, Tombros and Zhang2018 b; Gao et al. Reference Gao, Zhou, Breiter, Ouyang and Liu2019). Previously published studies have indicated that the majority of these deposits are genetically related to spatially associated Mesozoic granites. However, the genesis of the deposits in the Tianshan-Tuquan Cu polymetallic metallogenic belts, especially for the base metal veins, are as yet unknown or still under debate (Gu, Reference Gu2016; Shi et al. Reference Shi, Wang, Ma, Li, Li and Wang2020; Yang et al. Reference Yang, Ma, Wang, Ma and Wang2020; Sun et al. Reference Sun, Wang, Sun, Lai, Zhang, Zhao and Sun2021).
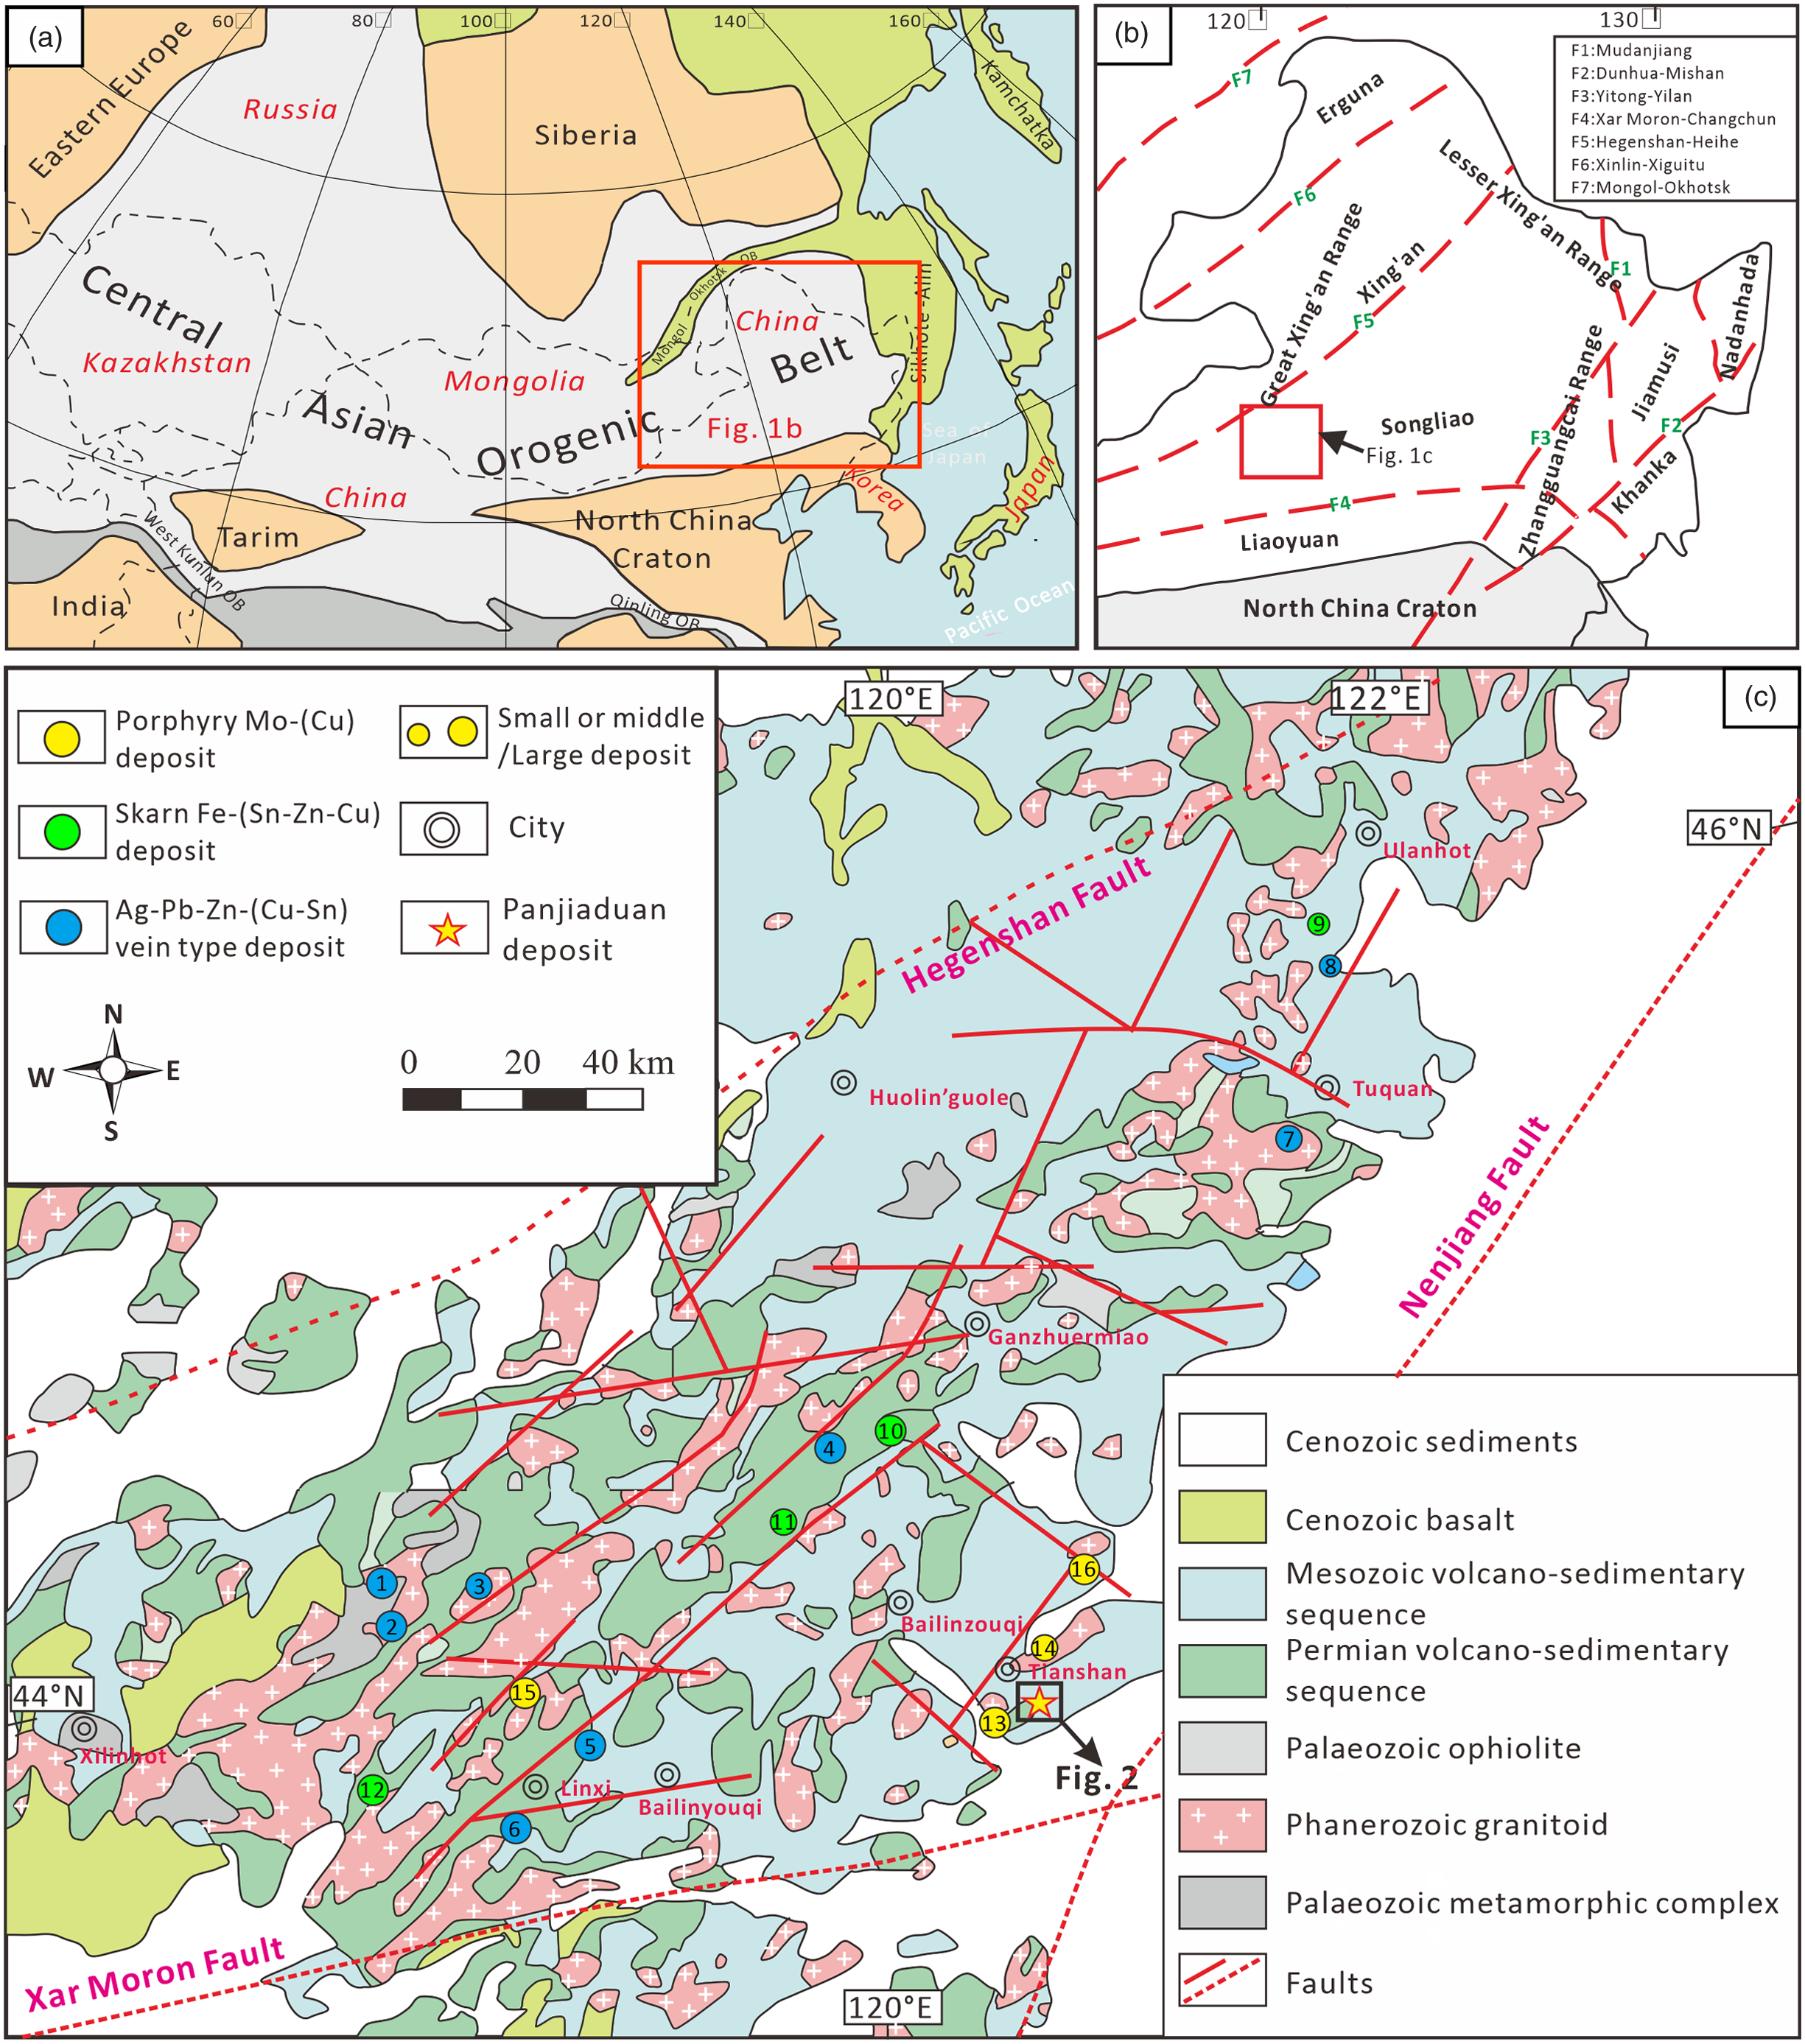
Fig. 1. (Colour online) (a) Simplified tectonic map showing the location of NE China, modified after Safonova & Santosh (Reference Safonova and Santosh2014). (b) Tectonic map of NE China (after Wu et al. Reference Wu, Sun, Ge, Zhang, Grant, Wilde and Jahn2011 a, b); and (c) geologic map of the southern Great Xing’an Range (after Ouyang et al. Reference Ouyang, Mao, Santosh, Wu, Hou and Wang2014). Deposit symbols: 1, Weilasituo Zn–Cu–Ag; 2, Bairendaba Ag–Pb–Zn; 3, Shabulengshan Cu–Zn; 4, Shuangjianzishan Ag–Pb–Zn; 5, Dajing Cu–Sn; 6, Bianjiadayuan Ag–Pb–Zn; 7, Meng’entaolegai Ag–Pb–Zn; 8, Lianhuashan Cu; 9, Shenshan Fe–Cu; 10, Haobugao Fe–Zn; 11, Baiyinnuoer Pb–Zn; 12, Huanggang Fe–Sn; 13, Laojiagou Mo; 14, Banlashan Mo; 15, Hashitu Mo; 16, Aolunhua Mo–Cu.
The SGXR contains several recently discovered vein-type deposits, including the Bianjiadayuan Ag–Pb–Zn, Weilasituo Zn–Cu–Ag, Bairendaba Ag–Zn–Pb, Shuangjianzishan Ag–Pb–Zn, Dajing Cu–Sn and Meng’entaolegai Ag–Pb–Zn deposits (Fig. 1c; Wang et al. Reference Wang, Wang, Wang and Chen2006; Ouyang et al. Reference Ouyang, Mao, Santosh, Wu, Hou and Wang2014; Liu et al. Reference Liu, Bagas and Wang2016 a, b; Zhai et al. Reference Zhai, Liu, Zhang and Sun2017; Yang et al. Reference Yang, Ma, Wang, Ma and Wang2020). Previous studies of the base metal veins in the Xilinhaote-Xilinguole and Huanggangliang-Ganzhuermiao zones suggested that fluid mixing, dilution and cooling are the most important factors for ore deposition (e.g. Ouyang et al. Reference Ouyang, Mao, Santosh, Wu, Hou and Wang2014; Li et al. Reference Li, Wang, Wang, Zhang and Quan2017; Zhai et al. Reference Zhai, Liu, Zhang, Tombros and Zhang2018 b). However, whether the base metal veins in the Tianshan-Tuquan Cu polymetallic metallogenic belts also formed according to the above processes is unknown. To address this, we conducted a detailed study on the geology, mineralogy, fluid inclusion (FI) and isotopes (H, O, He and Ar) of the newly discovered Panjiaduan deposit, which is located in the Tianshan area (Fig. 1c). This deposit contains ore reserves of over 9.3 Mt, grading 1.36% Cu, 2.90% Pb, 3.80% Zn and 38.12 g/t Ag. To further guide mineral exploration of the base metal vein-type deposits in the SGXR, we compared isotope data from the present study with those from Pb–Zn–(Cu–Ag) vein deposits (associated with granitoids) elsewhere in the world.
2. Geological setting
The SGXR is located in the southeastern region of Inner Mongolia and bordered by the Erlian-Hegenshan fault in the north, the Xar Moron fault in the south and the Nenjiang fault in the east (Fig. 1b). The region has undergone multiphase Phanerozoic tectonic events, including (1) the Palaeozoic – early Mesozoic subduction and final closure of the Palaeo-Asian Ocean (Robinson et al. Reference Robinson, Zhou, Hu, Reynolds, Bai and Yang1999; Xiao et al. Reference Xiao, Windley, Hao and Zhai2003; Wu et al. Reference Wu, Sun, Ge, Zhang, Grant, Wilde and Jahn2011 a); (2) the Mesozoic S-dipping subduction and final closure of the Mongol-Okhotsk Ocean (Sorokin et al. Reference Sorokin, Yarmolyuk, Kotov, Sorokin, Kudryashov and Li2004; Donskaya et al. Reference Donskaya, Gladkochub, Mazukabzov and Ivanov2013); and (3) the Mesozoic W-dipping region of the Palaeo-Pacific subduction zone (Xu et al. Reference Xu, Pei, Wang, Meng, Ji, Yang and Wang2013; Wilde, Reference Wilde2015). The exposed strata in the area comprise an early Palaeozoic metamorphic complex and ophiolite, late Palaeozoic and Mesozoic volcano-sedimentary sequences, and Cenozoic sediments (Fig. 1c). The Palaeozoic Xilinhot complex comprising plagioclase-biotite gneiss, granitic gneiss, schist and minor amphibolite hosts the Weilasituo and Bairendaba Pb–Zn–(Cu–Ag) veins (Liu et al. Reference Liu, Jiang and Bagas2016 b). The upper Palaeozoic volcano-sedimentary sequence is primarily composed of the Permian Shoushangou, Dashizhai, Zhesi and Linxi formations, and hosts numerous base metal veins and skarn deposits (e.g. the Shenshan Fe–Cu, Dajing Cu–Sn, Haobugao Fe–Zn and Bianjiadayuan Ag–Pb–Zn deposits; Wang et al. Reference Wang, Wang, Wang and Chen2006; Ouyang et al. Reference Ouyang, Mao, Santosh, Wu, Hou and Wang2014; Zhai et al. Reference Zhai, Liu, Zhang and Sun2017; Ma et al. Reference Ma, Wang, Zhou, Li, Li, Shi, Wang, Yang and Lai2019; Shu et al. Reference Shu, Chang and Mavrogenes2020). The widely distributed Mesozoic volcano-sedimentary rocks are controlled by regional NE-trending faults. These rocks include the Lower Jurassic Hongqi formation, Middle Jurassic Wanbao and Xinmin formations, Upper Jurassic Manketouebo, Manitu and Baiyin’gaolao formations, and the minor Lower Cretaceous Meiletu formation. The Cu–Pb–Zn–Mo mineralization in the Tianshan-Tuquan zone is primarily hosted in the Middle–Upper Jurassic sequences (e.g. the Banlashan Mo, Shabulengshan Cu–Zn and Lianhuashan Cu deposits; Zhang et al. Reference Zhang, Zhang, Jin, Wu, Xiang and Chen2010; Gu, Reference Gu2016; Zhang, Reference Zhang2017).
Phanerozoic magmatism occurred in five stages: (1) late Carboniferous (c. 320–305 Ma), (2) early Permian (c. 285–270 Ma), (3) Middle–Late Triassic (c. 247–218 Ma), (4) Early–Middle Jurassic (c. 182–175 Ma) and (5) Late Jurassic – Early Cretaceous (c. 161–125 Ma) (Gu, Reference Gu2016; Zhang, Reference Zhang2017; Ma et al. Reference Ma, Wang, Zhou, Li, Li, Shi, Wang, Yang and Lai2019). The Middle–Late Triassic intrusive rocks, which comprise tonalite, granodiorite and monzogranite, are spatially and temporally related to porphyry-skarn-epithermal Cu–Mo–Pb–Zn mineralization (e.g. the Baiyinnuoer Pb–Zn skarn, Laojiagou Mo porphyry and Lianhuashan high-sulphidation epithermal Cu deposits; Shu et al. Reference Shu, Lai, Sun, Wang and Meng2013; Gu, Reference Gu2016; Tang et al. Reference Tang, Li, Wang, Li, Cai, Liu and Wang2019). The Late Jurassic – Early Cretaceous intrusive rocks, including granodiorite, plagioclase granite and syenogranite, are widespread in the region and genetically related to the late Mesozoic polymetallic mineralization (c. 133–165 Ma; Zhou et al. Reference Zhou, Mao and Lyckberg2012; Zhai et al. Reference Zhai, Liu, Zhang and Sun2017; Liu et al. Reference Liu, Bagas and Wang2016 a, b; Ma et al. Reference Ma, Wang, Zhou, Li, Li, Shi, Wang, Yang and Lai2019; Shu et al. Reference Shu, Chang and Mavrogenes2020; Shi et al. Reference Shi, Wang, Ma, Li, Li and Wang2020).
3. Ore deposit geology
3.a. Stratigraphy and structures
The strata exposed near the Panjiaduan deposit primarily includes the Upper Jurassic Manitu Formation and Quaternary sediments (Fig. 2a). The Manitu Formation comprises andesite, intermediate-felsic tuff and tuffaceous sandstone dipping to the east at 30–40°, with a U–Pb zircon age of c. 138–158 Ma (Sun et al. Reference Sun, Gou, Ren, Fu, Wang and Liu2011; Zhang et al. Reference Zhang, Su and Gao2017). The Cu–Pb–Zn veins associated with the deposit are predominantly hosted by the intermediate-felsic tuff of the Manitu Formation (Fig. 2a). These volcanic rocks have a calc-alkaline affinity, and are large-ion lithophile element (LILE-) enriched, high-field-strength element (HFSE-) depleted and possess a relatively low initial 87Sr/86Sr ratio ((87Sr/86Sr)i = 0.70441–0.70492), positive ϵ Nd(t) (0.16–1.64) and young T DM2 model ages (694–767 Ma) (Zhang et al. Reference Zhang, Su and Gao2017). The E-W–trending faults and secondary NW- and NE-trending faults are the primary structures in the ore district. They principally developed in the central and eastern parts of the district within the Manitu Formation. Among these faults, the EW-trending faults (> 800 m long, c. 10 m wide and S-dipping (70–80°)) host hydrothermal breccias in the Manitu Formation. The NW-trending faults (> 400 m long and 1–5 m wide) are the vein-type Cu–Pb–Zn ore-controlling structures. These faults are steeply SW-dipping (70–85°), while the NE-trending faults are smaller (50–100 m long and 1–2 m wide) and NW-dipping (55–70°).

Fig. 2. (Colour online) (a) Geologic map of the Panjiaduan deposit. Cross-section of the vein-type Cu–Pb–Zn orebodies in (b) volcanic rocks of Manitu Formation and (c) granodiorite.
The dominant igneous rocks spatially associated with the Panjiaduan deposit consist of granodiorite and syenogranite, as well as diorite and granite porphyry dykes (Fig. 2a). The granodiorite batholith is found in the southern region of the Panjiaduan deposit and comprises quartz (25–30%), plagioclase (45–50%), K-feldspar (10–15%) and minor (5–10%) altered biotite (Sun et al. Reference Sun, Wang, Sun, Lai, Zhang, Zhao and Sun2021). The syenogranite batholith is exposed in the western region of the Panjiaduan deposit and consists of quartz (c. 25%), plagioclase (c. 15%), K-feldspar (40–45%) and altered biotite (10–15%), and hosts several Late Triassic porphyry-type Mo deposits (Sun et al. Reference Sun, Wang, Sun, Lai, Zhang, Zhao and Sun2021). There are also minor NNE- and NE-trending diorite and granite porphyry dykes (> 150 m long and 1–4 m wide) that intruded volcanic rocks of the Manitu Formation (Fig. 2a).
3.b. Mineralization and alteration
The Cu–Pb–Zn veins in the Panjiaduan deposit occur in fracture zones in the Manitu Formation and granodiorite (Fig. 2a–c). Numerous vein/veinlet and breccia ores have been identified in the ore district. Eight NE-, NW- and EW-trending Cu–Pb–Zn orebodies are found in the SE region of the Panjiaduan deposit. The NE-trending Pb–Zn orebodies (Nos 2 and 5) strike 60–64° and dip at 58–65° SW. These orebodies are 100–560 m long, 4–5 m thick, and together contain 0.86% Cu, 1.78% Pb and 1.81% Zn. The NW-trending Cu–Pb–Zn orebodies (Nos 1, 1-1, 1-2 and 3) occur as NW-trending open-space veins in the granodiorite that are steeply NE-dipping (75–80°). These orebodies are 243–500 m long (average thicknesses of 1–9 m) with an average grade of 1.7% Cu, 3.56% Pb and 4.64% Zn. The roughly EW-trending Cu–Pb–Zn orebodies (Nos 4 and 9) are moderately N-dipping (58–70°). They are 100–500 m long, 4–6 m thick, 278–633 m deep, and have an average grade of 2.21% Cu, 4.45% Pb and 5.72% Zn.
The metallic minerals included in the deposit include pyrite, chalcopyrite, sphalerite, galena and haematite, with minor arsenopyrite, argentite and bornite (Fig. 3). The non-metallic minerals comprise quartz, chalcedony, hornblende, sericite, chlorite, epidote and calcite. The alteration zone is up to 10 m wide and consists primarily of silicic, propylitic (epidote-chlorite), sericitic, carbonate and (minor) pyritization that is spatially confined to the NW/E–W-trending faults (Fig. 3a–i). Among them, silicification is the most pervasive and Cu–Pb–Zn ore-related alteration style, and it strongly occurs in the granitoid as well as the rocks in the Manitu Formation. In addition, it commonly coexists with carbonate, sericitic and pyrite types of alteration within the granodiorite. Chloritization and epidotization strongly occur in the volcanic rocks and, to a lesser extent, intrusive rocks in the Manitu Formation, and are associated with silver-bearing metal sulphide mineralization.

Fig. 3. (Colour online) Photographs of the Panjiaduan Cu–Pb–Zn deposit: (a) stage I quartz-pyrite-(arsenopyrite) vein; (b) stage II quartz-pyrite-chalcopyrite ore; (c) stage II polymetallic sulphides hosted in granodiorite; (d, e) stage II polymetallic sulphides hosted in volcanic rocks of Manitu Formation; (f) stage III quartz-pyrite-galena-sphalerite veins; (g) stage III brecciated galena-sphalerite ores; (h) stage II coarse-grained euhedral galena; (i) stage III greenish fine-grained anhedral sphalerite in milky quartz veins; (j) stage I subhedral pyrite-arsenopyrite with minor chalcopyrite; (k) stage II anhedral chalcopyrite and sphalerite replaced subhedral pyrite; (l) supergene haematite and bornite replaced stage II anhedral chalcopyrite; (m) stage III subhedral galena replaced anhedral sphalerite; (n) stage III chalcopyrite disease occurs in sphalerite; and (o) stage III sphalerite and argentite assemblages replaced pyrite. Apy – arsenopyrite; Arg – argentite; Bn – bornite; Cal – calcite; Ccp – chalcopyrite; Gn – galena; Hem – haematite; Py – pyrite; Qtz – quartz; Sp – sphalerite.
3.c. Paragenetic sequence
Based on field investigations as well as mineral assemblages and cross-cutting relationships, four paragenetic stages of Cu–Pb–Zn mineralization are recognized here (Fig. 4). Late supergene oxidation affected the primary sulphides to form haematite, bornite, covellite and malachite (Fig. 3l).

Fig. 4. Summary of paragenetic stages for the Panjiaduan Cu–Pb–Zn mineralization.
Stage I is the earliest stage and is characterized by quartz, pyrite and minor arsenopyrite. Pyrite occurs as coarse-grained euhedral sizes within altered volcanic rocks and subhedral aggregates in milky quartz veins, whereas arsenopyrite generally occurs as fine-grained anhedral aggregates with pyrite in milky quartz veins (Fig. 3a, j). Both are commonly replaced by aggregates of chalcopyrite and sphalerite during stage II (Fig. 3b).
Stage II (quartz-polymetallic sulphide) is characterized by the presence of large amounts of sulphides (pyrite, chalcopyrite, galena, sphalerite and minor bornite) within fractures in altered volcanic rocks and white-grey quartz veins (Fig. 3b–e). Chalcopyrite principally occurs as anhedral aggregates with pyrite and fills microcracks within the pyrite. Bornite is included in chalcopyrite that coexist with haematite (Fig. 4l), indicating a supergene process. Galena characteristically occurs as coarse-grained euhedral cubes, while sphalerite generally occurs as coarse-grained brown subhedral aggregates (Fig. 3h).
Stage III (quartz-galena-sphalerite-argentite) is composed primarily of quartz, galena and sphalerite, with minor calcite, pyrite, chalcopyrite and argentite that commonly occur in breccias and veins (Fig. 3f, g). Sphalerite occurs as fine-grained greenish anhedral aggregates in white-grey quartz veins (Fig. 3l), while galena occurs as fine-grained anhedral aggregates (Fig. 3m; Sun et al. Reference Sun, Wang, Sun, Lai, Zhang, Zhao and Sun2021). Minor chalcopyrite disease occurs in the sphalerite (Fig. 4n). Argentite is the only Ag-bearing mineral observed in the deposit, where it occurs as inclusions within the sphalerite (Fig. 4o).
Stage IV (quartz-calcite-minor sulphide) is represented by quartz, calcite and minor amounts of pyrite and sphalerite within fractured zones in altered volcanic rocks (Sun et al. Reference Sun, Wang, Sun, Lai, Zhang, Zhao and Sun2021). Quartz-calcite veins commonly contain earlier galena-sphalerite breccia. These veins generally indicate that quartz crystals grew from the walls towards the centre, with later infilling of calcite crystals and minor pyrite (Sun et al. Reference Sun, Wang, Sun, Lai, Zhang, Zhao and Sun2021). This observation implies that the formation of quartz occurred slightly earlier than that of calcite, although they likely precipitated from the same fluid system.
4. Sampling and analytical methods
4.a. Fluid inclusion analyses
To help constrain the conditions of ore formation of the Cu–Pb–Zn veins, quartz from each sulphide-bearing stage was made into doubly polished thin-sections (< 0.30 mm thick) for FI petrographic, microthermometric and laser Raman spectroscopic analyses. Microthermometric and laser Raman spectroscopic analyses were conducted at the Key Laboratory of Geological Fluids, Jilin University, Changchun, China using a Linkam THMS-600 heating–freezing stage (−196 to 600 °C), a Renishaw RM1000 Raman microprobe and an Ar ion laser. The microthermometric equipment was calibrated by the freezing point of pure water (0.0 °C) (Sterner & Bodnar, Reference Sterner and Bodnar1984). The precision of each microthermometric measurement was ± 0.2 °C during cooling cycles and ± 0.1 °C during heating cycles. The temperatures of these cycles and phase transitions were determined at heating rates of 1–5 °C/min and 0.1–0.5 °C/min, respectively. The Raman shift was calibrated using a single silicon crystal. The operating conditions for the Raman microprobe included a laser power of 5 mW, a laser wavelength of 514.5 nm, a beam diameter of 1–2 μm and a counting time of 30 s. The procedure for the laser Raman spectroscopic measurement was given by Wopenka et al. (Reference Wopenka, Pasteris and Freeman1990).
4.b. Isotope analysis
4.b.1. H-O isotopes
Hydrogen and oxygen isotopic analyses of the FIs in quartz from the four metallic mineral stages were conducted at the Beijing GeoAnalysis Co. Ltd, China using a Finnigan MAT-253 mass spectrometer (Clayton & Mayeda, Reference Clayton and Mayeda1963). The samples used for hydrogen and oxygen isotope analyses contained approximately 60–85% primary FIs and between 15 and 40% secondary inclusions, the former of which increased from stage I to stage IV. Before hydrogen isotope analysis, the samples were crushed to a granularity of 40–60 mesh and then heated to 100–200 °C to decrepitate a majority of the secondary FIs and thereby largely eliminate their contribution to the isotope composition. The dried samples were then put into a Flash EA, Thermo at 1420 °C to decrepitate the FIs. The hydrogen for isotopic analysis was then loaded into the mass spectrometry by high pure helium. The samples for oxygen isotope analysis were crushed to a granularity of 200 mesh and then put into the oven at 105 °C for 12 hours. Oxygen was extracted from the quartz through BrF5 reactions in a vacuum under high temperature (580 °C) conditions and then collected using a 5 Å molecular sieve sample tube. The isotopic ratios for oxygen and hydrogen are presented in standard δ notation (‰) relative to Standard Mean Ocean Water (SMOW) with an analytical precision of ± 0.2‰ in δ18O and ± 2‰ in δD, respectively.
4.b.2. He–Ar isotopes
Four pyrite samples from stages II and III were analysed for He and Ar isotopic compositions. The analyses were performed using a Nobleless SFT mass spectrometer at the Key Laboratory of Petroleum Resources, Northwest Institute of Eco-Environment and Resources, CAS, Lanzhou, China. Noble gases were selected by heating in a vacuum; we then also used liquid nitrogen, a sponge titanium furnace (800 °C) and a Zr-Al getter pump to further separate the noble gases. The purified noble gases were separated into He–Ne and Ar gases using a cold pump. The noble gas isotope composition of the reference samples included a 4He content of 5.24×10⁻⁶ (V/V), 20Ne content of 1.68×10⁻⁵ (V/V), 40Ar content of 9.31×10⁻³ (V/V), 3He/4He ratio of 1×10⁻⁶, 40Ar/36Ar ratio of 295.5 and 38Ar/36Ar ratio of 0.188.
5. Results
5.a. Fluid-inclusion petrography
During the detailed petrographic observations a large number of FIs, including primary, pseudosecondary and secondary FIs, were found in quartz from stages I to IV. According to the criteria of Roedder (Reference Roedder1984), a pseudosecondary assignment was recognized as those present in the planes of inclusions terminated within a crystal, whereas secondary inclusions were assigned to those planes that cross-cut grain boundaries (Fig. 5j, k). Pseudosecondary and secondary inclusions consist of two-phase liquid-vapour inclusions. The secondary inclusions are generally < 10 μm in diameter with low vapour percentage of 5–10 vol.%. The primary FIs can be classified into three types (Fig. 5), based on their vapour-to-liquid ratios at room temperature (25 °C), heating–freezing behaviour and the compositions determined by laser Raman spectroscopy.

Fig. 5. (Colour online) Photomicrographs showing the types and distribution of FIs from the Panjiaduan deposit: (a) obvious euhedral growth zones observed in stage I hydrothermal vein quartz associated with sulphide deposition; (b) LV-type FIs in stage I quartz; (c) LV- and SL-type FIs coexisting in stage I quartz; (d) VL-type FIs in stage II quartz; (e) VL- and LV-type FIs coexisting in stage II quartz; (f–h) VL-, LV- and SL-type FIs coexisting in stage II quartz; (i–k) VL- and LV-type FIs coexisting in stage III quartz; and (l) VL-type FIs in stage IV quartz. L – liquid; V – vapour; S – halite daughter mineral.
Liquid-rich two-phase liquid-vapour FIs (VL-type) are the most abundant type of primary inclusions in the various mineralized stages (Fig. 5c–l). They typically have two phases at room temperature and are predominantly liquid-rich with the vapour percentage of 10–30 vol.%. These FIs vary from < 10 to 30 μm in diameter with elongated, elliptical or irregular shapes. FIs of this type are principally abundant in stages I–IV quartz and are either clustered or isolated. They also coexist with vapour-rich two-phase liquid-vapour FIs (LV-type) and three-phase liquid-vapour-solid FIs (SL-type) as boiling FI assemblages in stages I–III.
LV-type FIs are two-phase inclusions at room temperature with a high vapour percentage of 70–85 vol.% (Fig. 6b–i). They are approximately 10–25 μm in diameter and are typically spherical or elliptical in shape. LV-type FIs are primarily clustered in quartz in stages I–III, where they coexist with VL-type and SL-type FIs.

Fig. 6. (Colour online) Histograms of homogenization temperatures and salinities of FIs in different mineralization stages for the Cu–Pb–Zn mineralization at Panjiaduan.
SL-type FIs contain liquid and vapour as well as opaque and transparent daughter minerals at room temperature (Fig. 6c, f, g). The transparent daughter mineral occurs as subhedral/euhedral cubes and is likely halite. These inclusions are generally 5–20 μm in diameter with negative crystal, elliptical and irregular shapes. They contain 5–10 vol.% daughter minerals with the vapour percentage 5–25 vol.%, and occur clustered and isolated in quartz in stages I and II.
5.b. Microthermometry and laser Raman spectroscopy
Microthermometric studies were conducted on various types of primary, pseudosecondary and secondary inclusions in the quartz in stages I–IV. The secondary inclusions generally homogenize into the liquid phase at 108–175 °C (stage I), 109–164 °C (stage II), 109–148 °C (stage III) and 103–129 °C (stage IV). As the phase transition of LV-type FIs was difficult to observe, the ice-melting temperatures (T m–ice) are not particularly precise. The microthermometric data calculated by the MacFlinCor calculation program (Brown & Hagemann, Reference Brown and Hagemann1995) are summarized in Table 1 and illustrated in Figure 6.
Table 1. Fluid-inclusion microthermometric data and calculated parameters of the Cu–Pb–Zn veins at Panjiaduan. T e – eutectic temperature; T m−ice – ice-melting temperature; T halite – halite dissolution temperature; T h – homogenization temperature; p – primary fluid inclusions; ps – pseudosecondary inclusions; s – secondary inclusions.

Stage I: The VL-type FIs characteristically homogenize into the liquid phase with vapour disappearance temperatures of 324–380 °C. They have T m–ice between −12.1 and −7.0 °C with corresponding salinities of 10.5–16.1 wt% NaCl equiv. The LV-type FIs have T h of 337–365 °C (liquid phase disappearance), T m−ice of −1.9 to −0.4 °C, and corresponding low salinities of 0.7–3.2 wt% NaCl equiv. The SL-type FIs homogenize to the liquid phase at 348–386 °C with halite dissolution temperatures of 251–298 °C and salinities of 34.7–38.0 wt% NaCl equiv.
Stage II: The VL-type FIs have T h of 278–330 °C and T m−ice of −8.9 to −5.0 °C with salinities of 7.9–12.8 wt% NaCl equiv. The LV-type FIs homogenize to the gaseous phase between 276 and 319 °C with T m−ice of −1.8 to −0.5 °C and salinities of 0.9–3.1 wt% NaCl equiv. The SL-type FIs have halite dissolution temperatures of 210–250 °C with corresponding salinities of 32.4–34.7 wt% NaCl equiv. They homogenize to the liquid phase at temperatures of 283–334 °C.
Stage III: Only VL- and LV-type FIs were identified in the mineralized quartz crystals. The VL-type FIs have T h of 216–265 °C and T m−ice of −4.5 to −2 °C with salinities of 3.4–7.2 wt% NaCl equivalent. The LV-type FIs homogenize into the vapour phase of 210–269 °C with T m−ice of −1.6 to −0.3 °C and salinities of 0.5–2.7 wt% NaCl equivalent.
Stage IV: Only VL-type FIs were observed in late-stage quartz crystals. The VL-type FIs from this stage homogenize to the liquid phase with T h of 139–185 °C, T m−ice of −2.6 to −0.9 °C and corresponding salinities of 1.6–4.2 wt% NaCl equivalent.
Laser Raman analyses of the representative FIs in the mineralized quartz from different stages indicate that the vapour phase primarily consists of H2O (Fig. 7). Gaseous H2O (3475 cm–1) and small amounts of CO2 (1231 cm–1) were detected in the LV-type FIs during stage I (Fig. 7a), whereas the LV-type FIs from stage II and the VL-type FIs from stage III only have gaseous H2O peaks near 3475 cm–1 (Fig. 7b, c).

Fig. 7. (Colour online) Laser Raman spectra of FIs: (a) minor CO2 in vapour phase of stage I vapour-rich LV-type inclusion; (b) H2O in vapour phase of stage II vapour-rich LV-type inclusion; and (c) H2O in vapour phase of stage II liquid-rich VL-type inclusion.
5.c. Isotope analysis
5.c.1. H-O isotopes
Hydrogen and oxygen isotopic data for the quartz samples are listed in Table 2 and plotted in Figure 8. Ten samples have δ18OV-SMOW values of −2.7 to 9.2‰, whereas the FI waters extracted from the quartz have δDSMOW values ranging from −132.7 to −110.2‰. The δ18OH2O values of the hydrothermal fluids were calculated using the quartz-water isotopic fractionation equation 1000 ln α Qtz−H2O = (3.38 × 10⁶)/T2 − 3.40 (Clayton et al. Reference Clayton, O’Neil and Mayeda1972), in which T was determined based on the minimum T h of the FIs from different stages. The calculated ore-fluid δ18OH2O values are −1.1 to 2.6‰ (stage I), −5.6 to −3.9‰ (stage II), −14.3 to −11.4‰ (stage III) and −15.7‰ (stage IV).
Table 2. Hydrogen and oxygen isotopic data of FIs in quartz from the Panjiaduan Cu–Pb–Zn deposit


Fig. 8. (Colour online) δD versus δ18OH2O plot of ore-forming fluids of the Panjiaduan deposit, after Taylor (Reference Taylor1974). Source of the reference composition fields: Au–Cu(–Mo) series of magmatic water from Zhang (Reference Zhang1985), meteoric water line from Hoefs (Reference Hoefs2009). δD versus δ18OH2O compositions of the Koru-Tesbihdere, Guanajuato, Shuangjianzishan, Weilasituo and Bairendaba deposits are from Mango et al. (Reference Mango, Arehart, Oreskes and Zantop2014), Cicek & Oyman (Reference Cicek and Oyman2016), Zhang et al. (Reference Zhang, Zhai, Liu, Li, Li and Sun2019), Ouyang et al. (Reference Ouyang, Mao, Santosh, Wu, Hou and Wang2014) and Li et al. (Reference Li, Wang, Wang, Zhang and Quan2017), respectively.
5.c.2. He–Ar isotopes
The He and Ar isotopic analysis results from the FIs in the pyrite from stages II and III are listed in Table 3 and plotted in Figure 9. The 4He and 40Ar concentrations in the FIs range from 8.94 × 10⁻⁶ to 8.99 × 10⁻⁶ cm3 STP g–1 and 5.82 × 10⁻⁷ to 9.64 × 10⁻⁷ cm3 STP g–1, respectively. The 3He/4He, 40Ar/36Ar, 3He/36Ar and 40Ar*/4He ratios are 0.032–0.052 Ra, 299–317, 1.88 × 10⁻⁴ to 2.08 × 10⁻⁴ and 1.66 × 10⁻³ to 6.68 × 10⁻³, respectively, where Ra (= 1.4 × 10⁻⁶) represents the atmospheric 3He/4He ratio (Stuart et al. Reference Stuart, Burnard, Taylor and Turner1995). The F4He value, defined as the 3He/4He ratios of the samples relative to that of the atmosphere (0.1655; Kendrick et al. Reference Kendrick, Burgess, Pattrick and Turner2001), varies from 17 645 to 27 829. The proportion of radiogenic 40Ar (40Ar*) ranges from 0.84 to 6.19, using the formula 40Ar*(%) = {1–[295.5/(40Ar/36Ar)sample]} × 100.
Table 3. Helium and argon isotopic compositions of FIs in pyrite from the Panjiaduan Cu–Pb–Zn deposit

40Ar* (%) (the proportion of radiogenic 40Ar) = {1–[295.5/(40Ar/36Ar)sample]} × 100; 40Ar*/4He = [(40Ar–295.5) × 36Ar]/4He; R/Ra = (3He/4He)sample/(3He/4He)air, where (3He/4He)air = 1.4 × 10⁻⁶; F4He = (4He/36Ar)sample/(4He/36Ar)air, where (4He/36Ar)air = 0.1655 (Kendrick et al. Reference Kendrick, Burgess, Pattrick and Turner2001).

Fig. 9. (Colour online) (a) 3He versus 4He, (b) R/Ra versus 40Ar/36Ar and (c) R/Ra versus 40Ar*/4He plots of inclusion-trapped fluids in pyrite from the Panjiaduan Cu–Pb–Zn deposit (modified from Mamyrin & Tolstihkin, Reference Mamyrin and Tolstihkin1984). The He–Ar isotopic compositions of typical Pb–Zn polymetallic vein-type deposits including the Tighza-Jbel Aouam, Iheya and Lishan deposits are from Yang et al. (Reference Yang, Zhai, Yu, Zhang, Xu and Su2021), Rossi et al. (Reference Rossi, Gasquet, Cheilletz, Tarrieu, Bounajma, Mantoy, Reisberg, Deloule, Boulvais and Burnard2017) and Yu et al. (Reference Yu, Xu, Wang, Xu, Huang, Zou, Zhao and Deng2021), respectively.
6. Discussion
6.a. Source of the ore-forming fluids
6.a.1. H-O isotopic fingerprinting
The calculated δ18OH2O (−15.7 to 2.6‰) and δDSMOW (−132.7 to −110.2‰) values for the quartz from the four hydrothermal stages show a shift towards isotopic depletion from stage I to IV as shown in Table 2 and Figure 8, the latter of which is a plot of δDSMOW versus δ18OH2O. The δ18OH2O values for stage I (−1.1 to 2.6‰) are closer to those of magmatic water (7–9‰; Hedenquist & Lowenstern, Reference Hedenquist and Lowenstern1994) but are significantly greater than those for a late Mesozoic meteoric water (−18‰; Zhang, Reference Zhang1989), indicating an initial magmatic water contribution to the ore-forming fluids. Since the local meteoric water generally has much lower δ18OH2O values relative to the ore fluids, the calculated δ18OH2O values (−15.7 to −3.9‰) from stages II–IV are negative. The δDSMOW values ranging from −132.7 to −110.2‰ are significantly lower than those of magmatic water (−50 to −85‰; Barnes, Reference Barnes1979). The depletion in the δDSMOW values of the ore-forming fluids may have been produced by (1) changes in the oxygen fugacity of the fluids during deposition (Taylor, Reference Taylor1974), (2) hydrogen isotope fractionation between water and some reduced species (e.g. CH4 and H2), (3) boiling of the fluids (Koděra et al. Reference Koděra, Lexa, Rankin and Fallick2005), (4) magma degassing resulting from mixing with meteoric waters (Rye & Ohmoto, Reference Rye and Ohmoto1974), and (5) the presence of secondary inclusions that may record fluid conditions different from the primary inclusions measured here. The effect of the first two processes is generally negligible in natural hydrothermal systems due to the large volume of H2O (Taylor, Reference Taylor1974). Based on the above FI petrography and microthermometry, we speculate that fluid boiling and mixing with meteoric waters may be a more plausible explanation for the low δDSMOW values exhibited in hydrothermal quartz in the Panjiaduan deposit. In addition, the measured low T h and salinities of stage IV FIs suggest a significant involvement of meteoric waters in the fluid system (Fig. 6). Stage IV fluids have T h of 139–185 °C, which is slightly higher than those of secondary inclusions at this stage and overlaps the purported range of decrepitation temperatures (100–200 °C) for secondary inclusions. The presence of fluids from secondary inclusions may therefore have an impact on the O and H isotope values of stage IV fluids. However, the proportion of primary inclusions in stage IV is up to 85%, indicating that the impact was likely insignificant.
Based on the techniques of Ohmoto & Rye (Reference Ohmoto and Rye1974) and Field & Fifarek (Reference Field and Fifarek1985), the isotopic compositions of the ore-forming fluids for the Cu–Pb–Zn veins in the Panjiaduan deposit have been modelled here in terms of exchange between water (e.g. magmatic and meteoric water) and igneous rocks (e.g. granodiorite and volcanic rocks from the Manitu Formation), as well as the temperature of equilibration. The isotopic compositions were calculated at water:rock ratios of 0.001, 0.01, 0.1, 1, 10 and 100 and equilibrium temperatures of 100, 200, 300 and 400 °C. The results of the computations, depicted in Figure 8, illustrate the systematics of isotopic exchange between magmatic or meteoric and rocks of igneous-hosted vein-type deposits. The isotopic compositions of the ore-forming fluids associated with these igneous-hosted vein-type deposits indicate that these fluids were probably mixed magmatic-meteoric waters similar to those reported from the Guanajuato Cu–Pb–Zn–(Ag–Au) and Koru-Tesbihdere Pb–Zn–Cu–(Ag–Au) deposits (Mango et al. Reference Mango, Arehart, Oreskes and Zantop2014; Cicek & Oyman, Reference Cicek and Oyman2016), or predominantly meteoric water as is the case for the Shuangjianzishan Ag–Pb–Zn, Weilasituo Zn–Cu–Ag and Bairendaba Ag–Pb–Zn deposits (Ouyang et al. Reference Ouyang, Mao, Santosh, Wu, Hou and Wang2014; Li et al. Reference Li, Wang, Wang, Zhang and Quan2017; Zhang et al. Reference Zhang, Zhai, Liu, Li, Li and Sun2019). However, a minor component of magmatic water cannot be precluded on the basis of the smaller isotopic fractionation factors between water and rocks in partial equilibrium systems (Ohmoto & Rye, Reference Ohmoto and Rye1974), and the above causes for depleted the δDSMOW values. The ore-forming fluids for the Cu–Pb–Zn veins at Panjiaduan are isotopically depleted relative to magmatic water or evolved magmatic water, but they are isotopically similar to meteoric water (Fig. 8). Because most mineral-H2O fractionation factors are negative for hydrogen, magmatic fluid will not be isotopically depleted in deuterium through equilibration with the surrounding rock (Field & Fifarek, Reference Field and Fifarek1985). Consequently, we suggest that the ore-forming fluids for the Cu–Pb–Zn veins in the Panjiaduan deposit are predominantly meteoric water that evolved from magmatic fluids.
6.a.2. He–Ar isotopic fingerprinting
As the most suitable mineral for trapping noble gases, the He and Ar isotopic compositions of the inclusion-trapped fluids within pyrite were not extensively lost within c. 100 Ma (Baptiste & Fouquet, Reference Baptiste and Fouquet1996). Given that the Panjiaduan deposit has a sphalerite Rb–Sr age of 137 ± 5 Ma (Sun et al. Reference Sun, Wang, Sun, Lai, Zhang, Zhao and Sun2021), the loss of trapped He and Ar isotopes is relatively limited and the 3He/4He and 40Ar/36Ar ratios are constant (Baptiste & Fouquet, Reference Baptiste and Fouquet1996; Ballentine & Burnard, Reference Ballentine and Burnard2002). As pyrite samples were collected from drill holes, the influence of cosmogenic 3He can therefore be eliminated (Simmons et al. Reference Simmons, Sawkins and Schlutter1987; Stuart et al. Reference Stuart, Burnard, Taylor and Turner1995). Because of the fact that pyrite is not a Li-bearing mineral as well, and that 4He and 36Ar from the nuclear decay of low concentrations of U and Th within the lattice of pyrite cannot diffuse into the trapped FIs (Stuart & Turner, Reference Stuart and Turner1992; Ballentine & Burnard, Reference Ballentine and Burnard2002), the in situ production of radiogenic 4He and 36Ar from the nuclear decay of dissolved U, Th and Li within pyrite is negligible. Noble gases in inclusion-trapped fluids have three possible sources: pure air-saturated water (ASW) with 3He/4He = 1.4 × 10⁻⁶ Ra and 40Ar/36Ar = 295.5, crust-derived fluids with 3He/4He = 0.01–0.05 Ra and 40Ar/36Ar ratios of > 45 000, and mantle-derived fluids with 3He/4He = 6–9 Ra and 40Ar/36Ar ratios of > 40 000 (Burnard et al. Reference Burnard, Hu, Turner and Bi1999).
In this study, the 3He/4He ratios of the FIs in pyrite range from 0.03 to 0.05 Ra, which are consistent with crust-derived 3He/4He values (0.01–0.05 Ra; Turner et al. Reference Turner, Burnard, Ford, Gilmour, Lyon and Stuart1993) and much lower than that of mantle values (6–9 Ra; Dunai & Baur, Reference Dunai and Baur1995). The F4He values (17 645–27 829), defined as the 4He/36Ar ratio of a sample to the atmospheric 4He/36Ar ratio of 0.1655, are more than 60 000 times the ASW concentration (F4He = 0.18–0.28; Kendrick et al. Reference Kendrick, Burgess, Pattrick and Turner2001). Moreover, the range of 3He/36Ar ratios of 1.86 × 10⁻⁴ to 2.08 × 10⁻⁴ is much higher than similar ASW and atmospheric values (5 × 10⁻⁸; Turner et al. Reference Turner, Burnard, Ford, Gilmour, Lyon and Stuart1993; Stuart et al. Reference Stuart, Burnard, Taylor and Turner1995; Burnard et al. Reference Burnard, Hu, Turner and Bi1999). This suggests that the involvement of He from ASW and the atmosphere are insignificant. As shown in Figure 9b, the ore-forming fluids contain a mixed He source of crust and ASW, but the mantle-derived He is negligible with Hemantle (%) = 0.19–0.50%, based on the equation from Anderson (Reference Anderson2000). In a plot of 3He versus 4He (Fig. 9a), all samples plot in the crustal helium field. In summary, the characteristics of the He isotopic compositions indicate a predominantly crustal signature with minor contributions from ASW.
The measured 40Ar/36Ar ratio of the FIs in pyrite range from 299 to 317, which is higher than the atmospheric value of 295.5 but significantly lower than those of either the crust or mantle values. The 40Ar*/4He ratios (1.66 × 10⁻³ to 6.68 × 10⁻³) of the analysed samples are distinctly lower than crustal values (0.2; Stuart et al. Reference Stuart, Burnard, Taylor and Turner1995; Fig. 9c), which can be attributed to the preferential acquisition of 4He over 40Ar from aquifer rocks on the basis of the higher closure temperature of Ar (250 °C) relative to He (< 200 °C) in most sulphides (Lippolt & Weigel, Reference Lippolt and Weigel1988; Torgersen et al. Reference Torgersen, Kennedy and Hiyagon1988; Elliot et al. Reference Elliot, Ballentine, O’Nions and Ricchiuto1993; Ballentine & Burnard, Reference Ballentine and Burnard2002). To estimate the maximum 40Ar/36Ar proportion from the crust or mantle fluids, the maximum 40Ar* (%) for the Panjiaduan deposit is 6.19, using the equation of Kendrick et al. (Reference Kendrick, Burgess, Pattrick and Turner2001). This result indicates that the 40Ar/36Ar values are consistent with a crustal source of fluid and that mantle-derived fluids provide only a minimal contribution to the ore-forming fluids. In a plot of R/Ra versus 40Ar/36Ar (Fig. 9b), all data points are near the trend line of the modified ASW (MASW; Stuart et al. Reference Stuart, Burnard, Taylor and Turner1995), indicating the incursion of meteoric waters. The Ar isotopic compositions are compatible with the primary signatures of most shallow meteoric waters (Elliot et al. Reference Elliot, Ballentine, O’Nions and Ricchiuto1993). In summary, the isotope data support the concept that the fluids entrapped in pyrite, which exhibit characteristics of near-atmospheric Ar and crustal He, may be a mixture of principally crust-derived fluids and meteoric waters with a negligible amount of mantle-derived fluids. Some published He–Ar isotopic compositions of typical Pb–Zn (Cu–Ag) vein-type deposits from around the world were also compiled in this study, including the Iheya Pb–Zn (Cu), Lishan Pb–Zn–Cu and Tighza-Jbel Aouam Pb–Zn–Ag–(Cu) deposits (Rossi et al. Reference Rossi, Gasquet, Cheilletz, Tarrieu, Bounajma, Mantoy, Reisberg, Deloule, Boulvais and Burnard2017; Yang et al. Reference Yang, Zhai, Yu, Zhang, Xu and Su2021; Yu et al. Reference Yu, Xu, Wang, Xu, Huang, Zou, Zhao and Deng2021). The isotopic compositions from these deposits indicate that the ore-forming fluids were also predominantly a mixture of mantle-/crust-derived fluids and meteoric waters (Fig. 9).
6.b. Fluid-trapping pressure and mineralization depth
The trapping pressure can be estimated only when the trapping temperature is known or the FIs are trapped under immiscible/boiling conditions (Roedder & Bodnar, Reference Roedder and Bodnar1980; Brown & Hagemann, Reference Brown and Hagemann1995). Fluid boiling can be inferred from the FI assemblages in stages I–III (Roedder, Reference Roedder1984), which have similar T h but contrasting salinities and homogenization temperature paths (see Section 5.2). Although there are small amounts of CO2 in stage I LV-type FIs, as demonstrated by laser Raman spectroscopy, the volatile content of FIs is dominated by H2O, and the daughter mineral is halite as subhedral/euhedral cubes. The evolution of the hydrothermal fluids can therefore be evaluated using the system NaCl–H2O. Following the isobar equations for a simple NaCl–H2O system provided by Driesner & Heinrich (Reference Driesner and Heinrich2007), the estimated pressures are approximately 150–200 bar (stage I), 80–120 bar (stage II) and c. 50 bar (stage III) (Fig. 10), which correspond to depths of 1.5–2.0 km, 0.8–1.2 km and c. 0.5 km, respectively, assuming hydrostatic conditions.

Fig. 10. (Colour online) Pressure estimation for FIs of the Panjiaduan Cu–Pb–Zn deposits. Isobars were calculated from the equations of Driesner & Heinrich (Reference Driesner and Heinrich2007).
6.c. Fluid evolution and ore precipitation
Based on FI microthermometry and laser Raman spectroscopy, the ore-forming fluids that created the Cu–Pb–Zn veins in the Panjiaduan deposit evolved from a high- to medium-temperature and high- to moderate-salinity NaCl–H2O–(CO2) fluid during stage I to a moderate- to low-temperature and low-salinity NaCl–H2O fluid during stage IV. Fluid boiling induced by the sudden pressure release during upwards migration of the ore-forming fluid was one of the dominant ore-forming mechanisms for base metal vein deposits (e.g. Canet et al. Reference Canet, Franco, Prol-Ledesma, González-Partida and Villanueva-Estrada2011; Moncada et al. Reference Moncada, Mutchler, Nieto, Reynolds, Rimstidt and Bodnar2012; Kouhestani et al. Reference Kouhestani, Mokhtari, Qin and Zhao2019; Fan et al. Reference Fan, Sun, Xu, Xin, Wang and Zhang2021). This process could have effectively led to degassing of CO2, increasing pH conditions and sulphur fugacity (by increasing the H2S solubility), and decreasing oxygen fugacity of the ore-forming fluids (Hedenquist & Henley, Reference Hedenquist and Henley1985; Simmons & Christenson, Reference Simmons and Christenson1994). Minor dissolved CO2 in the laser Raman spectroscopy of the stage I LV-type FIs and predominant gaseous H2O of stages II–III LV-type FIs are consistent with the degassing of CO2 (Fig. 7).
The boiling fluid likely produced hydrofracturing of the overlying and surrounding wall rocks in the granodiorite and Manitu Formation, and it could also have further accelerated the influx and circulation of meteoric waters. The decreasing homogenization temperatures and their positive correlation with salinity from stage I to IV imply an inflow of meteoric waters that mixed with the early magmatic fluids (Simmons et al. Reference Simmons, White and John2005; Fig. 6), a conclusion that is supported by the H–O–He–Ar isotope data (see Section 6.1, Figs 8, 9). The mixing of magmatic and meteoric fluids would also change the fluid pH and oxygen fugacity (O’Neil & Silberman, Reference O’Neil and Silberman1974), and can also result in the deposition of Pb–Zn polymetallic veins (e.g. Fusswinkel et al. Reference Fusswinkel, Wagner, Wälle, Wenzel, Heinrich and Markl2013; Mango et al. Reference Mango, Arehart, Oreskes and Zantop2014; Ouyang et al. Reference Ouyang, Mao, Santosh, Wu, Hou and Wang2014; Cicek & Oyman, Reference Cicek and Oyman2016; Desanois et al. Reference Desanois, Lüders, Niedermann and Trumbull2019). Along with meteoric water input and fluid cooling, the temperature and salinity of the fluids were reduced and no SL-type FIs are observed in stage III. The H–O isotope data for stage IV fluids are close to the meteoric water line, indicating that the magmatic fluid component became negligible with the continuous input of meteoric waters. The stage IV fluid is characterized by low temperature and salinity coupled with an increase in the oxygen fugacity and acidity as indicated by the change in the stage IV mineralogy (i.e. quartz, chlorite, epidote, carbonate and minor sulphide). Additionally, fluid–rock reactions could have been locally important and partially manifested by the well developed hydrothermal alteration around the base metal veins. In summary, hydrothermal fluid boiling, cooling, mixing with meteoric waters and fluid–rock reactions are advocated as important mechanisms that contributed to the Cu–Pb–Zn vein formation.
6.d. Ore genesis
The SGXR hosts several Cu–Pb–Zn–Ag vein-type deposits. They are all genetically related to Early Cretaceous magmatism (140–133 Ma; Zeng et al. Reference Zeng, Liu, Chu, Wang, Sun, Duan and Zhou2012; Ouyang et al. Reference Ouyang, Mao and Santosh2013), which was temporally coeval with the formation of nearby porphyry Mo–(Cu) and skarn Fe–Sn–Pb–Zn deposits (e.g. the Hashitu Mo, Aolunhua Mo-Cu, Huanggang Sn–Fe and Haobugao Fe–Zn deposits; Wu et al. Reference Wu, Zhang, Wan, Chen, Zhang and Xiang2011 b; Mei et al. Reference Mei, Lü, Liu, Tang, Ai, Wang and Cisse2015; Zhai et al. Reference Zhai, Liu, Tombros and Williams-Jones2018 a; Shu et al. Reference Shu, Chang and Mavrogenes2020). However, except for the Cu–Pb–Zn veins in the Panjiaduan deposit, there is also porphyry Mo mineralization hosted in the syenogranite as veinlet-disseminated sulphide ores (Mo grade up to 0.33%) in the northwestern part of the Panjiaduan deposit. The spatial relationship of porphyry Mo mineralization to polymetallic vein mineralization may suggest that there is a genetic relationship between the two ore types. However, published geochronological data show that the porphyry Mo mineralization at Panjiaduan formed during Late Triassic time and is probably genetically related to the syenogranite (zircon U–Pb: 236.1–233.9 Ma), while the vein-type Cu–Pb–Zn mineralization occurred during Early Cretaceous time (sphalerite Rb–Sr: 138.5 ± 3.5 Ma) (Sun et al. Reference Sun, Wang, Sun, Lai, Zhang, Zhao and Sun2021). We therefore propose that there are two magmatic-hydrothermal events (Late Triassic Mo and Early Cretaceous Cu–Pb–Zn) at Panjiaduan, and that no direct genetic link occurs between the two ore types. The Late Triassic porphyry Mo mineralization formed in a post-collision extensional setting following the Palaeo-Asian Ocean closure (Sun et al. Reference Sun, Wang, Sun, Lai, Zhang, Zhao and Sun2021). The Early Cretaceous SGXR and the northeastern part of China were dominated by an extensional setting related to lithospheric thinning and asthenospheric upwelling, which was caused by the Palaeo-Pacific subduction rollback (Fig. 11; Wu et al. Reference Wu, Han, Yang, Wilde, Zhai and Park2007; Kiminami & Imaoka, Reference Kiminami and Imaoka2013). The Early Cretaceous base metal veins in both the Panjiaduan deposit and the SGXR were therefore likely formed in an intracontinental extensional setting, which is favourable for partial melting of crustal rocks (Shu et al. Reference Shu, Chang, Lai, Zhou and Yan2016). The magmatic fluids migrated upwards into the host granodiorite and volcanic rocks of the Manitu Formation through widespread extensional faults in the district (Fig. 11), which led to a sudden pressure release because of a change from lithostatic to hydrostatic conditions and subsequent fluid boiling and fluid–rock reactions. In addition, structures spatially associated with sulphide mineralization may also have provided permeable conduits favourable for deep circulation of meteoric waters, which likely aided the mixing of magmatic fluids and meteoric waters. This relationship was previously documented for the Pb–Zn (Cu–Ag) veins of the Uchuchacua district in Peru (Bussell et al. Reference Bussell, Alpers, Petersen, Shepherd, Bermudez and Baxter1990), the Guanajuato Cu–Pb–Zn (Ag–Au) deposit in Mexico (Mango et al. Reference Mango, Arehart, Oreskes and Zantop2014) and the Koru-Tesbihdere Pb–Zn–Cu (Ag–Au) deposit in Turkey (Cicek & Oyman, Reference Cicek and Oyman2016). A convecting hydrothermal system resulting from tectonomagmatic activities is therefore the key factor for Pb–Zn polymetallic vein formation, which equilibrated over a wide range of temperatures and water:rock ratios.

Fig. 11. (Colour online) Genetic model for the Panjiaduan Cu–Pb–Zn deposit.
7. Conclusion
-
1. The ore-forming fluids that created the Cu–Pb–Zn veins in the Panjiaduan deposit evolved from a high- to medium-temperature and a high- to moderate-salinity NaCl–H2O–(CO2) fluid system which changed to a moderate- to low-temperature and low-salinity NaCl–H2O fluid system with time. The H–O isotope data indicate that the fluids were predominantly meteoric water but initially magmatic in origin.
-
2. The He and Ar isotopic compositions of FIs in pyrite from the Cu–Pb–Zn veins in the Panjiaduan deposit suggest that the ore-forming fluids were a mixture of principally crust-derived fluids and meteoric waters as well as negligible mantle-derived fluids.
-
3. Fluid boiling, cooling, mixing with meteoric waters, and fluid–rock reactions are advocated for as the primary mechanisms for Cu–Pb–Zn vein formation.
-
4. The Panjiaduan Cu–Pb–Zn deposit is a hydrothermal vein ore system that is temporally and genetically related to large-scale Early Cretaceous magmatism.
Acknowledgements
The project was funded by the National Key R&D Program of China (2017YFC0601304) and the Opening Foundation of Key Laboratory of Mineral Resources Evaluation in Northeast Asia, Ministry of Land and Resources of China (DBY-ZZ-18-12, DBY-KY-18-08). The quality of the paper was markedly improved by the reviews and edits of Vasilios Melfos and associate editor Paul Spry.


