


1. Introduction
The mineral tourmaline is a robust indicator of the geological environment of its formation. Due to its complex structure which can accommodate heterovalent cations, and negligible intra-crystalline diffusion, the mineral is sensitive to the textural and compositional environment of its growth and is therefore a good archive of the geological history of its host rock (von Goerne, Franz & Wirth, Reference von Goerne, Franz and Wirth1999; van Hinsberg, Henry & Dutrow, Reference van Hinsberg, Henry and Dutrow2011; Henry & Dutrow, Reference Henry and Dutrow2012). The exceptionally wide pressure–temperature (P-T) stability range of the mineral allows it to record conditions in igneous, sedimentary, metamorphic and hydrothermal environments (van Hinsberg, Henry & Dutrow, Reference van Hinsberg, Henry and Dutrow2011), even in single grains in the form of discrete zones. Although extensive work has been done on the major-element compositions of tourmaline from diverse environments (Henry & Dutrow, Reference Henry and Dutrow2012), the crystal-chemical controls on the incorporation of trace elements in the mineral is poorly understood (van Hinsberg, Henry & Dutrow, Reference van Hinsberg, Henry and Dutrow2011; Marks et al. Reference Marks, Marschall, Schühle, Guth, Wenzel, Jacob and Markl2013). In the present study, we document the textural relations and chemical compositions of three generations of tourmalines in a mica pegmatite from the Bihar Mica Belt (BMB), Chottanagpur Gneiss Complex (eastern India). The major- and trace-element composition of these tourmalines is used to infer their crystallization environment, while texturally constrained syngenetic monazites included within the individual zones are used to constrain the timing of its growth and re-equilibration. Our study illustrates and confirms the usefulness of tourmaline as a recorder of multiple geological events.
2. Geological setting
The Bihar Mica Belt is an east–west-trending, c. 160 km long, c. 25 km wide sequence of metasedimentary rocks fringing the north-eastern margin of the Chottanagpur Gneiss Complex in the Koderma–Hazaribagh–Nawada area (Jharkhand and Bihar states), India (Fig. 1a). The BMB comprises meta-arenaceous (micaceous quartzite), metapelitic (mica schist) and minor calcareous (calc-granulite) rocks interlayered with amphibolites and intruded by granite plutons, basic dykes and multiple generations of granitic pegmatite bodies (Mallik, Reference Mallik1993). The BMB metasedimentary rocks were affected by three phases of regional deformation during the late Mesoproterozoic – early Neoproterozoic Satpura Orogeny (Saha, Sarkar & Ray, Reference Saha, Sarkar and Ray1987; Sarkar Reference Sarkar1989; Misra & Dey, Reference Misra and Dey2002). The earliest deformation (D1) produced hook-shaped F1 folds which were superposed by open F2 folds with an east–west-striking axial plane during D2 deformation. The overprinting of F2 folds on F1 produced dome- and basin-type, mirror-image- and hook-type fold interference patterns (Saha, Sarkar & Ray, Reference Saha, Sarkar and Ray1987). Open folds (F3) with NNE–SSW to NNW–SSE axial trends mark the last phase of regional deformation (D3). The granite plutons were emplaced in the cores of domes produced by F2–F1 superposition and the granitic magmas are thought to have been derived from the partial melting of granodiorite-tonalite basement rocks as well as the BMB metasedimentary units (Misra & Dey, Reference Misra and Dey2002). The pegmatitic bodies are hosted in the schistose formations, migmatites and basement gneisses (Bhattacharyya, Reference Bhattacharyya1982).

Figure 1. (a) Simplified geological map of the Chottanagpur Gneissic Complex (redrawn after Chatterjee & Ghose, Reference Chatterjee and Ghose2011). The rectangle shows the Bihar Mica Belt. (b) Geological map of a part of the Bihar Mica Belt (after Mahadevan & Maithani, Reference Mahadevan and Maithani1967) showing the study area. Dots indicate locations of mica and barren pegmatites. CGC – Chottanagpur Gneissic Complex; NSMB – North Singhbhum Mobile Belt; SC – Singhbhum Craton.
Bhattacharyya (Reference Bhattacharyya1988) identified three types of pegmatitic bodies in the BMB: microcline-rich, oligoclase-rich and rare metal pegmatites. The microcline-rich pegmatites are barren and devoid of any commercial quantities of muscovite (Saha, Reference Saha1986; Jadhav, Panchapakesan & Sahu, Reference Jadhav, Panchapakesan and Sahu1988) and preserve D1 and D2 deformational structures (Sarkar, Reference Sarkar1996). In contrast, the oligoclase-bearing pegmatites are rich in mica (Mahadevan & Murthy, Reference Mahadevan and Murthy1964; Saha, Reference Saha1986) and contain sodic plagioclase, tourmaline, garnet, apatite, biotite, beryl and lepidolite. These pegmatites are syn- to post-tectonic with respect to the D2 deformation (Sarkar, Reference Sarkar1996) and occur within a series of garnet-muscovite-biotite schists interlayered with thin bands of quartzite. The rare-metal pegmatites contain columbite-tantalite, cassiterite and fergussite with minor quantities of cleavandrite, and were emplaced following D2 deformation (Saha, Reference Saha1986). Petrographic studies (Bhattacharyya, Reference Bhattacharyya1988) indicate that most of the pegmatite bodies in the area are essentially garnet- and tourmaline-bearing oligoclase-quartz-muscovite rocks.
Several hypotheses have been proposed to account for the origin of the three generations of pegmatites in the BMB. Saha (Reference Saha1986) and Sarkar & Mukhopadhyay (Reference Sarkar and Mukhopadhyay1990) argued for a cogenetic relationship between the pegmatites and the BMB plutons, with the pegmatites representing successive stages in the evolution of residual melt and vapour derived from the magmas parental to the BMB plutons. On the other hand, Bhattacharyya (Reference Bhattacharyya1988) suggested that the microcline-rich pegmatites may have crystallized from residual melts of the granite plutons, whereas the oligoclase and mica-rich pegmatites formed by the anatexis of metapelites during D3 deformation. In a more recent work, Misra & Dey (Reference Misra and Dey2002) suggested that the pegmatites were formed by the dehydration of metasediments and possibly do not have any genetic link with the BMB granite plutons. The pegmatites in the BMB have been dated at 955±40 Ma (uraninite U–Th–Pb age, mica pegmatite; Holmes, Leland & Nier, Reference Holmes, Leland and Nier1950) and 910±19 Ma (columbite-tantalite U–Pb and Pb–Pb age, rare metal pegmatite; Krishna et al. Reference Krishna, Sastry, Pandey and Sinha2003).
3. Analytical method
3.a. Major-element analysis
Backscattered electron (BSE) images were obtained using a JEOL JSM 6490 scanning electron microscope (SEM). The major-element compositions of tourmaline and coexisting minerals were determined using a Cameca SX-100 Electron Probe Micro Analyser (EPMA) at the Department of Geology and Geophysics, Indian Institute of Technology, Kharagpur. The analyses were performed with a beam current of 15 nA and acceleration voltage of 15 kV. The dwell time was set at 10 s on the peak and 5 s on the background. The following standards and emission lines were used for calibrating the instrument: jadeite (Na-Kα, Si-Kα), diopside (Ca-Kα, Mg-Kα), orthoclase (K-Kα, Al-Kα), fluor-apatite (F-Kα, P-Kα), NaCl (Cl-Kα), Fe2O3 (Fe-Kα), rhodonite (Mn-Kα), TiO2 (Ti-Kα). Thallium acid phthalate (TAP) crystal was used to analyse F, Na, Al, Si and Mg; pentaerythritol (PET) for Ca, Ti, K and Cl; large PET (LPET) for P; and lithium fluoride (LIF) for Mn and Fe. The ZAF (atomic number, absorption and characteristic fluorescence) matrix corrections were performed by the Cameca-supplied Pouchou & Puchoir (Reference Pouchou and Pichoir1984) method for silicate (PAPSIL) program. Fluorine was calibrated with fluor-apatite with a spot size of 5 µm to minimize its excitation. Structural formulae of tourmaline were calculated following the normalization procedure of Henry & Dutrow (Reference Henry, Dutrow, Grew and Anovitz1996), which is based on 15 total cations in the octahedral and tetrahedral (Y+Z+T) sites. Representative analyses are listed in Table 1. All the analytical data are provided in online Supplementary Table S1 (available at http://journals.cambridge.org/geo).
Table 1. Representative major oxide concentrations and structural formulae of tourmaline, garnet and plagioclase
3.b. Monazite analysis
Chemical dating of monazites was performed with the same EPMA setup using an improved analytical protocol (Prabhakar, Reference Prabhakar2013) that reduces the uncertainties by c. 40% compared to earlier published methods. An outline of the analytical method is provided here and the readers are referred to Prabhakar (Reference Prabhakar2013) for a detailed description. All spot analyses were performed at an acceleration voltage of 20 kV, beam current of 150−200 nA and a beam diameter of 1 µm using a LaB6 electron source. Calibration was carried out using both natural and synthetic standards: pyromorphite for Pb; UO2 for U; ThO2 for Th; synthetic glass containing Rare Earth elements (REEs) for La, Ce, Nd, Pr, Sm, Ho, Dy and Gd; apatite for Ca and P; yttrium-aluminium garnet (YAG) for Y; hematite for Fe; corundum for Al; and Th-glass for Si. Uranium, Th and Pb were simultaneously analysed in six cycles on two spectrometers using the sub-counting method (Spear, Pyle & Cherniak, Reference Spear, Pyle and Cherniak2009). For Pb, the Mα line was counted using LPET and PET crystals with a counting time of 300 s on the peak for the former and 180 s for the latter. The Mβ line was used for U to avoid the interference of Th-Mβ on U-Mα (Suzuki & Kato, Reference Suzuki and Kato2008). For Th, the Mβ line was used. Counting times for U and Th were set at 200 s on the peak for the PET crystal and 120 s for the LPET crystal. The background counting times for all the elements were half the peak time on both sides. The X-ray lines used for the REE were La-Lα, Ce-Lα, Nd-Lα, Pr-Lβ, Sm-Lα, Ho-Lβ, Dy-Lα and Gd-Lβ. The spectral interferences of Y-Lγ2 and Y-Lγ3 lines on Pb-Mα and Th-Mγ and Th-M3N4 on U-Mβ were corrected during quantification using the Peak Sight software. An in-house monazite standard from the Moacyr pegmatite of Brazil (TIMS age 487±1 Ma; Crowley et al. Reference Crowley, Chatterjee, Bowring, Sylvester, Myers and Searle2005) was analysed along with the samples to monitor the accuracy and precision of the ages. The standard provided a mean weighted age of 483±9 Ma (n=18, MSWD=0.46). X-ray element maps for Y, Th, U and Pb of the monazite grains were obtained at an accelerating voltage of 20 kV and a beam current of 100 nA with 100 ms dwell time and 0.2 µm step size. The X-ray lines and crystals used were: Y-Lα (TAP); Th-Mα (PET); U-Mβ (LPET); and Pb-Lα (LIF). In most of the grains, X-ray maps of Pb did not show any visible zoning with the analytical conditions used; they are therefore not included in the figures.
3.c. LA-ICP-MS trace-element analysis
Trace elements in tourmaline and other minerals were measured using laser-ablation inductively coupled plasma mass spectrometry (LA-ICP-MS) at the Department of Geology and Geophysics, Indian Institute of Technology, Kharagpur. The LA-ICP-MS analyses were performed using a Cetac 213 nm Nd YAG laser ablation system connected to a Varian 820 quadrupole ICP-MS. The ablation was conducted at 10 Hz pulse frequency, 50 µm spot size and 730 V energy. Analyses were performed in peak hopping mode with each analysis consisting of a 20 s background measurement with the laser turned off and 40 s peak signal measurement with the laser turned on. Calibration was performed using NIST 612 glass and data were reduced using the Glitter© software (Griffin et al. Reference Griffin, Powell, Pearson, O'reilly and Sylvester2008), using Fe or Mg as an internal standard for tourmalines and garnet and Ca for plagioclases. Within-sequence reproducibility, as estimated from repeated analyses of NIST 610 glass, are as follows: V, Co, Rb, Mo and Ag: <3% (2σ); Ni, Sr, Ba, La, Pr and Nd: <5% (2σ); Sc, Ti, Zn, Y, Zr, Nb, Ce, Sm, Eu, Gd, Tb, Dy, Ho, Er, Tm, Yb, Lu and Hf: <10% (2σ); W <12% (2σ); and Fe <21% (2σ). Time-resolved LA-ICP-MS signals for La/Ce and Zr were routinely monitored for effects of inclusions of monazite and zircon, respectively. The trace-element contents are normalized after Taylor & McLennan (Reference Taylor and McLennan1985). Representative trace-element analyses are listed in Table 2. The complete dataset is provided online as Supplementary Table S2 (available at http://journals.cambridge.org/geo).
Table 2. Representative LA-ICP-MS trace-element analyses (in ppm) of tourmaline, garnet and plagioclase

bdl: below detection limit
4. Sample description
The samples of oligoclase and mica-rich pegmatite were collected from an operational mica mine (Faguni) in the BMB (Fig. 1b). For the present study, three mica pegmatite samples were selected for detailed petrographic studies. The samples (BMB2, BMB3 and BMB4) contain plagioclase, quartz, muscovite, tourmaline, garnet and K-feldspar. Monazite, zircon and apatite are the accessory minerals. Tourmaline occurs as large grains up to several centimetres in length embedded in a coarse-grained matrix of quartz, plagioclase and muscovite (Fig. 2). It is also found as smaller inclusions within garnet (Fig. 2b). Garnet is Fe- and Mn-rich (Xalm c. 0.75; Xspss c. 0.22) and is altered to chlorite along fractures (Fig. 2c). Tourmaline shows distinct colour zonation in the three samples (Fig. 3a−f). On the basis of the variation in colour and texture, three different types/generations of tourmaline are identified. In general, most grains have a large brown core (type I) which is mantled by a bluish zone (type II). The boundary between type I and type II tourmalines is embayed, corroded and irregular but sharp. Small protrusions of the former can be seen stranded within the latter, suggesting that type II tourmaline has partially replaced type I (Fig. 3a−f). This is also seen from the narrow zones of type II tourmalines which have replaced type I tourmalines along cracks and fractures in the latter (Fig. 3d, f). The type III tourmalines occur as narrow replacement rims around type I and type II (Fig. 3c, d, f). The replacement of type I tourmaline with types II and III preserves the original shape of the grains, suggesting that the replacement is largely pseudomorphic.

Figure 2. Representative SEM-BSE images of the mineral assemblage in the mica pegmatites. (a) Inclusions of monazite within tourmaline associated with muscovite. (b) Inclusion of tourmaline within garnet, coexisting monazite and zircon at the garnet contact. The round dark spots are laser ablation spots. (c) Inclusions of monazite and tourmaline within muscovite that coexists with garnet, where garnet shows alteration to chlorite along fractures. (d) Chemical zoning in tourmaline coexisting with muscovite. Monazite inclusions are seen within the muscovite.
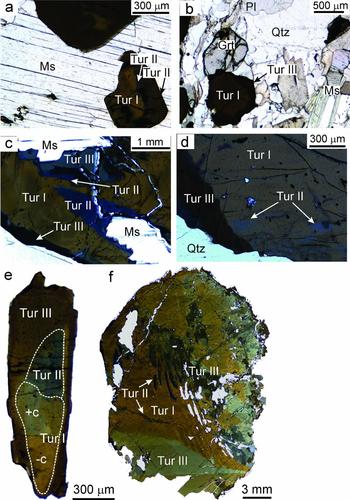
Figure 3. Representative transmitted light photomicrographs showing mode of occurrence and colour zoning in tourmaline. (a, b) Tourmaline characteristically occurs with muscovite and garnet in the pegmatites. (c, d) The brown type I tourmaline is patchily zoned and replaced at the rim or along fractures by blue type II tourmaline. It is also rimmed by type III tourmaline. (e) Photomicrograph showing a tourmaline grain cut along c-axis with type II and III tourmaline zones along the +c pole. The chemical compositions of these zones are discussed in the text. (f) A tourmaline grain with blue patchy zones of type II tourmaline within brown type I tourmaline. A thin rim of brownish to grey type III tourmaline pseudomorphically replaces type I and II.
5. Tourmaline composition
5.a. Major-element composition
All the tourmaline types are schorl/oxy-schorl in composition and, in the AFM diagram of Henry & Guiddoti (Reference Henry and Guidotti1985), plot in the ‘Li-poor granitoids and associated pegmatites and aplites’ field (Fig. 4a, b). They have similar average Al content of 6.87–6.69 apfu. The main differences in the three types are in their Na content, X-site vacancy and the Fe/(Fe+Mg) ratio. Type I tourmalines have the lowest average XFe value of c. 0.63 apfu (0.61−0.67 apfu) and average (Fe+Mg) of 2.31 apfu (2.25−2.35 apfu). These tourmalines have the lowest Na (average 0.56 apfu, 0.51−0.58 apfu) and the highest Ca (average 0.10 apfu, 0.08−0.12 apfu) contents. Type II tourmalines have higher XFe values (average 0.84 apfu, 0.80−0.88 apfu) than type I at similar Fe+Mg contents (average 2.36 apfu, 2.30−2.43 apfu). They are also richer in Na (average 0.65 apfu, 0.63−0.69 apfu) and have the lowest Ca (average 0.02 apfu, 0.02−0.03 apfu) contents. The type III tourmalines have XFe values (average 0.74, 0.70−0.77 apfu) intermediate between types I and II. They are characterized by the highest Fe+Mg contents (average 2.43 apfu, 2.39−2.48 apfu). The X-site vacancies in type I (0.29−0.40 pfu) and type II (0.27−0.35 pfu) tourmalines are comparable. However, the type III tourmalines have a relatively low X-site vacancy of 0.21−0.29 pfu. The variation in Fe/(Fe+Mg) in the three tourmaline types can be explained by the divalent cation substitution FeMg–1 (Fig. 5a). The major-element compositional data show evidence for the simultaneous operation of several coupled substitutions (Fig. 5b−e). For example, the presence of significant Al in the Y-site is explained by the de-protonation substitution, AlO(R(OH))−1, where R=Fe2+ or Mg (Fig. 5b). The high X-site vacancies together with high AlY in all three types of tourmaline indicates the operation of alkali defect substitution (□AlY) (NaRY)−1 and uvite substitution (□AlY) (CaRY)−1 (Fig. 5c). In the type I and type III tourmalines, tschermak substitution AlYAlT (MgYSiT)−1 seems to have been significant (Fig. 5d). The MgYSiT (TiYAlT)−1 substitution is prevalent in types I and III tourmaline and is insignificant in type II tourmaline (Fig. 5e).
Figure 4. (a) Al–Fe–Mg ternary diagram for tourmalines. Numbered fields are after Henry & Guidotti (Reference Henry and Guidotti1985): 1, Li-rich granitoids and associated pegmatites and aplites; 2, Li-poor granitoids and associated pegmatites and aplites; 3, Fe3+-rich quartz–tourmaline rocks and hydrothermally altered granites; 4, metapelites and metapsammites coexisting with an Al-saturating phase; 5, metapelites and metapsammites not coexisting with an Al-saturating phase; 6, Fe3+-rich quartz–tourmaline rocks, calc-silicate rocks and metapelites; 7, low-Ca metaultramafics and Cr, V-rich metasediments; and 8, metacarbonates and metapyroxenites. (b) Classification diagram for tourmaline. Total Fe (Fe2+ + Fe3+) is used as the Fe value. The tourmaline compositions plot in the schorl/oxy-schorl field and define three distinct clusters. They are not a part of one evolutionary series, but represent three generations of tourmalines which precipitated from distinct melts/fluids.
Figure 5. Bivariate plots of tourmaline major-element compositions, illustrating the different substitution schemes that may have operated.
5.b. Trace-element composition
The three types of tourmaline can also be differentiated on the basis of the concentrations of trace elements such as Sr, Sn, Sc, Zn, Mo, Nb, Pb, Zr, Ba and the REEs. The type I tourmalines, which form the core regions of grains, are enriched in several trace elements such as Sr, Sc, Ti, Y, Cr, Pb and the REEs and depleted in Zn compared to the mantles (type II tourmalines) and rims (type III tourmalines). The mantles and rims are enriched in Zn, Nb, Mo, Ta and Sn (Table 2). For the type III tourmalines, the Sc, Zn, Rb, Sr, Y, Zr, Nb, Mo, Ba, Hf, Ta, Pb, Th, Sn and REEs concentrations are intermediate between type I and type II. The concentration of V is variable in all three generations of tourmalines.
The three tourmaline types have fractionated REE patterns showing enrichment in the light REEs (LREEs) compared to the heavy REEs (HREEs). Type I tourmalines have higher total REEs (2.64–8.31 times the chondrite value) and strong positive Eu anomalies (5.28–10.31) (Figs 6, 7). Type II tourmalines have lower total REE (0.65–0.90 × chondrite value) and little to non-existent Eu anomalies (0.90–1.82, with an exception of 3.76). The REE content of type III tourmalines are intermediate between type I and type II (1.36–1.90 × chondrite value). They have LREE-enriched fractionated REE patterns similar to those of type I and type II tourmalines accompanied by small positive Eu anomalies (1.88–5.78). In sections cut parallel to the c-axis, the type I tourmalines show colour zonation but lack any sector zoning, most likely because of their higher temperature of crystallization in the pegmatites (van Hinsberg, Henry & Dutrow, Reference van Hinsberg, Henry and Dutrow2011). Both the +c and –c ends show similar total REE contents (c. 4.15 × chondrite value) with LREE-enriched patterns and strong positive Eu anomalies (Fig. 7c, d). The type II tourmaline overgrowths on the +c end have low total REE concentrations (c. 0.75 × chondrite value) with LREE-enriched patterns and minor positive Eu anomalies (Fig. 7b). The heavy REE were mostly found to be below detection limit in these zones. The type III tourmaline overgrowths at the antilogous pole (the end of the +c crystallographic axis) have intermediate total REE (c. 1.53 × chondrite value) and show LREE-enriched patterns with strong Eu anomalies (Fig. 7a).

Figure 6. Chondrite-normalized REE patterns of different generations of tourmaline. The average Na, Ca and Ti contents (wt%) and XFe values for the analyses are included at the top right corner of each plot. (a) The yellow arrows show the respective locations of LA-ICP-MS analyses spots for the REE data used for plotting. (b) Type I brown tourmaline shows a fractionated pattern enriched in the light REE relative to the heavy REE accompanied by a strong positive Eu anomaly. (c) Type II blue tourmalines show a somewhat similar pattern, albeit with lower REE concentrations and devoid of any Eu anomaly. (d) Type III brownish to greyish tourmaline also shows a similar pattern with REE content intermediate between type I and II, and a minor positive Eu anomaly. The Ca and Ti contents of the tourmalines are positively correlated with the REE concentrations and Eu anomalies, while the XFe values are negatively correlated with the REE. Chondrite values are after Taylor & McLennan (Reference Taylor and McLennan1985).

Figure 7. Chondrite-normalized REE pattern of a zoned tourmaline cut parallel to c-axis. (a) Type III tourmaline has intermediate REE content and shows a similar pattern to that of type I tourmaline. (b) Type II tourmaline mantle on +c pole of type I shows a light-REE-enriched REE pattern with minor Eu anomaly. The heavy REE contents are below detection limits. Type I tourmaline shows similar light-REE-enriched REE pattern, from both (c) antilogous and (d) analogous ends, accompanied by strong positive Eu anomaly. The REE contents of type II tourmaline are an order of magnitude lower than type I tourmaline. Note the changing REE pattern with varying Ca, Ti, Na (wt%) and XFe values. (e) Tourmaline section cut parallel to c-axis shows colour zoning and preserves distinct REE patterns as shown in (a–d).
6. Garnet and plagioclase compositions
The garnets in the samples are homogeneous in composition. They are Fe-rich (Xalm = 0.75) and have high Mn content (Xspss = 0.22). They are marginally altered to chlorite along fractures (Fig. 2c). The REE patterns are convex upwards in the middle REE, and characteristically depleted in HREEs compared to typical garnets (Fig. 8). The patterns also have large negative Eu anomalies. The garnet compositions (Tables 1, 2) and their REE patterns (Fig. 8) are typical of Mn-Fe-rich garnet crystallizing from a silicic melt or pegmatitic fluids (Whitworth & Feely, Reference Whitworth and Feely1994; Habler, Thöni & Miller, Reference Habler, Thöni and Miller2007).

Figure 8. Chondrite-normalized REE pattern of garnet and plagioclase associated with tourmaline.
Plagioclases in all the studied samples are albite (Xab c. 0.93; Table 1) and do not show compositional zoning. They have low Sr concentrations (13.4–14.3 ppm), and their REE patterns are weakly fractionated with slight negative Eu anomalies and flat heavy REE profiles (Fig. 8).
7. Monazite geochronology
Polygenetic monazites are a good tool for deciphering multiple geological events. Insignificant initial Pb content (Parrish, Reference Parrish1990), >900°C closure temperature and resistance to diffusional Pb loss makes monazite an ideal mineral for chemical dating (Cherniak et al. Reference Cherniak, Watson, Grove and Harrison2004). The high spatial resolution achievable with EPMA, together with the ability to integrate textural and chemical information, makes it very useful for distinguishing different geological events. Two of the tourmaline-bearing samples (BMB2 and BMB3) contain monazite grains both as inclusions within tourmaline and as discrete grains in the matrix (Figs 2, 9). The monazites are used to constrain the growth/alteration history of the tourmalines. Monazites included within tourmaline are compositionally homogeneous and do not show any zoning in BSE and X-ray element images. In contrast, the matrix monazite grains show distinct compositional zones in BSE images and X-ray element maps, which give multiple ages.

Figure 9. Photomicrographs showing inclusions of monazites preserving distinct chemical ages within the different generations of tourmaline. The circles and numbers alongside represent dated monazites and respective U–Th–Pbtotal ages. Note that the oldest ages of 1.35−1.23 Ga are recorded in monazites occurring invariably within the type I brown tourmaline and away from fractures. However, the younger ages of 1.16−0.97 Ga are preserved only in the monazites included in the younger type II and type III tourmalines or along visible fractures. These observations indicate that the type I tourmaline must have grown either later or synchronous with the oldest monazites (1.35−1.23 Ga), whereas the younger monazites (1.16−0.97 Ga ages) must have grown/recrystallized in later hydrothermal events that also pseudomorphically replaced type I tourmaline by type II and III tourmalines.
Chemical composition and EPMA spot ages (with 2σ errors) of the analysed monazites are provided in online Supplementary Table S3 (available at http://journals.cambridge.org/geo). The monazite ages define three major populations at c. 1290−1242 Ma, 1106−1093 Ma and 954−946 Ma (Fig. 10). The oldest age population (1290−1242 Ma) is measured from monazite grains included within the earliest type-I tourmalines. The two younger age populations (i.e. 1106−1093 Ma and 954−946 Ma) are from monazites included in type II and III tourmaline mantles and rims or from grains associated with fractures in type I (Fig. 9b, c, e, f). The matrix monazites display two types of compositional zones: some grains have narrow Th- and U-poor cores and broad Th- and U-rich mantles. The cores in such grains give ages of c. 1270 Ma while the mantles yield younger ages in the range 960−920 Ma (Fig. 11a). Other grains display a more complicated patchy zoning where high Th (5.06–8.01 wt%), low U (0.24–0.73 wt%) and intermediate Y (0.55–1.06 wt%) zones yield older ages of 1350−1280 Ma (Fig. 11b). The zones containing relatively lower Th (5.36–6.09 wt%), higher U (1.17–1.66 wt%) and higher Y (1.25–1.29 wt%) yielded younger ages of 1000−920 Ma.

Figure 10. Age probability density and histogram plots showing the statistically significant monazite age populations from two pegmatite samples. Three age populations at 1290−1242 Ma, c. 1100 Ma and c. 950 Ma can be computed.

Figure 11. SEM-BSE images and X-ray elemental maps documenting chemical zoning in the analysed monazites. The spots (white circles) and their corresponding ages (in Ga) are marked on the BSE images. The concentrations (wt% oxide) of the respective elements within each zone are marked on the X-ray element maps. Grain ‘A’ has a Th- and U-poor core and a Th- and U-rich rim. The core gives an older age of 1.27 Ga, while the rim is younger (0.96−0.92 Ga). Grain ‘B’ preserves patchy zoning of Y, Th and U and a Th-rich zone with intermediate Y contents yields older ages of 1.35−1.25 Ga. A Y-rich, Th-poor zone yields younger ages of 1.00−0.97 Ga.
8. Discussion
8.a. Tourmaline petrogenesis
The three types of tourmalines define distinct clusters in their major-element compositions. The major-element substitution schemes and trajectories within each group are also different. These features clearly indicate that the three types of tourmalines are not a part of one evolutionary series. Being euhedral, coarse grained and occasionally included within garnet, the type I tourmaline is postulated to have crystallized from the melts that formed the mica pegmatites. Their distinctly Mg- and Al-rich composition supports such an origin (e.g. Drivenes et al. Reference Drivenes, Larsen, Muller, Sorensen, Wiedenbeck and Raanes2015).
Microtextural relationships such as pseudomorphic replacement of type I tourmaline by type II and III tourmalines along embayed, corroded and irregular but sharp interfaces, as well as the presence of narrow zones of type II tourmalines along cracks and fractures in the pegmatitic tourmaline, can best be explained by pseudomorphic partial replacement of the original pegmatitic tourmaline by type II and III tourmalines via fluid-mediated coupled dissolution–reprecipitation processes (Putnis, Reference Putnis2002, Reference Putnis, Oelkers and Schott2009; Putnis & Austrheim, Reference Putnis and Austrheim2010; Harlov, Wirth & Hetherington, Reference Harlov, Wirth and Hetherington2011). Accordingly, the type II and III tourmalines are ascribed to a hydrothermal origin. The differences in the chemistries as well as the mutual microtextural relations among the three types of tourmalines can therefore be best explained by growth of tourmaline from pegmatitic melts followed by episodic re-equilibration by hydrothermal fluids during two discrete geological events.
In general, tourmalines crystallizing from granite-derived pegmatitic melts are expected to be enriched in the normally incompatible elements and depleted in the compatible elements. Roda-Robles et al. (Reference Roda-Robles, Pesquera, Gil-Crespo and Torres-Ruiz2012) found that the Sr concentration in tourmaline decreases from granites to the most evolved pegmatitic zone. On the contrary, Drivenes et al. (Reference Drivenes, Larsen, Muller, Sorensen, Wiedenbeck and Raanes2015) reported higher Sr contents in tourmalines crystallizing from evolved magmatic-hydrothermal fluids compared to those forming in magmatic environments in the Land's End granite, SW England. Galbraith et al. (Reference Galbraith, Clarke, Trumbull and Wiedenbeck2009) found lower contents of Sr in tourmalines from granites than those in metavolcanic country rocks. Fluid-melt partitioning data for granitic systems suggest that Sr and the REEs strongly partition into the melt, implying that tourmalines crystallizing from granite-derived pegmatitic melts would have higher concentrations of Sr and REEs than hydrothermal tourmalines (Marks et al. Reference Marks, Marschall, Schühle, Guth, Wenzel, Jacob and Markl2013). However, Marks et al. (Reference Marks, Marschall, Schühle, Guth, Wenzel, Jacob and Markl2013) observed higher contents of Sr and REEs in magmatic-derived hydrothermal tourmalines than in pegmatites. The higher Sr and REE concentrations and low Ni contents of type I tourmaline indicates that they may have crystallized from late-stage granite-derived melts. The low Li and Rb contents of these tourmalines can be explained by the preferential partitioning of the two elements into micas which crystallized simultaneously from the pegmatitic melts. The type I tourmalines have high Pb and low Zn concentrations. Galbraith et al. (Reference Galbraith, Clarke, Trumbull and Wiedenbeck2009) suggested that tourmalines from granitic rocks are expected to contain elevated Pb and Zn concentrations. In recent work, Hazarika, Mishra & Pruseth (Reference Hazarika, Mishra and Pruseth2015) reported high Pb content in tourmalines from altered wall rocks of greenstone-hosted gold deposits which yielded boron isotopic values indicative of a granitic fluid (Krienitz et al. Reference Krienitz, Trumbull, Hellmann, Kolb, Meyer and Wiedenbeck2008). Lead and Zn favour hydrous borosilicate melt over granitic silicate melt (Drivenes et al. Reference Drivenes, Larsen, Muller, Sorensen, Wiedenbeck and Raanes2015). The high Pb content of type I tourmaline may therefore indicate precipitation from a granite-derived pegmatitic melt. The low Zn concentrations of these tourmalines can be reconciled by the fractional crystallization of biotite. Partition coefficient for Zn in biotite for felsic melts is high (Kd c. 11–30; Ewart & Griffin, Reference Ewart and Griffin1994). The crystallization of biotite would therefore deplete the granitic magmas in Zn. The pegmatitic melt that separates from the evolved granitic magma would be Zn-poor.
The dominance of FeMg−1, (□AlY)(NaR)−1 and AlO(R(OH))−1 substitutions (Fig. 5) and the high (>6 apfu) Al contents of all the three generations of tourmalines indicate little Fe3+ in their structure. This is consistent with Mössbauer data of tourmalines from other similar pegmatitic association (e.g. Keller et al. Reference Keller, Roda Robles, PesqueraPérez and Fontan1999). The lack of Fe3+ suggests that the melts from which the tourmalines crystallized had low fO2. However, the BMB granite plutons, purported to be the source of the pegmatite melts, have magnetite (Chattopadhyay, Reference Chattopadhyay1975; Mahadevan & Murthy, Reference Mahadevan and Murthy1964; Saha, Sarkar & Ray, Reference Saha, Sarkar and Ray1987), which suggests that the granitic magmas had high fO2. The granite-derived pegmatites would therefore also have had high fO2, and tourmalines crystallizing from such pegmatites would be expected to have high Fe3+. However, the dominance of Fe2+ in the type I tourmaline requires reduction of the granite-derived melts and fluids, possibly by mixing with fluids derived from the devolatilization of their metapelitic hosts.
The type I pegmatitic tourmalines have low Sn, Nb and Ta and high LREE and Sr concentrations. The coexisting plagioclases and garnets are also depleted in these elements. The crystallization of plagioclase or garnet therefore cannot account for the depletion of Sn, Nb and Ta in the type I tourmalines. Rather, Sn, Nb and Ta may have been partitioned into white micas and the LREEs and Sr into coexisting tourmalines (Klemme et al. Reference Klemme, Marschall, Jacob, Prowatke and Ludwig2011).
The REE contents and pattern in the three tourmaline types are related to their major-element abundances. The high ∑REE and strong positive Eu anomaly in type I tourmaline (Figs 6, 7) is associated with high Ca (0.22−0.47, average 0.37 wt%), high Ti (0.16−0.52, average 0.39 wt%) and low XFe (0.61−0.68, average 0.64 wt%). The low ∑REE and negligible Eu anomaly in type II tourmaline is associated with low Ca (0.03−0.11, average 0.07 wt%), low Ti (0.13−0.40, average 0.24 wt%) and high XFe (0.80−0.88, average 0.84 wt%). The intermediate ∑REE and Eu anomaly in type III tourmaline is associate with intermediate Ca (0.11−0.19, average 0.16 wt%), high Ti (0.32−0.54, average 0.40 wt%) and intermediate XFe (0.70−0.77, average 0.74 wt%). Marks et al. (Reference Marks, Marschall, Schühle, Guth, Wenzel, Jacob and Markl2013) observed flat REE patterns without any Eu anomalies in pegmatitic tourmalines and concave-upwards REE patterns with strong positive Eu anomalies in hydrothermal tourmalines. The host rocks of these tourmalines show negative Eu anomalies. The authors suggested preference of tourmaline for Eu2+ over Eu3+ (van Hinsberg, Reference van Hinsberg2011) to be the reason for the absence of negative Eu anomaly in these tourmalines. Our data indicate that high Ca contents are invariably associated with high Eu anomalies in tourmalines of all generations. The positive Eu anomalies of the type I tourmalines can be explained by the substitution of Eu2+ for Ca2+ on the X-site. Interestingly, the coexisting plagioclases have low Sr concentrations and small negative Eu anomalies. This is possibly a result of the lack of any significant Eu2+ and Sr2+ substitution (for Ca2+) due to their albitic composition.
The low Pb content in type II tourmalines are suggestive of a non-magmatic origin for the hydrothermal fluids responsible for the re-equilibration of the type I tourmalines to type II. However, the origin of the high Pb content in type III tourmaline is not understood. The fluids for the dissolution of the pegmatite tourmaline and coupled reprecipitation of hydrothermal tourmaline may have been derived from the dehydration of the country rock metapelites during early Neoproterozoic high-grade metamorphic events.
Our data suggest that the major- and trace-element chemistry of tourmaline is strongly dictated by the compositions of the melt from which they crystallize or the fluid with which they re-equilibrate. Being late-stage fractionates of granitic magmas, the pegmatitic melts would precipitate tourmalines rich in incompatible elements such as the REEs, Zr, Y, Sr and Pb. In contrast, aqueous hydrothermal fluids derived from the dehydration of metapelites would have much lower solubilities for the high-field-strength elements (HFSEs) such as REEs, Zr and Y and would therefore precipitate trace-element-poor tourmalines. The trace elements such as Sr, Sc, Sn, Zn and REEs show discrete clusters for types I, II and III tourmalines when plotted against Fe, Mg and Ca (Fig. 12). The correlated variation of these major and trace elements within the different tourmaline types indicates the operation of coupled substitutions involving the major and trace elements. The trace-element concentrations of tourmaline are therefore controlled not only by the fluid chemistry but also by coupled substitutions with the major elements of comparable ionic charge and radius (Fig. 12). Zinc and Sn are positively correlated with Fe but negatively correlated with Mg and Ca, indicating that they may be substituting for Fe. The REE and Sc show positive correlation with Ca and Mg, but are negatively correlated with Fe. Marks et al. (Reference Marks, Marschall, Schühle, Guth, Wenzel, Jacob and Markl2013) also observed a positive correlation between Ca and REEs, which can be explained by the substitution of REEs in place of Ca in the X-site. Calcium in the X-site of tourmaline (nine-fold coordination) has an effective ionic radius of 1.18 Å (Shannon, Reference Shannon1976), similar to those of the LREEs in nine-fold coordination (1.21−1.13 Å). The LREEs may therefore be incorporated into the tourmaline X-site by replacing Ca2+. In contrast, the HREEs may be less preferred due to their lower ionic radii (1.07−1.03 Å). Sr may be substituting for Ca and Mg, as seen from its positive correlation with the two elements. The discrete clustering of trace and major elements in bivariate plots for the pegmatitic and hydrothermal tourmalines suggests that tourmaline is a good indicator of the major- and trace-element characteristics of pegmatitic and hydrothermal environment.

Figure 12. The variation in selected trace elements in different generations of tourmaline with Fe, Mg and Ca.
8.b. Timing of tourmaline growth and re-equilibration
The oldest population of monazites of age 1290−1242 Ma included in type I tourmaline is assigned to the crystallization of monazites in the mica pegmatite. It also represents the upper age limit of the mica pegmatites and therefore of type I tourmaline. The emplacement of the mica pegmatites appears to be synchronous with a major late Mesoproterozoic thermal event affecting the Chottanagpur Gneissic Complex. Chatterjee et al. (Reference Chatterjee, Banerjee, Bhattacharya and Maji2010) obtained monazite ages of c. 1272−1241 Ma from the eastern margin of the Chottanagpur Gneissic Complex near Dumka, which the authors interpreted as dating a thermal overprint on the garnet-sillimanite metapelites. A similar Rb–Sr age of 1238±33 Ma was reported for the emplacement of granite plutons in this region by Mallik (Reference Mallik1993). The broad contemporaneity in the timing of granite magmatism and pegmatite crystallization suggests that the latter could have been the fractional crystallization product of granitic magmas.
The intermediate age of c. 1100 Ma was measured from monazites included within type II tourmalines. These monazites must have crystallized synchronously with the formation of type II tourmalines, as is evidenced by: (1) the occurrence of these monazites along fractures within older tourmalines; and (2) the lack of this age domain in monazites included in type I tourmalines. The c. 1100 Ma ages can be interpreted as dating the re-equilibration of monazite during a late Mesoproterozoic hydrothermal event, which also resulted in the pseudomorphic replacement of type I tourmaline by type II. The c. 950 Ma monazites are restricted to fractures within the tourmaline grains or within the rock matrix. They are not found in type I and II tourmalines, which suggests that the 950 Ma monazites may have been contemporaneous with the last generation of tourmaline (type III). The c. 950 Ma ages correspond to the high-grade Grenville-age metamorphism at 995−950 Ma, pervasive throughout the Chottanagpur Gneiss Complex (Chatterjee & Ghose, Reference Chatterjee and Ghose2011). This early Neoproterozoic overprint must have completely re-equilibrated older monazites accompanied by the formation of type III tourmalines by coupled dissolution–reprecipitation processes. The three age populations from monazites in the three generations of the tourmalines therefore date the three geological events that affected the Bihar Mica Belt rocks.
9. Summary and conclusions
Mica pegmatites from the Bihar Mica Belt contain three distinct generations of tourmaline. The earliest generation of tourmalines crystallized from pegmatitic melts at 1290−1242 Ma. These pegmatitic tourmalines were pseudomorphically replaced by two generations of hydrothermal tourmalines at c. 1100 Ma and c. 950 Ma. The major-element chemistry as well as substitution schemes and trajectories within each group are different, which indicates that the three types of tourmalines are not a part of one evolutionary series. Rather, the differences in their chemistries as well their mutual microtextural relations can be best explained by growth of tourmaline from pegmatitic melts followed by episodic re-equilibration during two discrete geological events. Our study demonstrates that the major- and trace-element composition of tourmaline is a good indicator of tourmaline growth from distinct melts and fluids. It also shows that the trace-element concentrations of tourmaline are controlled not only by the fluid chemistry, but also by coupled substitutions with the major elements having comparable ionic radius and charge. A combination of both major- and trace-element data provides a firm understanding of the hydrothermal processes and precipitating fluid.
Acknowledgements
PH thanks the Council of Scientific and Industrial Research, India for the financial assistance in the form of a research fellowship. SEM-BSE images and EPMA data were generated by equipment procured through DST funding (IR/S4/ESF-08/2005) to the Department of Geology and Geophysics, IIT, Kharagpur. The LA-ICP-MS equipment was procured through DST-FIST funding to the Department of Geology and Geophysics, IIT, Kharagpur and is duly acknowledged. Editorial suggestions by Phil Leat and many constructive comments by two anonymous reviewers helped to improve the manuscript.
Declaration of interest
None
Supplementary material
To view supplementary material for this article, please visit http://dx.doi.org/10.1017/S0016756815000916.


