1. Introduction
The break-up of the Rodinia supercontinent is known to have led to some fragments accreting to form Gondwana during late Precambrian and early Palaeozoic time. However, the palaeo-position of the Cathaysia Block within the Gondwana supercontinent, or whether it even belonged to Gondwana, remains a matter of debate (Cawood et al. Reference Cawood, Johnson and Nemchin2007, Reference Cawood, Wang, Xu and Zhao2013; Li et al. Reference Li, Li, Wartho, Clark, Li, Zhang and Bao2010, Reference Li, Li and Li2014; Duan et al. Reference Duan, Meng, Zhang and Liu2011; Yao et al. Reference Yao, Shu and Santosh2011, Reference Yao, Li, Li, Li and Yang2014; Wang et al. Reference Wang, Wang, Zhou and Shu2013; Xu et al. Reference Xu, Cawood, Du, Hu, Yu, Zhu and Li2013, Reference Xu, Cawood and Du2016). Diverse configuration relationships over the past decades have been proposed for the location of the Cathaysia Block during the assembly of Gondwana (Yu et al. Reference Yu, O’Reilly, Wang, Griffin, Zhang, Wang, Jiang and Shu2008, Reference Yu, O’Reilly, Zhou, Griffin and Wang2012; Wang et al. Reference Wang, Zhang, Fan, Zhang, Chen, Cawood and Zhang2010; Duan et al. Reference Duan, Meng, Zhang and Liu2011; Yao et al. Reference Yao, Shu and Santosh2011, Reference Yao, Li, Li, Li and Yang2014; Cawood et al. Reference Cawood, Wang, Xu and Zhao2013; Li et al. Reference Li, Li and Li2014; Xu et al. Reference Xu, Cawood, Du, Huang and Wang2014 a). Palaeomagnetic records show that the South China Block (SCB) should have been near western/northwestern Australia and the India–Himalaya region of the Gondwana margin (Metcalfe, Reference Metcalfe1996; Yang et al. Reference Yang, Sun, Yang and Pei2004; Zhang et al. Reference Zhang, Li, Jiang, Evans, Dong, Wu, Yang, Liu and Xiao2015). Stratigraphic correlations indicate that the SCB was most likely linked to northwestern India during the late Neoproterozoic Era, and then separated from India and moved to northwestern Australia during the early Cambrian Period (Yu et al. Reference Yu, O’Reilly, Zhou, Griffin and Wang2012; Jiang et al. Reference Jiang, Sinclair, Niu and Yu2013). By comparing the polar position derived from the early Palaeozoic sedimentary rocks to previously documented poles of the Yangtze Block (Huang et al. Reference Huang, Opdyke and Zhu2000), Yang et al. (Reference Yang, Sun, Yang and Pei2004) proposed that the SCB should have been near Western Australia. However, Li et al. (Reference Li, Evans and Zhang2004) argued that the SCB was a discrete continental block in the palaeo-Pacific and separated from Laurentia during early Cambrian time, suggesting the SCB was not part of early Palaeozoic Gondwana. At present, most researchers are focusing their studies on the igneous rocks and magmatic events of the SCB, whereas studies of the late Neoproterozoic – Palaeozoic sedimentary rocks are comparatively less common because of extensive Phanerozoic reworking. The composition of the sedimentary rocks records important information to determine their source regions, tectonic settings and affinity with other blocks, providing additional information to understand the tectonic evolution of the Cathaysia Block and its palaeo-position within the supercontinents.
Zircon is the most effective accessory mineral for geochronology because it is common in rocks and is resistant to physical and chemical alteration (Fedo et al. Reference Fedo, Sircombe and Rainbird2003). The geochemical composition of sedimentary rocks can be a suitable indicator of the characteristics of the source rocks and tectonic settings (e.g. Nesbitt & Young, Reference Nesbitt and Young1982; Bhatia, Reference Bhatia1983; Bhatia & Crook, Reference Bhatia and Crook1986; Fedo et al. Reference Fedo, Nesbitt and Young1995). Systematic dating of detrital zircons and geochemical analysis can therefore show the tectonic histories of the Cathaysia Block and its palaeo-position within the supercontinents (Shu et al. Reference Shu, Faure, Yu and Jahn2011, Reference Shu, Jahn, Charvet, Santosh, Wang, Xu and Jiang2014; Yu et al. Reference Yu, O’Reilly, Zhou, Griffin and Wang2012; Cawood et al. Reference Cawood, Wang, Xu and Zhao2013; Xu et al. Reference Xu, Cawood, Du, Huang and Wang2014 a). Together with the abundant updated detrital zircon datasets that have been reported in relevant blocks, we present new U–Pb–Hf isotopes of detrital zircons and whole-rock geochemical data from late Neoproterozoic – early Cambrian sedimentary rocks in the western Cathaysia Block. We compare these data with those of age-equivalent sedimentary rocks in relevant regions including Qiangtang, northern India, Lhasa Terrane and Western Australia to evaluate the source-area characteristics and to determine the provenance and tectonic settings of the sedimentary rocks; based on these data, we offer new constraints on the palaeo-position of the Cathaysia Block within the Gondwana supercontinent.
2. Geological setting
The North and South China blocks are the two largest Precambrian domains in eastern continental China. The SCB consists of the Cathaysia Block to the SE and the Yangtze Block to the NW (Fig. 1a) separated by the Jiang–Shao Fault (JSF) in the east; its western extension is however unclear because of younger tectonic modifications (Fig. 1b; Guo et al. Reference Guo, Shi, Ma, Lu and Ye1985; Zhao & Cawood, Reference Zhao and Cawood2012). The two blocks have different Precambrian crustal evolution histories with contrasting crystalline basement rocks. The Yangtze Block is mainly composed of a small amount of Archean–Palaeoproterozoic crystalline basement, surrounded by Neoproterozoic orogens. Archean basement rocks have only been reported in the northern part of the Yangtze Block, represented by the Yudongzi Group, Kongling Complex and Huangtuling granulites, while Palaeoproterozoic basements rocks are sparsely exposed along its western margin (Fig. 1b; Zhou et al. Reference Zhou, Yan, Kennedy, Li and Ding2002; Zhao & Cawood, Reference Zhao and Cawood2012; Xia et al. Reference Xia, Xu, Zhao and Liu2015). The Kongling Complex is the oldest basement of the SCB, predominantly consisting of Archean tonalite–trondhjemite–granodiorite (TTG) gneisses with varying ages of 2.7–3.3 Ga (Gao et al. Reference Gao, Yang, Zhou, Li, Hu, Guo, Yuan, Gong, Xiao and Wei2011). The Precambrian basement rocks in the Cathaysia Block are only reported from Chencai, Badu, Wuyishan, Nanling and Yunkai along a NE–SW belt bounded by the JSF to the NW and the Zhenghe-Dapu Fault to the SE (Fig. 1b; Zhao & Cawood, Reference Zhao and Cawood2012). The oldest known crystalline rocks in it are 1.77–1.89 Ga granites and amphibolites from NE Cathaysia (Yu et al. Reference Yu, Wang, O’Reilly, Griffin, Zhang, Li and Shu2009; Xia et al. Reference Xia, Xu and Zhu2012).
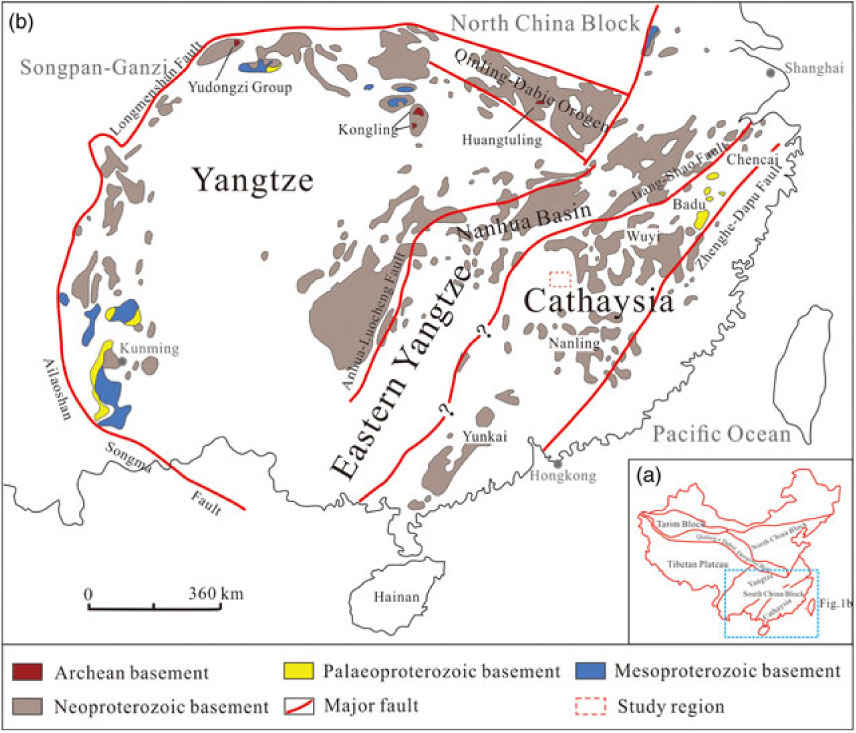
Fig. 1. (a) Tectonic outline of China and (b) geological map of South China Block showing the distribution of Precambrian rocks in the Yangtze and Cathaysia blocks and the study region (modified after Zhao & Cawood, Reference Zhao and Cawood2012).
The SCB initially formed via the collision between the Cathaysia and Yangtze blocks during Neoproterozoic time, resulting in the Jiangnan Orogen (also termed the ‘Sibao’ Orogen) along the southeastern margin of the Yangtze Block (Guo et al. Reference Guo, Shi, Ma, Lu and Ye1985). However, the timing of this collision remains under debate, varying over the late Mesoproterozoic – Neoproterozoic eras (Cawood et al. Reference Cawood, Wang, Xu and Zhao2013; Wang et al. Reference Wang, Wang, Zhou and Shu2013; Xia et al. Reference Xia, Xu, Niu and Liu2018). Following the amalgamation of the Cathaysia and Yangtze blocks to form a coherent cratonic block, the SCB underwent initial fragmentation during 830–720 Ma and then widespread rifting (Wang et al. Reference Wang, Li, Li, Li, Tang, Gao, Zhang and Liu2012). The rift system mainly occurred within the central and western part of the craton, generating widespread bimodal igneous rocks and associated sedimentary successions (Yu et al. Reference Yu, O’Reilly, Wang, Griffin, Zhou, Zhang and Shu2010; Xia et al. Reference Xia, Xu, Niu and Liu2018). The Nanhua Rifting, the major Neoproterozoic rift system in the SCB (Fig. 1b), ended during late Neoproterozoic time, with failed rift basins continuing to receive uppermost Neoproterozoic – lower Palaeozoic sediments (Yu et al. Reference Yu, Wang, O’Reilly, Griffin, Zhang, Li and Shu2009).
The sedimentary patterns between the Cathaysia and Yangtze blocks are quite different during late Neoproterozoic and early Palaeozoic time. The central Yangtze Block is dominated by clastic rocks intercalated with carbonate (limestone and dolomite), siliciclastic and bimodal volcanic rocks and tillites in the Neoproterozoic units, and shale-silicalite and carbonate rocks in the Cambrian strata. In contrast, the Cathaysia Block received massive siliciclastic sedimentation. The Neoproterozoic units are dominated by an association of mudstone, siltstone and (meta)sandstone intercalated with lenticular limestone, and the Cambrian units are dominated by mudstone and feldspathic sandstone intercalated with bioclastic limestone (BGMRJX, 1984; BGMRGX, 1985; BGMRHN, 1988; BGMRGZ, 1988; Liu & Xu, Reference Liu and Xu1994; Chen et al. Reference Chen, Hou, Xu and Tian2006; Wang et al. Reference Wang, Zhang, Fan, Zhang, Chen, Cawood and Zhang2010). There is therefore a transition from a siliciclastic succession in the Cathaysia Block to a mixed siliciclastic and carbonate succession in the SE Yangtze Block across the SCB (Wang et al. Reference Wang, Zhang, Fan, Zhang, Chen, Cawood and Zhang2010; Yao et al. Reference Yao, Li, Li, Li and Yang2014, Reference Yao, Li and Li2015). During middle Palaeozoic time, a tectono-thermal event termed the Kwangsian Orogeny occurred in the Cathaysia Block, resulting in high-temperature metamorphism, strong deformation (440–400 Ma) with widespread granitic intrusions, and a regional-scale unconformity between the pre-Devonian and Devonian strata (Shu et al. Reference Shu, Yu, Jia, Wang, Shen and Zhang2008; Wang et al. Reference Wang, Zhang, Fan, Zhao, Zhang, Zhang, Zhang and Li2011; Xu et al. Reference Xu, Cawood, Du, Huang and Wang2014 a).
3. Sampling and methodology
A total of 13 sandstones including 10 from the early Cambrian strata and three from the late Neoproterozoic strata in the Jinggangshan area underwent whole-rock geochemical analysis (Fig. 2; online Supplementary Table S1, available at http://journals.cambridge.org/geo). Of these, two samples were chosen for U–Pb geochronological and Hf isotopic analysis. Sample P40-01 is a grey fine-grained early Cambrian sandstone (Fig. 3a). Sample P43-01 is a greyish-brown, fine-grained late Neoproterozoic sandstone (Fig. 3c). Eleven thin-sections show that the clasts are angular to subangular, moderately to poorly sorted, and are immature in both composition and texture. The clastic mineralogy for sample P40-01 is dominated by quartz (89%) with minor feldspar (2%), lithic fragments (2%), mica (1%) and matrix (3%). The cements (3%), primarily silicate materials and calcite, are evenly distributed at grain contacts and between grain interstices (Fig. 3b). Sample P43-01 is composed of quartz (92%), feldspar (3%), lithic fragments (2%), matrix (3%) and silicate cements (2%) (Fig. 3d).
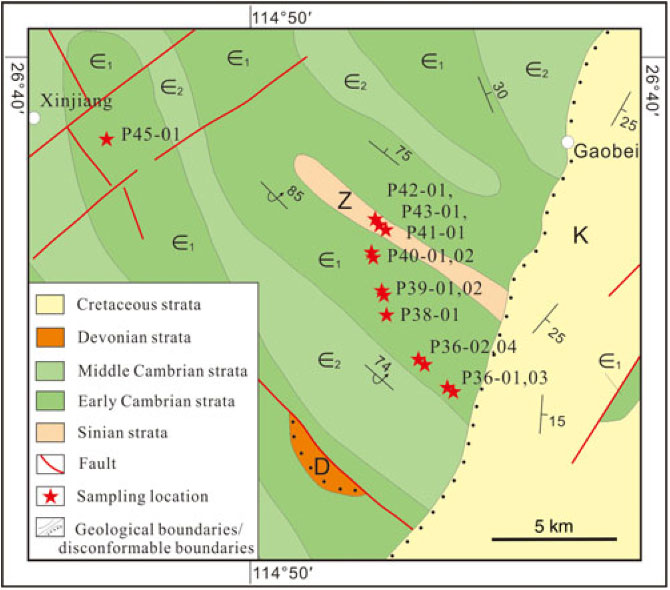
Fig. 2. Regional geological map and sampling localities in the Jinggangshan area of the Cathaysia Block (modified after BGMRJX, 1984)
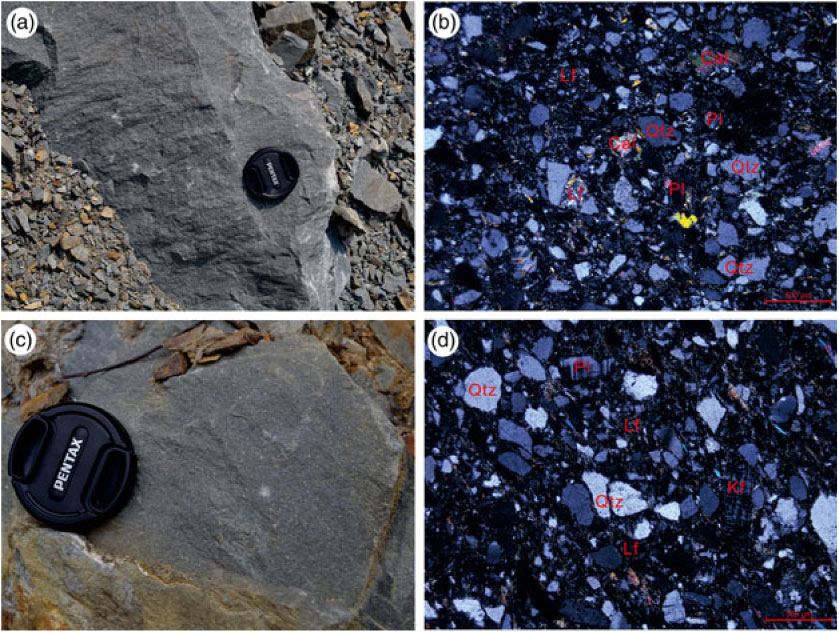
Fig. 3. Representative field photographs and photomicrographs: (a, b) early Cambrian fine-grained sandstone (sample P40-01); (c, d) late Neoproterozoic fine-grained sandstone (sample P43-01). Cal – calcite; Lf – lithic fragment; Kf – K-feldspar; Pl – plagioclase; Qtz – quartz.
All the veins and weathering products were removed from the selected samples before cleaning and crushing into 200 mesh for geochemical analysis. Major and trace elements were respectively measured using X-ray fluorescence (XRF) and inductively coupled plasma – mass spectrometer (ICP-MS) at the Key Laboratory of Nuclear Techniques in Geosciences of Sichuan Province, Chengdu. The analytical precision was better than 5% for the major elements and 10% for all the trace elements, based on analysis of United States Geological Survey rock standards BIR-1, BCR-2 and BHVO-2.
Approximately 5 kg of representative material from each of the two samples were selected for zircon separation. Zircons were extracted using standard density and magnetic methods, and then handpicked under a binocular microscope. Representative zircons were mounted in epoxy resin and then polished and coated with gold. Transmitted, reflected and cathodoluminescence (CL) imaging was undertaken using an analytical scanning electron microscope (JSM IT100) connected to a Gatan MiniCL system. Zircon U–Pb isotopes were determined via laser ablation (LA-) ICP-MS at the Wuhan SampleSolution Analytical Technology Co. Ltd using an Agilent 7700e ICP-MS instrument equipped with a 193 nm COMPexPro 102 ArF excimer laser and a MicroLas optical system. The spot size and laser repetition rate were set to 32 µm and 5 Hz, respectively. Detailed instrumental conditions and analytical procedures are described in Zong et al. (Reference Zong, Klemd, Yuan, He, Guo, Shi, Liu, Hu and Zhang2017) and Xiong et al. (Reference Xiong, Chen, Niu, Chen, Zhang, Li, Xu and Yang2018). ICP-MS-DataCal (Liu et al. Reference Liu, Hu, Gao, Gunther, Xu, Gao and Chen2008) with zircon 91500 (recommended 206Pb/238U age of 1062.4 ± 0.8 Ma; Wiedenbeck et al. Reference Wiedenbeck, Alle, Corfu, Griffin, Meier, Oberli, Quadt, Roddick and Spiegel1995) was used as an external standard for off-line data reduction. The analytical results of standard zircons 91500 are presented in online Supplementary Table S2 (available at http://journals.cambridge.org/geo), yielding weighted mean 206Pb/238U ages of 1062.4 ± 2.8 Ma (1σ, mean square weighted deviation or MSWD = 0.016, n = 70). Concordia diagrams and U–Pb ages were obtained using the Isoplot/Ex_ver3 (Ludwig, Reference Ludwig2003) with 1σ errors. Zircon ages of more than 10% discordance were not included in the probability density distribution curves and the final interpretation. The data for concordant zircons including the U–Pb ages, Th/U ratios and trace-element compositions are listed in online Supplementary Tables S3 and S4. The 206Pb/238U ages were used for zircons younger than 1000 Ma, and the 207Pb/206Pb ages were used for zircons older than 1000 Ma (Griffin et al. Reference Griffin, Belousova, Shee, Pearson and O’Reilly2004).
Hf isotopic analysis of the dated zircon grains was conducted using a Neptune Plus multi-collector (MC-) ICP-MS, in combination with a GeoLas 2005 excimer ArF laser ablation system, at the Wuhan SampleSolution Analytical Technology Co. Ltd. The instrumental conditions and detailed analytical procedure followed Hu et al. (Reference Hu, Liu, Gao, Liu, Zhang, Tong, Lin, Zong, Li and Chen2012). Standard zircon 91500 was used as an external standard to control the analytical accuracy. In this analysis, zircon standard 91500 yielded a weighted average 176Hf/177Hf ratio of 0.282308 ± 0.0000037 (2σ, MSWD = 0.13, n = 26; online Supplementary Table S5), consistent with the recommended 176Hf/177Hf ratios of 0.282308 ± 0.000006 (Blichert-Toft, Reference Blichert-Toft2008). The initial 176Hf/177Hf ratio values were calculated based on the decay constant of 176Lu of 1.867×10⁻¹¹ year−1 (Söderlund et al. Reference Söderlund, Patchett, Vervoort and Isachsen2004). The ɛ Hf(t) values were calculated with reference to the chondritic uniform reservoir (CHUR) with present-day 176Hf/177Hf = 0.282772 and 176Lu/177Hf = 0.0332 (Blichert-Toft & Albarede, Reference Blichert-Toft and Albarede1997). The single-stage Hf model ages (TDM) were calculated with reference to depleted mantle with present-day 176Hf/177Hf = 0.28325 and 176Lu/177Hf = 0.0384 (Griffin et al. Reference Griffin, Pearson, Belousova, Jackson, Achterbergh, O’Reilly and Shee2000), which can only provide a minimum age for the source material of the magma from which the zircons crystallized. The two-stage model Hf ages (TDM2) were calculated by projecting the initial 176Hf/177Hf ratios of the zircon back to the depleted mantle model growth curve, which assumes that the parental magma was produced from an average continental crust (176Lu/177Hf = 0.015) that was originally derived from the depleted mantle (Griffin et al. Reference Griffin, Wang and Jackson2002). Thus, two-stage Hf model ages (TDM2) were used in this study. The Lu–Hf isotopic data of the studied samples are provided in online Supplementary Table S6.
4. Analytical results
4.a. Zircon morphology, Th/U ratios and rare Earth elements
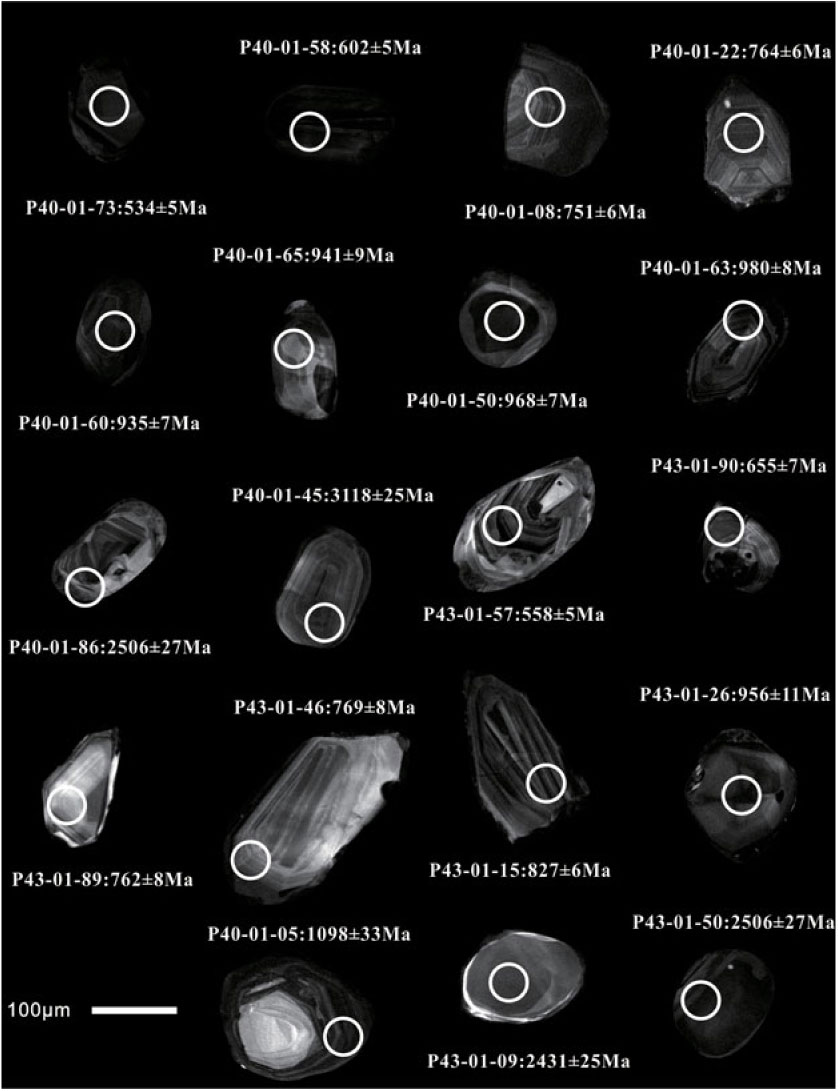
In general, the majority of the zircons are colourless and transparent with a varying diameter of 85–259 μm. CL images show that most of the zircon grains have oscillatory or sector/planar zoning. Some zircon grains are euhedral to subhedral in shape, suggesting a limited transportation distance, while most of the zircon grains are rounded to sub-rounded, suggesting long-distance transport and recycled sedimentary processing (Fig. 4).
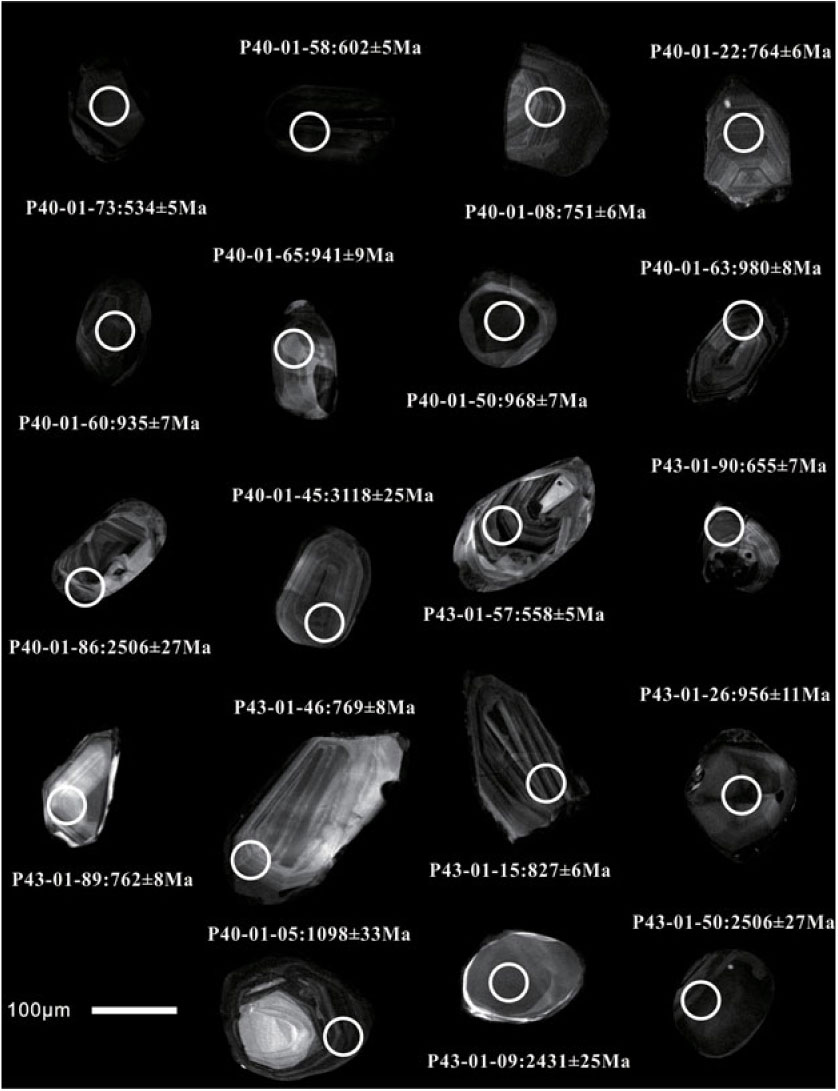
Fig. 4. Representative cathodoluminescence (CL) images of selected detrital zircons with ages and dating spots as indicated.
Previous studies have showed that zircons of igneous and metamorphic origin have different Th/U ratios and trace-element characteristics. Metamorphic zircons are usually found to have a Th/U ratio of < 0.1 and typically negative Eu anomalies, positive Ce anomalies with heavy rare Earth element (HREE) enrichment, that is, high HREE/LREE (light rare Earth element) ratios, whereas magmatic zircons have higher Th/U ratios (mostly 0.2–1.0) and are characterized by a relative depletion of HREEs and flat rare Earth element (REE) patterns without a negative Eu anomaly (Hidaka et al. Reference Hidaka, Shimizu and Adachi2002; Hoskin & Schaltegger, Reference Hoskin and Schaltegger2003). However, there are exceptions to this rule; some magmatic zircons have been reported to have a Th/U ratio of < 0.1 and some metamorphic zircons have a Th/U ratio of > 0.1 (Hidaka et al. Reference Hidaka, Shimizu and Adachi2002). A comprehensive analysis of internal structures and Th/U ratios, together with REEs, is therefore necessary to investigate zircon origins.
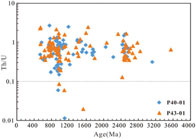
The majority of the zircons in samples P40-01 and P43-01 have a Th/U ratio of > 0.1, of which 159 grains (93%) have a Th/U ratio of > 0.2 (Fig. 5 and online Supplementary Table S2), indicating that zircons in our samples are largely of igneous origin. A few zircons exhibit sector/planar zonation or bright structureless characters with a Th/U ratio of < 0.1 (Fig. 5), which are interpreted to be of metamorphic origin. Figure 6 shows the chondrite-normalized REE patterns of zircons from these two samples. Most of the zircons have variably high total REE contents (171.33–1820 ppm) showing prominent HREE enrichment with positive Ce anomalies and negative Eu anomalies, typical of igneous origin. Only two zircon grains from the samples do not show negative Eu anomalies; these are interpreted as having formed in plagioclase-absent assemblages, including kimberlite, syenite and eclogite (Belousova et al. Reference Belousova, Griffin, O’Reilly and Fisher2002; Rubatto, Reference Rubatto2002; Bingen et al. Reference Bingen, Austrheim, Whitehouse and Davis2004). Four zircons show no positive Ce anomaly but an obvious negative Eu anomaly, suggesting reworking of crustal material, a process that leads to the enrichment of LREEs (Peck et al. Reference Peck, Valley and Wilde2001).

Fig. 5. Age (Ma) versus Th/U ratio of detrital zircons for the late Neoproterozoic – early Cambrian sandstone samples from the Cathaysia Block.
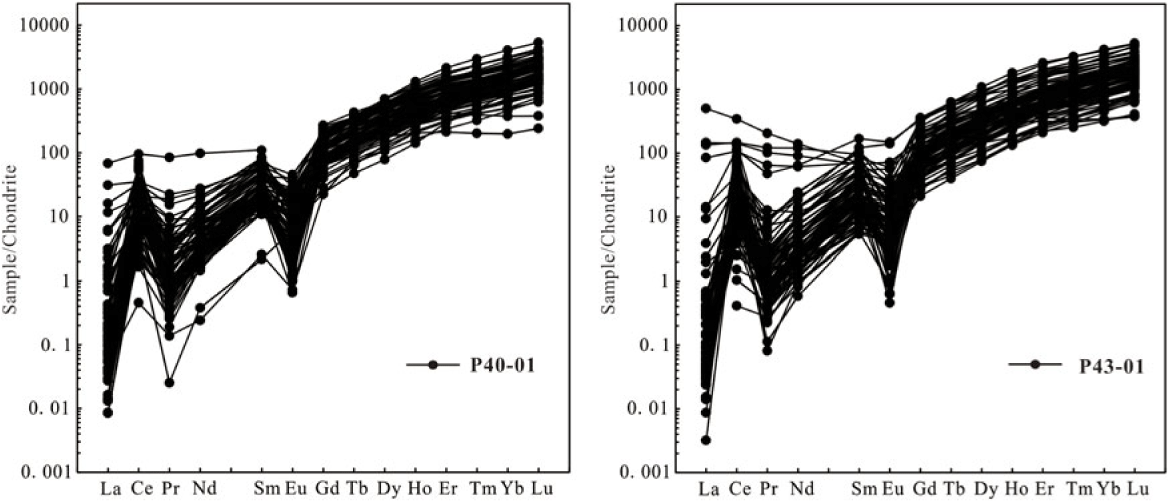
Fig. 6. Chondrite-normalized REE patterns for zircons from sandstone samples (a) P40-01 and (b) P43-01 from the Cathaysia Block. Chondrite REE values used are from Sun & McDonough (Reference Sun, McDonough, Saunders and Norry1989).
4.b. Zircon U–Pb ages
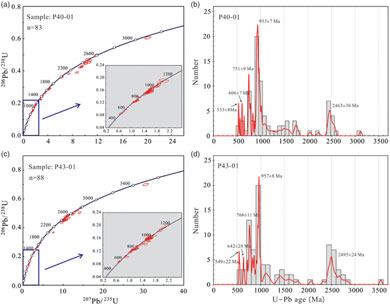
We determined U–Pb ages of 171 detrital zircon grains from the two sandstone samples (P40-01 and P43-01). Zircons from the two samples have similar age spectra and can therefore be discussed together. The zircon ages vary widely from 532 Ma to 3545 Ma, indicating that they either originated from multiple provenances or from a source with a complex prior history. Nearly all the analysed zircons show < 10% discordance on the concordia plots (Fig. 7a,c). For sample P40-01, the zircons show age populations of 2047–2566 Ma with a peak at 2463 ± 30 Ma (MSWD = 2.8, n = 12), 896–1006 Ma with a peak at 933 ± 7 Ma (MSWD = 3.3, n = 20), 737–870 Ma with a peak at 751 ± 9 Ma (MSWD = 2.4, n = 7) and 532–650 Ma with two small peaks at 606 ± 7 Ma (MSWD = 1.0, n = 2) and 533 ± 8 Ma (MSWD = 0.042, n = 2) (Fig. 7b). Sample P43-01 also shows the same four major age clusters of 2329–2843 Ma with a peak at 2495 ± 24 Ma (MSWD = 1.9, n = 13), 890–1002 Ma with a peak at 957 ± 8 Ma (MSWD = 3.3, n = 17), 716–866 Ma with a peak at 766 ± 11 Ma (MSWD = 3.9, n = 10) and 543–655 Ma with two small peaks at 642 ± 28 Ma (MSWD = 2.8, n = 3) and 549 ± 22 Ma (MSWD = 2.5, n = 3) (Fig. 7d). According to the youngest concordant age obtained from the sample, which is identical to the maximum depositional age of the sedimentary rock (Sun et al. Reference Sun, Chen, Zhao, Wilde, Ye, Guo, Chen and Yuan2008), the timing of deposition of P40-01 and P43-01 was later than 532 ± 8 Ma and 543 ± 6 Ma, respectively.
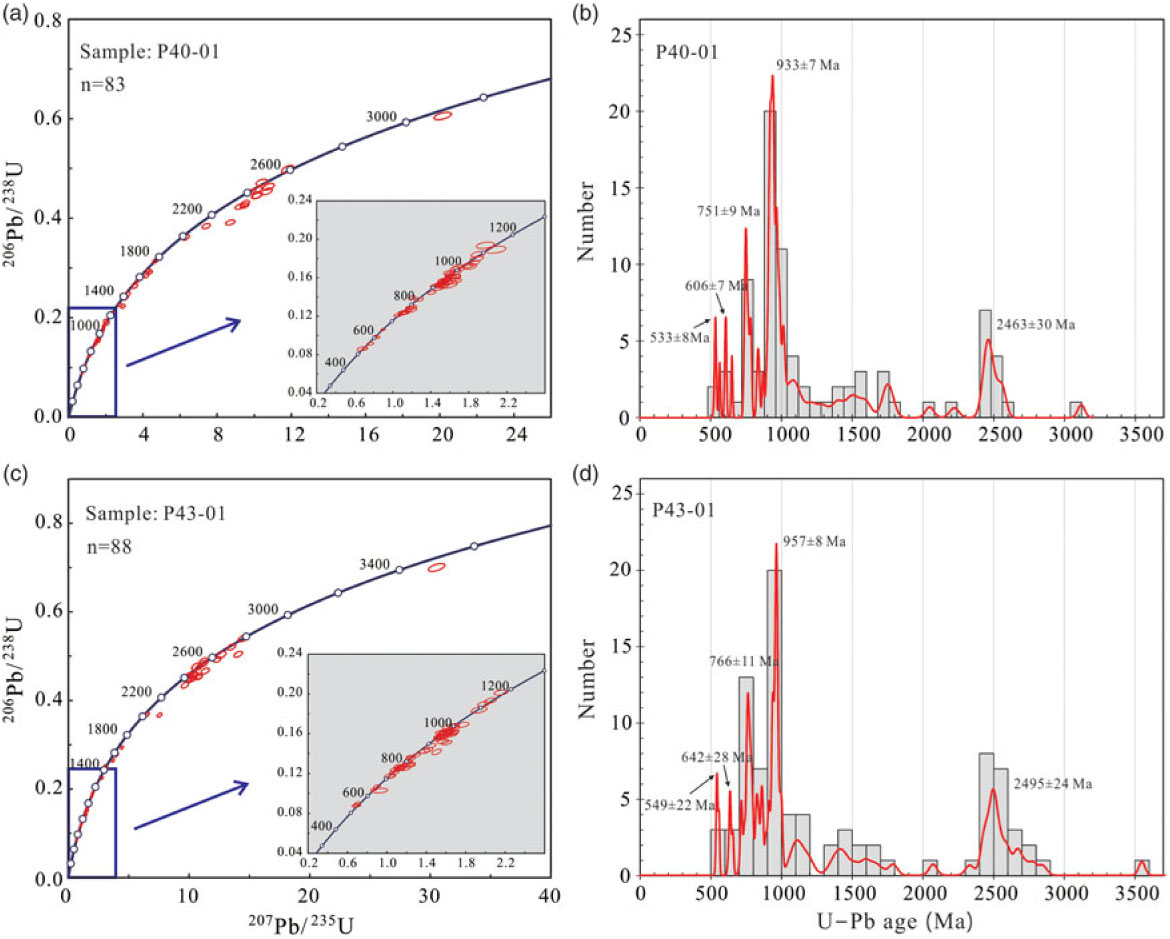
Fig. 7. (a, c) U–Pb Concordia diagrams and (b, d) corresponding frequency distribution of U–Pb ages for detrital zircons from the sandstone samples in the Cathaysia Block.
4.c. Zircon Hf isotopic compositions
Zircon Hf isotopic compositions were analysed for 76 zircon grains which show concordant U–Pb ages from the studied samples. Variations in Hf isotopic ratios ɛ Hf(t) with their U–Pb ages are shown in Figure 8. Overall, the late Neoproterozoic and early Cambrian samples plot in a similar position. Zircons of age c. 2.2–2.6 Ga have ɛ Hf(t) values of −13.7 to +4.1 with model ages (TDM2) of 2.7–3.4 Ga, indicating the addition of juvenile material and the reworking of Eoarchean–Mesoarchean crustal components. Zircons from the prominent population at c. 0.9–1.0 Ga have ɛ Hf(t) values of −11.1 to +10.2 with model ages (TDM2) of 1.18–2.50 Ga, suggesting contributions from both juvenile and reworked crustal materials. Zircons with ages of 0.72–0.86 Ga are characterized by negative ɛ Hf(t) values that vary from −27.9 to −1.7 with model ages (TDM2) of 1.8–3.4 Ga. The wide range of negative ɛ Hf(t) values indicates that these zircons mainly crystallized from reworked Palaeoarchean – early Palaeoproterozoic crust. Zircons from the subordinate population of age c. 0.53–0.65 Ga yielded a range of ɛ Hf(t) values from −19.4 to +5.0 with model ages (TDM2) of 1.26–1.40 Ga and 1.8–2.7 Ga, indicating remelting of middle Mesoproterozoic juvenile crust and reworking of Neoarchean – early Palaeoproterozoic crustal components.
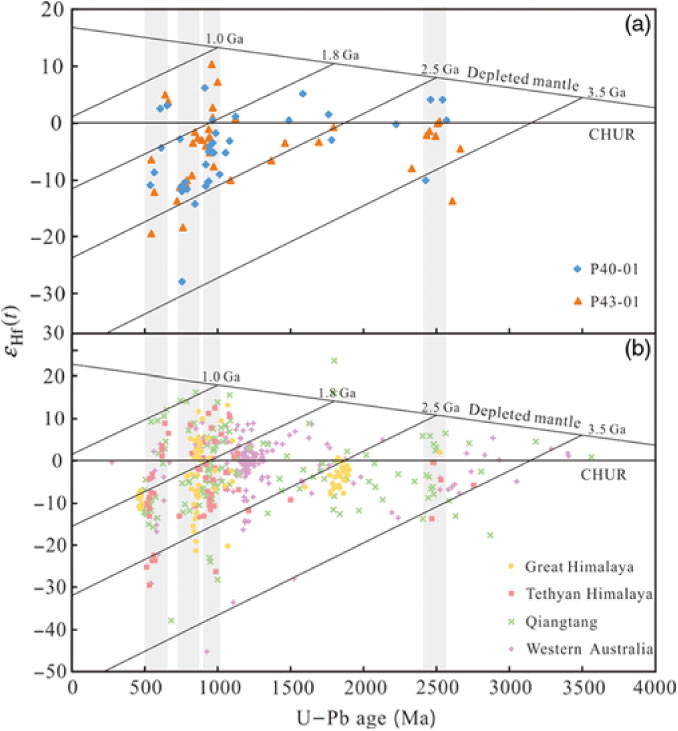
Fig. 8. ɛ Hf(t) versus U–Pb ages of the detrital zircons from the studied sandstone samples in the Cathaysia Block. CHUR – chondritic uniform reservoir. The declining parallel lines are two-stage Hf model ages (TDM2). The detrital zircon data from the Greater Himalaya (Spencer et al. Reference Spencer, Harris and Dorais2012), Tethyan Himalaya (Zhu et al. Reference Zhu, Zhao, Niu, Dilek and Mo2011), Qiangtang (Dong et al. Reference Dong, Li, Wan, Wang, Wu, Xie and Liu2011; Zhu et al. Reference Zhu, Zhao, Niu, Dilek and Mo2011) and Western Australia (Veevers et al. Reference Veevers, Saeed, Belousova and Griffin2005) are shown for comparison.
4.d. Whole-rock geochemistry
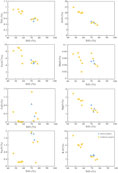
The major- and trace-element analyses are provided in online Supplementary Table S1 (available at http://journals.cambridge.org/geo). In terms of major elemental compositions, the studied samples of late Neoproterozoic and early Cambrian age are on the whole characterized by intermediate to high SiO2 (47.2–78.0 wt%), and relatively high Al2O3 (9.1–24.8 wt%) and Fe2O3 T+MgO (5.6–11.8 wt%, average 8.2 wt%) (where Fe2O3 T represents total FeO content). They all have low CaO content (typically < 1 wt%). In addition, there are obvious negative correlations of SiO2 with TiO2 (r = −0.88), Al2O3 (r = −0.98), Fe2O3 T (r = −0.70), MgO (r = −0.91) and K2O (r = −0.94), as shown in Figure 9.
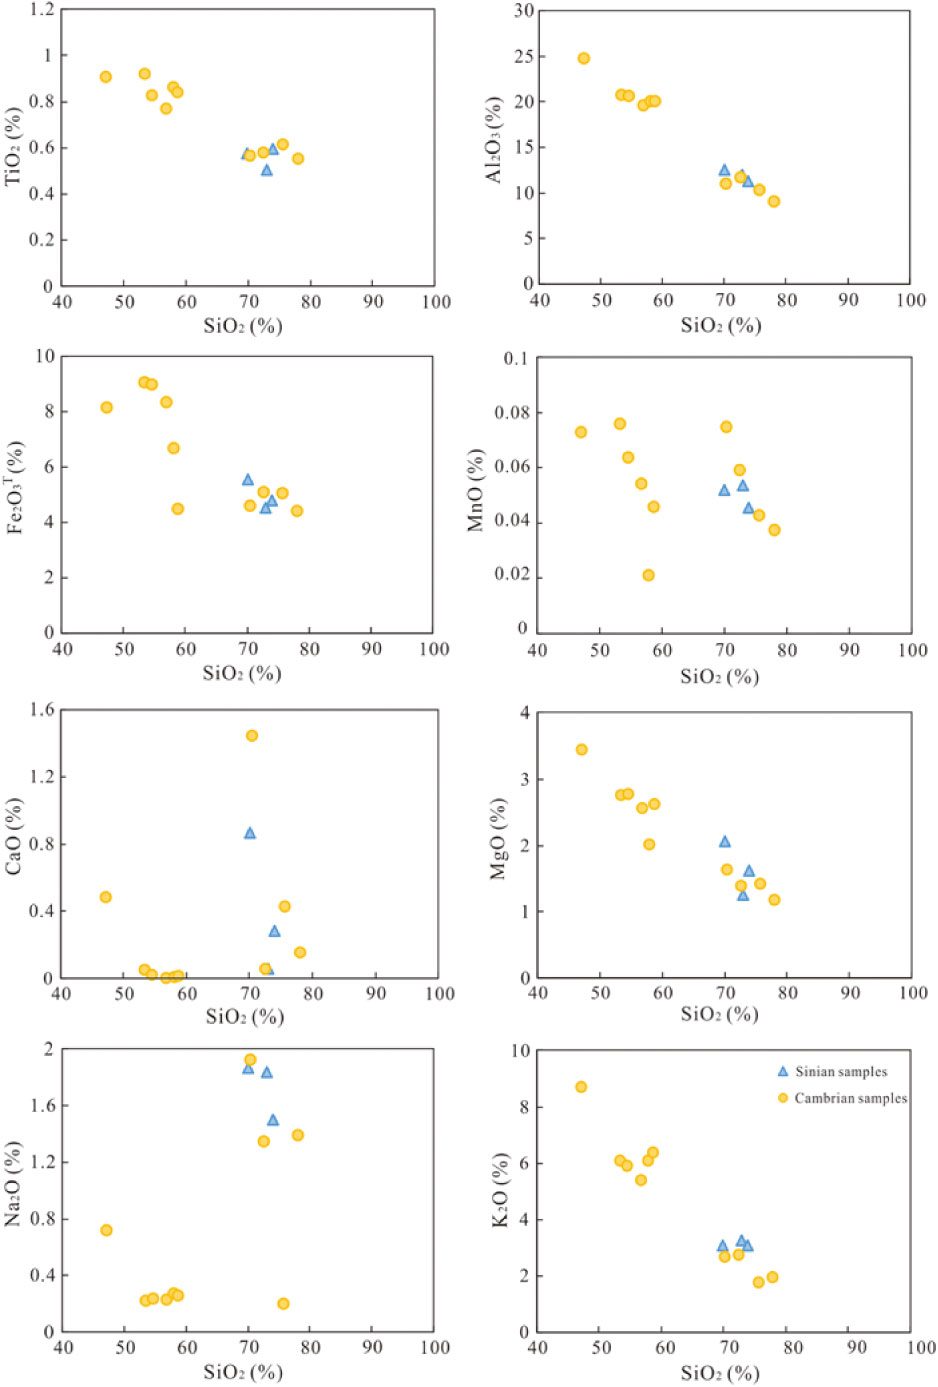
Fig. 9. Variation diagrams of major elements versus SiO2 (%) for the studied sedimentary rocks from late Neoproterozoic and early Cambrian time. Note the negative correlations for SiO2 versus TiO2, Al2O3, Fe2O3 T, MgO and K2O.
The trace-element concentrations are also highly variable with large-ion lithophile elements (LILEs) such as Rb, Ba, Th and U having relatively higher content than the value of the post-Archean Australian shale (PAAS; Taylor & McLennan, Reference Taylor and McLennan1985). The high-field-strength elements (HFSEs) such as Zr, Hf and Y are also enriched in these samples, but variably depleted in Nb and Ta relative to the PAAS. In addition, all the samples show similar chondrite-normalized REE patterns with a significant LREE enrichment and relatively flat HREE distribution (Fig. 10), with varying La/SmN (3.01–5.22), Gd/YbN (1.28–2.10) and La/YbN (7.35–14.43) ratios and distinctive negative Eu anomalies (Eu/Eu* = 0.45–0.65). Although the absolute concentrations of REEs vary, the overall chondrite-normalized patterns of the samples resemble those of the average PAAS (McLennan, Reference McLennan1989) and upper continental crust (Rudnick & Gao, Reference Rudnick and Gao2003), suggesting that the sedimentary rocks were derived from an upper crustal source.
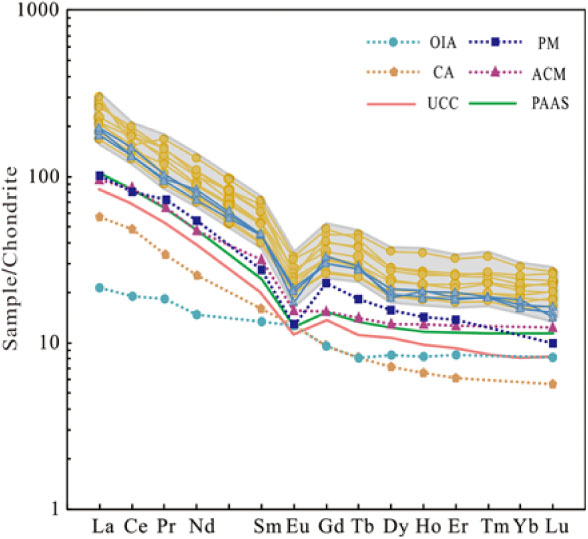
Fig. 10. Chondrite normalized rare Earth element patterns for the late Neoproterozoic – early Cambrian sedimentary rocks in the Cathaysia Block, normalized to chondritic values from Sun & McDonough (Reference Sun, McDonough, Saunders and Norry1989). The standard composition of average post-Archean Australian shale (PAAS) after McLennan (Reference McLennan1989) and upper continental crust (UCC) after Rudnick & Gao (Reference Rudnick and Gao2003) are shown for comparison; various tectonic conditions data after Bhatia (Reference Bhatia and Crook1986). OIC – oceanic island arc; CA – continental arc; ACM – active continental margin; PM – passive margin. Symbols as for Figure 9.
5. Discussion
5.a. Source-rock geochemical constraints
5.a.1. Source area weathering
Palaeoweathering in the source area is among the most important processes affecting the chemical compositions of sedimentary rocks (Nesbitt & Young, Reference Nesbitt and Young1982; McLennan et al. Reference McLennan, Hemming, McDaniel and Hannson1993; Fedo et al. Reference Fedo, Nesbitt and Young1995). The chemical index of alteration (CIA) is a frequently used parameter to quantify the degree of source area weathering (CIA = [Al2O3/(Al2O3 + CaO* + Na2O + K2O)] × 100; Nesbitt & Young, Reference Nesbitt and Young1982; McLennan et al. Reference McLennan, Hemming, McDaniel and Hannson1993). The pre-metasomatized CIA values of the sandstones in our study range from 56 to 84 (Fig. 11), indicating moderate weathering conditions in the source area. By employing the CIA values in the Al2O3 – CaO+Na2O – K2O (A-CN-K) ternary diagram, one can more effectively evaluate the weathering degree (Nesbitt & Young, Reference Nesbitt and Young1982; Fedo et al. Reference Fedo, Nesbitt and Young1995). In the absence of post-depositional K metasomatism, the ideal weathering path would be a linear trend parallel to the A-CN side (Fig. 11). In contrast, the sandstones that have undergone K-metasomatism would deviate towards the A-K boundary and have smaller CIA values (Rainbird et al. Reference Rainbird, Nesbitt and Donaldson1990; Fedo et al. Reference Fedo, Nesbitt and Young1995). The majority of the studied samples are nearly parallel to the predicted weathering trend, illustrating the limited influence of K-metasomatism on these samples. Several samples plot to the A-K boundary and exhibit CIA values lower than the pre-metasomatized trend, indicating moderate post-depositional K-metasomatism (Fig. 11).
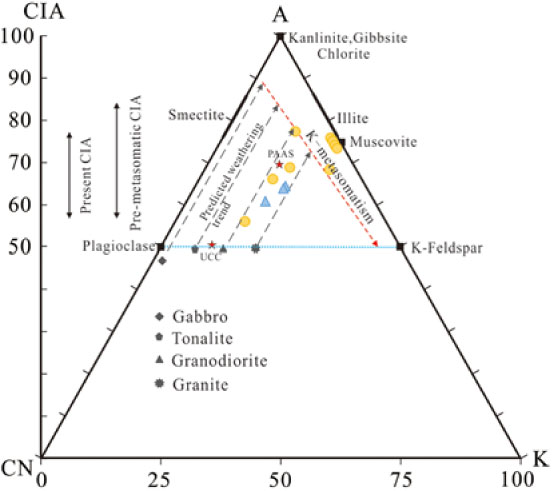
Fig. 11. A-CN-K ternary diagram (in molecular proportions) (after Nesbitt & Young, Reference Nesbitt and Young1982; Fedo et al. Reference Fedo, Nesbitt and Young1995). Average gabbro, tonalite, granodiorite, granite, UCC and PAAS data are from Condie (Reference Condie1993). Arrows represent the separately predicted weathering trends of gabbro, tonalite, granodiorite and granite. Symbols as for Figure 9.
The plagioclase index of alteration (PIA) is another parameter to quantify the degree of chemical weathering that can eliminate the influence of K-metasomatism (PIA = [(Al2O3 – K2O)/(Al2O3 + CaO* + Na2O – K2O)] × 100; Fedo et al. Reference Fedo, Nesbitt and Young1995). The PIA values (49–96, average 76) of the studied samples are relatively higher than CIA values, confirming a moderate degree of weathering. Sedimentary recycling under oxidizing conditions usually results in fractionation of Th and U because of the oxidation and loss of uranium during weathering (McLennan & Taylor, Reference McLennan and Taylor1980). Thus, the Th/U ratios of sedimentary rocks increase during successive cycles of weathering and redeposition (Taylor & McLennan, Reference Taylor and McLennan1985). The Th/U ratios in our study (4.01–7.07, average 5.6) are typically higher than the average value for the upper crust (3.8; McLennan & Taylor, Reference McLennan and Taylor1980), providing additional support for a moderate weathering history in the source area.
5.a.2. Source-rock composition
The geochemical characteristics of the sedimentary rocks can also provide useful information to elucidate the sedimentary provenance and composition of the crustal source regions (Bhatia, Reference Bhatia1983; Bhatia & Crook, Reference Bhatia and Crook1986; Roser & Korsch, Reference Roser and Korsch1986; Floyd & Leveridge, Reference Floyd and Leveridge1987; Gu et al. Reference Gu, Liu, Zheng, Tang and Qi2002). Before using the immobile elements to identify the possible source rocks, it is necessary to evaluate their relative mobility during erosion, transportation and sedimentation (Singh, Reference Singh2009). Immobile elements hosted in common minerals will have similar hydrodynamic behaviours and show a linear array of coordinates pointing to the origin, whereas chemically mobile elements will show a large deviation (Fralick & Kronberg, Reference Fralick and Kronberg1997). Most of the samples show general positive correlations in the plots of Fe2O3 T versus Al2O3, TiO2 versus Al2O3 and TiO2 versus Fe2O3 T (Fig. 12), indicating that the aforementioned elements have remained chemically immobile and have been affected by sorting in a similar manner (Fralick & Kronberg, Reference Fralick and Kronberg1997; Singh, Reference Singh2009; Wang et al. Reference Wang, Zeng, Zhou, Zhao, Zheng and Lan2018). The linear arrangement of TiO2, Al2O3 and Fe2O3 T extend towards 100% SiO2, also suggesting they are chemically immobile and enriched in the fine fractions (Fig. 9; Fralick & Kronberg, Reference Fralick and Kronberg1997). The aforementioned immobile element ratios should therefore represent the average ratio of their source rocks. In the plots of Fe2O3 T/Al2O3 and TiO2/Fe2O3 T versus TiO2/Al2O3 (Fig. 13) the samples cluster between the average composition of felsic volcanic rock, TTG, andesite and granite but far from the basaltic compositions, suggesting that the source was mainly composed of felsic to intermediate components. In addition, constraint for the initial composition of the source rocks can also be obtained from the A-CN-K diagram (Nesbitt & Young, Reference Nesbitt and Young1982; Fedo et al. Reference Fedo, Nesbitt and Young1995). All the studied samples plotted in the area between the weathering trends of granodiorite and granite (Fig. 11), further indicating that the source rocks were possibly a mixture of intermediate to felsic igneous rocks.
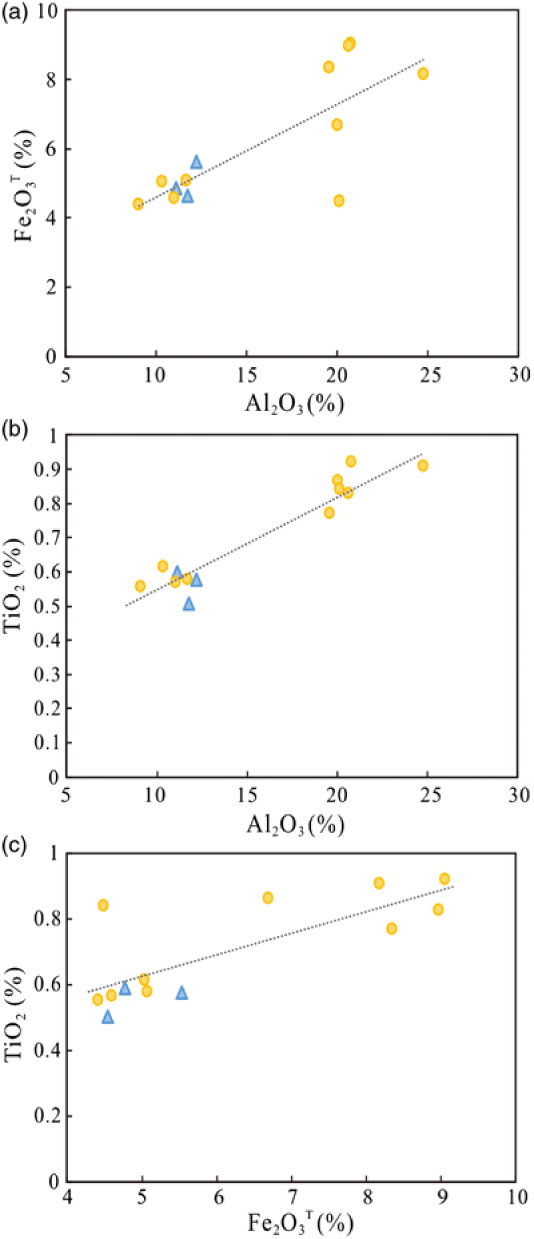
Fig. 12. (a–c) Plots of sedimentary rocks in the bivariant diagrams between different elements. Positive correlations in these binary diagrams demonstrate that the elements Fe, Ti and Al were chemically immobile and have similar geochemical behaviour during sedimentation. Symbols as for Figure 9.
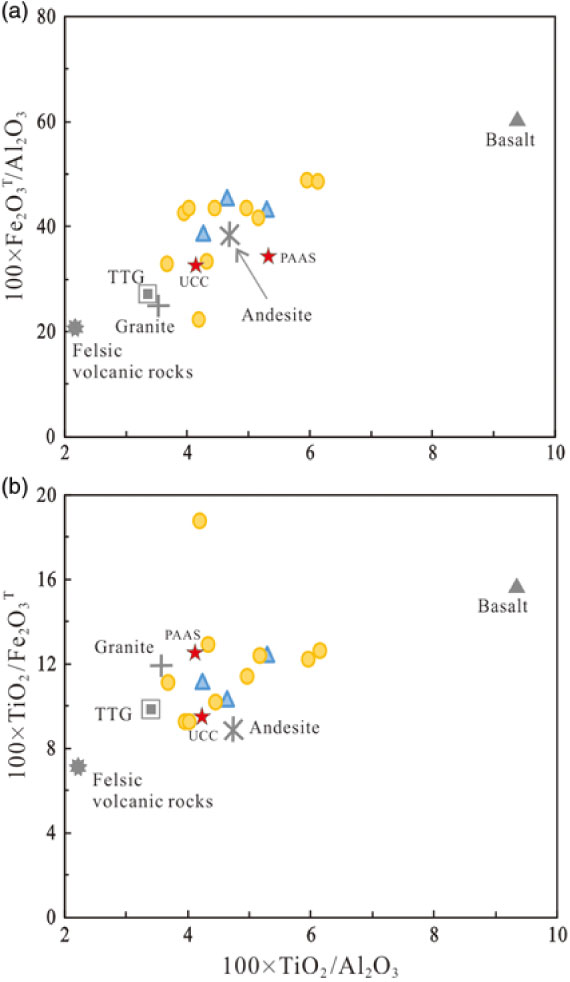
Fig. 13. Source-rock discrimination diagrams for the sedimentary rocks plotted as (a) 100 × TiO2/Al2O3 versus 100 × Fe2O3 T/Al2O3 and (b) 100 × TiO2/Al2O3 versus 100 × TiO2/Fe2O3 T. Average Proterozoic felsic volcanic rocks, granite, TTG, andesite, basalt, UCC and PAAS data are from Condie (Reference Condie1993) for comparison. Symbols as for Figure 9.
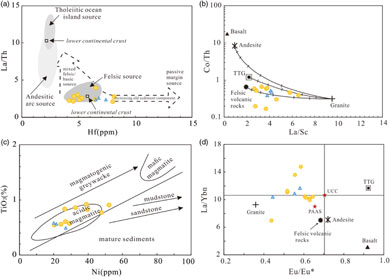
Trace elements with relatively low mobility and low residence time in seawater are quantitatively transferred into clastic sediments during primary weathering and transportation, and can therefore be used to identify the composition of source rocks (Bhatia & Crook, Reference Bhatia and Crook1986; Floyd & Leveridge, Reference Floyd and Leveridge1987; Floyd et al. Reference Floyd, Winchester and Park1989; McLennan, Reference McLennan1989). The concentrations of Th and La are more enriched in felsic than in mafic igneous source rocks, whereas the Co, Sc and Cr abundances are higher in mafic rocks (Taylor & McLennan, Reference Taylor and McLennan1985). In the present study, the samples show a relatively high La/Sc (4.0) ratio with low Sc/Th (0.68), Cr/Th (3.97) and Co/Th (4.5) ratios, indicating the rocks were most likely derived from a felsic source rock (Table 1). Some other compositional discrimination diagrams also can distinguish the compositional characteristics of the source rocks. According to the discrimination diagram of the La/Th ratio versus Hf (Fig. 14a), most samples fall in the field of a felsic source with a minor old sedimentary component. The Co/Th versus La/Sc ratios plot (Fig. 14b) shows a mixed source, dominated by felsic–intermediate materials. In the plot of TiO2 versus Ni (Fig. 14c), the majority of samples fall in the acidic magmatite field. As shown in the (La/Yb)n versus Eu/Eu* plot (Fig. 14d), all the samples indicate contributions from felsic to intermediate components. These features all indicate that the studied late Neoproterozoic and early Cambrian sandstones were derived from a source dominated by felsic–intermediate materials.
Table 1. Elemental ratios of the late Neoproterozoic – early Cambrian sedimentary rocks in this study compared with ratios from other sources
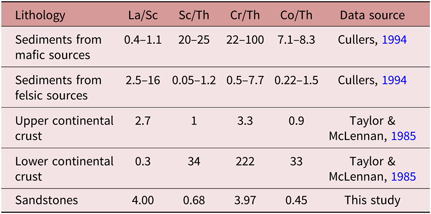
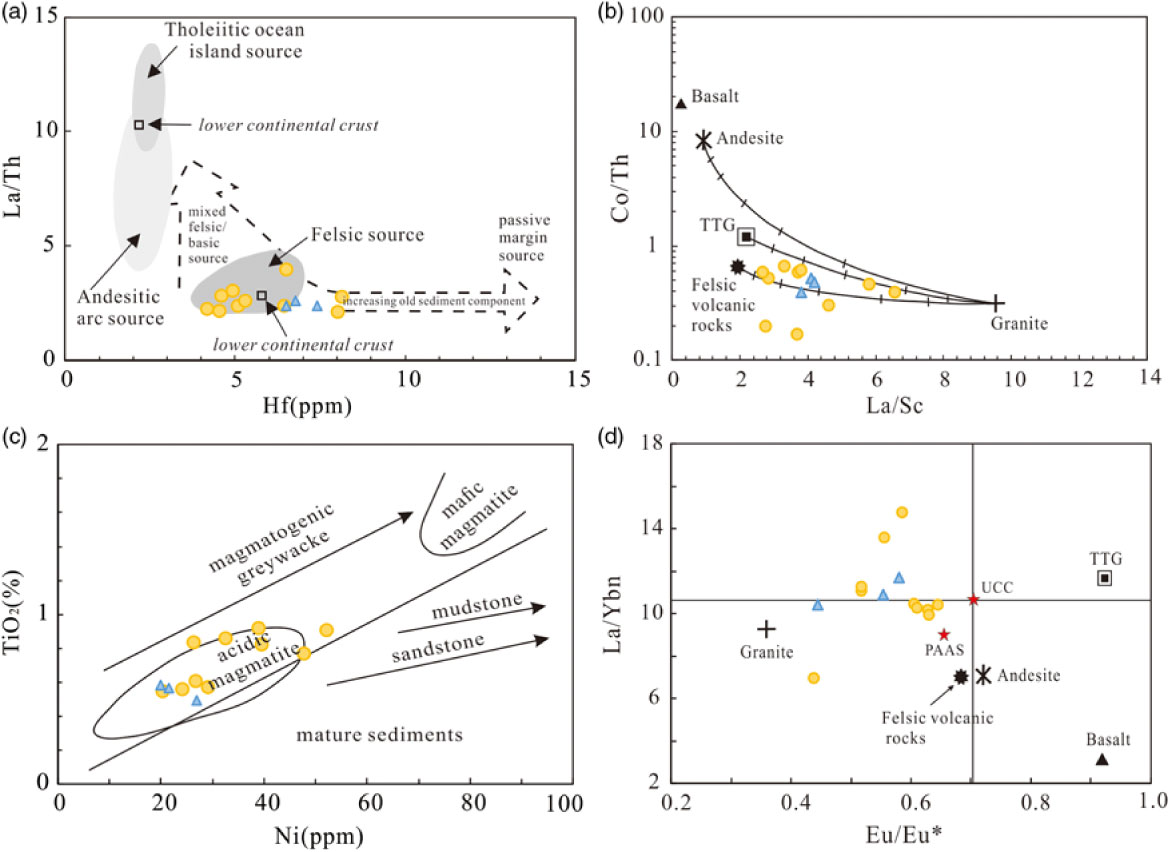
Fig. 14. Geochemical diagrams showing the source composition of late Neoproterozoic – early Cambrian sedimentary rocks in the Cathaysia Block. (a) La/Th versus Hf (after Floyd & Leveridge, Reference Floyd and Leveridge1987); (b) Co/Th versus La/Sc (after Gu et al. Reference Gu, Liu, Zheng, Tang and Qi2002); (c) TiO2 versus Ni (after Floyd et al. Reference Floyd, Winchester and Park1989); and (d) (La/Yb)n versus Eu/Eu* (after Wang et al. Reference Wang, Zeng, Zhou, Zhao, Zheng and Lan2018). Average reference compositions are from Condie (Reference Condie1993). Symbols as for Figure 9.
5.b. Provenance of the detrital zircons
The age distribution of the detrital zircons can be used to trace the provenance of the sedimentary rocks (Fedo et al. Reference Fedo, Sircombe and Rainbird2003). The similar age spectra of the late Neoproterozoic and early Cambrian samples indicate a continuous sedimentary process and can therefore be discussed together. The zircon U–Pb ages obtained from the Cathaysia Block in this study defined four major age populations as follows: 2221–2676 Ma (with a peak of 2500 Ma), 900–1000 Ma (with a peak of 966 Ma), 716–870 Ma (with a peak of 752 Ma) and 532–655 Ma (with two peaks at 536 and 604 Ma) (Fig. 15a).
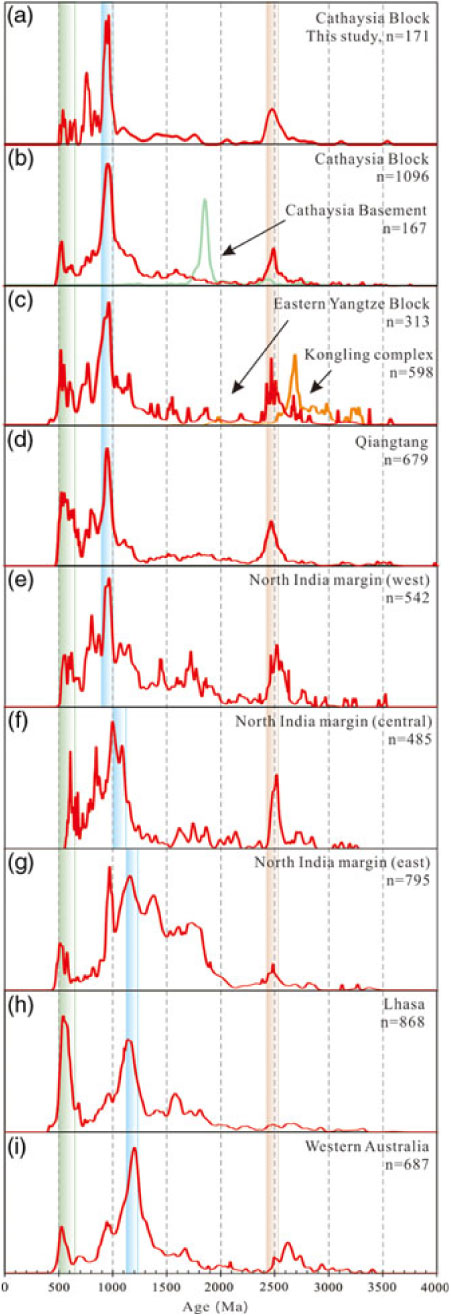
Fig. 15. (a–i) Relative probability diagrams of U–Pb detrital zircon age distributions for comparing age-equivalent sedimentary samples from the Cathaysia Block with other blocks, including Cathaysia, Yangtze, Qiangtang, northern India margin, Lhasa Terrane and Western Australia. Data from: this study, Yu et al. (Reference Yu, O’Reilly, Wang, Griffin, Zhang, Wang, Jiang and Shu2008), Wu et al. (Reference Wu, Jia, Deng and Li2010), Yao et al. (Reference Yao, Li, Li, Li and Yang2014) and Yan et al. (Reference Yan, Shu, Santosh, Yao, Li and Li2015) for Neoproterozoic–Cambrian sediments in the Cathaysia Block; Li (Reference Li1997), Wan et al. (Reference Wan, Liu, Xu, Zhuang, Song, Shi and Du2007), Liu et al. (Reference Liu, Zhou, Zhang, Zhong, Zeng, Xiang, Jin, Lu and Li2009), Yu et al. (Reference Yu, Wang, O’Reilly, Griffin, Zhang, Li and Shu2009) and Li et al. (Reference Li, Li, Wartho, Clark, Li, Zhang and Bao2010) Wan et al. (Reference Wan, Liu, Xu, Zhuang, Song, Shi and Du2007), Liu et al. (Reference Liu, Zhou, Zhang, Zhong, Zeng, Xiang, Jin, Lu and Li2009), Yu et al. (Reference Yu, Wang, O’Reilly, Griffin, Zhang, Li and Shu2009) for the Precambrian crystalline basement rocks in Cathaysia Block; Wang et al. (Reference Wang, Zhang, Fan, Zhang, Chen, Cawood and Zhang2010) and Yao et al. (Reference Yao, Li and Li2015) for Cambrian sediments in the Eastern Yangtze Block; Gao et al. (Reference Gao, Yang, Zhou, Li, Hu, Guo, Yuan, Gong, Xiao and Wei2011) and Guo et al. (Reference Guo, Gao, Wu, Li, Chen, Hu, Liang, Liu, Zhou, Zong, Zhang and Chen2014) for the Kongling Complex; Dong et al. (Reference Dong, Li, Wan, Wang, Wu, Xie and Liu2011), He et al. (Reference He, Li, Wang, Zhang, Ji, Yu, Gu and Shi2011), Pullen et al. (Reference Pullen, Kapp, Gehrels, Ding and Zhang2011) and Zhu et al. (Reference Zhu, Zhao, Niu, Dilek and Mo2011) for late Neoproterozoic – early Palaeozoic sediments in the Qiangtang; Myrow et al. (Reference Myrow, Hughes, Goodge, Fanning, Williams, Peng, Bhargava, Parcha and Pogue2010) and Webb et al. (Reference Webb, Yin, Harrison, Celerier, Gehrels, Manning and Grove2011) for late Neoproterozoic – early Palaeozoic sediments in the west of the northern India margin; Gehrels et al. (2011) for early Palaeozoic sediments in the central part of the northern India margin; McQuarrie et al. (Reference McQuarrie, Robinson, Long, Tobgay, Grujic, Gehrels and Ducea2008), Myrow et al. (Reference Myrow, Hughes, Goodge, Fanning, Williams, Peng, Bhargava, Parcha and Pogue2010), Webb et al. (Reference Webb, Yin and Dubey2013) and Guo et al. (Reference Guo, Zhang, Harris, Xu and Pan2017) for late Neoproterozoic – early Palaeozoic sediments in the east of the northern India margin; Leier et al. (Reference Leier, Kapp, Gehrels and DeCelles2007), Dong et al. (Reference Dong, Zhang and Santosh2010), Zhu et al. (Reference Zhu, Zhao, Niu, Dilek and Mo2011) and Guo et al. (Reference Guo, Zhang, Harris, Xu and Pan2017) for late Neoproterozoic – Palaeozoic sediments in the Lhasa Terrane; and Cawood & Nemchin (Reference Cawood and Nemchin2000), Veevers et al. (Reference Veevers, Saeed, Belousova and Griffin2005) and Martin et al. (Reference Martin, Collins and Kirkland2017) for late Neoproterozoic – Palaeozoic sediments in Western Australia.
The oldest populations of zircons in our samples range from 2221 Ma to 3545 Ma with a peak at c. 2.5 Ga, broadly corresponding to the timing of a global crustal growth event (Santosh et al. Reference Santosh, Shaji, Tsunogae, Mohan, Satyanarayanan and Horie2013). Although similar ages have been widely reported from detrital or inherited grains or xenocrysts in Proterozoic–Mesozoic igneous/sedimentary rocks from the Cathaysia Block, rocks of these ages are rarely exposed at present (Xu et al. Reference Xu, O’Reilly, Griffin, Deng and Pearson2005, Reference Xu, O’Reilly, Griffin, Wang, Pearson and He2007; Wang et al. Reference Wang, Zhang, Fan, Zhang, Chen, Cawood and Zhang2010; Xia et al. Reference Xia, Xu and Zhu2012). The Archean basement in the SCB has only been found in the northern part of the Yangtze Block, represented by the Kongling Complex. The detrital zircon age spectra for this complex is quite different and cannot be the provenance for the Neoproterozoic–Cambrian sedimentary rocks we studied (Fig. 15a,c). Furthermore, most of these zircons are highly rounded (Fig. 4), suggesting long-distance transport from their source region or multi-cycled histories before their deposition. Because of the few coeval magmatic rocks of age c. 2.5 Ga known from the SCB, it is reasonable to conclude that these zircons were likely derived from an exotic source that was once contiguous to the SCB. This conclusion is also supported by the Hf isotopic compositions of the detrital zircons. Most Neoarchean zircons from the studied samples show similar values to those of India, Qiangtang and east Antarctica, but different from those in Western Australia, which underwent a major period of granitoid production at the older ages of 2.6–2.8 Ga (Fig. 8b; Zhu et al. Reference Zhu, Zhao, Niu, Dilek and Mo2011). The detrital zircons of age c. 2.5 Ga in the Cathaysia Block could potentially have come from India, Qiangtang and east Antarctica.
A prominent age population (900–1000 Ma) with a peak at 966 Ma has been found in the Cathaysia Block, corresponding to the global Grenvillian Orogeny associated with the amalgamation of Rodinia (Fig. 15a,b; Zhao & Cawood, Reference Zhao and Cawood2012). Detrital zircons of this age are reported to be widespread in SCB sedimentary rocks, although the exposure of Grenvillian rocks is limited (Fig. 15a–c; Yu et al. Reference Yu, O’Reilly, Wang, Griffin, Zhang, Wang, Jiang and Shu2008; Shu et al. Reference Shu, Faure, Yu and Jahn2011). Similarly aged magmatic rocks in the Cathaysia Block are the 0.97 Ga Jingnan rhyolites in the southwestern Wuyi Mountains and the 0.91–1.0 Ga metabasites in the northern Yunkai Domain (Shu et al. Reference Shu, Yu, Jia, Wang, Shen and Zhang2008; Xia et al. Reference Xia, Xu, Zhao and Liu2015). Subduction-related magmatic rocks with ages of c. 0.9–1.0 Ga of arc-continent origin have been reported in the eastern and southeastern margin of the Yangtze Block (Ye et al. Reference Ye, Li, Li, Liu and Li2007; Xia et al. Reference Xia, Xu, Niu and Liu2018). Several mafic rocks with ages of 0.98–1.1 Ga have also been found in the northern margin of the Yangtze Block (Peng et al. Reference Peng, Kusky, Jiang, Wang and Deng2012). However, it is noteworthy that most of the reported rocks of these ages in the SCB are dominated by metamorphic rocks or mafic intrusions (Xia et al. Reference Xia, Xu, Zhao and Liu2015, Reference Xia, Xu, Niu and Liu2018). Given the aforementioned felsic source characteristic of our samples and the moderately to highly rounded zircon morphology, this should preclude the possibility of a local source supply for the voluminous early Neoproterozoic zircons in our study. The age spectra of the known Cathaysia crystalline basement rocks lacking an age population at 0.9–1.0 Ga also suggest an unlikely source from the recycling of underlying strata (Fig. 15a,b). Moreover, the nearly entire water coverage of the Cathaysia Block with continuous NW palaeocurrents across Cathaysia to the Yangtze Block during early Palaeozoic time suggests an outboard source should lie to the SE margin of the Cathaysia Block (Wang et al. Reference Wang, Zhang, Fan, Zhang, Chen, Cawood and Zhang2010; Xu et al. Reference Xu, Cawood, Du, Hu, Yu, Zhu and Li2013; Shu et al. Reference Shu, Jahn, Charvet, Santosh, Wang, Xu and Jiang2014; Yao et al. Reference Yao, Li and Li2015). Furthermore, the 0.9–1.0 Ga detrital zircons with a wide range of ɛ Hf(t) values (−11.1 to +10.2) and model ages (1.17–2.50 Ga) may suggest a common provenance with that in the Himalaya regions of India and Qiangtang (Fig. 8a,b). This age population matches well with the recorded synchronous arcs in the Eastern Ghats belt (960 Ma) of India and the Prince Charles Mountains (960–990 Ma) of East Antarctica during the assembly of the Rodinia supercontinent (Fitzsimons, Reference Fitzsimons2000 a, b; Veevers, Reference Veevers2007), but is much younger than the pronounced c. 1100–1300 Ma Grenvillian Event in other blocks such as Western Australia and West Laurentia, indicating the diachronic nature of the Rodinia assembly process (Li et al. Reference Li, Li and Li2014). The large proportion of early Neoproterozoic zircons (0.9–1.0 Ga) therefore indicates a possible source from the Eastern Ghats belt in India or the Prince Charles Mountains in East Antarctica.
The detrital zircons also show another cluster of middle Neoproterozoic ages (716–870 Ma, a peak at 752 Ma) corresponding to the break-up of the Rodinia supercontinent (Shu et al. Reference Shu, Faure, Yu and Jahn2011; Li et al. Reference Li, Li and Li2014). The Panxi–Hannan Belt along the western margin of the Yangtze Block contains voluminous 730–870 Ma mafic to intermediate igneous intrusions (Zhao & Cawood, Reference Zhao and Cawood2012; Xia et al. Reference Xia, Xu, Niu and Liu2018). However, the dominant carbonate deposition over the Yangtze Block makes it an unlikely source for the clastic sediments in the Cathaysia Block (Xu et al. Reference Xu, Cawood, Du, Hu, Yu, Zhu and Li2013; Shu et al. Reference Shu, Jahn, Charvet, Santosh, Wang, Xu and Jiang2014; Yao et al. Reference Yao, Li, Li, Li and Yang2014, Reference Yao, Li and Li2015). Rift-related magmatic assemblies, S-type granites and collision-rifting tectonic processes during this period have been widely reported in the Yangtze Block but are quite limited in the Cathaysia Block (Yao et al. Reference Yao, Shu and Santosh2011, Reference Yao, Li, Li, Li and Yang2014; Wang et al. Reference Wang, Wang, Zhou and Shu2013; Xia et al. Reference Xia, Xu, Niu and Liu2018). Similar detrital age populations have also been well documented in the middle Neoproterozoic successions of the Nanhua Basin (635–850 Ma) (Wang et al. Reference Wang, Li, Li, Li, Tang, Gao, Zhang and Liu2012). In addition, all the zircons with these ages yield negative ɛ Hf(t) values (−1.7 to −27.9) and the model ages are mainly clustered at 1.84–1.96 Ga and 2.3–2.8 Ga (Fig. 8a), consistent with values from the Neoproterozoic igneous zircons in the central Nanhua Basin (Wang et al. Reference Wang, Li, Li, Li, Tang, Gao, Zhang and Liu2012; Zhang & Zheng, Reference Zhang and Zheng2013). Combined with the mostly euhedral to subeuhedral zircon morphology, one can infer that these zircons derived from a mainly local supply within the SCB and were most probably sourced from the elevated rift shoulders and rifting volcanic rocks of the Nanhua Basin.
Some of the zircons with an age range of 532–655 Ma (two peaks at 536 Ma and 604 Ma) deserve attention. They possibly correspond to the timing of the global Pan-African Event related to the assembly of the Gondwana supercontinent, and the 530 Ma peak may be interpreted as the final assembly of Gondwana (Cawood & Nemchin, Reference Cawood and Nemchin2000; Shabeer et al. Reference Shabeer, Kumar, Armstrong and Buick2005). Although no coeval magmatic or metamorphic rocks have been found in the SCB during this period, the reported detrital zircons of similar ages from the Neoproterozoic to Cambrian sedimentary rocks of the Cathaysia and Yangtze blocks indicate that a provenance should exist for these detrital zircons (Fig. 15a,b,c). In contrast, this age population is comparable to the timing of the East African Orogen (650–550 Ma) related to the subduction of oceanic floor between cratons (DeCelles et al. Reference DeCelles, Gehrels, Quade, Lareau and Spurlin2000; Duan et al. Reference Duan, Meng, Zhang and Liu2011), the Bhimphedian Orogen (550–470 Ma) associated with the proto-Tethyan oceanic subduction beneath the margins of the Gondwana continents (Cawood et al. Reference Cawood, Johnson and Nemchin2007) and the Prydz–Darling Orogen (600–500 Ma) between India and the Antarctic (Cawood et al. Reference Cawood, Johnson and Nemchin2007). The Hf isotopic compositions of the zircons of these ages show a special variation, in that the zircons of age > 570 Ma show either positive or negative ɛ Hf(t) values, whereas the ɛ Hf(t) values of the zircons of age < 570 Ma zircons are exclusively negative (Fig. 8a). It was inferred that the source regions of these zircons underwent juvenile input during the period 650–570 Ma but more intense reworking of ancient crustal materials during the period 570–530 Ma. These zircon Hf isotopic characteristics are consistent with those in the Himalaya regions of India and Qiangtang, including the commonly positive ɛ Hf(t) values at c. 650–570 Ma (Fig. 8a,b). Moreover, the palaeocurrent records in the Neoproterozoic – early Palaeozoic sedimentary rocks from East Gondwana could have led to widespread detritus transport into the SCB (Myrow et al. Reference Myrow, Snell, Hughes, Paulsen, Heim and Parcha2006, Reference Myrow, Hughes, Goodge, Fanning, Williams, Peng, Bhargava, Parcha and Pogue2010). The commonly rounded to sub-rounded zircons of our samples may therefore have derived from East Gondwana, and most probably from the East African and Bhimphedian orogens.
5.c. Tectonic implications
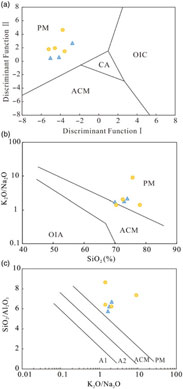
The geochemical compositions of sedimentary rocks prove to be useful in characterizing the tectonic setting of sedimentary deposition, and various major- and trace-element discriminants and diagrams have been constructed to identify them (Bhatia, Reference Bhatia1983; Bhatia & Crook, Reference Bhatia and Crook1986; Roser & Korsch, Reference Roser and Korsch1986). Four typical tectonic settings are generally distinguished as follows: oceanic island arc (OIA), continental arc (CA), active continental margin (ACM) and passive margin (PM). However, the tectonic discrimination diagrams with major elements must be used with caution because K, Na and Al are relatively mobile during post-depositional processes (Concepcion et al. Reference Concepcion, Dimalanta, Yumul, Faustino Eslava, Queano, Tamayo and Imai2012). Based on the A-CN-K ternary diagram (Fig. 11), six sandstone samples underwent moderate post-depositional K-metasomatism; these samples were therefore excluded in the tectonic discrimination diagrams using major elements. In the discriminant function plot of 11 major elements of Bhatia (Reference Bhatia1983), all of the samples lie within the passive continental margin environment (Fig. 16a). This is consistent with the discrimination diagrams of the K2O/Na2O ratio versus SiO2 and SiO2/Al2O3 versus K2O/Na2O ratios, which also indicate a passive continental margin tectonic setting (Fig. 16b,c; Roser & Korsch, Reference Roser and Korsch1986). On the La/Y versus Sc/Cr ratio discrimination diagram, nearly all the samples fall in the field of passive margin or cluster near the field (Fig. 17a; Bhatia & Crook, Reference Bhatia and Crook1986). On the ternary diagrams of La-Th-Sc and Th-Sc-Zr/10 (Fig. 17b,c), the samples mostly fall within the fields of passive margin, active continental margin and continental arc, showing somewhat of a difference from the prior discriminations. This inconsistency in using trace elements can be attributed to the inherited geochemical signatures from rocks generated at an ancient active continental margin or continental arc, rather than its depositional environment (Savoy et al. Reference Savoy, Stevenson and Mountjoy2000; Bai et al. Reference Bai, Zhou, Wang and Ma2007; Concepcion et al. Reference Concepcion, Dimalanta, Yumul, Faustino Eslava, Queano, Tamayo and Imai2012). This is supported by previous work on the tectonic evolution of the SCB (Shu et al. Reference Shu, Faure, Yu and Jahn2011; Yao et al. Reference Yao, Shu and Santosh2011, Reference Yao, Li, Li, Li and Yang2014; Zhao & Cawood, Reference Zhao and Cawood2012). Moreover, the chondrite-normalized REE patterns of the sandstones containing the most sensitive tectonic discriminant parameters further support a passive margin setting. They show LREE enrichment with significant negative Eu anomalies, which is distinct from the patterns in a continental arc or active continental margin setting (Fig. 10 and Table 2; Bhatia, Reference Bhatia and Crook1986). U–Pb detrital zircon dating can be used as additional evidence for inferring the tectonic setting of sedimentary rocks (Cawood et al. Reference Cawood, Hawkesworth and Dhuime2012; Wang et al. Reference Wang, Zeng, Zhou, Zhao, Zheng and Lan2018). The ages of detrital zircons in our study are dominated by the early Neoproterozoic, much older than the depositional age (Sinian or Cambrian), also supporting a passive margin setting (Fig. 18). All these data strongly indicate that the studied sandstones were chiefly deposited in a passive continental margin.
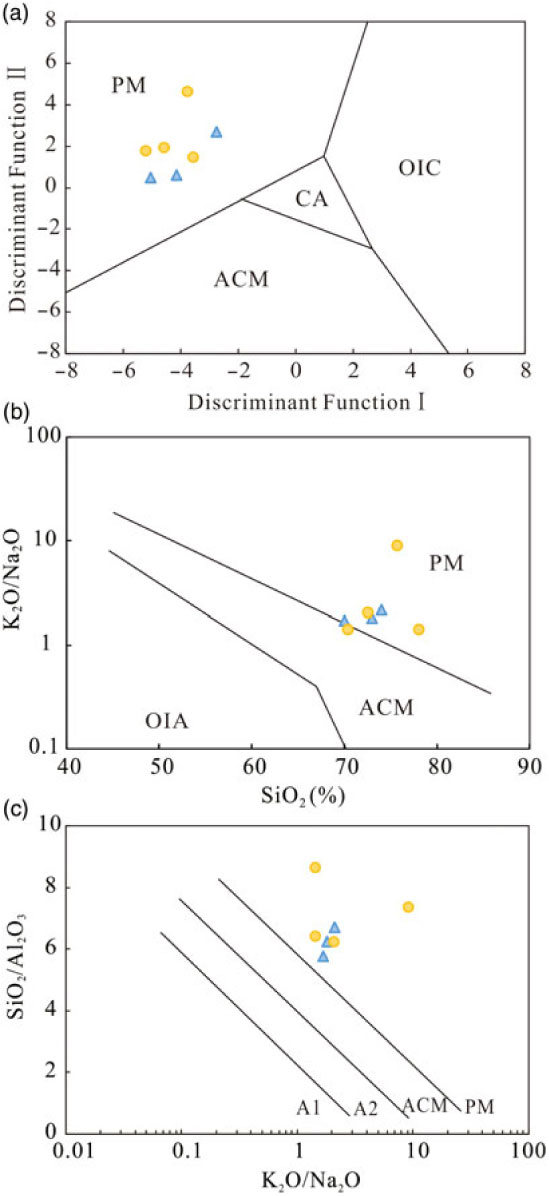
Fig. 16. Tectonic setting discrimination diagram for sedimentary rocks. (a) Discriminant function plot (Bhatia, Reference Bhatia1983), (b) SiO2 versus K2O/Na2O discrimination plot and (c) SiO2/Al2O3 versus K2O/Na2O discrimination plot (Roser & Korsch, Reference Roser and Korsch1986). OIC – oceanic island arc; CA – continental arc; ACM – active continental margin; PM – passive margin; A1 – island arc of basaltic and andesitic detritus; A2 – evolved island arc of felsic intrusive rock detritus. Symbols as for Figure 9.
Table 2. REE characteristics (ppm) of the late Neoproterozoic – early Cambrian sedimentary rocks in this study for discrimination of tectonic setting. Source: Bhatia (Reference Bhatia1983).


Fig. 17. Trace-element tectonic discriminating diagrams for sedimentary rocks (after Bhatia & Crook, Reference Bhatia and Crook1986). OIC – oceanic island arc; CA – continental arc; ACM – active continental margin; PM – passive margin. Symbols as for Figure 9.
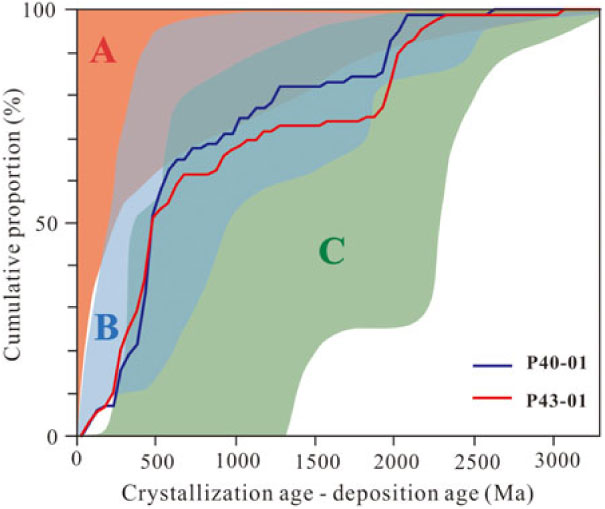
Fig. 18. Variation of the differences between the crystallization ages of detrital zircons and the depositional age of the sedimentary sequences, plotted as cumulative proportion curves (after Cawood et al. Reference Cawood, Hawkesworth and Dhuime2012). A – convergent setting; B – collisional setting; C – extensional setting.
In addition, the tectonic regime between the Cathaysia and Yangtze blocks during early Palaeozoic time remains under debate. Among the issues is whether there was a palaeo-ocean basin (Huanan Ocean) that separated the Cathaysia and Yangtze blocks during Cambrian time (Shui, Reference Shui1987; Liu & Xu, Reference Liu and Xu1994; Xu et al. Reference Xu, Xu and Pan1996; Charvet et al. Reference Charvet, Shu, Faure, Choulet, Wang, Lu and Breton2010; Wang et al. Reference Wang, Zhang, Fan, Zhang, Chen, Cawood and Zhang2010; Yao et al. Reference Yao, Li and Li2015). Provenance analysis using U–Pb geochronology can be used to determine this. If the Huanan Ocean existed during Cambrian time, the provenance of the detrital zircons in the sedimentary rocks between the Cathaysia and Yangtze blocks should be different. Here we used the detrital zircon age data from the Cambrian sedimentary rocks between the Cathaysia and Yangtze blocks to test this scenario. Geologically, the two sample sites are SE of the JSF in the western Cathaysia Block (Fig. 1b). The detrital zircon age spectra show major Neoproterozoic age peaks at 1000–900 Ma and 870–716 Ma, along with subordinate late Archean and early Neoproterozoic peaks at c. 2500 Ma and 655–532 Ma, respectively (Fig. 15a). The Cambrian sandstone samples from the Eastern Yangtze Block show the same age spectra with five peaks at 1006–892, c. 778, c. 612, c. 526 and c. 2476 Ma (Fig. 15c; Wang et al. Reference Wang, Zhang, Fan, Zhang, Chen, Cawood and Zhang2010; Yao et al. Reference Yao, Li and Li2015). This indicates the sediments in the two blocks derived from a similar provenance across the JSF, arguing against the existence of the Huanan Ocean during the Cambrian. Furthermore, palaeocurrent measurements show a consistent NW–W-directed transport direction towards the Cathaysia Block and further towards the Yangtze Block during early Palaeozoic time, further ruling out the presence of a Cambrian ocean basin between the Cathaysia and Yangtze blocks (Wang et al. Reference Wang, Zhang, Fan, Zhang, Chen, Cawood and Zhang2010; Shu et al. Reference Shu, Jahn, Charvet, Santosh, Wang, Xu and Jiang2014; Yao et al. Reference Yao, Li, Li, Li and Yang2014, Reference Yao, Li and Li2015). In addition, if anything at all, there would be a localized depression for receiving sediments and deposition perhaps inherited from the prior plate boundary zone between the two blocks rather than an open ocean basin. However, the presence of an ocean basin would require geological evidence, but none exists. The scenario of an Atlantic-type ocean basin (or a young and small Red-Sea-like basin) would require seafloor basaltic volcanism, but there is no evidence of this. The scenario of a back-arc basin would be the same or similar. The scenario of a Pacific-type oceanic basin would require trenches and volcanic arcs, but there is no geological evidence of these. A Philippine-Sea-type basin would also require seafloor basaltic magmatism and subduction-zone magmatism, but again there is no evidence. Importantly, if there was an open ocean basin, then this basin would never have closed without subduction zones within it; however, there is no geological record for this speculation (trenches, thickened flysches, arc volcanic rocks, etc.).
5.d. Palaeo-position of the Cathaysia Block in Gondwana
The palaeo-position of the Cathaysia Block within the Gondwana supercontinent has long been debated (Cawood et al. Reference Cawood, Johnson and Nemchin2007, Reference Cawood, Wang, Xu and Zhao2013; Li et al. Reference Li, Li, Wartho, Clark, Li, Zhang and Bao2010, Reference Li, Li and Li2014; Duan et al. Reference Duan, Meng, Zhang and Liu2011; Wang et al. Reference Wang, Zhang, Fan, Zhao, Zhang, Zhang, Zhang and Li2011; Xu et al. Reference Xu, Cawood, Du, Hu, Yu, Zhu and Li2013, Reference Xu, Cawood and Du2016; Yao et al. Reference Yao, Li, Li, Li and Yang2014). Because unequivocal Pan-African magmatic or metamorphic rocks have been found in the SCB, the predominant Pan-African ages displayed in the age spectra of late Neoproterozoic – early Cambrian sedimentary rocks from the Cathaysia Block should indicate a Gondwana affinity (Fig. 15a,b). The Pan-African Event is widely distributed in the East African Orogen (650–550 Ma), which uplifted during the Neoproterozoic and provided zircons to the Tethyan Himalaya (DeCelles et al. Reference DeCelles, Gehrels, Quade, Lareau and Spurlin2000), the Prydz-Darling Orogen (600–500 Ma) of the NE margin of Antarctica (Cawood et al. Reference Cawood, Johnson and Nemchin2007), the younger Bhimphedian Orogeny (550–470 Ma) of the North India Orogen (Cawood et al. Reference Cawood, Johnson and Nemchin2007) and the Ross-Delamerian Orogeny (530–480 Ma) of the Terra-Australia Orogen along the Pacific margin (Cawood, Reference Cawood2005; Cawood et al. Reference Cawood, Johnson and Nemchin2007). However, the specific location of the Cathaysia Block near NW India or Western Australia remains unknown.
Detrital zircon age spectra comparison has increasingly been used for correlating individual continental blocks. Some studies have suggested that the Cathaysia Block was situated near Western Australia mainly based on detrital zircons from Hainan Island, which has normally been considered as the southern extent of the Cathaysia Block (Zhou et al. Reference Zhou, Liang, Liang, Jiang, Wang, Fu and Shao2015; Chen et al. Reference Chen, Sun, Long, Zhao, Wang, Yu and Yuan2017). However, there remains doubt as to whether Hainan Island should be regarded as part of the Cathaysia Block during Neoproterozoic and early Palaeozoic time (Xu et al. Reference Xu, Fan, Liang and Tang2001, Reference Xu, O’Reilly, Griffin, Wang, Pearson and He2007, Reference Xu, Cawood, Du, Zhong and Hughes2014 b; Wan et al. Reference Wan, Liu, Xu, Zhuang, Song, Shi and Du2007; Xia et al. Reference Xia, Xu and Zhu2012, Reference Xia, Xu, Niu and Liu2018; Niu et al. Reference Niu, Liu, Xue, Shao, Chen, Duan, Guo, Gong, Hu, Hu, Kong, Li, Liu, Sun, Sun, Ye, Xiao and Zhang2015). The proposed Western Australia connection with the Cathaysia Block based on limited data therefore needs to be reconsidered. Here we compare the updated detrital zircon age spectra in the Cathaysia Block (exclude Hainan Island) with those of potential neighbouring blocks during late Neoproterozoic and early Palaeozoic time (including Qiangtang, northern India, the Lhasa Terrane and Western Australia; Fig. 15) for a better understanding of the palaeo-position of the Cathaysia Block within the Gondwana supercontinent.
The age spectra of the Cathaysia Block are consistent with similar-aged sedimentary rocks from Qiangtang and the western part of the northern India margin, particularly with the predominant Grenvillian peak at c. 0.95 Ga, Pan-African ages of 0.50–0.65 Ga and global crustal growth peak at c. 2.5 Ga (Fig. 15a–e). The Grenvillian peak gradually changed to c. 1100 Ma in much of the central to east northern India margin (Fig. 15f,g) and then to c. 1200 Ma in the Lhasa Terrane and Western Australia (Fig. 15h,i). From U–Pb and Hf isotopic data analysis, Zhu et al. (Reference Zhu, Zhao, Niu, Dilek and Mo2011) argued that the Lhasa Terrane should have been at the northwestern margin of Australia during late Precambrian – early Palaeozoic time, rather than part of the Qiangtang–Himalaya continental margin system. The Cathaysia Block therefore seemed to be nearer Qiangtang and the western part of the northern India margin during late Neoproterozoic and Cambrian time, but was unlikely to have had a direct connection with the Lhasa Terrane and Western Australia (Fig. 19). Furthermore, the Hf isotopic compositions of the zircons with the Pan-African ages in the Cathaysia Block show the same patterns as those in the Himalaya regions of India and Qiangtang, including the commonly positive ɛ Hf(t) values at c. 650–570 Ma (Fig. 8a,b). The palaeocurrent directions from the SCB and India are consistent with this interpretation, which would have led to the detrital zircons associated with the Pan-African and Grenvillian ages transporting into the SCB (Myrow et al. Reference Myrow, Hughes, Paulsen, Williams, Parcha, Thompson, Bowring, Peng and Ahluwalia2003, Reference Myrow, Snell, Hughes, Paulsen, Heim and Parcha2006; Wang et al. Reference Wang, Zhang, Fan, Zhang, Chen, Cawood and Zhang2010; Shu et al. Reference Shu, Jahn, Charvet, Santosh, Wang, Xu and Jiang2014; Yao et al. Reference Yao, Li, Li, Li and Yang2014). The Pan-African aged zircons in the Cathaysia Block were therefore most probably sourced from the East African and Bhimphedian orogens. In addition, the aforementioned proposed passive margin setting for our samples in the Cathaysia Block is consistent with the passive margin setting of northern India during late Neoproterozoic – early Palaeozoic time (Yin et al. Reference Yin, Dubey, Webb, Kelty, Grove, Gehrels and Burgess2010). The similarity of the sedimentary sequences and shallow marine faunas among the Cathaysia, Himalaya and northern India regions during late Neoproterozoic – early Palaeozoic time (McKenzie et al. Reference McKenzie, Hughes, Myrow, Xiao and Sharma2011; Jiang et al. Reference Jiang, Sinclair, Niu and Yu2013; Hughes, Reference Hughes2016), and the unconformity between the Ordovician and Cambrian successions in the Yunkai Domains of eastern Cathaysia and northern India (Myrow et al. Reference Myrow, Hughes, Searle, Fanning, Peng and Parcha2009; Xu et al. Reference Xu, Cawood, Du, Huang and Wang2014 a), further support this configuration (Fig. 19).
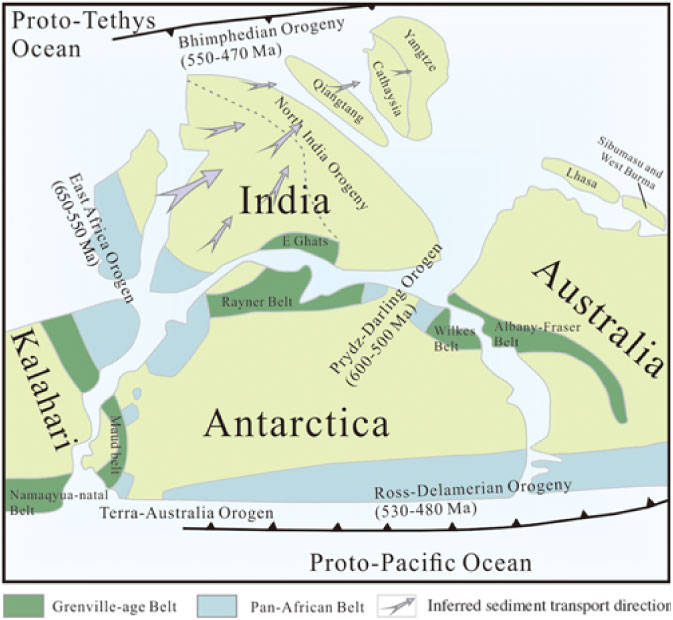
Fig. 19. Reconstruction of East Gondwana showing hypothetical palaeo-position of Cathaysia Block during early Palaeozoic time (modified after Fitzsimons, Reference Fitzsimons2000 b; Zhu et al. Reference Zhu, Zhao, Niu, Dilek and Mo2011).
6. Conclusions
(1) The whole-rock major- and trace-element compositions of the late Neoproterozoic – early Cambrian sandstones from the Cathaysia Block indicate that they were mainly derived from intermediate–felsic sources with a moderate weathering history.
(2) The U–Pb dating results of the late Neoproterozoic – early Cambrian sandstones from the Cathaysia Block show four major age populations of c. 2.5 Ga, 1000–900 Ma (Grenvillian), 870–716 Ma (middle Neoproterozoic) and 655–532 Ma (Pan-African). Provenance analysis, together with zircon Hf-isotopic compositions and morphology, suggest that most of the zircons in our study were sourced from exotic continental terranes once connected to the Cathaysia Block.
(3) The Cathaysia Block was a passive continental margin during late Neoproterozoic – early Cambrian time. Similar age distributions between the Cathaysia and Eastern Yangtze blocks suggest that these two blocks shared the same continent without an open ocean basin between them during Cambrian time.
(4) Qualitative comparison of age spectra of the SCB with the potential neighbouring blocks during late Neoproterozoic and early Palaeozoic time, such as Qiangtang, northern India, the Lhasa Terrane and Western Australia, shows that the Cathaysia Block might have been near Qiangtang and the western part of the northern India margin during late Neoproterozoic and Cambrian time. This inference suggests that the Cathaysia Block did not have direct a connection with the Lhasa Terrane and Western Australia in the Gondwana reconstruction.
Supplementary material
To view supplementary material for this article, please visit https://doi.org/10.1017/S0016756819000013.
Author ORCIDs
Chen Xiong, 0000-0003-3285-8717
Acknowledgments
The study was financially supported by the Open Foundation of State Key Laboratory of Oil and Gas Reservoir Geology and Exploitation (grant no. PLC201605), the National Science and Technology Major Project (grant no. 2017ZX05008005) and the National Natural Science Foundation of China (grant no. 41872109).


