


1 Introduction
The Arabian Sea is dominated by a monsoon climate characterized by seasonal reversal of winds and precipitations, which results in large seasonal oceanographic changes in seawater properties and sediment distribution (Nair et al. Reference Nair, Ittekkot, Manganini, Ramaswamy, Haake, Degens, Desai and Honjo1989). In general, the Arabian Sea is strongly influenced by the SW monsoon (June–September), and moderately influenced by the NE monsoon (December–February) and the associated reversal of the surface currents (Mooley & Parthasarathy, Reference Mooley and Parthasarathy1984). The SW monsoon accounts for the majority of the rainfall (>3000 mm) in India (the Karakoram and the Himalayas), whereas the NE monsoon is less important in terms of precipitation, although Karim & Veizer (Reference Karim and Veizer2002) reported that a high proportion of the Indus discharge waters must have originated from the Mediterranean on the basis of isotope mass balance. During the SW monsoon, the prevailing southwesterly winds also induce the strong longshore current. But the longshore sediment transport seems limited within the inner continental shelf at the present time (Shanas & Kumar, Reference Shanas and Kumar2014), although longshore transport may have played a more effective role in delivering sediments to the deep sea during the glacial periods when the sea level was low. The deep sea sediments in the Arabian Sea are known to be transported from several sources. The most important sediment fractions to these sources are fluvial detritus from the Indian continent and Somalia, aeolian particles from Arabia, and submarine weathering products of the Carlsberg Ridge (Milliman et al. Reference Milliman, Quraishee, Beg, Haq and Milliman1984; Shankar et al. Reference Shankar, Subbarao and Kolla1987; Sirocko & Sarnthein, Reference Sirocko, Sarnthein, Leinen and Sarnthein1989; Alagarsamy & Zhang, Reference Alagarsamy and Zhang2005; Chandramohan & Balchand, Reference Chandramohan and Balchand2007).
The contribution of terrigenous particles to the Arabian Sea is largely controlled by monsoon activity and its effects on precipitation and riverine discharge (Haake et al. Reference Haake, Ittekkot, Rixen, Ramaswamy, Nair and Curry1993). Analogously to the situation in the Bay of Bengal, several rivers draining peninsular India discharge their freshwater into the Arabian Sea: the Indus, Narmada and Tapti Rivers, as well as small rivers from the Western Ghats (Fig. 1). The Indus River may be the oldest continuously active river in the Himalayan region. It has been flowing from its origin in the Indus Suture Zone draining the Karakoram, Tethyan Himalaya and Kohistan–Ladakh Batholiths since the early Eocene (Clift, Reference Clift, Clift, Kroon, Gaedicke and Craig2002). The Indus River’s discharge is intensely seasonal due to the monsoon. The major pulse occurs between April and October, caused by glacial melting and the summer monsoon precipitation (Karim & Veizer, Reference Karim and Veizer2002). The Indus River is also the largest source of sediment to the Arabian Sea; its annual sediment flux has been estimated at c. 250 million tons (Milliman & Syvitski, Reference Milliman and Syvitski1992). Most sediments from the Indus River are deposited and dispersed by the longshore current within the shallow continental shelf before being further transported onto the abyssal deep sea floor in the Arabian Sea (Clift et al. Reference Clift, Giosan, Blusztajn, Campbell, Allen, Pringle, Tabrez, Danish, Rabbani and Alizai2008; Limmer et al. Reference Limmer, Böning, Giosan, Ponton, Köhler, Cooper, Tabrez and Clift2012a). Both the Narmada and the Tapti Rivers also contribute more than ∼125 million tons of sediments annually to the Arabian Sea (Milliman & Syvitski, Reference Milliman and Syvitski1992). Most of these sediments are distributed similarly along the inner continental shelves of western India (e.g. Avinash et al. Reference Avinash, Kurian, Warrier, Shankar, Vineesh and Ravindra2016). The small rivers and streams in the Western Ghats discharge sediments into the Arabian Sea, but the sediment amounts are quite low, compared to the major rivers.

Fig. 1. (a) Bathymetric map of the Arabian Sea and the surrounding landmasses with monsoon climate. Red rectangle and circles represent IODP Site U1456 and sediment core sites of previous studies (Keti-Bandar, Indus-23, SK111/22, U1456, SS-3014G). Red and blue arrows show the surface and longshore currents. (b) Lithology of the drainage basins occupied by the different rivers in western India (modified after Kessarkar et al. Reference Kessarkar, Rao, Ahmad and Babu2003 and Goswami et al. Reference Goswami, Singh, Bhushan and Rai2012).
The provenance of detrital marine sediments encompasses both their formation by erosion of continental source rocks and the processes involved in their subsequent transportation and deposition on the sea floor. Sediment provenance studies have been conducted using diverse approaches such as geochemistry, sedimentology and mineralogy, providing information on many related topics: sediment sources, hydrographic and oceanographic processes, weathering intensity, and tectonic/crustal evolution at different timescales (e.g. McLennan & Taylor, Reference McLennan and Taylor1991; Goldstein & Hemming, Reference Goldstein, Hemming, Holland and Turekian2003; Grousset & Biscaye, Reference Grousset and Biscaye2005; Andrews & Eberl, Reference Andrews and Eberl2012; Mazumder, Reference Mazumder2017). The radiogenic Sr (87Sr/86Sr) and Nd (143Nd/144Nd) isotopes in detrital silicates are regarded as reliable fingerprints for sediment provenance, although there is some debate, such as whether chemical weathering may affect strontium isotopes, as to the importance of different factors in determining these ratios. The Sr and Nd isotopic composition of source rocks is decided by their Rb/Sr and Sm/Nd ratios, respectively, and by the ages of those source rocks. Thus, the Sr and Nd isotopic composition of detrital marine sediments which are the erosional products of continental rocks provides information on both the sediment source and the spatio-temporal variations in that source (e.g. Asahara et al. Reference Asahara, Tanaka, Kamioka, Nishimura and Yamazaki1999; Colin et al. Reference Colin, Turpin, Bertaux, Desprairies and Kissel1999, Reference Colin, Turpin, Blamart, Frank, Kissel and Duchamp2006; Innocent et al. Reference Innocent, Fagel and Hillaire-Marcel2000; Ahmad et al. Reference Ahmad, Anil Babu, Padmakumari, Dayal, Sukhija and Nagabhushanam2005; Rutberg et al. Reference Rutberg, Goldstein, Hemming and Anderson2005; Meyer et al. Reference Meyer, Davies and Stuut2011; Tripathy et al. Reference Tripathy, Singh, Bhushan and Ramaswamy2011; Goswami et al. Reference Goswami, Singh, Bhushan and Rai2012; Awasthi et al. Reference Awasthi, Ray, Singh, Band and Rai2014; Jonell et al. Reference Jonell, Li, Blusztajn, Giosan and Clift2018).
Sediment provenance studies using several different approaches have been carried out in the Arabian Sea. Based on heavy mineral assemblages, Garzanti et al. (Reference Garzanti, Vezzoli, Ando, Paparella and Clift2005) reported that the sandy sediments in the northern and central Arabian Sea were supplied by the Indus River from the Himalaya, Transhimalaya and Karakoram ranges in northern India, whereas the sediment sources of deep sea sediments in the SE Arabian Sea were diverse. The main sources of the deep sea sediments were basic igneous rocks, gneisses/granites, high-grade metamorphic rocks, and sandstones in western and southwestern India (Akaram et al. Reference Akaram, Das, Rai and Mishra2015). In terms of clay minerals, Das et al. (Reference Das, Rai, Akaram, Verma, Pandey, Dutta and Prasad2013) reported that the detrital fine-grained sediments in the SE Arabian Sea were supplied by numerous small rivers draining western India, and confirmed that the Holocene sediments along the western margin of India were divided regionally by distinct clay mineral associations representing the different sediment sources (Rao & Rao, Reference Rao and Rao1995; Thamban et al. Reference Thamban, Rao and Schneider2002; Kessarkar et al. Reference Kessarkar, Rao, Ahmad and Babu2003; Limmer et al. Reference Limmer, Köhler, Hillier, Moreton, Tabrez and Clift2012b). Recently, Avinash et al. (Reference Avinash, Kurian, Warrier, Shankar, Vineesh and Ravindra2016) compiled multiple sediment proxies of the surface sediments in the eastern Arabian Sea, highlighting that the clay minerals in the shallow and deep sea sediments originate from different sources. Kessarkar et al. (Reference Kessarkar, Rao, Ahmad and Babu2003) first reported that Sr and Nd isotope data from many core sediments along the western margin of India constrained the possible sediment sources as well as changes in the degree of chemical weathering between the Holocene and the last glacial period. Later, Goswami et al. (Reference Goswami, Singh, Bhushan and Rai2012) found a very narrow range of Sr and Nd isotopes, leading them to suggest that the provenance of these sediments remained unchanged during the last 40 ka in the eastern Arabian Sea. In addition, they proposed a possible supply of sediments from the Bay of Bengal to the SE Arabian Sea, in contrast to Kessarkar et al. (Reference Kessarkar, Rao, Ahmad and Babu2003). Based on Sr and Nd isotopes in bulk sediments, Limmer et al. (Reference Limmer, Böning, Giosan, Ponton, Köhler, Cooper, Tabrez and Clift2012a) confirmed that the Holocene sediments in the shallow continental shelf of NW India were mainly transported from the Indus River, despite being mixed with older sediments, emphasizing an active longshore transport in the NW part of the shelf (Shanas & Kumar, Reference Shanas and Kumar2014). Different Sr and Nd isotopes of bulk sediments were reported from the major tributaries of the Indus River (Clift et al. Reference Clift, Gaedicke, Edwards, Lee, Hildebrand, Amjad, White and Schlüter2002a, b) and the postglacial Indus delta (Clift et al. Reference Clift, Giosan, Blusztajn, Campbell, Allen, Pringle, Tabrez, Danish, Rabbani and Alizai2008).
Due to the large total amount of sediment discharge from the rivers, the Indus Fan is the main sediment repository in the Arabian Sea and contains a total of ∼5 × 10⁶ km3 in sediment volume, although it is only about one-third as large as its giant neighbour in the Bay of Bengal (Clift et al. Reference Clift, Shimizu, Layne, Blusztajn, Gaedicke, Schlüter, Clark and Amjad2001). Despite being smaller than the Bengal Fan, the Indus Fan covers 1.1 × 10⁶ km2, stretching 1500 km into the Indian Ocean, and the thickest point of the deposit is greater than 11 km (Clift et al. Reference Clift, Gaedicke, Edwards, Lee, Hildebrand, Amjad, White and Schlüter2002a). Although the age of the Indus Fan remains a subject of debate, one theory is that the initiation of the fan formation was linked to the uplift of the Himalayas, and associated with sea-level lowering during the middle Oligocene to early Miocene (Clift et al. Reference Clift, Shimizu, Layne, Blusztajn, Gaedicke, Schlüter, Clark and Amjad2001). During the International Ocean Discovery Program (IODP) Expedition 355 in 2015, Site U1456 (16°37.28′ N, 68°50.33′ E, 3640 m of water depth) was drilled in Laxmi Basin in the eastern Arabian Sea (Fig. 1). Site U1456 is located offshore of the western margin of India, ∼475 km from the Indian coast and ∼820 km from the modern mouth of the Indus River. Drilling penetration at Site U1456 attained ∼1109.4 m below sea floor (mbsf), reaching 13.5–17.7 Ma (late-early to early-middle Miocene), with only a few hiatuses (Pandey et al. Reference Pandey, Clift and Kulhanek2016). Using the various kinds of sediment properties, lithologic units were defined on board based on a compilation of Holes U1456A to U1456E at Site U1456, in which each lithologic unit was characterized by a different depositional environment (Fig. 2a; Pandey et al. Reference Pandey, Clift and Kulhanek2016). For example, Unit IV (>350 m thick), consisting of claystone and a mixture of light-grey calcarenite/calcilutite and grey breccia with conglomerate, is a massive mass transport deposit corresponding to the Nataraja submarine slide as identified from seismic reflection profiles along the Laxmi Basin (Calvès et al. Reference Calvès, Huuse, Clift and Brusset2015).

Fig. 2. (a) Lithostratigraphy of Site U1456 with down-core profiles of CaCO3 and TOC contents. (b) Schematic columnar section of dominant lithologies of Unit I at Site U1456. (c) Calcareous ooze (Hole U1456A 12H-1, 22–32 cm). (d) Nannofossil-rich clay (Hole U1456A 4H-7, 38–48 cm). (e) Stacked turbidites showing normal grading (Hole U1456A 7H-5, 63–82 cm). (f) Sharp erosional boundary between thick layer of clay and interbedded thin silt layer (Hole U1456A 7H-4, 81–91 cm). (g) Erosional scoured surface at the top of nannofossil ooze (Hole U1456A 10H-4, 94–101 cm). (h) Nannofossil ooze turbidite containing oxidized pyrite (black spot) (Hole U1456A 10H-1, 110–120 cm). All figure panels are modified after Pandey et al. (Reference Pandey, Clift and Kulhanek2016).
Although a variety of analytical tools have been used to elucidate the sediment provenance in the Arabian Sea, the reliability of various tools (e.g. clay minerals, elemental composition and detrital isotopes) in tracing sediment sources continues to be debated. In particular, although Clift & Blusztajn (Reference Clift and Blusztajn2005) is an exception, most studies on sediment provenance have been limited to the last glacial period, and no information has been obtained on sediment provenance over the glacial–interglacial changes at orbital timescales. In this study, we measured Sr and Nd isotopes of the detrital fraction at IODP Site U1456 in the eastern Arabian Sea to trace changes in sediment provenance at the glacial–interglacial timescale over the last 800 ka.
2 Materials and methods
At IODP Site U1456, Lithologic Unit I, estimated as Pleistocene in age by the shipboard biostratigraphy (Pandey et al. Reference Pandey, Clift and Kulhanek2016), forms a ∼121 m thick sequence, consisting mainly of pelagic carbonates (nannofossil ooze and foraminifera-rich nannofossil ooze) interbedded with thin terrigenous layers (clay, silt and sand) showing planar lamination or massive structure (Fig. 2b). The sandy sediment layers are characterized by normal grading and sharp erosional bases and are interpreted as distal basin plain turbidites. The hemipelagic nannofossil ooze and nannofossil-rich clays are intensely bioturbated, and sometimes include common pyrite concretions (Fig. 2c–h). A total of 60 sediment samples were collected based on magnetic susceptibility (MS) changes at a discrete interval from a composite section (Holes U1456A and U1456C) of Unit I at Site U1456. All analytical data are summarized in Table 1 in the Supplementary Material (available at https://doi.org/10.1017/S0016756818000596).
The MS of sediments was measured non-destructively using a Bartington MS2C loop sensor equipped with the Whole-Round Multisensor Logger on board during the expedition (Pandey et al. Reference Pandey, Clift and Kulhanek2016). Prior to grain-size analysis, detrital particles were isolated by removing organic matters and carbonates using diluted H2O2 and HCl, respectively. No step was taken to exclude biogenic opal because it was nearly absent from the samples. Grain-size analysis was conducted using standard sieves for the sand fractions and a Micromeritics SediGraph 5100D for the mud fractions. The mean grain size of detrital particles was calculated following the scheme of Folk & Ward (Reference Folk and Ward1957).
We measured the Sr and Nd isotopic compositions of the detrital fraction of the bulk sediments. These samples were prepared based on a sequential leaching method. In brief, dry bulk sediments were ground with an agate mortar, and ∼1.0 g homogenized sediment samples were leached by 30 mL 1.5M buffered acetic acid for 4 hours at room temperature to remove carbonates. Fe–Mn oxides were then removed using 0.05M hydroxylamine hydrochloride – 25% acetic acid for 4 hours at a temperature of 85 °C (Bayon et al. Reference Bayon, German, Boella, Milton, Taylor and Nesbitt2002). Finally, biogenic silica was removed in 20 mL 1M sodium hydroxide solution for 30 min at a temperature of 80 °C. Each step includes centrifuging and triple rinses with ultrapure water, and the reagents used in the leaching were ultrapure grade. The final residues were dried in an oven at 50 °C, and ∼50 mg of each dried sediment sample was dissolved in a 7 mL Teflon vial by digestion in a mixture of concentrated HF, HNO3 and HClO4 (TAMAPURE-AA-100 from Tama Chemicals, Ltd, Tokyo, Japan) for >18 hours on a hotplate (130–140 °C), in preparation for column chemistry.
Sr and Nd were refined by conventional column chemistry using cation-exchange resin (Mitsubishi diaion CK08P, 75–150 µm) with 1.8M HCl and Eichrom Ln-spec resin (50–100 µm) with 0.25M HCl for rare earth elements (Pin & Zalduegui, Reference Pin and Zalduegui1997). The total procedural blanks for Sr and Nd were negligible (0.05 ng and 0.25 ng, respectively) compared to the amount of Sr and Nd in the samples (>100 ng). Sr and Nd isotopic compositions were measured as Sr+ on Ta single filament and Nd+ on Re triple filaments with thermal ionization mass spectrometers (VG Sector 54-30 and GVI IsoProbe-T, respectively) at Nagoya University. During the measurement, a value of 0.710261 ± 0.000018 (2σ, n = 12) was obtained for the international standard of 87Sr/86Sr, NBS987. All Sr isotope ratios were corrected to an accepted value for the standard of 0.710250. During the measurement, for Nd isotopes, the average value obtained for the JNdi-1 standard was 0.512115 ± 0.000011 (IsoProbe-T, 2σ, n = 16). The average of the standard runs of JNdi-1 was compared to the recommended value of JNdi-1 (0.512115) (Tanaka et al. Reference Tanaka, Togashi, Kamioka, Amakawa, Kagami, Hamamoto, Yuhara, Orihashi, Yoneda and Shimizu2000), and a correction factor was determined for each of the samples analysed on that day.
All reported 87Sr/86Sr and 143Nd/144Nd ratios were corrected for mass fractionation using 86Sr/88Sr = 0.1194 and 146Nd/144Nd = 0.7219, respectively. Nd isotope ratios are expressed as εNd; εNd = parts per 10 000 variation of the 143Nd/144Nd ratio relative to the chondritic uniform reservoir (143Nd/144Nd = 0.512638; Jacobsen & Wasserburg, Reference Jacobsen and Wasserburg1980). Analytical errors (87Sr/86Sr: 0.00001, εNd: 0.19) represent internal 2σ deviations of the mean (2SE).
3 Chronology
The preliminary age model for Site U1456 was determined on board based on biostratigraphy of calcareous nannofossil and planktonic foraminifera, together with magnetostratigraphy (Pandey et al. Reference Pandey, Clift and Kulhanek2016). According to the succession of biostratigraphic events, the age of Site U1456 spans from the lower to middle Miocene to recent, with a few hiatuses (Fig. 2a). The age of Unit I was assigned to the Holocene to the middle Pleistocene. The overall sedimentation rate has been ∼10 to ∼12 cm ka−1 since the late Pliocene, except for the early Pleistocene when the sedimentation rate reached ∼45 cm ka−1 during the deposition of Unit II.
A planktonic foraminiferal oxygen isotope stratigraphy was used to constrain the precise age model for Unit I (Fig. S1 in the Supplementary Material available at https://doi.org/10.1017/S0016756818000596). The details of the age model construction are described in Kim et al. (Reference Kim, Khim, Ikehara and Lee2018). Briefly, a total of 260 samples were collected from a composite section of Unit I consisting of Holes U1456A and U1456C. Oxygen isotope values of monospecific planktonic foraminifera (Globigerinoides ruber) were measured using Isoprime at the Center for Advanced Marine Core Research (Japan). Together with shipboard biostratigraphic and palaeomagnetic data at Site U1456, the established oxygen isotope stratigraphy of Unit I was correlated to LR04 stacks (Lisiecki & Raymo, Reference Lisiecki and Raymo2005), in addition to the correlation of δ15N values to ODP Hole 722B in the western Arabian Sea (Altabet, Murray & Prell, Reference Altabet, Murray and Prell1999). Consequently, the precise age constraint identifies that Unit I is younger than c. 1.2 Ma. The presence of frequent thin turbidite layers, particularly sandy turbidites, intercalated throughout the core makes the construction of a precise chronostratigraphy of Unit I more challenging (Fig. 2b). However, while uncertainty in the graphic correlation used to determine the glacial–interglacial boundaries may be of some importance, it does not significantly alter the interpretation of sediment provenance within the scheme of glacial–interglacial cycles used in this study. Finally, Figure S1 in the Supplementary Material (available at https://doi.org/10.1017/S0016756818000596) provides a continuous record extending down to ∼1.2 Ma (Marine Isotope Stage (MIS) 36), with an average sedimentation rate of ∼14 cm ka−1, fluctuating between 5 and 32 cm ka−1.
4 Results
The variations in Sr and Nd isotopic compositions in the detrital fraction of the bulk sediments from Unit I at Site U1456 are shown in Figure 3. The 87Sr/86Sr ratios and εNd values of Unit I vary from 0.711 to 0.726 and from −12.5 to −7.3, respectively. These results are comparable, although not identical, to the results of previous studies in the eastern Arabian Sea (Fig. 1; Kessarkar et al. Reference Kessarkar, Rao, Ahmad and Babu2003; Clift et al. Reference Clift, Giosan, Blusztajn, Campbell, Allen, Pringle, Tabrez, Danish, Rabbani and Alizai2008; Goswami et al. Reference Goswami, Singh, Bhushan and Rai2012; Limmer et al. Reference Limmer, Böning, Giosan, Ponton, Köhler, Cooper, Tabrez and Clift2012a). Sediments (<14 ka) from the Keti Bandar section drilled at the Indus River mouth are characterized by similar 87Sr/86Sr ratios (0.711–0.728) and slightly lower εNd values (−15.2 to −11.8) (Clift et al. Reference Clift, Giosan, Carter, Garzanti, Galy, Tabrez, Pringle, Campbell, France-Lanord, Blusztajn, Clift, Tada and Zheng2010). Limmer et al. (Reference Limmer, Böning, Giosan, Ponton, Köhler, Cooper, Tabrez and Clift2012a) reported that the εNd values (−12.3 to −10.1) of the Indus-23 core sediments (<1.5 ka) from the Indus Shelf are slightly higher than those of Keti Bandar, but they fall within the range of our results. The 87Sr/86Sr ratio and εNd value of a Holocene sediment from core SK111/22 (located north of Site U1456) are 0.717 and −14.6, whereas those of late Pleistocene sediment from that core are 0.716 and −17.3 (Kessarkar et al. Reference Kessarkar, Rao, Ahmad and Babu2003). Thus, the 87Sr/86Sr ratios of core SK111/22 are similar to our data, but εNd values are quite different. Goswami et al. (Reference Goswami, Singh, Bhushan and Rai2012) reported that core SS-3104G which is located south of Site U1456 shows 87Sr/86Sr ratios (0.714–0.718) and εNd values (−12.8 to −8.8) that are both quite similar to our results.

Fig. 3. Down-core profiles of δ18OLR04 (Lisiecki & Raymo, Reference Lisiecki and Raymo2005), δ18O values of G. ruber (Kim et al. Reference Kim, Khim, Ikehara and Lee2018), 87Sr/86Sr values, εNd ratios, magnetic susceptibility (MS), and mean grain size of Unit I at Site U1456 during the last 800 ka. The blue and red dots in the left panel are δ18O data from Holes U1456A and U1456C, respectively. The shading represents the glacial periods according to marine isotope stage (MIS).
Variations in the pattern of 87Sr/86Sr ratios and εNd values of Unit I at Site U1456 appear to be quasi-cyclic during the last 800 ka (Fig. 3). However, these fluctuations are not clearly coincident with the glacial–interglacial cycles. Nonetheless, we observe systematic variations in the 87Sr/86Sr ratios and εNd values which display a nearly symmetrical variation pattern throughout the core. We also note that these variations are well correlated to MS variations (Fig. 4): low 87Sr/86Sr ratios and high εNd values coincide with low MS, whereas high 87Sr/86Sr ratios and low εNd values coincide with high MS. MS is related very closely to the concentration of terrestrial siliciclastic material; high MS correlates to low CaCO3 layers whereas low MS correlates to high CaCO3 layers (Fig. 2a; Pandey et al. Reference Pandey, Clift and Kulhanek2016). The mean grain size in the detrital fraction mostly falls in the range 8–16 μm, except for several large grains up to 90 μm in size (Fig. 4). In some cases, the mean grain size is larger during high-MS intervals. The mean grain size is not closely related to the 87Sr/86Sr ratios, but does show a weak relationship with the low εNd values. The grain-size distribution pattern is classified into three types (Fig. S2 in the Supplementary Material available at https://doi.org/10.1017/S0016756818000596). The first type is the fine-grained sediments mostly between 10 and 100 μm. The second type is similar to the first type, but also includes a low content of coarse-grained sediments that are much coarser than the third type. The third type is characterized by the distinct peak of coarse-grained sediments comparable to the fine-grained sediments.

Fig. 4. (a) Biplot of 87Sr/86Sr values and εNd ratios of river sediments and drainage basin geologies of western India. Data were compiled from the literatures (Clift et al. Reference Clift, Giosan, Blusztajn, Campbell, Allen, Pringle, Tabrez, Danish, Rabbani and Alizai2008; Tripathy et al. Reference Tripathy, Singh, Bhushan and Ramaswamy2011; Goswami et al. Reference Goswami, Singh, Bhushan and Rai2012; Limmer et al. Reference Limmer, Böning, Giosan, Ponton, Köhler, Cooper, Tabrez and Clift2012a). (b) Biplot of 87Sr/86Sr values and εNd ratios of Unit I at Site U1456 and published data from previous studies (Kessarkar et al. Reference Kessarkar, Rao, Ahmad and Babu2003; Clift et al. Reference Clift, Giosan, Blusztajn, Campbell, Allen, Pringle, Tabrez, Danish, Rabbani and Alizai2008, Reference Clift, Giosan, Carter, Garzanti, Galy, Tabrez, Pringle, Campbell, France-Lanord, Blusztajn, Clift, Tada and Zheng2010; Goswami et al. Reference Goswami, Singh, Bhushan and Rai2012; Limmer et al. Reference Limmer, Böning, Giosan, Ponton, Köhler, Cooper, Tabrez and Clift2012a). Note that the red and blue circles in the lower panel represent the interglacial and glacial 87Sr/86Sr values and εNd ratios of samples at Site U1456.
5 Discussion
5.a Sediment provenance
5.a.1 Sediment provenance of fluvial and marine sediments
The origins and source areas of the sediments in the eastern Arabian Sea offshore of the western coast of India have been documented in several previous studies (Rao & Rao, Reference Rao and Rao1995; Thamban et al. Reference Thamban, Rao and Schneider2002; Kessarkar et al. Reference Kessarkar, Rao, Ahmad and Babu2003; Garzanti et al. Reference Garzanti, Vezzoli, Ando, Paparella and Clift2005; Goswami et al. Reference Goswami, Singh, Bhushan and Rai2012; Limmer et al. Reference Limmer, Böning, Giosan, Ponton, Köhler, Cooper, Tabrez and Clift2012a, b; Das et al. Reference Das, Rai, Akaram, Verma, Pandey, Dutta and Prasad2013; Akaram et al. Reference Akaram, Das, Rai and Mishra2015; Avinash et al. Reference Avinash, Kurian, Warrier, Shankar, Vineesh and Ravindra2016; Jonell et al. Reference Jonell, Li, Blusztajn, Giosan and Clift2018). Recently, studies using Sr and Nd isotopic composition of detrital silicates revealed the precise provenance of these sediments and the weathering history of the source silicates as a function of monsoon activity in the eastern Arabian Sea (e.g. Goswami et al. Reference Goswami, Singh, Bhushan and Rai2012). Similar studies had previously been carried out in neighbouring oceans such as the Bay of Bengal and the Andaman Sea (Colin et al. Reference Colin, Turpin, Bertaux, Desprairies and Kissel1999, Reference Colin, Turpin, Blamart, Frank, Kissel and Duchamp2006; Ahmad et al. Reference Ahmad, Anil Babu, Padmakumari, Dayal, Sukhija and Nagabhushanam2005; Tripathy et al. Reference Tripathy, Singh, Bhushan and Ramaswamy2011; Awasthi et al. Reference Awasthi, Ray, Singh, Band and Rai2014; Joussain et al. Reference Joussain, Colin, Liu, Meynadier, Fournier, Fauquembergue, Zaragosi, Schmidt, Rojas and Bassinot2016). It should be noted that tracing the sources of detrital marine sediments (and the spatio-temporal variations in those sources) using Sr and Nd isotopic composition requires assuming that the terrigenous marine sediments are the erosional products of continental basement rocks. Several lines of evidence support this assumption. Because early studies found an insignificant contribution to sediments from aeolian dust (e.g. Sirocko & Sarnthein, Reference Sirocko, Sarnthein, Leinen and Sarnthein1989), most sediments in the eastern Arabian Sea are thought to have been transported from the various rivers distributed along the western coast of India (e.g. Indus, Narmada, Tapi, Mahi and other small rivers and streams). For example, studies on clay minerals of surface sediments in the Arabian Sea documented that the dominant illite is principally derived from the Lesser Himalaya and Higher Himalaya (Kolla et al. Reference Kolla, Henderson and Biscaye1976, Reference Kolla, Kostecki, Robinson, Biscaye and Ray1981; Borole et al., Reference Borole, Sarin and Somayajulu1982), while the smectite is derived mostly from the Deccan Trap terrain (Ramaswamy et al. Reference Ramaswamy, Nair, Manganini, Haake and Ittekkot1991) and subordinately from the Indus River (Alizai et al. Reference Alizai, Hillier, Clift and Giosan2012). However, the possibility of additional sediment transport by ocean current from the Bay of Bengal to the SE Arabian Sea is still under debate (Ramaswamy & Nair, Reference Ramaswamy and Nair1989; Chauhan & Gujar, Reference Chauhan and Gujar1996; Kessarkar et al. Reference Kessarkar, Rao, Ahmad and Babu2003; Chauhan et al. Reference Chauhan, Dayal, Basavaiah and Kader2010).
The Sr and Nd isotopic compositions of river sediments and drainage basin rocks in India have been reported by several previous studies (Peucat et al. Reference Peucat, Vidal, Bernard-Griffiths and Condie1989; Harris et al. Reference Harris, Santosh and Taylor1994; Clift et al. Reference Clift, Gaedicke, Edwards, Lee, Hildebrand, Amjad, White and Schlüter2002a, b, Reference Clift, Giosan, Blusztajn, Campbell, Allen, Pringle, Tabrez, Danish, Rabbani and Alizai2008, Reference Clift, Giosan, Carter, Garzanti, Galy, Tabrez, Pringle, Campbell, France-Lanord, Blusztajn, Clift, Tada and Zheng2010; Chakrabarti et al. Reference Chakrabarti, Basu and Chakrabarti2007; Singh et al. Reference Singh, Rai and Krishnaswami2008; Ahmad et al. Reference Ahmad, Padmakumari and Babu2009; Tripathy et al. Reference Tripathy, Singh, Bhushan and Ramaswamy2011; Goswami et al. Reference Goswami, Singh, Bhushan and Rai2012). These studies demonstrate that most river sediments have inherited the primary signature of Sr and Nd isotopic compositions from the drainage basin geology. Clift & Blusztajn (Reference Clift and Blusztajn2005) reported that the evolution of the river drainage basin has altered the isotopic composition of river sediments. However, Chirouze et al. (Reference Chirouze, Huyghe, Chauvel, van der Beek, Bernet and Mugnier2015) revealed that the earlier drainage capture model was incorrect. Figure 4a compiles all available Sr and Nd isotope data of river sediments and drainage basin rocks in India. For example, Clift et al. (Reference Clift, Giosan, Blusztajn, Campbell, Allen, Pringle, Tabrez, Danish, Rabbani and Alizai2008) reported that the εNd values of the older rocks of the Indian craton and Lesser Himalaya are the most negative (−26 to −23), whereas those of the more primitive arc rocks of the Indus Suture Zone and Transhimalaya are somewhat positive (−1 to +8), and those of the Higher Himalaya and Karakoram are distinctly intermediate (−17 to −12 and −12 to −8, respectively). On the basis of the previous studies (Tripathy et al. Reference Tripathy, Singh, Bhushan and Ramaswamy2011; Goswami et al. Reference Goswami, Singh, Bhushan and Rai2012; Limmer et al. Reference Limmer, Böning, Giosan, Ponton, Köhler, Cooper, Tabrez and Clift2012a) and the drainage basin geology of the rivers discharging into the eastern Arabian Sea, we selected several main end-member types represented by different lithologic components: Deccan Basalt (87Sr/86Sr; 0.71, εNd; −5.0); Peninsula Granite/Gneiss (87Sr/86Sr; 0.71, εNd; −29); Lesser Himalaya (87Sr/86Sr; 0.85, εNd; −25); Higher Himalaya (87Sr/86Sr; 0.76, εNd; −15); Vindhyan Super Group (87Sr/86Sr; 0.9, εNd; −19); and Bela Ophiolite (87Sr/86Sr; 0.71, εNd; +4.5).
The Indus River is very large (∼2900 km long; basin area ∼106 km2). It flows from Tibet to the Arabian Sea, crossing the Western Himalayan Syntaxis, which was formed by the underthrusting of the Indian passive margin beneath the Asian active margin at ∼55 Ma (Rowley, Reference Rowley1996; Najman et al. Reference Najman, Appel, Boudagher-Fadel, Bown, Carter, Garzanti, Godin, Han, Liebke, Oliver, Parrish and Vezzoli2010; DeCelles et al. Reference Decelles, Kapp, Gehrels and Ding2014). The Indus River is composed of numerous large tributaries draining a largely elevated and tectonically active basin occupying western Tibet, the Tethyan Himalaya (Lesser Himalaya and Higher Himalaya) and the Karakoram, known as the Indus Suture Zone (Fig. 1a; Inam et al. Reference Inam, Clift, Giosan, Tabrez, Tahir, Rabbani, Danish and Gupta2007). Clift et al. (Reference Clift, Lee, Hildebrand, Shimizu, Layne, Blusztajn, Blum, Garzanti and Khan2002b) reported that the εNd values of sediments collected in the different areas of the Indus River drainage basin reliably correspond to the signature of the basement being drained, although εNd values of the Indus River system are extremely diverse, varying from −30 to −1. The modern Indus River sediments are thought to be supplied mainly from the exhumation of the Lesser Himalaya (41%) and/or Higher Himalaya (38%) with Karakoram/Transhimalaya (19%), although the relative contributions have changed substantially since the Last Glacial Maximum (Clift et al. Reference Clift, Giosan, Blusztajn, Campbell, Allen, Pringle, Tabrez, Danish, Rabbani and Alizai2008). Other major rivers such as the Narmada and the Tapi drain different geological areas (Fig. 1b). The Narmada flows through the Vindhyan Super Group and the Deccan Basalt (Gupta et al. Reference Gupta, Chakrapani, Selvaraj and Kao2011), whereas the Tapi River largely passes through the Deccan Basalt (Kale et al. Reference Kale, Mishra and Baker2003). The 87Sr/86Sr ratios and εNd values of the small rivers and streams discharged from the Western Ghats are also set by their drainage basin characteristics (Goswami et al. Reference Goswami, Singh, Bhushan and Rai2012).
The possible different sediment sources to Site U1456 in the Laxmi Basin have characteristic Sr and Nd isotopic compositions (Fig. 4b). The Tapi River supplies sediments of less radiogenic Sr (0.710) and more radiogenic Nd (−5.8) isotopes, representing a sediment source influenced by the Deccan Basalt. The Mahi River discharges sediments characterized by the most radiogenic Sr (0.731) and quite unradiogenic Nd (−20.3) isotopes because it drains multi-lithological terrain consisting of the Vindhyan Super Group, the Deccan Basalt and other metamorphic rocks (Sridhar, Reference Sridhar2008). The 87Sr/86Sr ratio and εNd values of the Indus River (0.722 and −13.5) and Narmada River (0.721 and −11.9) are somewhat similar, although these two rivers pass through totally different lithologic drainage basins (Fig. 1b). The Indus River sediments are eroded mostly from the Higher Himalaya and/or Lesser Himalaya, but the Narmada River sediments contain contributions from both the Vindhyan Super Group, with more radiogenic Sr and unradiogenic Nd isotopes, and the Deccan Basalt, with less radiogenic Sr and highly radiogenic Nd isotopes. Clift et al. (Reference Clift, Giosan, Blusztajn, Campbell, Allen, Pringle, Tabrez, Danish, Rabbani and Alizai2008) suggested from the Indus Delta drilling at Keti Bandar (Fig. 1a) that the εNd value of the Indus River was more radiogenic (−10.8) during the last glacial period. The decrease of the εNd value toward −14.0 during the Holocene was attributed, not to drainage reorganization, but to an increase in erosion in the Lesser Himalaya due to intensified summer monsoon precipitation and a decrease in the erosion of terrains in the Indus Suture Zone (which were dominant during the last glacial period) (Clift et al. Reference Clift, Giosan, Carter, Garzanti, Galy, Tabrez, Pringle, Campbell, France-Lanord, Blusztajn, Clift, Tada and Zheng2010). Both the glacial sediments of the Indus Delta and the surface sediments in the deep sea Indus Canyon showed a similar εNd value (−10.8), demonstrating that the Indus River discharge during the last glacial period had a different isotopic composition from the interglacial value (Clift et al. Reference Clift, Giosan, Blusztajn, Campbell, Allen, Pringle, Tabrez, Danish, Rabbani and Alizai2008).
Our results confirm the previous studies (Garzanti et al. Reference Garzanti, Vezzoli, Ando, Paparella and Clift2005; Avinash et al. Reference Avinash, Kurian, Warrier, Shankar, Vineesh and Ravindra2016), suggesting that the Unit I sediments at Site U1456 have multiple provenances (Fig. 4b). Interestingly, 87Sr/86Sr ratios and εNd values of sediments are not divided distinctly following the glacial and interglacial cycles, suggesting that the sediment provenance did not change systematically between the glacial and interglacial periods at Site U1456. The linear correlation between the Sr and Nd isotope compositions of these sediments reflects the dominant contributions of two important end-members: one is the Narmada and Indus Rivers and the other is the Tapi River. Although the Mahi River discharges sediments with the most radiogenic Sr and fairly unradiogenic Nd isotopes in the north of the Narmada River, its contribution to Site U1456 seems to be minor. It is difficult to distinguish between the Narmada and Indus Rivers on the basis of 87Sr/86Sr ratios and εNd values, and thus the relative contributions of the individual rivers cannot be estimated. Use of another tracer might allow for differentiation between the two rivers. The contribution of sediment discharge by the Narmada River seems to be more significant than that of the Indus River. As mentioned above, the 87Sr/86Sr ratio and εNd value of the glacial sediments of the Indus River (Clift et al. Reference Clift, Giosan, Blusztajn, Campbell, Allen, Pringle, Tabrez, Danish, Rabbani and Alizai2008) differ somewhat from the Holocene sediments (Fig. 4b). Although precipitation and river discharge decreased during the glacial period due to the enhanced winter monsoon, the role of the Indus River during the glacial period when the sea level was low should not be dismissed. Therefore, the 87Sr/86Sr ratio and εNd value clearly indicate that the sediments in the Laxmi Basin of the eastern Arabian Sea have been supplied from the Tapi River, Narmada River and Indus River during the last 800 ka. In addition, variation of these isotope values is not related to orbital-scale glacial and interglacial cycles that closely influenced the monsoon strength and its sediment discharge. We note that Avinash et al. (Reference Avinash, Kurian, Warrier, Shankar, Vineesh and Ravindra2016) also reported that the deep sea surficial sediments of the eastern Arabian Sea are influenced by different terrigenous sources, including the Indus–Narmada–Tapti Rivers and southern Indian rivers, based on the spatial distribution patterns of various sediment provenance proxies (environmental magnetism, geochemistry, particle size and clay mineralogy).
Our results are comparable to other published 87Sr/86Sr ratios and εNd values of sediments in the eastern Arabian Sea (Fig. 4b), although direct comparison of these data may be biased due to differences in analytical procedures, the absence or presence of carbonate, and the selection of bulk sediments versus fine fractions. The previously reported 87Sr/86Sr ratios and εNd values of the modern Indus Delta at Keti Bandar (<14 ka) are a little higher and lower, respectively, than those reported here, because these isotopes only represent inputs from the Indus River (Clift et al. Reference Clift, Giosan, Carter, Garzanti, Galy, Tabrez, Pringle, Campbell, France-Lanord, Blusztajn, Clift, Tada and Zheng2010). Kessarkar et al. (Reference Kessarkar, Rao, Ahmad and Babu2003) also reported that the Holocene sediments of core SK111/22 were mainly transported from the Indus River, but their 87Sr/86Sr ratios and εNd values were higher and slightly lower, respectively, than those of Keti Bandar (<14 ka) and Site U1456 (Fig. 4b). The main reason for this discrepancy may be the measurement of different sediment grain sizes, because Kessarkar et al. (Reference Kessarkar, Rao, Ahmad and Babu2003) used the fine-grained (<2 μm) fraction. Another possible reason is more sediment flux from the Deccan Plateau to the core site SK111/22. Although core Indus-23 (<1.5 ka) was recovered from the Indus Shelf offshore of the Indus River mouth, its 87Sr/86Sr ratios and εNd values are less and more radiogenic, respectively, than those of Keti Bandar at the modern Indus Delta (Limmer et al. Reference Limmer, Böning, Giosan, Ponton, Köhler, Cooper, Tabrez and Clift2012a). The lower 87Sr/86Sr ratios of Indus-23 (<1.5 ka) from the Indus Shelf may result from the higher carbonate content in that core leading to a supplementary isotopic contribution to the detrital fraction. In contrast, slightly higher εNd values of Indus-23 (<1.5 ka) reflect an additional contribution from a different sediment source (i.e. Bela Ophiolite; Fig. 5a). The data also indicate that the Sr and Nd isotope compositions of the shallow Indus Shelf (Limmer et al. Reference Limmer, Böning, Giosan, Ponton, Köhler, Cooper, Tabrez and Clift2012a) display a much wider range than those of the Indus River, and the isotopic compositions of the deep sea Indus Canyon are close to those of the Indus River (Li et al. Reference Li, Clift, Boening, Guilderson, Giosan and Schneider2015). The 87Sr/86Sr ratios and εNd values of core SS-3104G, which covers the past 40 ka, overlap closely with our results (Fig. 4b). According to Goswami et al. (Reference Goswami, Singh, Bhushan and Rai2012), the very narrow range of isotope variation in core SS-3104G in the eastern Arabian Sea suggests that many rivers should be considered as potential sources (such as the Indus, Narmada and Tapi including other Western Ghats streams).
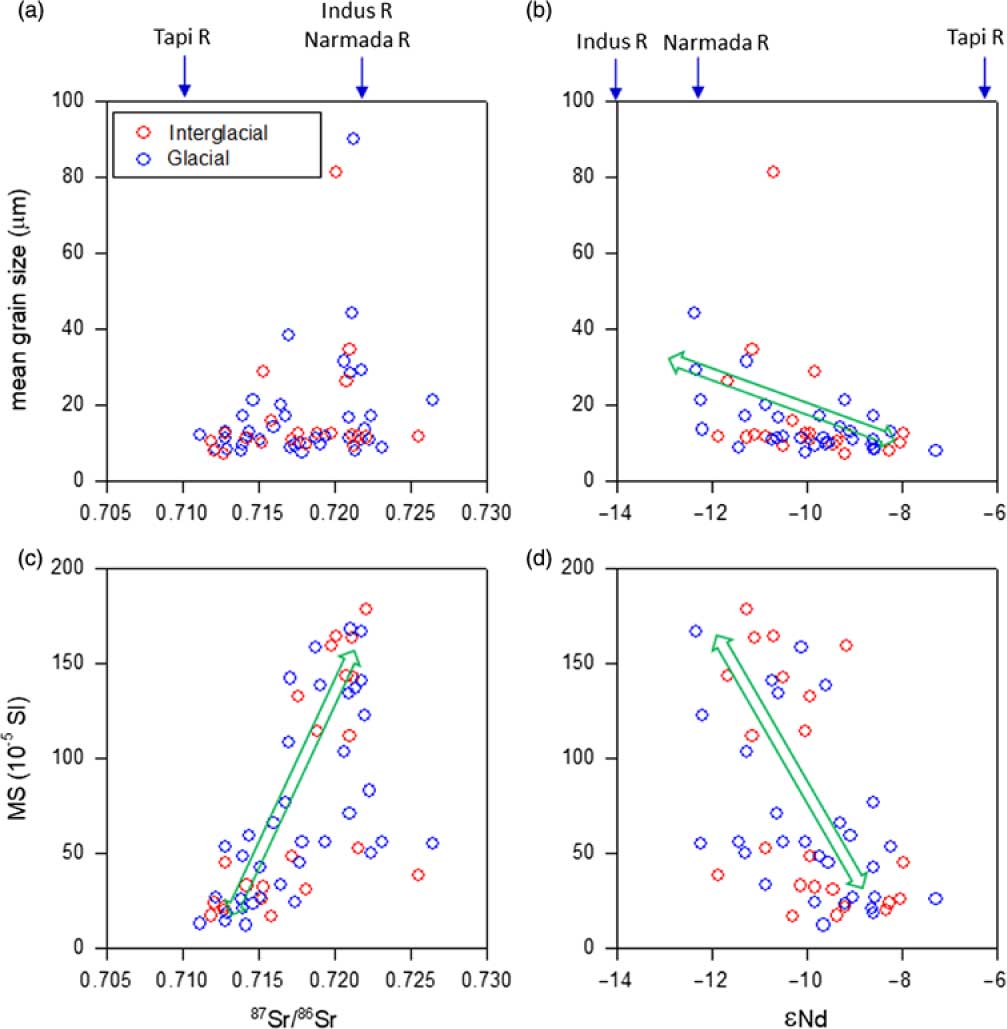
Fig. 5. (a) Correlation between mean grain size and 87Sr/86Sr values of Unit I. (b) Correlation between mean grain size and εNd ratios of Unit I. (c) Correlation between magnetic susceptibility (MS) and 87Sr/86Sr values of Unit I. (d) Correlation between MS and εNd ratios of Unit I. Note that the red and blue circles the interglacial and glacial samples. The locations in this space of the sediment provenance signatures of the rivers considered here are marked by blue arrows above the figure.
Since the collision between the Indian Plate and Eurasia, the modern Indus River’s drainage basin systems have mostly developed within the tectonic blocks of the Indus Suture Zone. Roddaz et al. (Reference Roddaz, Said, Guillot, Antoine, Montel, Martin and Darrozes2011) measured the Sr–Nd isotopic composition of middle Eocene to early Miocene rocks in the Himalaya region, revealing a shift toward more radiogenic Sr–Nd isotopic compositions as the result of the exhumation and erosion of the Tethyan Himalaya. Older (50–30 Ma) sedimentary deposits were subject to larger contributions from the Karakoram and the Tethyan Himalaya, whereas the major contributions to the younger (30–15 Ma) sedimentary deposits were from the Tethyan belt and the Higher Himalayan Crystallines, with smaller contributions from the Karakoram, Ophiolitic Suture (mostly Kohistan) and Transhimalaya (Roddaz et al. Reference Roddaz, Said, Guillot, Antoine, Montel, Martin and Darrozes2011). Thus, the evolution of the Indus River drainage basin indicates that the Sr–Nd isotope signatures of the sediments allow discrimination between the older (50–30 Ma; 0.708–0.712, −9.8 to −8.5) and younger (30–15 Ma; 0.712–0.724, −13.3 to −9.9) periods. Clift et al. (Reference Clift, Shimizu, Layne, Blusztajn, Gaedicke, Schlüter, Clark and Amjad2001) reported εNd values of Indus Fan sediments at DSDP Site 224 in the Owen Ridge of the western Arabian Sea. The authors found that the εNd values at DSDP Site 224 are very similar between the middle Eocene to middle Oligocene (from −13.1 to −10.9 and mean c. −11.9) and the late Oligocene to early Miocene (from −12.4 to −11.1 and mean c. −11.5). This implies that from the middle Eocene to early Miocene, the Indus River sediments were eroded mainly within the drainage north of the Indus Suture Zone. Based on the εNd values of industrial well Indus Marine A-1, however, Clift & Blusztajn (Reference Clift and Blusztajn2005) discovered that a dramatic switch in Nd isotopic character occurred after 5 Ma, decreasing toward −15 (i.e. the εNd value of the modern Indus Delta sand; Clift et al. Reference Clift, Lee, Hildebrand, Shimizu, Layne, Blusztajn, Blum, Garzanti and Khan2002b), although this value (−15) is a little lower than that of the modern river in the mixing calculation plot (Fig. 4b). This change in the εNd value is attributed to a rerouting of the major tributaries of the Indus River within the drainage basin, supplying more erosional products from the Himalayan sources. However, this model of widespread drainage rearrangement is contradicted by the recent finding that the isotopic shift was caused by enhanced erosion of rocks in the Nanga Parbat syntaxis (Chirouze et al. Reference Chirouze, Huyghe, Chauvel, van der Beek, Bernet and Mugnier2015). Nonetheless, our results validate the assumption that over the study interval of the last 800 ka, the Indus River has not undergone a route shift in the drainage, and thus the sediment provenance has remained consistent.
5.a.2 Effects on detrital sediment isotopes
As summarized by Blum & Erel (Reference Blum, Erel and Drever2003), it is well established that the Sr isotopic ratios of detrital particles are more dependent on the grain size than Nd isotopes, especially in the case of aeolian dust. The main control on the relationship between Sr and Nd isotopic compositions and grain size may be geochemical processes, as Rb and Sr have different reaction rates, but the reaction rates between Sm and Nd are similar. Since it was first reported by Dasch (Reference Dasch1969), the increase of 87Sr/86Sr ratios with decreasing grain size of aeolian dust has been confirmed repeatedly due to the fractionation during the chemical weathering (Asahara et al. Reference Asahara, Tanaka, Kamioka, Nishimura and Yamazaki1999; Cole et al. Reference Cole, Goldstein, Hemming and Grousset2009; Feng et al. Reference Feng, Zhu, Zhen and Hu2009). Recently, Jonell et al. (Reference Jonell, Li, Blusztajn, Giosan and Clift2018) reported that 87Sr/86Sr ratios of fine-grained size fraction in the Indus Delta sediments are attributed to K-feldspar, mica, epidote and/or volcanic clay minerals. In our study 87Sr/86Sr ratios and mean grain size are entirely unrelated (Fig. 5a). Thus, sediment provenance is a more important factor for controlling 87Sr/86Sr ratios than the hydrodynamic sorting or grain-size fraction at Site U1456. In this study, analytical error of replicates shows that Δ87Sr/86Sr is only 0.00001. Because we did not measure 87Sr/86Sr ratios for the grain-size fraction, the uncertainties in Sr isotopic measurement cannot be estimated. If we adopt uncertainties of Δ87Sr/86Sr values (0.01243) from Jonell et al. (Reference Jonell, Li, Blusztajn, Giosan and Clift2018), the variation (0.15) of Δ87Sr/86Sr values at Site U1456 exceeds the uncertainties, emphasizing that the sediment provenance change played a critical role in Δ87Sr/86Sr values.
Most studies have shown that Nd isotopic ratios were known to be unaffected by particle size (e.g. Meyer et al. Reference Meyer, Davies and Stuut2011), but the influence of grain size on Nd isotope ratios was demonstrated by Jonell et al. (Reference Jonell, Li, Blusztajn, Giosan and Clift2018), showing that different mineralogy of grain-size fraction controls Nd isotopic compositions. For example, high εNd values of the fine-grained size fraction are due to monazite and allanite, whereas low εNd values of coarse-grained size fraction are controlled by mica. In this study, εNd values show a relationship with mean grain size in which the coarse-grained particles are characterized by less radiogenic Nd isotopes (Fig. 5b). This trend contradicts the results of Jonell et al. (Reference Jonell, Li, Blusztajn, Giosan and Clift2018) in the Indus Delta. The opposite trend between this study and Jonell et al. (Reference Jonell, Li, Blusztajn, Giosan and Clift2018) may be the different component of sediment provenances. Jonell et al. (Reference Jonell, Li, Blusztajn, Giosan and Clift2018) examined the bulk sediments of mono sediment provenance in the Indus Delta, whereas this study reveals that the sediment provenances are mixed in the Laxmi Basin.
Comparing εNd values among the Indus Canyon, Indus Shelf, Indus River mouth, and suspended clay-rich sediment from the modern Indus River (Goldstein et al. Reference Goldstein, O’nions and Hamilton1984; Clift et al. Reference Clift, Lee, Hildebrand, Shimizu, Layne, Blusztajn, Blum, Garzanti and Khan2002b, Reference Clift, Giosan, Blusztajn, Campbell, Allen, Pringle, Tabrez, Danish, Rabbani and Alizai2008, Reference Clift, Giosan, Carter, Garzanti, Galy, Tabrez, Pringle, Campbell, France-Lanord, Blusztajn, Clift, Tada and Zheng2010), Limmer et al. (Reference Limmer, Böning, Giosan, Ponton, Köhler, Cooper, Tabrez and Clift2012a) also raised the possibility of grain-size control on Nd isotope character, but deemed it unlikely as they did not find a correlation between εNd values and Si/Al ratios. However, the εNd values measured from the <2 μm size fraction of core SK111/22 are lower than those measured from bulk sediments in other cores such as Site 1456 and the previously studied cores (SS-3104G, Keti Bandar, and Indus-23) (Fig. 4b). Without chemical composition data for bulk sediments, we cannot test the validity of grain-size control on Nd isotope composition. Regardless, grain-size control on Nd isotopic composition is unlikely to be straightforward, as shown by the opposite revealed by this study and Jonell et al. (Reference Jonell, Li, Blusztajn, Giosan and Clift2018). While most previous studies on sediment provenance using Sr–Nd isotopes have used bulk sediments or a specific size fraction, the incorporation of individual detritus grains into bulk sediments may depend on the grain size (e.g. Holz et al. Reference Holz, Stuut, Henrich and Meggers2007). Furthermore, we note that sediment transport processes are grain-size dependent, such that different grain-size fractions in discharged river-derived materials may be preferentially transported to different depositional sites. The analytical error of replicates in this study is c. 0.19 for ΔεNd. As in the case of the 87Sr/86Sr ratios, the uncertainties in εNd values related to grain size cannot be estimated. However, the uncertainties of ΔεNd values (0.6) reported by Jonell et al. (Reference Jonell, Li, Blusztajn, Giosan and Clift2018) are insignificant, compared to the variation (5.2) of ΔεNd values at Site U1456. Thus, our results confirm that the sediments in the Laxmi Basin are mixed by different sediment provenances.
Although the long-term evolution of monsoon strength is mainly controlled by tectonic uplift (Clift et al. Reference Clift, Giosan, Carter, Garzanti, Galy, Tabrez, Pringle, Campbell, France-Lanord, Blusztajn, Clift, Tada and Zheng2010), short-term changes in monsoon strength are caused primarily by the glacial–interglacial cycles. The Arabian Sea experiences the strong SW monsoon during summer, with very high rainfall (>3000 mm). The degree of chemical weathering may increase during warmer and wetter conditions such as summer monsoon (Valdiya, Reference Valdiya1999; West et al. Reference West, Galy and Bickle2005). 87Sr/86Sr ratios of detrital silicates have been used to track the degree of chemical weathering, because Sr is released more easily than Rb from the source rocks during chemical weathering (e.g. Blum & Erel, Reference Blum, Erel and Drever2003). In contrast, Nd isotopes are unaffected by chemical weathering, and thus εNd values of detrital particles have been regarded as reliable indicators for the provenance of terrigenous particles (e.g. Blum & Erel, Reference Blum, Erel and Drever2003). For example, in the Andaman Sea and the Bay of Bengal, Colin et al. (Reference Colin, Turpin, Bertaux, Desprairies and Kissel1999) reported that the interglacial sediments are characterized by similar εNd values and lower 87Sr/86Sr ratios than the glacial sediments, which is attributed to more chemical weathering during sediment transportation under the warm and wet climate conditions during the interglacial period. Limmer et al. (Reference Limmer, Köhler, Hillier, Moreton, Tabrez and Clift2012b) investigated the degree of chemical weathering in the Indus Shelf of the northern Arabian Sea and reported that the period of the maximum summer monsoon corresponds to stronger chemical weathering, based on the multi-proxy mineral record showing high smectite/(illite+chlorite) ratio, low illite crystallinity and high hematite/goethite ratio. More intense chemical weathering was confirmed by the negative correlation between 87Sr/86Sr and K/Al ratios (Limmer et al. Reference Limmer, Böning, Giosan, Ponton, Köhler, Cooper, Tabrez and Clift2012a). However, it should be noted that their samples include the carbonate fraction and that these data were limited to ages younger than 15 ka. Thus, it is difficult to conclude with certainty that the degree of chemical weathering follows the glacial–interglacial cycles. Monsoon rains also play an important role in controlling erosional pattern in the river drainage basin at least over orbital and even millennial timescales. Because the Indus River drainage is affected by the summer monsoon precipitation (Bookhagen & Burbank, Reference Bookhagen and Burbank2006), Clift et al. (Reference Clift, Giosan, Carter, Garzanti, Galy, Tabrez, Pringle, Campbell, France-Lanord, Blusztajn, Clift, Tada and Zheng2010) suggested that the rain shadow moves between the Lesser Himalaya and the Higher Himalaya following the glacial–interglacial cycles. However, the 87Sr/86Sr ratios and εNd values at Site U1456 do not show a clear glacial–interglacial cyclic pattern, which implies that another factor may influence these variations (Fig. 4). For example, the influence of sea level differed between the shallow water delta of earlier studies and the deep basin of this study, by buffering the sediments in the delta during high sea level and reworking during low sea level.
5.b Implications for the relationship between sediment provenance and depositional processes
At Site U1456, Unit I consists mainly of pelagic carbonates (nannofossil ooze and foraminifera-rich nannofossil ooze) interbedded with thin terrigenous (clay, silt and sand) layers (Fig. 2b), representing the pelagic sedimentation and distal turbidite deposition in the Indus Fan, respectively (Pandey et al. Reference Pandey, Clift and Kulhanek2016). The carbonate-rich pelagic sediments and clastic-rich turbidite layers are distinguished by MS, which is generally higher for the terrigenous sediments than for the carbonate sediments (Fig. 3). The relationships are clearly shown in Figure 5c and d: the high-MS intervals (i.e. turbidites) correspond to high 87Sr/86Sr ratios and low εNd values, whereas the low-MS intervals (i.e. pelagic sediments) coincide with low 87Sr/86Sr ratios and high εNd values (Fig. 3). Figure 5c, d also shows that the high-MS sediments (i.e. turbidite deposition) characterized by high 87Sr/86Sr ratios and low εNd values are associated with the sediment provenances of the Indus River and an unknown additional input from the Narmada River, whereas the low-MS sediments (i.e. pelagic sedimentation) characterized by low 87Sr/86Sr ratios and high εNd values are likely related to the sediment provenance of the Tapi River. Thus, the 87Sr/86Sr ratios and εNd values of the detrital fraction at Unit I of Site U1456 may be controlled not only by the sediment provenance but also by depositional processes (pelagic sedimentation versus turbidite deposition) mainly controlled by orbital-scale sea-level change.
In the submarine fan system, sediments are transported from the shallow continental shelf to the deep sea floor via deep sea channels or submarine canyons (e.g. McHargue & Webb, Reference McHargue and Webb1986). It is through these channels and canyons that the turbidity current flows to transport the sediments. The turbidity current, rather than the basinward transfer of suspended material bypassing the continental shelves, is the main depositional process involved in building the deep sea fan (e.g. Bourget et al. Reference Bourget, Zaragosi, Rodriguez, Fournier, Garlan and Chamot-Rooke2013). Kolla & Coumes (Reference Kolla and Coumes1987) reported numerous high-relief channel/levee systems rather on the continental slope and rise. Furthermore, based on a high-resolution multi-beam swath bathymetry survey in the middle of the Indus Fan, Mishra et al. (Reference Mishra, Pandey and Ramesh2015) revealed the presence of sinuous channel systems that play an important role in transporting sediments toward the distal submarine fan. Analogously to the Bengal Fan, the turbidity currents are the dominant depositional processes in the formation of the Indus Fan, although the submarine scar and mass slump deposits were observed and the pelagic sedimentation occurs during the cessation of turbidite sedimentation in the Indus Fan (e.g. Rodriguez et al. Reference Rodriguez, Fournier, Chamot‐Rooke, Huchon, Bourget, Sorbier, Zaragosi and Rabaute2011, Reference Rodriguez, Fournier, Chamot‐Rooke, Huchon, Zaragosi and Rabaute2012). Thus, it is clear that growth of the Indus Fan depends on sediment transport by the turbidity current as well as on the by-passing of pelagic suspension to the deep sea floor. Increasing sediment transport by turbidity currents may have played a more important role under low-sea-level conditions, when the river channel and canyon advanced toward the deeper part of the basin. In contrast, during high-sea-level conditions, most of the sediments were trapped in the shallow marine environment, preventing the turbidity current from transporting the sediments to the deep sea basin, and instead allowing pelagic sedimentation to become the dominant contributor to the growth of the Indus Fan. For example, Clift & Giosan (Reference Clift and Giosan2014) reported the sediment budget during the Holocene sea-level stand, such as approximately half of the sediments in the shallow marine environment and the other half under the terrestrial delta, with <1% entering the submarine canyon.
The evolution of large river-fed turbidite systems in the Indus Fan is closely related to the glacio-eustatic sea-level change and position of the deltaic shoreline (von Rad & Tahir, Reference von Rad and Tahir1997; Mouchot et al. Reference Mouchot, Loncke, Mahieux, Bourget, Lallemant, Ellouz-Zimmermann and Leturmy2010; Bourget et al. Reference Bourget, Zaragosi, Rodriguez, Fournier, Garlan and Chamot-Rooke2013). For example, Bourget et al. (Reference Bourget, Zaragosi, Rodriguez, Fournier, Garlan and Chamot-Rooke2013) established turbidite stratigraphy in the Owen Fracture Zone (20° N pull-apart basin) of the western Arabian Sea and emphasized the importance of sea-level control on sediment transfer through the channel–levee systems in forming these Indus River-fed megaturbidites. In addition, Prins et al. (Reference Prins, Postma, Cleveringa, Cramp and Kenyon2000) reported that the upper fan of the Indus Fan ceased activity after 10 ka. At the short-term (i.e. orbital) timescale, the development of the turbidite system in the Indus Fan may have been generally activated by enhanced sediment loads resulting from increased run-off from a mixture of monsoon precipitation and snow melt, because glacial and fluvially reworked detritus was easily eroded from the high-relief, rapidly uplifting mountains (Giosan et al. Reference Giosan, Constantinescu, Clift, Tabrez, Danish and Inam2006). At Site U1456, turbidite layers occurred frequently during the glacial periods, but some turbidites were also found during the interglacial periods (Fig. 3). Thus, the linkage between the development of turbidites and climate-induced sediment transfer in the Indus sedimentary system is not always consistent. Similarly, Bourget et al. (Reference Bourget, Zaragosi, Rodriguez, Fournier, Garlan and Chamot-Rooke2013) reported that the relationship between 20° N Basin megaturbidites and the Indian Summer Monsoon stack of Caley et al. (Reference Caley, Malaizë, Zaragosi, Rossignol, Bourget, Eynaud, Martinez, Giraudeau, Charlier and Ellouz-Zimmermann2011) was poorly organized. Nevertheless, it is clear that the turbidite deposits characterized by high 87Sr/86Sr ratios and low εNd values reflect more sediment transport from the Indus and/or Narmada Rivers (Fig. 5c and d).
Prins et al. (Reference Prins, Postma, Cleveringa, Cramp and Kenyon2000) reported that thin pelagic sediments were interbedded within thick turbidite depositions at ODP Site 720 in the Owen Ridge of the western Arabian Sea. In contrast, at Unit I of Site U1456 in the eastern Arabian Sea, thin turbidite layers were interbedded within thick pelagic sediments (Fig. 2b). These pelagic sediments contain high CaCO3 contents consisting mainly of biogenic particles (Pandey et al. Reference Pandey, Clift and Kulhanek2016), clearly reflecting a decrease in clastic influx during sea-level highstand. The reduced terrigenous sediments may be a result of channel switching, abandonment or burial of active channel. Kolla & Coumes (Reference Kolla and Coumes1987) discovered a major eastward shift of active channel deposition in the Indus Fan during the Pleistocene sea-level lowering. In addition, the different types of grain-size distribution patterns represent the degree of mixing between the detrital fine-grained and coarse-grained particles (Fig. S2 in the Supplementary Material available at https://doi.org/10.1017/S0016756818000596) as suggested by Dietze et al. (Reference Dietze, Hartmann, Diekmann, Ijmker, Lehmkuhl, Opitz, Stauch, Wünnemann and Borchers2012). Furthermore, Clift et al. (Reference Clift, Giosan, Blusztajn, Campbell, Allen, Pringle, Tabrez, Danish, Rabbani and Alizai2008) reported that since c. 11 ka, different εNd values have characterized the surface sediments of deep sea Indus Canyon and the Indus River, suggesting that the Indus River could not supply sediments to the canyon and submarine fan under high-sea-level conditions (Prins & Postma, Reference Prins and Postma2000). At Site U1456 in the Laxmi Basin, the pelagic sedimentation is more closely related to the increase of palaeoproductivity than to the decrease of terrigenous particles. In general, palaeoproductivity in the Arabian Sea increased during the interglacial periods when the SW monsoon was intensified (Thamban et al. Reference Thamban, Rao, Schneider and Grootes2001; Pattan et al. Reference Pattan, Masuzawa, Naidu, Parthiban and Yamamoto2003; Banakar et al. Reference Banakar, Oba, Chodankar, Kuramoto, Yamamoto and Minagawa2005; Avinash et al. Reference Avinash, Manjunath and Kurian2015; Naik et al. Reference Naik, Saraswat, Lea, Kurtarkar and Mackensen2017). During pelagic sedimentation, detrital particles characterized by low 87Sr/86Sr ratios and high εNd values might be more strongly influenced by the Tapi River (Fig. 5), although we leave determination of the precise reason for the isotopic separation between the turbidites and pelagic sediments to future studies. The crucial factor for the isotopic separation seems to be the amount of discharge from peninsular India, compared to the Indus River.
6 Conclusions
The Arabian Sea is well known for its seasonal monsoon climate and, relatedly, the huge sedimentary deposit known as the Indus Fan. IODP Expedition 355 drilled to 1109.4 m penetration at Site U1456 in the Laxmi Basin of the eastern Arabian Sea. The uppermost Unit I (∼121 m thick) of the drilled sedimentary sequence consists mainly of pelagic carbonates (nannofossil ooze and foraminifera-rich nannofossil ooze) interbedded with thin terrigenous (clay, silt and sand) layers. Together with the shipboard biostratigraphic and palaeomagnetic data of Site U1456, age determination by the correlation of δ18O fluctuations of planktonic foraminifera (G. ruber) to LR04 stacks shows that Unit I spans ∼1.2 Ma covering MIS 36. 87Sr/86Sr ratios and εNd values of detrital particles vary from 0.711 to 0.726 and from −12.5 to −7.3, respectively, during the last 800 ka. Although the variation patterns of 87Sr/86Sr ratios and εNd values appear quasi-cyclic, these fluctuations do not coincide with the glacial–interglacial cycles. The fairly linear correlation between εNd and 87Sr/86Sr clearly indicates the contributions of two major end-members (the Indus and Narmada versus the Tapi) to these sediments. By considering the εNd and 87Sr/86Sr end-members of possible river sediment sources, we found that the Tapi River is responsible for sediments with low 87Sr/86Sr ratios and high εNd values whereas the Narmada and Indus Rivers are the main contributors to sediments with high 87Sr/86Sr ratios and low εNd values. Glacial sediments from the Indus River may play a secondary role, while the Mahi River is not likely to supply a significant fraction. The mean grain size of the detrital fraction falls for the most part between 8 and 16 μm, except for several large grains reaching up to 90 μm in size. In some cases, high-MS intervals are associated with large mean grain sizes. The mean grain size is not closely related to 87Sr/86Sr ratios, confirming that the grain size is not a major control on the 87Sr/86Sr ratios. However, the εNd values display a relationship with mean grain size. As supporting data are lacking, the possibility of grain-size control on Nd isotope character cannot be further explored at this time. Finally, low 87Sr/86Sr ratios and high εNd values are correlated to low MS, whereas high 87Sr/86Sr ratios and low εNd values are correlated to high MS. Because MS depends on the relative amount of the detrital fraction, high MS correlates to turbidite deposits whereas low MS is closely related to high CaCO3 pelagic sediments. The 87Sr/86Sr ratios and εNd values of the detrital fraction in the Laxmi Basin of the Arabian Sea may reflect not only the sediment provenance, but also the depositional processes at play (turbidite deposition versus pelagic sedimentation) including the amount of fine-grained sediments from peninsular India and the Deccan Traps.
Supplementary material
To view supplementary material for this article, please visit https://doi.org/10.1017/S0016756818000596.
Acknowledgements
This research used samples provided by IODP, and data collected on board the vessel JOIDES Resolution (IODP Expedition 355-Arabian Sea Monsoon). The editor-in-chief (Dr Peter Clift), Dr Jean-Carloss Montero-Serrano and an anonymous reviewer are all appreciated for their constructive comments to improve the data interpretation. This research was supported by the National Research Foundation of Korea grants (2016K2A9A2A08003704, 2016R1A2B4008256) and K-IODP of the Korean government.


