


1. Introduction
The continental break-up and start of seafloor spreading between northeastern Canada and West Greenland during Paleocene time was accompanied by the extrusion of large volumes of volcanic rocks. Today, volcanic successions from this epoch are exposed onshore on the conjugate continental margins: in the Nuussuaq Basin in West Greenland and in small areas in Canada around Cape Dyer on Baffin Island (Fig. 1). The volcanic rocks exposed on both margins have been well described (e.g. West Greenland: Clarke & Pedersen, Reference Clarke, Pedersen, Escher and Watt1976; Holm et al. Reference Holm, Gill, Pedersen, Larsen, Hald, Nielsen and Thirlwall1993; Larsen & Pedersen, Reference Larsen and Pedersen2009; Pedersen et al. Reference Pedersen, Larsen and Pedersen2017, Reference Pedersen, Larsen and Pedersen2018; Baffin Island: Clarke & Upton, Reference Clarke and Upton1971; Francis, Reference Francis1985; Kent et al. Reference Kent, Stolper, Francis, Woodhead, Frei and Eiler2004; Starkey et al. Reference Starkey, Stuart, Ellam, Fitton, Basu and Larsen2009, Reference Starkey, Fitton, Stuart and Larsen2012; Willhite et al. Reference Willhite, Jackson, Blichert-Toft, Bindeman, Kurz, Halldórsson, Hardardottir, Gazel, Price and Byerly2019).

Fig. 1. Map of the continental margins of eastern Canada and western Greenland covering the northern Labrador Sea, Davis Strait and southern Baffin Bay. A thick cover of younger sediments is not shown. UFZ – Ungava Fault Zone (or transform zone); M – Maniitsoq High; H – Hecla High. Modified from figure 2 in Nøhr-Hansen et al. (Reference Nøhr-Hansen, Williams and Fensome2016), after Gregersen et al. (Reference Gregersen, Knutz, Nøhr-Hansen, Sheldon and Hopper2019).
Most of the continental margins are now covered by the waters of the Labrador Sea, Davis Strait and Baffin Bay. Here, volcanic rocks cover much larger areas than onshore (Fig. 1) and are known from seismic surveys (maps with seismic grids are shown in e.g. Abdelmalak et al. Reference Abdelmalak, Planke, Polteau, Harz, Faleide, Tegner, Jerram, Millett and Myklebust2019 and Gregersen et al. Reference Gregersen, Knutz, Nøhr-Hansen, Sheldon and Hopper2019), but because of scant sampling opportunities their ages and compositions are poorly known. This area comprises one of the worldʼs largest transform continental margins (Mercier de Lépinay et al. Reference Mercier de Lépinay, Loncke, Basile, Roest, Patriat, Maillard and De Clarens2016), which connects the oceanic areas in the Labrador Sea and Baffin Bay. This part of the margin has a complicated structure and history and, for a transform margin, contains an unusually large amount of volcanic material (Reid & Jackson, Reference Reid and Jackson1997; Mercier de Lépinay et al. Reference Mercier de Lépinay, Loncke, Basile, Roest, Patriat, Maillard and De Clarens2016; Jauer et al. Reference Jauer, Oakey and Li2019).
The Davis Strait, Labrador Sea and Baffin Bay have been subjected to extensive hydrocarbon exploration, and samples of the volcanic rocks have been obtained from a number of deep exploration wells, short-core drillholes and dredges. The volcanic rocks are an integral part of the history of rifting, break-up and seafloor spreading in the region, and their compositions reflect the melting processes, the character of the melting mantle and the thickness of the lithosphere, as demonstrated for Jurassic–Palaeogene dyke swarms onshore West Greenland by Larsen et al. (Reference Larsen, Heaman, Creaser, Duncan, Frei and Hutchison2009).
The aim of this paper is to present compositional data for the poorly known, thick successions of Paleocene volcanic rocks in the offshore areas, and to interpret these in terms of the regional tectonomagmatic processes during the time of continental break-up and the development of seafloor spreading.
2. Geological setting
Lithospheric stretching between Canada and West Greenland most probably started during the Jurassic Period (Tappe et al. Reference Tappe, Foley, Stracke, Romer, Kjarsgaard, Heaman and Joyce2007; Larsen et al. Reference Larsen, Heaman, Creaser, Duncan, Frei and Hutchison2009) and increased during the Cretaceous Period with extensive basin formation in several tectonic phases (e.g. Chalmers & Pulvertaft, Reference Chalmers, Pulvertaft, Wilson, Whitmarsh, Taylor and Froitzheim2001; Dam et al. Reference Dam, Pedersen, Sønderholm, Midtgaard, Larsen, Nøhr-Hansen and Pedersen2009; Gregersen et al. Reference Gregersen, Knutz, Nøhr-Hansen, Sheldon and Hopper2019). The timing and development of the plate break-up and seafloor spreading are contended. The oldest linear magnetic anomalies identified in the southern Labrador Sea were interpreted as anomaly 31 (Maastrichtian, c. 70 Ma) by Srivastava (Reference Srivastava1978) and Roest & Srivastava (Reference Roest and Srivastava1989). In contrast, Chalmers & Laursen (Reference Chalmers and Laursen1995) and Chalmers & Pulvertaft (Reference Chalmers, Pulvertaft, Wilson, Whitmarsh, Taylor and Froitzheim2001) found that the oldest identifiable linear anomalies in the Labrador Sea are anomaly 27 (Danian, 62.5–62.2 Ma), and this is still the oldest undisputed magnetic anomaly. Keen et al. (Reference Keen, Dickie and Dehler2012) found volcanic basement ridges, indicative of excess magma production, associated with anomaly 27 on both margins of the northern Labrador Sea, whereas the southern margins were considered amagmatic. On the southern margins, Keen et al. (Reference Keen, Dickie and Dafoe2018 a, b) defined ‘proto-oceanic’ domains closest to the continent with interpreted magnetic anomalies 27 to 31 that, however, ‘cannot be clearly related to seafloor spreading’. It is therefore possible that spreading in the southern Labrador Sea started at an ultra-slow rate during the Maastrichtian Age; in any case, more normal spreading started abruptly during Paleocene time concomitantly with a burst in magmatic activity at c. 62 Ma. Oakey & Chalmers (Reference Oakey and Chalmers2012) modelled the development of the entire rift system between Canada and Greenland with the start of spreading during the Paleocene Epoch.
The way the spreading propagated northwards is also contended, particularly with regard to Baffin Bay because the magnetic anomalies there are difficult to interpret. Oakey & Chalmers (Reference Oakey and Chalmers2012) and Hosseinpour et al. (Reference Hosseinpour, Müller, Williams and Whittaker2013) interpreted oceanic crust of both Paleocene and Eocene age in the bay. Chauvet et al. (Reference Chauvet, Geoffroy, Guillou, Maury, Le Gall, Agranier and Viana2019) and Abdelmalak et al. (Reference Abdelmalak, Planke, Polteau, Harz, Faleide, Tegner, Jerram, Millett and Myklebust2019) regarded the older crust as ‘transitional’ and the Eocene crust as the only truly oceanic crust; in this case there is a distinct element of propagation along the entire margin, estimated to last c. 8 Ma (Chauvet et al. Reference Chauvet, Geoffroy, Guillou, Maury, Le Gall, Agranier and Viana2019). At present, the existence of a Paleocene sea floor in Baffin Bay is neither proved nor disproved.
While seafloor spreading took place in the Labrador Sea and, following Oakey & Chalmers (Reference Oakey and Chalmers2012), also in Baffin Bay, these two areas were linked by a transform zone of several hundred kilometres in length in the Davis Strait, along which there was no true seafloor spreading. During the Paleocene Epoch the spreading direction in the Labrador Sea and Baffin Bay was WSW–ENE so that the transform zone was under transtension; during earliest Eocene time, around c. 56 Ma, the spreading direction changed to approximately S–N and the tectonic regime in the transform zone changed to transpression (Oakey & Chalmers, Reference Oakey and Chalmers2012). After chron C21 (c. 45 Ma), seafloor spreading between Canada and West Greenland slowed down and stopped altogether during earliest Oligocene time around chron C12–C13, c. 33 Ma (Roest & Srivastava, Reference Roest and Srivastava1989). At that time transcurrent movements in the transform zone ceased and the two margins became fixed opposite each other, thus preserving the features of a continent-to-continent transform margin at an early stage of development.
The transform part of the continental margins between Canada and Greenland is a NNE- to N-oriented, complex fault and fracture zone that includes the Ungava Fault Zone and the Davis Strait High, which is a fault-bounded structural high associated with the Ungava Fault Zone (Fig. 1). The nature of the crust in this area has been difficult to interpret, in particular the possible occurrence of oceanic crust (Srivastava et al. Reference Srivastava, MacLean, Macnab, Jackson, Embry and Balkwill1982; Chalmers & Pulvertaft, Reference Chalmers, Pulvertaft, Wilson, Whitmarsh, Taylor and Froitzheim2001). Seismic studies in the northern Labrador Sea, Davis Strait and southern Baffin Bay have revealed the existence of extensive Palaeogene volcanic rocks (Whittaker, Reference Whittaker1996; Skaarup, Reference Skaarup2002; Skaarup et al. Reference Skaarup, Jackson and Oakey2006; Sørensen, Reference Sørensen2006; Funck et al. Reference Funck, Jackson, Louden and Klingelhöfer2007, Reference Funck, Gohl, Damm and Heyde2012; Gregersen & Bidstrup, Reference Gregersen and Bidstrup2008; Gerlings et al. Reference Gerlings, Funck, Jackson, Louden and Klingelhöfer2009; Keen et al. Reference Keen, Dickie and Dehler2012, Reference Keen, Dickie and Dafoe2018a , b; Suckro et al. Reference Suckro, Gohl, Funck, Heyde, Ehrhardt, Schreckenberger, Gerlings, Damm and Jokat2012, Reference Suckro, Gohl, Funck, Heyde, Schreckenberger, Gerlings and Damm2013; Gregersen et al. Reference Gregersen, Knutz, Nøhr-Hansen, Sheldon and Hopper2019) and a magmatic underplate of several kilometres thickness, interpreted as plume-generated, beneath the thinned crust (Funck et al. Reference Funck, Jackson, Louden and Klingelhöfer2007, Reference Funck, Gohl, Damm and Heyde2012; Gerlings et al. Reference Gerlings, Funck, Jackson, Louden and Klingelhöfer2009; Keen et al. Reference Keen, Dickie and Dehler2012; Suckro et al. Reference Suckro, Gohl, Funck, Heyde, Schreckenberger, Gerlings and Damm2013). Hosseinpour et al. (Reference Hosseinpour, Müller, Williams and Whittaker2013) presented a map with calculated thicknesses of igneous crust of up to 8 km in the Davis Strait area. Thin crust of oceanic character, but thicker than normal oceanic crust because of magmatic underplating, was identified in the southern part of the Ungava Fault Zone by Funck et al. (Reference Funck, Jackson, Louden and Klingelhöfer2007) and in the northern part, offshore Cape Dyer, by Suckro et al. (Reference Suckro, Gohl, Funck, Heyde, Schreckenberger, Gerlings and Damm2013). Funck et al. (Reference Funck, Gohl, Damm and Heyde2012) noted a narrow gravity high that runs SSW–NNE throughout the entire Davis Strait, and concluded that it is composed of igneous crust along its entire length, formed along a leaky transform fault. Jauer et al. (Reference Jauer, Oakey and Li2019) identified large areas with volcanic rocks within the transform zone. The Davis Strait High is underlain by continental crust, and its northern part is capped by sediments and volcanic rocks (Dalhoff et al. Reference Dalhoff, Larsen, Ineson, Stouge, Bojesen-Koefoed, Lassen, Kuijpers, Rasmussen and Nøhr-Hansen2006; Suckro et al. Reference Suckro, Gohl, Funck, Heyde, Schreckenberger, Gerlings and Damm2013).
In recent years, several workers have demonstrated how pre-existing structures have influenced the development of rifting and break-up in the region (Peace et al. Reference Peace, Foulger, Schiffer and McCaffrey2017, Reference Peace, McCaffrey, Imber, van Hunen, Hobbs and Wilson2018; Gouiza & Paton, Reference Gouiza and Paton2019; Heron et al. Reference Heron, Peace, McCaffrey, Welford, Wilson, van Hunen and Pysklywec2019).
2.a. Volcanic rocks
2.a.1. Offshore
Volcanic rocks occupy extensive areas offshore between 60° N and 74° N, stretching for c. 1500 km from the Saglek Basin in the south and northwards to the Lady Franklin Basin, the Hekja and Maniitsoq Highs, the Nukik Platform, and the Davis Strait High to the east of Cape Dyer and further N-wards to the NW of the Nuussuaq Basin (Fig. 1). The volcanic rocks are commonly buried beneath younger sediments up to more than 3 km thick (Fig. 2), but in some minor areas such as parts of the Nuussuaq Basin close to the coast, east of Cape Dyer and on the Davis Strait High, they are exposed on the sea floor.

Fig. 2. Simplified logs of the volcanic parts of the four wells investigated in this work. The logs were constructed from logs in Hald & Larsen (Reference Hald and Larsen1987) for Hellefisk and Nukik-2, detailed well-site logs for Hekja and Gjoa, and Nøhr-Hansen et al. (Reference Nøhr-Hansen, Williams and Fensome2016) for all four wells. Ages and dinoflagellate palynozones from Nøhr-Hansen et al. (Reference Nøhr-Hansen, Williams and Fensome2016). The Nukik and Hellefisk logs show individual flows or units, but this is not possible for Hekja and Gjoa because of the high number of thin flows in the well-site logs. Numbers for the analysed samples are given to the right of the columns. Radiometric age for Hellefisk from Larsen et al. (Reference Larsen, Pedersen, Tegner, Duncan, Hald and Larsen2016).
In the basins along the Labrador margin south of 62° N, the deeper wells encountered volcanic rocks of Early Cretaceous age (the Alexis Formation: Umpleby, Reference Umpleby1979; Balkwill et al. Reference Balkwill, Mcmillan, Maclean, Williams, Srivastava, Keen and Williams1990). In the ocean floor of the southernmost Labrador Sea at 53° 20' N, OPD Hole 647 A drilled through oceanic basalts near magnetic anomaly 24, presumably of early Eocene age (Clarke et al. Reference Clarke, Cameron, Muecke and Bates1989). In the Davis Strait between 62° N and 70° N, the deep well AT2-1 (Fig. 1) bottomed in a local phonolitic volcano of Turonian age (c. 93 Ma, Knudsen et al. Reference Knudsen, Gregersen, Kokfelt, Olivarius and Thomsen2019), and four wells –Hellefisk-1, Nukik-2, Gjoa G-37 and Hekja O-71 (Fig. 1) – drilled into thick successions of igneous rocks interlayered with and overlain by Paleocene sediments (Hald & Larsen, Reference Hald and Larsen1987; Nøhr-Hansen, Reference Nøhr-Hansen2003; Nøhr-Hansen et al. Reference Nøhr-Hansen, Williams and Fensome2016). North of 70° N the wells Alpha-1/S1 and Delta-1 bottomed in volcanic rocks overlain by Eocene sediments; the Delta-1 volcanic rocks are dated as of early Eocene age (Nelson et al. Reference Nelson, Jerram, Clayburn, Halton and Roberge2015) and the Alpha-1/S1 rocks are presumed to be latest Paleocene in age (LM Larsen, unpub. note, 2011, available from Geological Survey of Denmark and Greenland). This paper concentrates on the Paleocene volcanic rocks offshore between 62° N and 70° N.
2.a.2. Onshore
Published data for the contemporaneous volcanic rocks onshore both margins constitute important base lines for comparisons with the offshore areas. On the West Greenland margin, the volcanic rocks of the Nuussuaq Basin are exposed over large areas between 69° 30' N and 72° N (Fig. 1) and have been described and analysed by, for example, Clarke & Pedersen (Reference Clarke, Pedersen, Escher and Watt1976), Larsen (Reference Larsen1977), Holm et al. (Reference Holm, Gill, Pedersen, Larsen, Hald, Nielsen and Thirlwall1993), Larsen & Pedersen (Reference Larsen and Pedersen2009) and Pedersen et al. (Reference Pedersen, Larsen and Pedersen2017, Reference Pedersen, Larsen and Pedersen2018). The volcanic succession has a stratigraphic thickness of up to 10 km and consists of four widespread formations: geochemically depleted picrites of the Vaigat Formation (62.5–61 Ma), similarly depleted basalts of the Maligât Formation (61–60 Ma), less-depleted basalts of the Svartenhuk Formation (60–58 Ma) and geochemically enriched basalts of the Naqerloq Formation (56–54 Ma). Two local successions comprise alkali basalts of the Erqua Formation (53.5 Ma) and transitional basalts of the Talerua Member of the Hareøen Formation (38.7 Ma); see Larsen et al. (Reference Larsen, Pedersen, Tegner, Duncan, Hald and Larsen2016) for ages and stratigraphy.
On the Baffin margin, volcanic rocks are exposed in a number of small outliers on and near Cape Dyer, the easternmost point on Baffin Island. These occurrences have been described and analysed by, for example, Clarke & Upton (Reference Clarke and Upton1971), Francis (Reference Francis1985), Robillard et al. (Reference Robillard, Francis and Ludden1992), Kent et al. (Reference Kent, Stolper, Francis, Woodhead, Frei and Eiler2004), Starkey et al. (Reference Starkey, Stuart, Ellam, Fitton, Basu and Larsen2009, Reference Starkey, Fitton, Stuart and Larsen2012) and Willhite et al. (Reference Willhite, Jackson, Blichert-Toft, Bindeman, Kurz, Halldórsson, Hardardottir, Gazel, Price and Byerly2019). The rocks are picrites and very similar to those in the oldest member of the Vaigat Formation in Greenland, the Anaanaa Member. The Baffin rocks are magnetized normally (Deutsch et al. Reference Deutsch, Kristjansson and May1971); they have been time-correlated with the likewise normally magnetized Anaanaa Member, and thereby indirectly dated to magnetic anomaly chron 27n, 62.5–62.2 Ma (Pedersen et al. Reference Pedersen, Larsen, Riisager, Dueholm, Jolley and Bell2002). Reconstruction back to anomaly 27 time places Cape Dyer about 200 km west of the Anaanaa Member in southwestern Nuussuaq (Skaarup et al. Reference Skaarup, Jackson and Oakey2006; Oakey & Chalmers, Reference Oakey and Chalmers2012).
The volcanic succession on Baffin Island is cut by dykes (G Fitton, University of Edinburgh, pers. comm., 2004) that are compositionally different from the exposed volcanic rocks; they show similarities to some of the offshore rocks and are specifically shown in some of the geochemical plots here. A lava succession with similar composition may have been removed by erosion.
3. Methods
A few well samples are from sidewall cores or other cores, but most are from washed cuttings from the fraction larger than 1 mm that were hand-picked under a binocular microscope, cleaned in ultrasonic bath and crushed in agate.
Major elements were analysed by X-ray fluorescence (XRF) spectrometry on fused glass discs. Most samples were analysed at the Geological Survey of Denmark and Greenland (GEUS) following procedures described by Kystol & Larsen (Reference Kystol and Larsen1999). Some samples were analysed by Nic Odling at the University of Edinburgh using procedures described by Fitton et al. (Reference Fitton, Saunders, Larsen, Hardarson, Norry, Saunders, Larsen and Wise1998); as shown by Larsen et al. (Reference Larsen, Fitton, Fram, Saunders, Larsen and Wise1998), the two laboratories produced statistically identical results.
Trace elements in most samples were analysed by inductively coupled plasma mass spectrometry (ICP-MS) at GEUS using a PerkinElmer Elan 6100 DRC Quadrupole mass spectrometer. Sample dissolution followed a modified version of the procedure described by Turner et al. (Reference Turner, Platt, George, Kelly, Pearson and Nowell1999) and Ottley et al. (Reference Ottley, Pearson, Irvine, Holland and Tanner2003). Calibration was performed using two certified rare earth element (REE) solutions and three international reference standards (reference values from Govindaraju, Reference Govindaraju1994, supplemented with newer values for the REE). Results for reference samples processed and run simultaneously with the unknowns are normally within 5% of the reference value for most elements with concentrations of more than 0.1 ppm.
A few samples were analysed at the Geological Survey of Canada (Ottawa) by XRF and ICP-MS methods similar to those used at GEUS and Edinburgh, and the results are closely comparable. The analytical laboratories and the sample types are indicated for each sample in online Supplementary Table S1 (available at http://journals.cambridge.org/geo).
Isotope ratios of Sr and Nd were determined by Robert Frei at the Danish Centre for Isotope Geology, Department of Geosciences and Natural Resource Management, University of Copenhagen, on a VG Sector 54-IT mass spectrometer and with chemical procedures as described in Frei et al. (Reference Frei, Bridgwater, Rosing and Stecher1999). Multi-dynamic routines were used for collection of the isotope ratios. During analysis, the value of 0.1194 for the 88Sr/86Sr ratio was used for on-line mass fractionation correction, using the experimental bias law. Nd ratios were normalized to 146Nd/144Nd = 0.7219. The mean value of 143Nd/144Nd for the internal JM Nd standard (referenced against La Jolla) during the period of measurement was 0.512085 ± 0.000011 (n = 5, 2σ). Loads of 100 ng of the NIST SRM 987 Sr standard gave 87Sr/86Sr = 0.710239 ± 0.000018 (n = 5, 2σ). The 87Sr/86Sr values of the samples were corrected for the offset relative to the certified NIST SRM 987 value of 0.710245.
The powders from the Hellefisk and Nukik wells analysed for trace elements and isotopes in this work are aliquots of the same powders used for the major-element analyses of Hald & Larsen (Reference Hald and Larsen1987).
We use the term ‘ultradepleted’ for rocks with chondrite-normalized (La/Sm)N < 0.5 and (Tb/Lu)N < 1.
4. Samples and localities
The investigated samples are from the Hellefisk-1 and Nukik-2 wells (Henderson et al. Reference Henderson, Schiener, Risum, Croxton, Andersen and Kerr1981), the Gjoa G-37 and Hekja O-71 wells (Klose et al. Reference Klose, Malterre, Mcmillan, Zinkan, Embry and Balkwill1982), and dredges on the northern Davis Strait High (Dalhoff et al. Reference Dalhoff, Larsen, Ineson, Stouge, Bojesen-Koefoed, Lassen, Kuijpers, Rasmussen and Nøhr-Hansen2006; Larsen & Dalhoff, Reference Larsen and Dalhoff2006, Reference Larsen and Dalhoff2007). A fifth well, Raleigh N-18, situated only c. 25 km ENE of the Hekja well, terminated just a few metres into a volcanic succession, but no suitable sample material was available. Technical data for the investigated wells and dredges are given in Table 1. The samples analysed for major and trace elements comprise 22 from the Hellefisk well, 6 from the Nukik well, 10 from the Gjoa well, 10 from the Hekja well and 21 dredge samples from the Davis Strait High (Fig. 2). Nine samples considered to be uncontaminated by continental crust and compositionally representative were analysed for Sr and Nd isotope ratios.
Table 1. Data for drill holes and dredge stations in the Davis Strait

a Depths are given in metres below the rotary table; TD – total depth.
b Coordinates for Hellefik-1, Nukik-2 and dredge stations in WGS84; coordinates for Gjoa-G37, Hekja-O-71 in NAD83 (essentially identical to WGS84).
c Combined thickness in the interval.
d Only the volcanic samples considered to be local are listed.
4.a. Hellefisk-1 well
The Hellefisk well (Table 1) penetrated 694 m of volcanic rocks (Fig. 2). Refraction seismic data indicate that the total thickness of the volcanic succession at the drill site is c. 2 km (Funck et al. Reference Funck, Gohl, Damm and Heyde2012). The sediments immediately overlying the basalts are of Selandian age, dinocyst palynozone P4 (Nøhr-Hansen et al. Reference Nøhr-Hansen, Williams and Fensome2016), 60.7–59.2 Ma, in agreement with the radiometric (40Ar–39Ar plateau) age of 60.63 ± 0.87 Ma for the basalts (Larsen et al. Reference Larsen, Pedersen, Tegner, Duncan, Hald and Larsen2016).
The volcanic succession in the well was studied by Hald & Larsen (Reference Hald and Larsen1987) who, based on lithological variations in the cuttings samples and the sonic and bulk density logs, concluded that the succession consists of subaerial lava flows 5–50 m thick, with an average thickness of 20 m. They presented major-element analyses of 22 samples (21 cuttings and 1 core) from throughout the succession, and these analyses are also used here.
4.b. Nukik-2 well
The sediment succession in the Nukik-2 well contains in its lower part two 5–8-m-thick intervals of hyaloclastic rocks (at c. 2380 m and 2465 m; Fig. 2). The interval at 2553–2595 m consists of interbedded hyaloclastites, dolerite sheets and sediments, and from 2595 m to total depth (TD) at 2694 m the succession consists of massive dolerite (Fig. 2). Existing reflection seismic data could not resolve any volcanic rocks in the area (Suckro et al. Reference Suckro, Gohl, Funck, Heyde, Schreckenberger, Gerlings and Damm2013), and the thickness of the volcanic succession is unknown.
A few metres of sediments overlying the massive volcanic succession at 2548–2553 m are assigned to the ?Danian–Selandian stage, dinocyst palynozones P2/P3a? (Nøhr-Hansen et al. Reference Nøhr-Hansen, Williams and Fensome2016). These sediments are overlain by c. 150 m sediments of Selandian age, dinocyst palynozone P4, which gives an age interval of 60.7–59.2 Ma for the two interbedded hyaloclastite intervals. The volcanic succession below the sediments has not been radiometrically dated because of its very low potassium content (c. 0.10 wt% K2O). We consider it most probable that it is of Selandian age.
The volcanic rocks in the well were studied by Hald & Larsen (Reference Hald and Larsen1987). Based on lithological variations and the sonic and bulk density logs, they concluded that the rocks comprise hyaloclastites and dolerite sheets; no subaerial flows were present. The dolerites may either be younger intrusions or lava flows of the same age as the surrounding sediments, perhaps invasive flows as described from Disko and Nuussuaq by Pedersen & Larsen (Reference Pedersen and Larsen1987) and Pedersen et al. (Reference Pedersen, Larsen and Pedersen2018). Hald & Larsen (Reference Hald and Larsen1987) presented major-element analyses of six samples (two cuttings, two sidewall cores, and two drill cores), and these analyses are also used here.
4.c. Gjoa G-37 well
In the Gjoa well (Table 1; Fig. 2) the volcanic rocks have a combined thickness of c. 860 m. Between 2700 m and 3800 m depth, the succession consists of five intervals of volcanic rocks interbedded with sediments; between 3800 m and TD at 3998 m the well penetrated sediments of the Markland Formation. Volcanic rocks are expected to occur deeper than this because seismic sections (Sørensen, Reference Sørensen2006; Funck et al. Reference Funck, Jackson, Louden and Klingelhöfer2007; Gregersen et al. Reference Gregersen, Knutz, Nøhr-Hansen, Sheldon and Hopper2019; Jauer et al. Reference Jauer, Oakey and Li2019) indicate that only around half the thickness of the ‘basalt + sediments’ unit (1.8 km) of the crust has been penetrated.
The biostratigraphic ages of the volcanic rocks range from Danian, dinocyst palynozone P2, c. 62.5 Ma for the lowest part, over Selandian, dinocyst palynozone P4, 60.7–59.2 Ma, to Thanetian, dinocyst palynozone P5, 59.2–57.2 Ma, for the upper part (Fig. 2; Nøhr-Hansen et al. Reference Nøhr-Hansen, Williams and Fensome2016). Klose et al. (Reference Klose, Malterre, Mcmillan, Zinkan, Embry and Balkwill1982) reported a K/Ar age of 56 ± 3 Ma for the uppermost basalt, which, recalculated with standard values from the GTS 2016, would probably be closer to 57 Ma; in any case, the biostratigraphic and radiometric ages for the youngest lavas are in accordance.
The well-site log describes the volcanic lithologies as basalt with thin tuffaceous interbeds. The cuttings consist of fine-grained, brownish-grey, aphyric to weakly plagioclase-phyric rocks with variable, but subordinate, amounts of vesicular grains, glass grains and white zeolite. Only the uppermost sample (at 2760 m) has a few red-oxidized grains. The succession is interpreted as a series of subaqueous lava flows with brecciated, glassy flow tops (Balkwill et al. (Reference Balkwill, Mcmillan, Maclean, Williams, Srivastava, Keen and Williams1990); however, the sonic log usually does not show clear boundaries between individual flows.
A total of seven cuttings samples and three samples from a core were analysed; five are from the Thanetian part of the succession at 2700–3400 m and four are from the Danian part at 3564–3800 m. The Selandian part is dominated by volcaniclastic rocks and no suitable volcanic samples were obtained from this.
4.d. Hekja O-71 well
The Hekja well penetrated c. 1015 m of volcanic rocks (Table 1). Between 3545 m and 3810 m depth, the succession consists of volcaniclastic rocks interbedded with marine sediments; between 3810 m and TD at 4566 m, the succession consists of apparently massive lava flows with little sediment in between (Fig. 2). Refraction seismic data (Funck et al. Reference Funck, Jackson, Louden and Klingelhöfer2007) indicate that the ‘basalt + sediments’ unit of the crust is c. 3.6 km thick at the well site, indicating that less than one-third of the unit was penetrated.
The biostratigraphic age of the volcanic rocks is Selandian, dinocyst palynozone P4, 60.7–59.2 Ma, to Thanetian, dinocyst palynozone P5, 59.2–57.2 Ma for the upper part of the volcaniclastic succession (Nøhr-Hansen et al. Reference Nøhr-Hansen, Williams and Fensome2016; Fig. 2). Klose et al. (Reference Klose, Malterre, Mcmillan, Zinkan, Embry and Balkwill1982) reported K/Ar ages of 105–119 Ma for the lower part of the volcanic succession; the simplest explanation for this discrepancy is that the rocks contain excess argon.
The well-site log describes the volcaniclastic lithologies at 3545–3810 m as tuffs, partly welded and with glass shards. The lavas below 3810 m are described as altered basalts, in places with pillows and chilled margins. The lava cuttings consist of variably altered, fine-grained, brownish-grey, weakly plagioclase-phyric rocks with only a few glass grains and some white zeolites. Red-oxidized grains are not found. The lowest sample (at 4540 m) is different and is medium-grained, light grey and apparently fresh. As for the Gjoa well, the succession may be interpreted as a series of subaqueous lava flows, although the sonic log usually does not show clear boundaries between individual flows (Balkwill et al. Reference Balkwill, Mcmillan, Maclean, Williams, Srivastava, Keen and Williams1990).
A total of seven cuttings samples and three samples from a core were analysed; all are from the massive lava succession at 3810–4566 m because the volcaniclastic interval did not yield suitable samples.
4.e. Davis Strait High
Seismic sections across the northern part of the Davis Strait High show it as capped by sediments and volcanic rocks (Suckro et al. Reference Suckro, Gohl, Funck, Heyde, Schreckenberger, Gerlings and Damm2013; Jauer et al. Reference Jauer, Oakey and Li2019). Volcanic rocks come close to and partly crop out on the seabed where they have been drilled (Srivastava et al. Reference Srivastava, MacLean, Macnab, Jackson, Embry and Balkwill1982). Strata cropping out are interpreted on a seismic line on the eastern side of the northern high, and here nine dredge hauls were made by GEUS in 2003, 2004 and 2006 over a N–S-aligned distance of 52 km (Fig. 1; Table 1). All dredge hauls returned volcanic rocks, and most of these have a strongly depleted geochemical character that distinguishes them from other surficial volcanic areas both onshore and offshore in the region (Larsen & Dalhoff, Reference Larsen and Dalhoff2006, Reference Larsen and Dalhoff2007; see Section 5.b.5). Of 32 analysed rocks, 21 have this character and are considered to be of local origin; for the remaining 11 rocks ice-rafting cannot be excluded, and consequently these are not included in the plots and discussion in this work. One of the samples included in our study (AT465D-39) yielded an 40Ar–39Ar plateau age of 62.97 ± 0.74 Ma (Danian, Larsen & Dalhoff, Reference Larsen and Dalhoff2006). Although no stratigraphic relations between the dredge samples can be given, the age result suggests that the volcanism represented by these samples was of Danian age and therefore contemporaneous with the onshore volcanism on Baffin Island and in West Greenland.
5. Results
5.a. Secondary contamination and alteration effects
Large Pb and Ba spikes in multi-element diagrams of all cuttings samples indicate that these are contaminated with lead and barium (up to 27 ppm Pb and 515 ppm Ba), presumably from the drilling mud. Pb and Ba in cuttings are therefore not plotted in the multi-element diagrams shown here. Some other samples have smaller Ba and Pb spikes that have natural geological causes such as mantle signature or crustal contamination; the latter is known to introduce Pb.
Many dredge samples have mantle-normalized Ta significantly higher than mantle-normalized Nb; this is a contamination from tungsten carbide milling equipment and these Ta results are also not plotted.
Most analysed samples have volatile contents less than 4 wt% and are reasonably unaltered. However, ultradepleted picrites and basalts from the Davis Strait High have multi-element patterns with distinct peaks for Rb and K, suggesting that these elements have been added during seafloor alteration (e.g. Honnorez et al. Reference Honnorez, Bohlke, Honnorez-Guerstein, Dmitriev and Heirtzler1978; Pichler et al. Reference Pichler, Ridley and Nelson1999). Because of the very low pristine contents of Rb and K in these rocks, even very small additions during the formation of clay minerals will be visible in the element patterns. A few other samples also show this effect.
Two hyaloclastite samples from Nukik and three from Hekja have more than 10 wt% volatiles, and their major elements are corrupted and are excluded from the plots presented here; their trace elements are better preserved and multi-element patterns of these rocks are included.
5.b. Chemical compositions
Representative analyses are shown in Table 2, and all analyses are provided in the online Supplementary Table S1 (available at http://journals.cambridge.org/geo).
Table 2. Chemical analyses of igneous rocks from the Davis Strait (see online Supplementary Table S1, available at http://journals.cambridge.org/geo). B – basalt; BA – basaltic andesite; Ct – cuttings; D – dolerite; Dr – dredged; G – glass; I – interval; H – hyaloclastite; NA – not applicable; P – picrite; SWC – sidewall core; Vol – volatiles

a Major element analyses for Hellefisk-1 and Nukik-2 are from Hald & Larsen (Reference Hald and Larsen1987).
b For Gjoa and Hekja, total iron is given as Fe2O3, and volatiles equal the loss on ignition.
The majority of the investigated samples are tholeiitic basalts with 5–11 wt% MgO, 8–15 wt% FeOT and 7–13 wt% CaO (recalculated volatile-free, Fig. 3). Seven samples have recalculated SiO2 > 52 wt% and thereby classify as basaltic andesites. The samples from the Davis Strait High include five picrite samples with 17–25 wt% MgO. Almost all samples from all localities have a geochemically depleted character with low contents of incompatible elements such as TiO2, P2O5 (Fig. 3), Nb and Zr (Fig. 4), even relative to the onshore volcanic rocks in both Baffin Island and West Greenland which are themselves depleted (Kent et al. Reference Kent, Stolper, Francis, Woodhead, Frei and Eiler2004; Starkey et al. Reference Starkey, Stuart, Ellam, Fitton, Basu and Larsen2009, Reference Starkey, Fitton, Stuart and Larsen2012; Larsen & Pedersen, Reference Larsen and Pedersen2009). Common to all localities are also nearly horizontal heavy REE patterns (Tb–Lu; Figs 5, 6), discussed in Section 6.b. In the following, the subscript ‘N’ denotes chondrite- or mantle-normalized values.

Fig. 3. Variation diagrams for some major elements. Data in wt% oxides calculated free of volatiles. FeOT is total iron calculated as FeO. A group of four apparently related basalt samples dredged from the Davis Strait High is outlined in some diagrams. Data for the onshore volcanic rocks in West Greenland and Baffin Island are included for comparison. For Baffin Island, geochemically depleted and enriched rocks are shown with the same symbol and are not distinguishable; for West Greenland the scattered enriched rocks are not shown because they make the diagrams difficult to read.

Fig. 4. Variation diagrams for some trace elements. MgO in wt% oxide; trace elements in ppm. Other explanations as for Figure 3. The geochemically depleted and enriched Baffin Island rocks are distinguishable in the Nb diagram because the enriched group has more than 3–4 ppm Nb.

Fig. 5. REE and multi-element diagrams for the Hellefisk, Nukik and Gjoa wells. The two Baffin Island samples that form the lower and upper bounds of the depleted Baffin group are shown for comparison; their REE concentrations are low because the majority of the rocks are picrites. The enriched Baffin Island and all the West Greenland rocks are not shown because their patterns cross the others and make the diagrams very difficult to read. Left column: chondrite-normalized; right column: primitive-mantle-normalized; normalization factors from McDonough & Sun (Reference McDonough and Sun1995).

Fig. 6. REE and multi-element diagrams for the Hekja well, the Davis Strait High dredge samples and a dyke from Baffin Island (CS7 in Starkey et al. Reference Starkey, Stuart, Ellam, Fitton, Basu and Larsen2009, their online supplementary data). Other explanations as for Figure 5.
5.b.1. Hellefisk-1
The almost flow-by-flow sampled lava succession in the Hellefisk well consists entirely of tholeiitic basalts within a relatively narrow compositional interval of 6.0–8.3 wt% MgO, 49.4–51.4 wt% SiO2 and 1.13–2.05 wt% TiO2 (Fig. 3). Nonetheless, a cyclic evolution in composition can be recognized that defines four successive intervals in the succession (brt, below rotary table), as described in the following from deepest samples upwards.
Interval 1: 3200–3040 m brt (samples 532 to 483). Most depleted; (La/Sm)N = 0.6–0.7 and Nb/Zr = 0.033–0.042. Low contents of highly incompatible elements; the Th-to-Ce limb in the multi-element diagram (Fig. 5) slopes up towards the right, and there is no or just a small K trough. This interval contains the least-evolved flows with MgO > 7.7 wt%.
Interval 2: c. 3040–2950 m brt (samples 477 to 465). Slightly less depleted; (La/Sm)N = 0.7–0.8 and Nb/Zr = 0.054–0.062; higher Nb–Ta results in a K trough in the multi-element diagram (Fig. 5).
Interval 3: c. 2950 – c. 2850 m brt (samples 447 to 421). Relatively enriched flows with almost horizontal to slightly upturned light REE patterns; (La/Sm)N = 0.9–1.3 and Nb/Zr = 0.077–0.086. Increased Ba-to-Ce levels in the multi-element diagram but not increased K, leading to deeper K troughs (Fig. 5). The most extreme flow is also the most evolved (MgO = 6.0 wt%; Mg # = 44.6).
Interval 4: c. 2850–2506 m brt (samples 415 to 306). Depleted flows with (La/Sm)N = 0.6–0.85 and Nb/Zr = 0.041–0.050. The compositions approach those in interval 1.
Plots of indicators of enrichment and depletion such as (Nb/La)N and (La/Sm)N against stratigraphic height show that the enriched and depleted intervals are not abrupt and the variation may rather be described as a gradual excursion towards enriched compositions and back again (Fig. 7). The (Tb/Lu)N ratios are insensitive to enrichment, and are nearly constant to slightly decreasing upsection.

Fig. 7. Variation in trace-element ratios with height in the Hellefisk lava succession, showing the gradual increase and decrease, over several lava flows, of an enriched component giving rise to high Nb/La and La/Sm; the slight decrease in Tb/Lu with height is independent of this.
5.b.2. Nukik-2
The basalts in this well show a large geochemical spread.
A ‘dolerite sheet’ of thickness c. 100 m, which is either an intrusion or a lava flow, deepest in the well (2595–2695 m, samples 6004 and 6024) consists of depleted basalt with 9 wt% MgO and 1 wt% TiO2, (La/Sm)N = 0.6 and Nb/Zr = 0.034. Both samples have distinct Ba peaks (Fig. 5) and, as they are from a drill core and have low Th/Nb ratios of c. 0.08, this is neither a drilling mud or a crustal contamination effect.
A thin intrusion or lava flow at c. 2575 m (cuttings sample 2254) is less depleted, with an almost-horizontal REE pattern with (La/Sm)N = 1.0 and Nb/Zr = 0.035 (Fig. 5, green curve).
Hyaloclastites at three higher levels (cuttings sample 2250 and sidewall cores 6564 and 6557) are successively more enriched in incompatible trace elements. The major-element analyses show high volatile contents (12.8, 10.6 and 5.7 wt%, respectively) and the volcanic glass is devitrified (Hald & Larsen, Reference Hald and Larsen1987). Sample 6564 has inexplicably high Na and also very high Cs, perhaps because of a content of salt (NaCl). All three hyaloclastite samples have distinct troughs for Nb–Ta and Ti in the multi-element patterns (Fig. 5), La/Nb = 2.0–3.5, relatively high Th/Nb and SiO2 recalculated to 100% volatile-free reaches up to 52 wt%. These features suggest crustal contamination of the rocks. This may be a magmatic process, but the hyaloclastites could also contain a small inmixed sediment component.
5.b.3. Gjoa G-37
The eight samples of the volcanic succession represent the four main volcanic intervals in the well. The Selandian interval of volcaniclastic rocks did not yield satisfactory sample material.
The four samples from the two Danian intervals have relatively uniform compositions; they are silicic basalts to basaltic andesites with relatively high SiO2 (Fig. 3), high Rb–U, K peak, and Nb–Ta and Ti troughs in the multi-element diagram, La/Sm > 1 in the REE diagram (Fig. 5, red curves) and high Th/Nb. These features are all characteristic of crustally contaminated basalts (e.g. Larsen & Pedersen, Reference Larsen and Pedersen2009).
The lowest of the two Thanetian volcanic intervals (3240–3400 m, Fig. 2), situated just above the boundary to the Selandian sediments, was sampled at the base. The sample is a relatively evolved rock, a basaltic andesite close to a basaltic trachyandesite composition, with 54.2 wt% SiO2, low MgO (4.7 wt%) and CaO (6.8 wt%), and high Na2O (4.65 wt%) and K2O (0.65 wt%) (Fig. 3; Fig. 5, purple curve). Th/Nb is high (0.24), and the sample is considered to be crustally contaminated and possibly also enriched. The gamma-ray (GR) log in the whole of this interval shows a slightly increased response relative to that of the upper Thanetian interval, suggesting that contaminated and enriched compositions such as that at the base dominate in the lower interval.
The upper of the two Thanetian volcanic intervals consists of ‘ordinary’ basalts with less than 50 wt% SiO2 and 7–10 wt% MgO. They are geochemically depleted (Fig. 5, blue curves), with (La/Sm)N = 0.6–0.7 and Nb/Zr = 0.023–0.033. The uppermost sample (at 2760 m) is less depleted, with (La/Sm)N = 1.2 and Nb/Zr = 0.054; the GR log suggests that such compositions occupy the upper 100 m of the the volcanic pile.
5.b.4. Hekja O-71
The eight samples of the volcanic succession of thickness more than 1000 m are not many, but with the exception of the volcaniclastic interval at 3545–3810 m the samples are well spaced. The extremely uniform and low GR-log signal throughout the succession, including the volcaniclastic interval, indicates that it is compositionally uniform, and no major compositional outliers have been missed.
The lava succession comprises two compositional intervals. The lower interval (4560–c. 4300 m) comprises uncontaminated basalts with c. 8 wt% MgO; unfortunately, three samples are very altered, and their major elements are corrupted and not plotted in Figure 3. Their trace elements are better preserved. These basalts are geochemically ultradepleted (Fig. 6, blue curves), with (La/Sm)N = 0.4–0.5, (Tb/Lu)N < 1 and Nb/Zr = 0.017–0.020. Two samples show K and Rb peaks, probably due to secondary alteration.
The upper interval (c. 4300–3810 m) comprises silicic basalts with c. 51 wt% SiO2 and 8 wt% MgO (Fig. 3); high Rb–U, K peaks and Nb–Ta and Ti troughs are present in the multi-element diagram, and La/Sm > 1 in the REE diagram (Fig. 6, red curves). Their Th/Nb ratios are somewhat elevated. These rocks share many features with the high-silica rocks in the Gjoa well and, like these, the Hekja rocks are considered to be crustally contaminated.
The precise position of the boundary between the two intervals cannot be placed, but it is tentatively put at c. 4300 m depth because the lithological log indicates thin ‘tuff’ horizons with 20–40 m spacing (vesicular flow tops of more viscous lava flows?) above this level, whereas such horizons are not present below this level.
5.b.5. Davis Strait High
The 21 dredged samples comprise four compositional groups, all of which have very unusual REE ratios and do not have any known compositional counterparts in the region, either onshore or offshore.
Five samples are ultradepleted picrites with 17–25 wt% MgO (Fig. 3), (La/Sm)N = 0.25–0.5, (Tb/Lu)N < 1 and Nb/Zr = 0.013–0.027 (Fig. 6). Five samples are ultradepleted basalts with high CaO; they lie on the extension of the differentiation trend of the picrites in Figures 3 and 4 and are probably closely related to these. Seven samples are basalts with similarly low (La/Sm)N ratios but higher (Tb/Lu)N > 1.2, which do not seem to be directly related to the picrites. Four of these form a separate group in the plots in Figures 3 and 4 with low SiO2 and CaO and high FeOT, TiO2, P2O5, Zr and (Tb/Lu)N.
Four samples are silicic basalt to basaltic andesite with 51–54 wt% SiO2 and multi-element patterns with Nb and Ti troughs and K and Pb spikes; they have high (La/Sm)N and low (Tb/Lu)N close to 1 (Fig. 6). As for the Si-rich lavas in the wells, they are considered to be crustally contaminated. Because of the low (Tb/Lu)N they are probably related to the picrite group of rocks, if any.
5.c. Isotopic compositions
The Sr and Nd isotope results recalculated to an age of 60 Ma are shown in Figure 8, together with data from Baffin Island and West Greenland. The results show a significant spread.

Fig. 8. Sr and Nd isotope ratios recalulated to initial values at 60 Ma. The West Greenland samples plotting at lower Nd ratios than the regional depleted mantle are all from the Ordlingassoq Member of the Vaigat Formation, which includes a less-depleted ‘Icelandic’ mantle component (Holm et al. Reference Holm, Gill, Pedersen, Larsen, Hald, Nielsen and Thirlwall1993). Iceland today would plot within the dotted outline if epsilon notation was used. H1, H2 and H3 are data points for the Hellefisk intervals 1–3. BE – bulk earth. The seafloor altered samples project back to unaltered compositions with the same 143Nd/144Nd ratios. With the exception of the Hekja sample and the Baffin dykes, only uncontaminated samples are shown. See text for discussion.
Hellefisk: Of the three analysed samples, depleted interval 1 has the lowest 87Sr/86Sr (0.70341) and the highest 143Nd/144Nd (0.512939), and enriched interval 3 has the highest 87Sr/86Sr (0.70454) and the lowest 143Nd/144Nd (0.512657). Interval 2 is intermediate between intervals 1 and 3.
Nukik: The depleted Nukik dolerite has higher 87Sr/86Sr (0.70362) and lower 143Nd/144Nd (0.512898) than the Hellefisk interval 1, which fits with its position just within the Iceland field in the Zr–Y–Nb diagram (Fig. 10).
Hekja: The high 87Sr/86Sr (0.70443) and low 143Nd/144Nd (0.512795) in this ultradepleted sample suggest a small but significant crustal contamination (see the following section).
Davis Strait High: An evolved basalt with (Tb/Lu)N > 1 has a Sr–Nd isotopic composition similar to uncontaminated Baffin and West Greenland volcanic rocks. Three ultradepleted samples with (Tb/Lu)N < 1 (two picrites and a basalt) have variably high 87Sr/86Sr (0.70444–0.70601) and high and much less variable 143Nd/144Nd (0.513017–0.513074); they fall far off the mantle/contamination array in Figure 8. This is considered to be caused by seafloor alteration of Sr (see the following section).
5.c.1. Evaluation
The Sr–Nd isotope results (Fig. 8) are considered to be influenced by three different processes: melting of depleted and enriched mantle components, crustal contamination and seafloor alteration.
Discrimination between the first two effects may be difficult because the addition of enriched mantle or of continental crust to depleted mantle melts in both cases results in increased concentrations of elements such as Rb, K and light REE. Small degrees of contamination may not lead to discernibly increased SiO2. Trace elements are more sensitive, and crustal contamination usually leads to increased Th and relatively decreased Nb concentrations, whereas the addition of an enriched mantle component leads to increased Nb. This makes a ratio plot of Th/Nb versus (v.) Nb/Zr (Fig. 9) useful because the ‘enrichment’ and ‘contamination’ vectors are almost perpendicular to each other (Larsen & Pedersen, Reference Larsen and Pedersen2009). West Greenland samples with Th/Nb > 0.15 are possibly crustally contaminated, and samples with Th/Nb > 0.2 are definitely contaminated (Larsen & Pedersen, Reference Larsen and Pedersen2009). In Figure 9, the crustally contaminated parts of the Hekja, Gjoa and Nukik wells and four of the Davis Strait High samples are easily identifiable because they have high Th/Nb (> 0.15) and also high SiO2 (> 51 wt%). On the other hand, all the Hellefisk samples and the Nukik dolerite have Th/Nb ≤ 0.10 and appear uncontaminated, despite their relatively high SiO2 (up to 51 wt%). This indicates that the Sr–Nd isotope results for Hellefisk and Nukik are mantle signals. The Hekja sample has Th/Nb = 0.17 and SiO2 = 51.0 wt%, and is most probably slightly crustally contaminated; the addition of only around 1% sediment such as used in the modelling of Larsen & Pedersen (Reference Larsen and Pedersen2009) can explain the isotope results.

Fig. 9. Geochemical diagrams for identification of crustally contaminated and enriched rocks. (a) Crustal rocks have high Th/Nb and low Nb/Zr, whereas the enriched mantle component has high Nb/Zr and low Th/Nb. Crustal contamination vectors point upwards and enrichment vectors point to the right. Rocks with Th/Nb > 0.2, and possibly > 0.15, are considered to be crustally contaminated. The enriched mantle component in the Hellefisk well shows up in the extension to high Nb/Zr values. (b) Crustal contamination usually, but not always, leads to increased SiO2. A small number of rocks with apparently normal SiO2 show up as contaminated because of their high Th/Nb ratio.

Fig. 10. Nb/Y v. Zr/Y plot. N-MORB and Iceland fields after Fitton et al. (Reference Fitton, Saunders, Norry, Hardarson and Taylor1997). For Baffin Island, the enriched group plots in the Iceland field and the depleted group in the MORB field. For West Greenland, the scattered enriched rocks plot in the Iceland field and the major, depleted group in the N-MORB field. With the exception of the isotopically analysed Hekja sample and the Baffin dykes, only uncontaminated samples are shown. See text for discussion.
The four isotopically analysed Davis Strait samples have low Th/Nb (0.05–0.13) and low SiO2 (45.3–48.9 wt%), and do not appear to be crustally contaminated (Fig. 9). The three ultradepleted samples are considered to be seafloor altered (see Section 5.a on alteration) because they have Rb and K spikes in their multi-element patterns (Fig. 5). Seafloor alteration is known to shift Sr isotope ratios of oceanic basalts to higher values up to the value of 87Sr/86Sr for seawater (presently close to 0.709) without any notable change in the Nd isotope ratios (McCulloch et al. Reference McCulloch, Gregory, Wasserburg and Taylor1980; Faure, Reference Faure1986, p. 243–46). The 143Nd/144Nd isotope results are therefore considered to reflect the original values. The ‘normal’ basalt sample has unaltered isotope ratios.
Figure 9 also indicates that some of the Baffin Island samples are crustally contaminated, including the dykes, without any detectable increase in SiO2. This is the explanation for the high 87Sr/86Sr and low 143Nd/144Nd of the strongly depleted dykes (Fig. 8).
6. Discussion
6.a. Chemical compositions in the individual areas
The different structural settings and the spatial separation of the four wells and the dredge sites, with 200–300 km between them (see Fig. 12), indicate that they represent five distinct volcanic areas and eruption systems. It is therefore expected that each of the four wells, and the Davis Strait High, record an individual volcanic history; this is indeed the case.
The volcanic successions in the four wells are only partly contemporaneous. The ages range from Danian, dinocyst palynozone P2 (c. 62.5 Ma) through Selandian, dinocyst palynozone P4 (60.7–59.2 Ma) to Thanetian, dinocyst palynozone P5 (59.2–57.2 Ma), and the volcanism, as we know it, ‘peaked’ at different times in the wells (Fig. 2). The drilled volcanic piles in the Hellefisk, Hekja and (presumably) Nukik wells are primarily of Selandian age, whereas the Selandian Stage is only represented by 70 m of volcaniclastic rocks in the Gjoa well. Thanetian volcanism is only represented in the Gjoa and Hekja wells.
Furthermore, there are significant compositional differences between the basalts from the five areas. Irrespective of crustal contamination, the five areas plot in different fields in the FeOT, Al2O3, Sr and Sc diagrams (Figs 3, 4), whereas the differences in the SiO2 and CaO diagrams are partly the result of crustal contamination. In a Nb/Y v. Zr/Y diagram (Fitton et al. Reference Fitton, Saunders, Norry, Hardarson and Taylor1997), the five areas plot in individual elongated clusters, with a few exceptions in either the Iceland field or the depleted mid-ocean-ridge basalt (N-MORB) field (Fig. 10). Gjoa (with the exception of the slightly enriched trachyandesite at the base of the Thanetian interval), Hekja and the Davis Strait High samples plot in the N-MORB field, as does Hellefisk interval 1. Hellefisk intervals 2–4 and the lowermost Nukik samples plot in the field of the less-depleted Iceland basalts. The REE patterns of uncontaminated rocks have different shapes (Figs 5, 6): some basalts from the Davis Strait High, Gjoa and depleted Baffin Island have slightly convex-upwards shapes with maxima around Nd–Sm, whereas basalts from Hekja and picrites and some basalts from the Davis Strait High have REE patterns with no maxima, but positive to horizontal slopes throughout.
On the other hand, the uncontaminated samples share a first-order character: they are almost all geochemically depleted and the REE patterns have La–Sm limbs with positive slopes, whereas the Tb–Lu limbs are mostly nearly horizontal. The rocks from the Davis Strait High are the most depleted of all rocks in the region, which has petrogenetic significance.
6.a.1. Comparison with the onshore volcanic areas
Data for the onshore volcanic rocks in West Greenland and Baffin Island are included in the geochemical plots in Figures 3–6. In both areas the dominant rocks have a geochemically depleted character, and both areas also include some enriched rocks with higher contents of incompatible elements. In West Greenland such enriched rocks are scattered through the succession (Larsen & Pedersen, Reference Larsen and Pedersen2009), whereas on Baffin Island the depleted and enriched compositional groups occur in intercalated intervals (Starkey et al. Reference Starkey, Stuart, Ellam, Fitton, Basu and Larsen2009, their online supplementary data). For both areas, the enriched rocks plot in the Iceland field and the depleted rocks plot in the N-MORB field in Figure 10.
The REE and multi-element patterns (Figs 5, 6) show the depleted Baffin Island group; these rocks have (La/Sm)N = 0.5–1 and (Tb/Lu)N = 1.0–1.2 (Fig. 11) and are therefore not ultradepleted as defined in this work (Section 3). However, the dykes that cut the Baffin lavas are more depleted than any of the lavas, and come close in composition to the Davis Strait High and Hekja rocks (Figs 5, 6, 10, 11).

Fig. 11. Mantle melting models for volcanic rocks of the Davis Strait, including onshore occurrences. Data are chondrite-normalized. Curves for melting in garnet facies and spinel facies are shown for depleted mantle (DM-gt and DM-sp) and for primitive mantle (PM-gt and PM-sp). Mantle modes and melting modes are from McKenzie & O’Nions (Reference McKenzie and O’Nions1991), the melting type is non-modal batch melting, the DM trace-element starting composition is from McKenzie & O’Nions (Reference McKenzie and O’Nions1991), the PM starting composition is from McDonough & Sun (Reference McDonough and Sun1995) and partition coefficients are from McKenzie & O’Nions (Reference McKenzie and O’Nions1991). Numbers on the melting curves indicate degrees of melting (%), with tick marks for every 1% increase. With the exception of the isotopically analysed Hekja sample and the Baffin dykes, only uncontaminated samples are shown. See text for discussion.
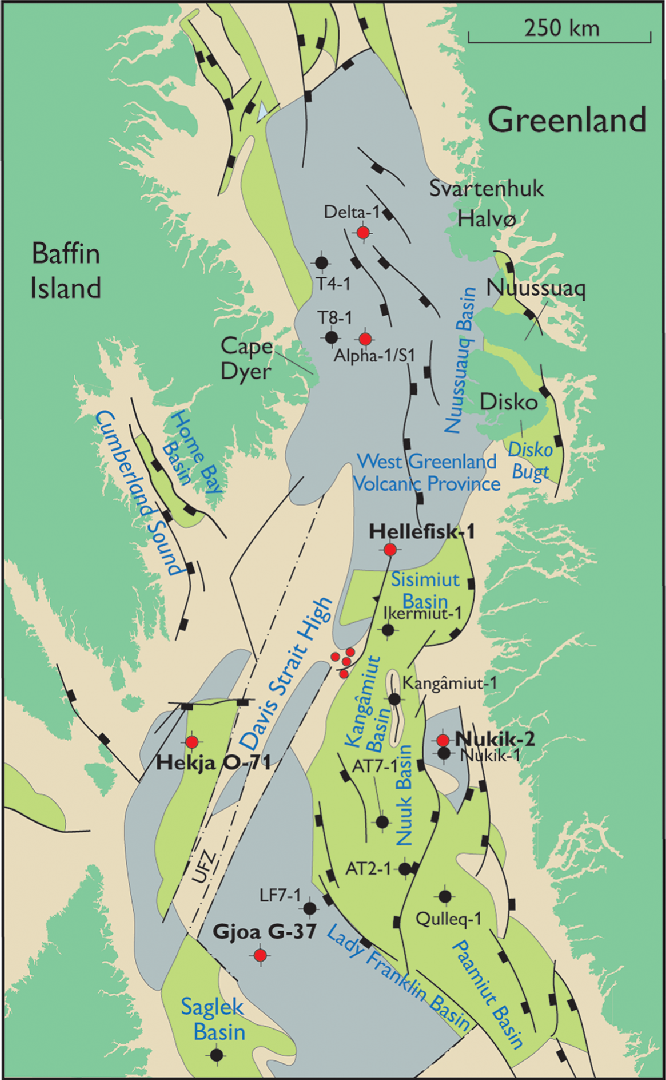
Fig. 12. Reconstruction back to Paleocene time, chron C27, when movements on the transform between Canada and Greenland began. Cape Dyer was situated about 200 km due west of Disko (Skaarup et al. Reference Skaarup, Jackson and Oakey2006; Oakey & Chalmers, Reference Oakey and Chalmers2012), whereas the Hekja well site was situated opposite the Nukik sites on the other side of the transform zone. Gjoa was the southernmost site and in close connection with the Saglek Basin (Fig. 1). Modified from Fig. 1 using Oakey & Chalmers (Reference Oakey and Chalmers2012, fig. 13). Legend as for Figure 1.
6.b. Conditions of melting
Conditions of melt formation in the asthenosphere may be obtained from major- as well as trace-element compositions. A major-element approach was presented by Albarède (Reference Albarède1992), who used experimental results on peridotite melting to establish two relatively simple equations for the calculation of temperatures and pressures of melt generation for primary magmas, based on MgO and SiO2. More recently, Herzberg & Asimow (Reference Herzberg and Asimow2015) developed a petrological model (PRIMELT3) based on a combination of forward and inverse modelling of major-element compositions of magmas that have only fractionated olivine. The model calculates primary magma compositions, temperatures, potential temperatures, degrees of melting and residual lithologies (garnet peridotite, spinel peridotite, harzburgite). Equations for pressures (initial and final melting) are given by Herzberg & Gazel (Reference Herzberg and Gazel2009). Using PRIMELT3, we found no solutions for the basalts in the four wells because the calculations all indicated fractionation of clinopyroxene. Four samples from the Davis Strait High with 9.2–18.4 wt% MgO and no signs of clinopyroxene fractionation gave good solutions indicating primary magmas with 16.2–17.7 wt% MgO, mantle potential temperatures (T P) of 1488–1523°C (median 1504°C), melt fractions of c. 0.20 and spinel peridotite residual lithologies. Initial pressures were 3.4–3.7 GPa and final pressures were 1.7–2.5 GPa. In comparison, the equations of Albarède (Reference Albarède1992) gave 1481–1514°C and 2.3–2.5 GPa.
PRIMELT3 calculations were performed for the North Atlantic Igneous Province by Hole et al. (Reference Hole, Millett, Rogers and Jolley2015) and Hole & Millett (Reference Hole and Millett2016). Hole & Natland (Reference Hole and Natland2019) cast doubts on the validity of the temperature calculation methods, but we disagree with this work on several points. For West Greenland, Hole & Millett (Reference Hole and Millett2016) found a T P of 1548 ± 32°C, a melting interval almost exclusively in garnet facies and a final pressure of melting of 2.8 GPa in the garnet–spinel transition zone, indicating a lithosphere thickness of 80–90 km. For Baffin Island they found a T P of 1532 ± 48°C and most of the melting interval in spinel facies shallower than 80 km; the final pressure of melting was 2.1 GPa, indicating a lithosphere thickness of c. 60 km for both depleted and enriched picrites. Within the uncertainties of the method, our results for the Davis Strait High indicate melting conditions similar to those of Baffin Island. Any small differences cannot be resolved.
The high potential temperatures and high degrees of melting suggest that the volume of magma emplaced in the crust was large, consistent with the drilled volcanic successions of thickness up to 1 km and the geophysical evidence for magmatic underplating in this region.
Of the trace elements, the REE are particularly sensitive to the conditions of melting, as illustrated in a plot of the heavy REE v. the light REE ratios, that is, (Tb/Lu)N v. (La/Sm)N (Fig. 11). Deep melts formed in the garnet stability field will have (Tb/Lu)N > 1 because garnet selectively retains the heavy REE Dy–Lu, whereas shallower melts formed in the spinel stability field will have (Tb/Lu)N < c. 1.2 because all REE are incompatible in spinel. This is illustrated by the model garnet–peridotite and spinel–peridotite melting curves in Figure 11. In high-temperature mantle (necessary to produce picrite melts), the phase transition from garnet– to spinel–peridotite takes place in the approximate depth interval 80–100 km (McKenzie & O’Nions, Reference McKenzie and O’Nions1991).
Figure 11 demonstrates that the only area in and around the Davis Strait in which the samples all have a distinct garnet signature ((Tb/Lu)N > 1.25) is West Greenland, indicating that the lithospheric lid on the melting column here was at least 80 km thick. A group of five very depleted basalts with high (Tb/Lu)N from the Davis Strait High indicate a similarly thick lithosphere. Most samples from the Davis Strait High and basalts from all other areas cluster around the spinel facies melting curves, indicating melting columns with all or nearly all garnet converted to spinel and thus lithosphere thicknesses of less than 80 km.
Each area contains basalts with variable (La/Sm)N according to the degree of mantle depletion or enrichment, but basically following a spinel-facies melting curve. (Tb/Lu)N ratios show much less within-area variation, but the small differences between the areas are considered significant, as discussed in the following sections.
6.c. Depleted and enriched mantle components
The incompatible light REE La–Sm values express the geochemical character of the source mantle (Fig. 11). Basically, depleted mantle has (La/Sm)N < 1 and enriched mantle has (La/Sm)N > 1. In many cases, the melting mantle is a mixture of material with different degrees of depletion and enrichment. The Baffin and West Greenland volcanic successions have therefore been interpreted as generated from depleted asthenospheric mantle and a subordinate enriched component (Baffin Island: Robillard et al. Reference Robillard, Francis and Ludden1992; Kent et al. Reference Kent, Stolper, Francis, Woodhead, Frei and Eiler2004). The West Greenland succession is mainly generated in depleted mantle, but the youngest picrites (Ordlingassoq Member) also contain a melt component from less-depleted ‘Icelandic’ mantle (Holm et al. Reference Holm, Gill, Pedersen, Larsen, Hald, Nielsen and Thirlwall1993; Larsen & Pedersen, Reference Larsen and Pedersen2009). Moreover, an enriched component seen in scattered lavas probably resided in the lithosphere (Larsen et al. Reference Larsen, Pedersen, Sundvoll and Frei2003; Larsen & Pedersen, Reference Larsen and Pedersen2009). There may therefore be different enriched components involved in different places.
The depleted character of most rocks in the region is evident ((La/Sm)N < 1) in Figure 11, the exceptions being the enriched Baffin Island and enriched West Greenland rocks, Hellefisk interval 3 ((La/Sm)N = 0.9–1.3), a possibly slightly contaminated Gjoa sample and a Nukik sample. Remarkably, the range in mantle depletion observed, with (La/Sm)N = 0.5–1.0, is the same in West Greenland, depleted Baffin Island, Gjoa, Hellefisk intervals 1, 2 and 4, and Nukik, suggesting generation from very similar depleted mantle. Only the Davis Strait High and Hekja show larger degrees of depletion, with (La/Sm)N < 0.5 and no enriched samples. While the Sr–Nd isotopes in the Hekja sample reflect crustal contamination, the 143Nd/144Nd isotope ratios of the Davis Strait High samples are similar to those of other areas, and the seafloor altered samples should project back into the main Sr–Nd isotope field of the region (Fig. 8; McCulloch et al. Reference McCulloch, Gregory, Wasserburg and Taylor1980). It follows that a uniform depleted mantle underlies the lithosphere throughout the region (the regional depleted mantle in Figure 8).
The close correlation between Sr–Nd isotopic compositions and geochemistry in the Hellefisk well indicates that the melting mantle here also consisted of a mixture of depleted and enriched material. The oscillation upsection from depleted basalts with depleted mantle isotopes to enriched basalts with enriched mantle isotopes and back again (Fig. 7) shows unequivocally that all the Hellefisk basalts were generated in one melting system and that the enriched component resided in the asthenospheric mantle. The near-constant Tb/Lu ratios suggest similar degrees of melting of both components, and therefore a close association between the two mantle source components. The more-enriched mantle component seems to be a singular ‘blob’ in the dominating depleted mantle. The enriched Hellefisk basalts and enriched Baffin Island picrites may be expressions of the same enriched mantle component because, despite the differences in the degree of evolution, the two populations have similar trace-element ratios such as La/Sm, Nb/Zr and Zr/Y.
The Hellefisk and Nukik basalts plot in Figure 11 slightly below the model curves. However, they are on a level with average oceanic basalts, both N-MORB and E-MORB, and do not require a special mantle source different from that of Gjoa, Baffin Island and West Greenland. However, the Hekja and Davis Strait High basalts are ultradepleted and require a special explanation, which may be found in the structural setting within a transform zone.
6.d. Relation between geochemistry and structural setting
With the exception of the prolonged volcanism in the Nuussuaq Basin (Larsen et al. Reference Larsen, Pedersen, Tegner, Duncan, Hald and Larsen2016), the volcanism within the Davis Strait area occurred within a relatively short timespan, mainly between c. 62 Ma (anomaly 27n) and c. 59 Ma (end of dinocyst palynozone P4), with only the Gjoa volcanic rocks reaching Thanetian ages (59–57 Ma; Fig. 2). The relevant structural setting is therefore that of the Paleocene Epoch in which movements on the transform had just started (Fig. 12). The direction of extension was WSW–ENE, resulting in transtension across the NNE-trending transform zone, and allowing it to be ‘leaky’ and oceanic crust to be formed along the transform (Funck et al. Reference Funck, Jackson, Louden and Klingelhöfer2007; Suckro et al. Reference Suckro, Gohl, Funck, Heyde, Schreckenberger, Gerlings and Damm2013). During this period, the volcanism in the Davis Strait area occurred in three different structural settings: well away from the nascent opening line (West Greenland); on thinned lithosphere closer to the opening line and transform (Baffin Island, Gjoa, Hellefisk, Nukik), and within the transform zone itself (Hekja, Davis Strait High).
6.d.1. Onshore volcanism
For the onshore areas, the significantly thicker lithosphere in West Greenland (melts in garnet facies; Fig. 11) than in Baffin Island (melts mainly in spinel facies, Fig. 11) indicates that the basin around 62–60 Ma had an asymmetry. This is also seen in the plate reconstructions at chron 27 time (Skaarup et al. Reference Skaarup, Jackson and Oakey2006; Oakey & Chalmers, Reference Oakey and Chalmers2012), where the nascent line of separation is situated closest to Baffin Island. The Baffin picrites flowed onto land from a source area NE of the present coast (Clarke & Upton, Reference Clarke and Upton1971) and would therefore have been generated close to the line of separation, where stretching would be much further advanced and the lithosphere much thinner than in West Greenland. The Baffin dykes are exceptional (see the following section).
6.d.2. Volcanism on the shelf away from the opening line
Despite the age difference between the Baffin Island and upper Gjoa basalts (respectively Danian, C27n, 62.5–62.2 Ma, and Thanetian, dinocyst palynozone P5, 59.2–57.2 Ma; Fig. 2) and the distance between them (Fig. 12), the volcanic rocks from both sites, depleted as well as enriched, have (Tb/Lu)N = 1.1–1.2 and plot just above the spinel-facies melting curves in Figure 11; this indicates melting columns with all or nearly all garnet converted to spinel, that is, a lithosphere of thickness less than 80 km and probably closer to 60 km (Hole & Millett, Reference Hole and Millett2016). In accordance with this, the refraction seismic line NUGGET-1, which crosses the Gjoa well site, shows that it is situated on thinned continental crust of thickness 14–16 km and with an underplate of thickness c. 4 km (Funck et al. Reference Funck, Jackson, Louden and Klingelhöfer2007). The situation on thinned continental crust is in accordance with the basalt geochemistry. The Gjoa well is situated around 20 km west of a buried large volcanic edifice called the Gjoa eruption centre, as shown on reflection seismic profiles (Sørensen, Reference Sørensen2006; Gregersen et al. Reference Gregersen, Knutz, Nøhr-Hansen, Sheldon and Hopper2019; Jauer et al. Reference Jauer, Oakey and Li2019), and some or all of the Gjoa lavas may be erupted from this centre.
The Hellefisk and Nukik basalts have (Tb/Lu)N c. 1.0 and plot in the field of MORB (represented in Fig. 11 by two points for N-MORB and E-MORB, respectively), suggesting lithosphere thicknesses close to oceanic values, that is, thinner than beneath Baffin Island and Gjoa. Due to the compositional excursion to enriched basalts with higher (La/Sm)N, the Hellefisk data array in Figure 11 extends horizontally from depleted N-MORB towards enriched E-MORB. The volcanic succession in the Hellefisk well represents the southern extension of the thick regional lava plateau that extends westwards and southwards offshore from the Nuussuaq Basin (Fig. 12). The basalts are so compositionally different from the contemporaneous basalts of the Maligât Formation on Disko that they must have had separate production and eruption sites within the southern basalt area. The Hellefisk well site is crossed by seismic refraction line AWI20080600. The interpretation of this line by Funck et al. (Reference Funck, Gohl, Damm and Heyde2012) shows the Hellefisk well situated on thinned continental crust 16–20 km thick, and with a thick magmatic underplate.
The volcanic succession in the Nukik well represents a local volcanic high (Fig. 1). This high is located in the central part of an area along the Greenland coast where Heron et al. (Reference Heron, Peace, McCaffrey, Welford, Wilson, van Hunen and Pysklywec2019) modelled very thin crust and a possible magmatic underplate. No refraction seismic line crosses the well. A reflection seismic line in the area (eastern end of line BGR08-301; Suckro et al. Reference Suckro, Gohl, Funck, Heyde, Schreckenberger, Gerlings and Damm2013) outlines the contours of a basement high rising to 2.5 km depth, which must be the volcanic edifice (Fig. 2), but beneath this there is no resolution. The systematic change with time to successively more geochemically enriched units (see Fig. 5) may signal decreasing degrees of melting, perhaps because of cooling of the mantle or stronger involvement of an enriched mantle component such as that present in Hellefisk.
6.d.3. Volcanism associated with the transform zone: ultradepleted rocks
The Hekja basalts and the Davis Strait High picrites and related basalts have very low (Tb/Lu)N (0.8–1.0) and also very low (La/Sm)N (0.2–0.6) (Fig. 11). They are ultradepleted in the most incompatible elements (Figs 4, 6) and, as noted in Section 6.c above, this requires a special explanation for their formation.
The Hekja well is covered by the refraction seismic line NUGGET-1 which shows Hekja situated on thinned continental crust 14 km thick and with a magmatic underplate c. 6 km thick (Funck et al. Reference Funck, Jackson, Louden and Klingelhöfer2007). The distance to the N–S-extending strip of oceanic crust within the transform, which has an even thicker magmatic underplate, is c. 50 km. The transform zone has near-vertical boundaries to the crust outside the zone.
The dredge sites on the Davis Strait High are situated about 80 km north of the refraction seismic line AWI-20080700 across the narrow part of the Davis Strait. At chron 27 time the Hekja site would have been situated about 80 km south of this line on the Canadian side (Fig. 12). The line shows a continuous packet of basalt lavas that is < 1 km thick on the High and 2–4 km thick at each side. The Ungava transform fault zone is situated immediately west of the High; beneath this the crust is strongly thinned and possibly cut by intrusions, and there is a thick magmatic underplate (Suckro et al. Reference Suckro, Gohl, Funck, Heyde, Schreckenberger, Gerlings and Damm2013). The transform fault zone has steep boundaries to the crust outside the zone.
Ultradepleted basalts are rare. They are mainly, but not exclusively, found within some oceanic transform fault zones that have been under extension, such as the Garrett and Siqueiros transform faults (Hékinian et al. Reference Hékinian, Bideau, Hébert and Niu1995; Perfit et al. Reference Perfit, Fornari, Ridley, Kirk, Casey, Kastens, Reynolds, Edwards, Desonie, Shuster and Paradis1996; Michael & Graham, Reference Michael and Graham2015). Even compared with the basalts from these areas, the Hekja and Davis Strait High rocks are extreme with respect to several geochemical parameters, for example, very low Zr/Y (1.2–1.9) and (Ce/Yb)N (0.2–0.5). The association between transform faults and ultradepleted rocks is most probably caused by the particular melting dynamics in transforms. At normal spreading centres, the cross-section of the melting column is triangular because the lithosphere on both sides thins gradually towards the spreading centre. In contrast, the melting column at transforms is steep-sided in cross-section because the lithosphere has very steep to vertical boundaries towards the transform zone, as seen in the refraction seismic lines of Funck et al. (Reference Funck, Jackson, Louden and Klingelhöfer2007) and Suckro et al. (Reference Suckro, Gohl, Funck, Heyde, Schreckenberger, Gerlings and Damm2013). It is beneath the lateral, deep ‘wings’ in the triangular melting column that the relatively enriched, small-degree melts are produced that subsequently aggregate into the main melt; if these wings are lacking, the resulting aggregated melt will be more depleted than a melt from a similar mantle in a triangular melting column (Wanless et al. Reference Wanless, Behn, Shaw and Plank2014). We therefore suggest that the basalts from the Davis Strait High and Hekja were produced within the transform fault zone, even though the seismic section across the Hekja site shows it to be situated c. 50 km from the fault zone. The magmas could have been injected laterally into the crust and erupted west of the transform.
The strongly depleted dykes sampled on Baffin Island were probably also intruded laterally into the onshore volcanic succession from a developing transform offshore. Their similarity to the Hekja basalts is notable. Their age is not known; we believe they are Paleocene and, in any case, were produced much further north than both the Hekja and Davis Strait High rocks.
7. Conclusions
The thick volcanic successions in the Hellefisk, Nukik, Gjoa and Hekja wells and on the Davis Strait High represent five separate, voluminous volcanic areas and eruption systems. They are all of Paleocene age and represent an age range from Danian, dinocyst palynozone P2, c. 62.5 Ma, over Selandian, dinocyst palynozone P4, 60.7–59.2 Ma, to Thanetian, dinocyst palynozone P5, 59.2–57.2 Ma.
The basalts in the five areas differ in chemical compositions, and the Davis Strait High dredges include picritic rocks. All except the Hellefisk well include crustally contaminated basalts.
The dominant magmas were derived from a depleted mantle with a character similar to the mantle that produced the onshore volcanic successions on Baffin Island and in West Greenland, the ‘regional depleted mantle’. The Hellefisk and Nukik wells also comprise lavas derived from an enriched (or less depleted) mantle component similar to that which gave rise to the Baffin Island enriched lavas. The Hellefisk basalts were generated in one melting system with a close association between the two mantle components in the asthenosphere.
The basalts in all five areas show evidence of melting in spinel facies peridotite mantle, indicating melting beneath a thinned lithosphere of probable thickness around c. 60 km. Temperature calculations for the Davis Strait High show high mantle potential temperatures of c. 1500°C.
The composition of the volcanic rocks in the five areas is related to the structural setting. Hellefisk, Nukik and Gjoa are located away from the opening line, the basalts are moderately depleted and subordinate enriched lavas are present, as is also seen in the onshore successions. Hekja and the Davis Strait High are located near and within the transform zone itself, which was under transtension during the Paleocene Epoch, and the basalts and picrites are ultradepleted. The formation of such melts is most probably the result of melting dynamics in the transform zone, where the melting column will be steep-sided in cross-section (not triangular as on normal spreading ridges), and will therefore not include small-degree melts from the deeper lateral ‘wings’ of the melting region.
The transtension necessary to induce melting along the transform was limited to the Paleocene Epoch. When the spreading direction changed during earliest Eocene time from WSW–ENE to approximately S–N, the associated shift to a transpressive regime along the transform caused magmatism to cease in the Davis Strait, whereas Eocene volcanism continued to construct new seafloor in the Labrador Sea and Baffin Bay.
Acknowledgements
The authors are grateful to the National Energy Board of Canada and Canada–Nova Scotia Offshore Petroleum Board for permission to work on the Hekja and Gjoa samples. We are grateful to Henrik Nøhr-Hansen for providing copies of the original well logs and for discussions on palynostratigraphy and age relations. We thank two anonymous reviewers and Natasha Wodicka for constructive comments regarding the original manuscript. This research received no specific grant from any funding agency, commercial or not-for-profit sectors. Natural Resources Canada Contribution Number 20190360.
Declaration of interests
None.
Supplementary material
To view supplementary material for this article, please visit https://doi.org/10.1017/S0016756820000175


