1. Introduction
Tonalite–trondhjemite–granodiorite (TTG) rocks are the major components of Archaean continental crust (Condie, Reference Condie2000). Available evidence from zircon geochemistry and U–Pb geochronology suggests that continental crust has been forming since ~ 4.4 Ga (Wilde et al. Reference Wilde, Valley, Peck and Graham2001). Although the existence of 4.4 Ga old crust (Wilde et al. Reference Wilde, Valley, Peck and Graham2001) is disputable, magmatic emplacement ages of TTG rocks clustering around ~ 3.9–3.8 Ga are reported from the Itsaq Gneiss Complex and Saglek–Hebron Block in the North Atlantic Craton, the Napier Complex in Antarctica and the North China Craton, and such rocks also yielded abundant detrital grains to the Jack Hills Quartzite in Western Australia (Myers, Reference Myers1988; Nutman et al. Reference Nutman, Chadwick, Ramakrishnan and Viswanatha1992; Friend & Nutman, Reference Friend and Nutman2005). These occurrences indicate widespread continental crust formation from ~ 3.8 Ga onwards (for detailed discussions see van Kranendonk, Smithies & Bennett, Reference van Kranendonk, Smithies and Bennett2007). In peninsular India, relatively younger crust formation ages have been reported for trondhjemite and leucogranite from the Bastar Craton (3.5–3.4 Ga; Sarkar et al. Reference Sarkar, Corfu, Paul, McNaughton, Gupta and Bishui1993; Ghosh, Reference Ghosh2004), felsic volcanic and trondhjemitic xenoliths from the Singhbhum Craton (~ 3.4 Ga; Sengupta et al. Reference Sengupta, Corfu, McNutt and Paul1996; Mishra et al. Reference Mishra, Deomurari, Wiedenbeck, Goswami, Ray and Saha1999) and TTG from the Bundelkhand Craton (~ 3.6 Ga; Kaur, Zeh & Chaudhri, Reference Kaur, Zeh and Chaudhri2014). Apart from sparse zircon ages recorded from a few localities in these cratons, no comprehensive study has been conducted to chart the processes related to the origin of Archaean continental crust in these Indian cratons.
Geochronological studies based on combined U–Pb and Lu–Hf systematics of zircon are considered to be very powerful tools to understand the timing and processes of formation of Archaean crust, their recycling and related magma generation processes (Condie, Reference Condie2000; Kröner et al. Reference Kröner, Wan, Liu and Liu2014). The U, Pb and Hf contents in magmatic zircons are usually high and the mineral can even preserve original isotopic compositions under extreme granulite facies conditions. Consequently, they can be used as a geochronometer to constrain crustal formation and subsequent recycling processes (Nutman et al. Reference Nutman, Bennett, Friend, Horie and Hikada2007, Reference Nutman, Bennett, Friend and Mcgregor2000; Iizuka et al. Reference Iizuka, Komiya, Ueno, Katayama, Uehara, Maruyama, Hirata, Johnson and Dunkley2007; Harrison et al. Reference Harrison, Schmitt, McCulloch and Lovera2008; Nebel-Jacobsen et al. Reference Nebel-Jacobsen, Munker, Nebel, Gerdes, Mezger and Nelson2010).
In this study we present new U–Pb zircon ages and Lu–Hf isotope data from the TTG gneisses of the Bundelkhand Craton, North Central India, in order to constrain the timing of Palaeoarchaean crustal building processes (Fig. 1).

Figure 1. (a) Tectonic map of peninsular India showing the location of the Bundelkhand Craton with respect to the Archaean cratons and Proterozoic mobile belts. (b) Geological map of the Bundelkhand Craton modified after Basu (Reference Basu1986) showing the geochronological data from different terrains (after Mondal et al. Reference Mondal, Goswami, Deomurari and Sharma2002; Kaur, Zeh & Chaudhri, Reference Kaur, Zeh and Chaudhri2014) and localities of the present study (represented by the box).
2. Geological background
The Bundelkhand Craton forms the eastern part of the Aravalli–Bundelkhand protocontinent (Mondal et al. Reference Mondal, Goswami, Deomurari and Sharma2002). Proterozoic sedimentary basins (Vindhyan Basin) and tectonic belts (Central Indian Tectonic Zone) separate the Bundelkhand Craton from the Aravalli Craton to the west, the Singhbhum Craton to the east and the Bastar Craton to the south (Fig. 1a). The northern part of the Bundelkhand Craton is mostly covered by Indo-Gangetic alluvium. Major lithological components of the craton are intensely deformed granitoid-greenstone terrains that are intruded by undeformed granitoids (Basu, Reference Basu1986; Sharma & Rahman, Reference Sharma, Rahman and Deb2000; Pati et al. Reference Pati, Patel, Pruseth, Malviya, Arima, Raju, Pati and Prakash2007; Meert et al. Reference Meert, Pandit, Pradhan, Banks, Sirianni, Stroud, Newstead and Gifford2010; Fig. 1b).
The oldest crustal components of the craton are represented by the ~ 3.58–3.5 Ga trondhjemitic gneisses from Baghora (whole-rock Rb–Sr age) and Mauranipur (U–Pb zircon ages) in the central part of the craton (Sarkar, Paul & Potts, Reference Sarkar, Paul and Potts1996; Kaur, Zeh & Chaudhri, Reference Kaur, Zeh and Chaudhri2014). Mondal et al. (Reference Mondal, Goswami, Deomurari and Sharma2002) reported zircon evaporation ages of ~ 3.3–3.2 Ga for high-aluminium trondhjemite gneiss from Kuraicha and Mahoba and tonalitic gneisses from Panchwara. Neoarchaean zircon evaporation ages and SHRIMP ages of ~ 2.7 and 2.5 Ga, have been recorded for tonalite gneiss, granitoids and felsic schists from the central Bundelkhand Craton (Fig. 1b; Mondal et al. Reference Mondal, Goswami, Deomurari and Sharma2002; Kumar et al. Reference Kumar, Yi, Raju, Pathak, Kim, Lee, Molina, Scarrow, Bea and Montero2011; Singh & Slabunov, Reference Singh and Slabunov2014). Geochemical signatures of the craton's Mesoarchaean TTG gneisses indicate emplacement in a suprasubduction environment (Ram Mohan et al. Reference Ram Mohan, Singh, Santosh, Siddiqui and Balaram2012).
Nd isotopic data for the amphibolites in the Mahoba, Mauranipur and Babina areas indicate depleted mantle model ages of ~ 3.4–3.3 Ga, suggesting an origin of these mafic supracrustal rocks from a depleted mantle during the Mesoarchaean Era (Malviya, Arima & Pati, Reference Malviya, Arima and Pati2005). An intrusive contact of the ~ 3.3 Ga old Mahoba TTG gneiss with the associated supracrustal units and a zircon evaporation age of ~ 3.25 Ga obtained from a metabasic enclave within the gneiss indicate the minimum age of formation of the supracrustal units (Mondal et al. Reference Mondal, Goswami, Deomurari and Sharma2002). The last phase of magmatism in the craton was the intrusion of the NW-trending mafic dykes between ~ 1.97 and 1.8 Ga (Pradhan et al. Reference Pradhan, Meert, Pandit, Kamenov and Mondal2012).
Lead-loss events and post-magmatic overgrowth on magmatic zircons from the TTG gneisses around the Mahoba and Laliltpur areas occurred at ~ 3.1 Ga, ~ 3.05 Ga and ~ 2.9–2.8 Ga, and have been interpreted by Mondal et al. (Reference Mondal, Goswami, Deomurari and Sharma2002) as ages of metamorphism. The sole well-constrained study on the metamorphism of the craton was conducted by Saha et al. (Reference Saha, Pant, Pati, Upadhaya, Berndt, Bhattacharya and Satyanarayan2011) on the corundum-bearing white-schist in the Babina area (occurring in the western part of the Bundelkhand Tectonic Zone), where the authors noted a ~ 2.78 Ga high-pressure metamorphic event indicating the occurrence of collisional tectonics. Geochemical signatures (strong heavy rare earth element depletion) of Neoarchaean felsic rocks in the craton indicate their emplacement in a convergence setting (Mondal et al. Reference Mondal, Goswami, Deomurari and Sharma2002; Kumar et al. Reference Kumar, Yi, Raju, Pathak, Kim, Lee, Molina, Scarrow, Bea and Montero2011; Singh & Slubanov, Reference Singh and Slabunov2014). Thus, collisional tectonics played a major role in the stabilization of the craton in the Neoarchaean Era.
3. Field observations
Near Babina, scattered outcrops of TTG gneisses show development of alternating leucocratic and melanocratic bands with mafic (amphibolite) enclaves displaying local partial melting (Fig. 2). The extremely deformed outcrops (Fig. 2c) indicate that the TTG gneisses have experienced multiple episodes of folding. Two samples of TTG gneisses, LB13 and DUR13, were collected from the Babina area for this study (Fig. 1b).

Figure 2. Field photographs of the TTGs from the Babina and Sukwan–Dukwan dam areas. (a) TTG gneiss from the Babina area (sample LB13); (b) banding and foliation in the TTG gneiss; length of hammer for scale is 40 cm; (c) migmatitic banding in the TTG gneiss; length of pen for scale is 14 cm; (d) large-size mafic enclaves in the TTG gneiss; length of hammer for scale is 29 cm.
4. Zircon geochronology
4.a. U–Pb method
Zircon U–Pb age data were acquired at the Central Analytical Facility, Stellenbosch University, by laser ablation single-collector magnetic sector field inductively coupled plasma mass spectrometry (LA-SF-ICP-MS) employing a Thermo Finnigan Element 2 mass spectrometer coupled to a NewWave UP213 laser ablation system. All age data were obtained by single spot analyses with a spot diameter of 30 µm and a crater depth of approximately 15–20 µm (online Supplementary Material available from http://journals.cambridge.org/geo). The methods employed for analysis and data processing are described in detail by Gerdes & Zeh (Reference Gerdes and Zeh2006, Reference Gerdes and Zeh2009) and Frei & Gerdes (Reference Frei and Gerdes2009). For quality control, the Plešovice (Sláma et al. Reference Sláma, Košler, Condon, Crowley, Gerdes, Hanchar, Horstwood, Morris, Nasdala, Norberg, Schaltegger, Schoene, Tubrett and Whitehouse2008) and M127 (Nasdala et al. Reference Nasdala, Hofmeister, Norberg, Mattinson, Corfu, Dörr, Kamo, Kennedy, Kronz, Reiners, Frei, Košler, Wan, Götze, Häger, Kröner and Valley2008; Mattinson, Reference Mattinson2010) zircon reference materials were analysed, and the results were consistently in excellent agreement with the published ID-TIMS ages. Full analytical details and the results for all quality control materials analysed are reported in Table S1 in the online Supplementary Material (available at http://journals.cambridge.org/geo). The calculation of concordia ages and plotting of concordia diagrams were performed using Isoplot/Ex 3.0 (Ludwig, Reference Ludwig2003).
4.b. Zircon data from the TTG gneiss near Babina (LB13)
Cathodoluminescence (CL) imaging reveals that most zircons separated from LB13 show oscillatory magmatic zoning (Fig. 3a, b). Some zircons show cores that are apparently overgrown by rims displaying oscillatory zoning; however, no age differences could be found between cores and rims, suggesting that individual zircon grains have been formed during a single magmatic event. In total 40 single spot analyses on 29 grains have been obtained. Although secondary textural features (e.g. alteration, metamictization and recrystallization) are not widespread as observed in CL images, a significant portion of the analyses yielded discordant ages (60% of the analyses are > 10% discordant; Table 1; Fig. 3c). In general, all analyses that yielded highly discordant ages also have U contents > 500 ppm, pointing to metamictization which enhanced lead loss. Subsequent Lu–Hf analyses (discussed in Section 5) have only been performed on those spots that yielded > 90% U–Pb concordance. As shown in a Wetherill Concordia plot in Figure 3c, the concordant to near-concordant analyses define two distinct age groups: c. 3.59 Ga and c. 3.44 Ga. The older zircon grains give an upper intercept age of 3589±7 Ma (MSWD = 0.83), identical to a concordia age of 3589±8 Ma (MSWD = 0.21) for the eight most concordant analyses. The younger zircon age group gives an upper intercept age of 3444±26 Ma (MSWD = 2.7) and a mean Pb–Pb age of 3440±3 Ma (MSWD = 0.83) for the four most concordant analysis. The data suggest that the younger ages reflect the timing of intrusion of TTG magmatism. The older zircon grains possibly represent xenocrysts derived from an older crustal component.

Figure 3. (a, b) CL images of zircons from sample LB13. The position of the laser spots (30 μm in diameter) is indicated by white circles. Labels indicate analysis number, the estimated 207Pb–206Pb ages with 2σ errors (in Ma) and the degree of concordance (in %). (c) Concordia diagram showing the laser ablation analyses of zircons of two distinct age groups (3.59 Ga and 3.44 Ga).
Table 1. U–Pb data for the zircons from the TTG gneiss of the Babina area (LB13)

a U and Pb concentrations and Th/U ratios are calculated relative to the GJ-1 reference zircon
b Corrected for background and within-run Pb/U fractionation and normalized to reference zircon GJ-1 (ID-TIMS values/measured value); 207Pb/235U calculated using (207Pb/206Pb)/(238U/206Pb * 1/137.88)
c Rho is the error correlation defined as the quotient of the propagated errors of the 206Pb/238U and the 207Pb/235U ratios
d Quadratic addition of within-run errors (2 s.d.) and daily reproducibility of GJ-1 (2 s.d)
e Corrected for mass-bias by normalizing to the GJ-1 reference zircon (~ 0.6 per atomic mass unit) and common Pb using the model Pb composition of Stacey &Kramers (Reference Stacey and Kramers1975)
4.c. Zircon data from the TTGs of the Sukwan–Dukwan dam area (DUR13)
The CL images of the zircons separated from DUR13 (Fig. 4a, b) show that all zircons are affected by a strong metamictization that in many cases has led to a dominant secondary alteration and recrystallization of the grains. A sufficient number of grains still exhibit magmatic oscillatory zoning, predominantly in the tips of individual zircon crystals, and these areas have been the primary targets for U–Pb age analysis. However, with the exception of one analysis that yielded a near-concordant Pb–Pb age of 3368±30 Ma (94% concordant, analysis 46 in Table 2 and Fig. 4b) and a comparatively low U content of 79 ppm, all analysis yielded ages that are highly discordant (74 to 26% discordance, Table 2), indicating large degrees of lead loss. The observed large extent of lead loss is in accordance with the very high U contents that range from 264 to 3274 ppm and are above 800 ppm for > 90% of the analyses. Consequently, the calculated discordia yields poorly defined upper (3220±79 Ma) and lower intercept ages (532±76 Ma) with a very high MSWD of 91, indicating that the dataset cannot be explained with a single lead-loss event and has excess scatter that is pointing to a petrogenetic evolution with multiple lead-loss events (Mezger & Krogstad, Reference Mezger and Krogstad1997; Corfu, Reference Corfu2012; Kröner et al. Reference Kröner, Wan, Liu and Liu2014). Nevertheless, we suggest that the 207Pb–206Pb age of the more concordant analysis (~ 3.44 Ga) may indicate the intrusion age for the protolith of the TTG gneiss DUR13.

Figure 4. (a, b) CL images of zircons from sample DUR13. The position of the laser spots (30 μm in diameter) is indicated by white circles. Labels indicate analysis number, the estimated 207Pb–206Pb ages with 2σ errors (in Ma) and the degree of concordance (in %). (c) Concordia diagram showing the laser ablation zircon analyses, most of the zircons showing strong discordance with an upper intercept at ~ 3.22 Ga and one concordant analysis yielding an age of ~ 3.36 Ga.
Table 2. U–Pb data for zircons from the TTG gneiss of the Sukwan–Dukwan area (DUR13)

a U and Pb concentrations and Th/U ratios are calculated relative to the GJ-1 reference zircon
b Corrected for background and within-run Pb/U fractionation and normalized to reference zircon GJ-1 (ID-TIMS values/measured value); 207Pb/235U calculated using (207Pb/206Pb)/(238U/206Pb * 1/137.88)
c Rho is the error correlation defined as the quotient of the propagated errors of the 206Pb/238U and the 207Pb/235U ratios
d Quadratic addition of within-run errors (2 s.d.) and daily reproducibility of GJ-1 (2 s.d)
e Corrected for mass-bias by normalizing to the GJ-1 reference zircon (~ 0.6 per atomic mass unit) and common Pb using the model Pb composition of Stacey & Kramers (Reference Stacey and Kramers1975)
5. Lu–Hf zircon data
5.a. Lu–Hf methodology
Hafnium isotope measurements were performed with a Thermo Finnigan NEPTUNE multi-collector ICP-MS at Goethe University Frankfurt (GUF) coupled to a RESOlution M50 193 nm ArF excimer (Resonetics) laser system following the method described in Gerdes & Zeh (Reference Gerdes and Zeh2006, Reference Gerdes and Zeh2009). Spots of 40 µm in diameter were drilled with a repetition rate of 5.5 Hz and an energy density of 6 J cm−2 during 40 seconds of data acquisition. Accuracy and external reproducibility of the method was verified by repeated analyses of reference zircons GJ-1 and Plešovice, which yielded 176Hf/177Hf of 0.282010 ± 0.000025 (2 s.d., n = 7) and 0.0282475 ± 0.000020 (n = 7), respectively. This is in perfect agreement with previously published results (e.g. Gerdes & Zeh, Reference Gerdes and Zeh2006; Sláma et al. Reference Sláma, Košler, Condon, Crowley, Gerdes, Hanchar, Horstwood, Morris, Nasdala, Norberg, Schaltegger, Schoene, Tubrett and Whitehouse2008) and with the LA-MC-ICP-MS seven-year long-term averages for the GJ-1 (0.282010 ± 0.000024; n > 900) and Plešovice (0.282478 ± 0.000023, n > 500) reference zircons at GUF.
The initial 176Hf/177Hf values are expressed as εHf(t), which is calculated using a decay constant value of 1.867×10⁻¹¹ year−1, CHUR after Bouvier, Vervoort & Patchett (Reference Bouvier, Vervoort and Patchett2008; 176Hf/177HfCHUR,today = 0.282785 and 176Lu/177Hf CHUR,today = 0.0336) and the Pb–Pb ages obtained from the upper intercept ages of two zircon populations (method discussed by Corfu, Reference Corfu2012). For the calculation of Hf two-stage model ages (TDM) in billions of years the measured 176Lu/177Hf of each spot (first stage = age of zircon), a value of 0.0113 for the average continental crust and a depleted mantle (DM) 176Lu/177LuDM = 0.0384 and 176Hf/177Hf DM = 0.283165 (average MORB; Chauvel et al. Reference Chauvel, Lewin, Carpentier, Arndt and Marini2008) were used.
5.b. Zircon Lu–Hf analyses of LB13
As discussed by Fisher et al. (Reference Fisher, Vervoort and Hanchar2014), in the case of multiple zircon populations in any ancient rock, it is important to verify whether zircons represent single or mixed generations. Figure 3c and also the Terra-Wasserburg Concordia plot in the online Supplementary Material (available at http://journals.cambridge.org/geo) show that the two zircon populations of LB13 (~ 3.59 Ga and 3.44 Ga) occur as separate age groups without evidence of mixing. So it is concluded that the zircon ages in LB13 reflect two distinct crystallization events, and initial εHf(t) values have been calculated for each age group on the basis of their respective upper intercept ages.
Zircons with an apparent Pb–Pb age of ~ 3.44 Ga yield 176Hf/177Hf of 0.280539 to 0.280592 corresponding to εHf(t) values of −0.6 to +1.3 (Table 3). A TDM model age of ~ 3.55 Ga obtained from the ~ 3.44 Ga zircons and near-chondritic average εHf3.44Ga (+0.3) indicates that the calc-alkaline magma was formed by partial melting of a 3.55 Ga mafic crust. The analyses of the older zircon population (~ 3.59 Ga) of TTG gneiss LB13 yield 176Hf/177Hf of 0.280524 to 0.280496 corresponding to εHf(t) values of +2.4 to +1.4. Average εHf3.59Ga values (+1.9) of the older zircon population are more suprachondritic, indicating influence of depleted mantle (Table 3; Fig. 5).
Table 3. LA-MC-ICP-MS Lu–Hf isotope data for zircons from TTG gneiss (LB13) from the Babina area

Quoted uncertainties (absolute) relate to the last quoted figure. The effect of the inter-element fractionation on the Lu/Hf was estimated to be about 6% or less based on analyses of the GJ-1 and Plešovice zircons. Accuracy and reproducibility were checked by repeated analyses (n = 7) of reference zircon GJ-1 and Plesoviče (data given as mean with 2 standard deviation uncertainties)
(a) 176Yb/177Hf = (176Yb/173Yb)true × (173Yb/177Hf)meas × (M173(Yb)/M177(Hf))b(Hf), b(Hf) = ln(179Hf/177Hf true / 179Hf/177Hfmeasured)/ ln (M179(Hf)/M177(Hf)), M = mass of respective isotope. The 176Lu/177Hf were calculated in a similar way by using the 175Lu/177Hf.
(b) Mean Hf signal in volts
(c) Uncertainties are quadratic additions of the within-run precision and the daily reproducibility of the 40 ppb-JMC475 solution. Uncertainties for the JMC475 quoted at 2 s.d.
(d) Initial 176Hf/177Hf and εHf calculated using the apparent Pb–Pb age determined by LA-ICP-MS dating (see column f), and the CHUR parameters:
176 Lu/177Hf = 0.0336 and 176Hf/177Hf = 0.282785 (Bouvier, Vervoort & Patchett, Reference Bouvier, Vervoort and Patchett2008)
(e) Two-stage model age in billions of years using the measured 176Lu/177Hf of each spot (first stage = age of zircon), a value of 0.0113 for the average continental crust (second stage) and a depleted mantle (DM<, Chauvel et al. Reference Chauvel, Lewin, Carpentier, Arndt and Marini2008) 176Lu/177Hf and 176Hf/177Hf of 0.0384 and 0.28316, respectively.
(f) Apparent Pb–Pb age determined by LA-ICP-MS
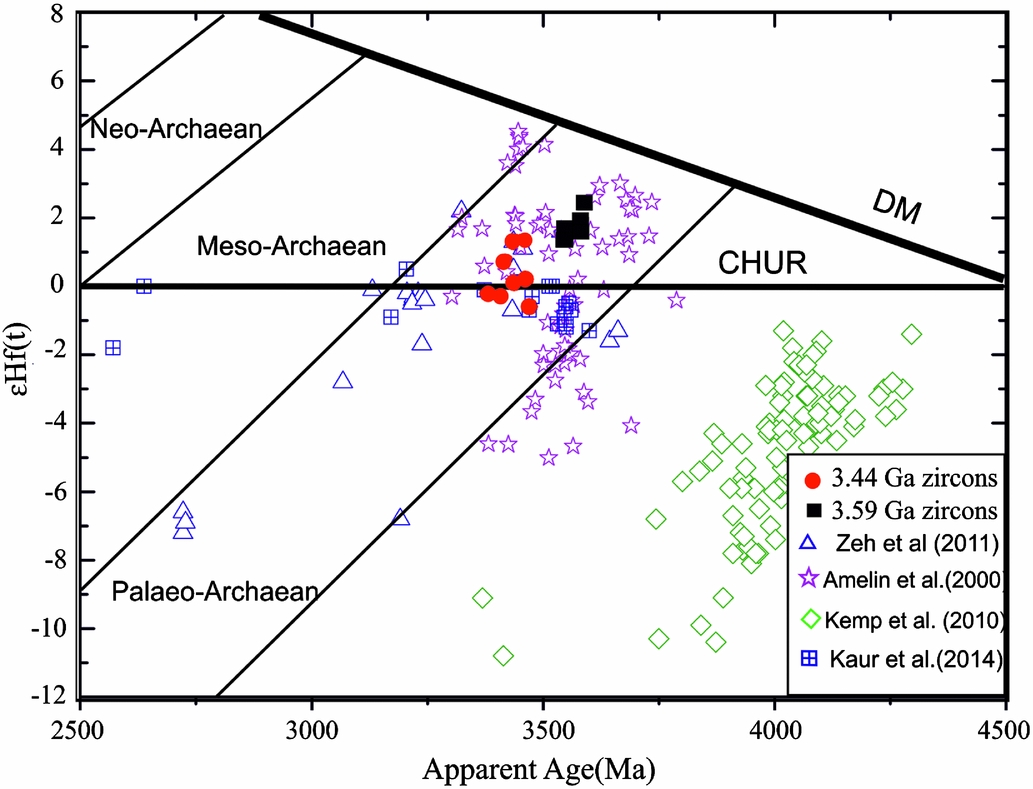
Figure 5. Hf isotope data displayed in the εHf(t) versus U–Pb age diagram of zircons from TTG gneiss sample LB13. Symbols represent analysis of individual growth domains of zircons from the different samples. Shown for comparison are the depleted mantle (Chauvel et al. Reference Chauvel, Lewin, Carpentier, Arndt and Marini2008) and the fields of the Neoarchaean to Palaeoarchaean crust, assuming a crustal 176Lu/177Hf of 0.0113. Hf isotope data from the Archaean zircons of the Ancient Gneissic Complex, Swaziland (Zeh, Gerdes & Millonig, Reference Zeh, Gerdes and Millonig2011), Acasta Gneiss Complex, Barberton Belt, Pilbara Craton (Amelin, Lee & Halliday, Reference Amelin, Lee and Halliday2000), Zack Hills, Australia (Kemp et al. Reference Kemp, Wilde, Hawkesworth, Coath, Nemchin and Pidgeon2010) and Mauranipur area of the Bundelkhand Craton (Kaur, Zeh & Chaudhri, Reference Kaur, Zeh and Chaudhri2014) are also shown.
6. Discussion: Palaeoarchaean crustal evolution of the central part of the Bundelkhand Craton
Our study reports zircon ages (magmatic) of ~ 3.44 Ga from the TTG gneiss (LB13) of the Babina area from the western part of the Bundelkhand Tectonic Zone (Table 1; Fig. 3c). These TTG gneisses are dominantly composed of sodic plagioclase, quartz, biotite, hornblende and chlorite. TDM model ages (~ 3.55 Ga) and near-chondritic εHf (−0.6 to +1.3) values of the zircons indicate an origin of the calc-alkaline magma from melting of a ~ 3.55 Ga mafic crust. A set of older zircons from the gneiss yield a Pb–Pb age of ~ 3.59 Ga (Table 1; Fig. 3c). Average εHf values of these zircons are more suprachondritic (+1.9). The ages of these zircons are similar to the crystallization age (~ 3.56 Ga) of the trondhjemite gneiss from the Mauranipur area of the central Bundelkhand Craton. It is, therefore, concluded that the older zircons (~ 3.59 Ga) represent xenocrystic zircons from a pre-existing felsic crust. Reports of older zircon xenocrysts in TTGs have been made by Acharyaa, Gupta & Orihashi (Reference Acharyaa, Gupta and Orihashi2010) from the 3.45 Ga Singhbhum Granite and also by Kröner et al. (Reference Kröner, Hofmann, Xie, Wu, Münker, Hegner, Wong, Wan and Liu2012) from the Ancient Gneiss Complex in Swaziland. More discordant ages have been obtained from the zircons of the TTG gneiss DUR13 in the study area (Table 2; Fig. 4c). A sole concordant age of ~ 3.44 Ga obtained from the sample indicates that the ~ 3.44 Ga TTG gneisses in the study area have been strongly metamorphosed and possibly re-melted (as observed from multiple melt or leucocratic phases in Fig. 2c, d) during later tectonothermal events.
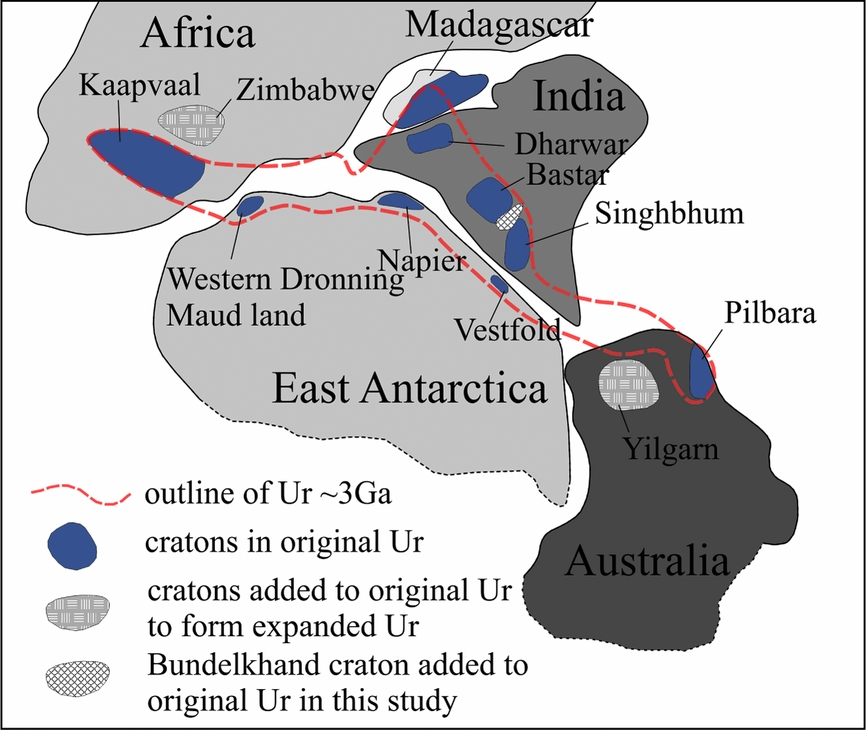
A chronological correlation between the Palaeo- to Mesoarchaean crustal components of the Bundelkhand Craton with other Archaean cratons in peninsular India is given in Table 4. The present study thus indicates that crust-forming processes in the central Bundelkhand Craton initiated at ~ 3.59 Ga, a time-period much older than that of ~ 3.3 Ga as proposed by Mondal et al. (Reference Mondal, Goswami, Deomurari and Sharma2002) (Table 4). A second phase of calc-alkaline magmatism occurred in this part of the craton at ~ 3.44 Ga (Table 4).The correlation indicates that the ~ 3.59 Ga zircon age obtained from the Babina TTG gneiss and that obtained from the Mauranipur area by Kaur, Zeh & Chaudhri (Reference Kaur, Zeh and Chaudhri2014) are similar to that recorded from the TTG gneiss and granites from the central part of the Bastar Craton in central India, the felsic volcanic rocks from the Iron Ore Group and the detrital zircons from the Older Metamorphic Group of the Singhbum Craton in eastern India and the Sargur supracrustal rocks from the Dharwar Craton, southern India (Nutman et al. Reference Nutman, Chadwick, Ramakrishnan and Viswanatha1992; Ghosh, Reference Ghosh2004; Mukhopadhyay et al. Reference Mukhopadhyay, Beukes, Armstrong, Zimmermann, Ghosh and Medda2008; Rajesh et al. Reference Rajesh, Mukhopadhyay, Beukes, Gutzmer, Belyanin and Armstrong2009). The ~ 3.44 Ga age of TTG magmatism recorded from the central part of the Bundelkhand Craton can also be correlated with the time-frame of crystallization of the Older Metamorphic Tonalitic Gneiss and Singhbhum Granite-I in the Singhbhum Craton, and the age of the detrital zircons obtained from supracrustal sequences of the Sargur Group in the Western Dharwar Craton (Mishra et al. Reference Mishra, Deomurari, Wiedenbeck, Goswami, Ray and Saha1999; Maibam, Goswami & Srinivasan, Reference Maibam, Goswami and Srinivasan2011; Table 4). Thus, the crust-forming process in the Bundelkhand Craton initiated in the same time-frame (~ 3.6 Ga) as that recorded from the Bastar and Singhbhum cratons, a time-frame when continental crust formation became widespread throughout the world, as seen in the representative sketch of the Ur Supercontinent in Figure 6. A major episode of tectonothermal activity is recorded in the Bundelkhand Craton at ~ 3.44 Ga and this has so far been recorded only from the Singhbhum Craton. Therefore, it is possible that the North Indian Shield cratons had similar Palaeoarchaean tectonothermal histories. The similar Palaeoarchaean time-frames for the evolution of the Bundelkhand, Bastar and Singhbhum cratons is support for the Bundelkhand Craton being part of the Ur Supercontinent (Fig. 6). Discordant data from the TTG gneiss show three major peaks at ~ 3.0–2.8 Ga, 2.6–2.5 Ga and 2.2–2.0 Ga, indicating lead-loss events that can be correlated, respectively, with high-pressure metamorphism, large-scale granite magmatism and intrusion of mafic dyke swarms, reported from the craton.
Table 4. Correlation of Palaeo–Mesoarchaean crustal components of the Bundelkhand Craton with that recorded from other Archaean cratons of peninsular India


Figure 6. Schematic diagram showing position of the Bundelkhand Craton in the Ur Supercontinent (after Rogers, Reference Rogers1996) that may explain the similar crust-forming processes in the Palaeo–Mesoarchaean.
Acknowledgements
LS acknowledges the Competitive Research Grant (2010-2012) sponsored by the University of KwaZulu-Natal, Durban, South Africa for providing funding for the field work in Bundelkhand Craton. DF acknowledges Fundisile Nkumenge for performing zircon separation and sample preparation. JKP acknowledges GRBM Project, Ministry of Environment and Forest, Govt. of India for providing funding for field work. PN acknowledges the Director, IISER Bhopal, for providing funding for conducting field work. The authors also acknowledge Kåre Kullerud and Allen Nutman for their suggestions to improve the scientific contents of the manuscript. Technical help from Prof. Fernando Corfu is gratefully acknowledged to improve the scientific content and restructuring of the manuscript.
Supplementary material
To view supplementary material for this article, please visit http://dx.doi.org/10.1017/S0016756815000692