1. Introduction
The particular characteristics of different stratigraphic units are major controllers on the development of fracture networks, and affect fluid pathways in subsurface reservoirs (Lorenz, Teufel & Warpinski, Reference Lorenz, Teufel and Warpinski1991; Narr & Suppe, Reference Narr and Suppe1991; Muldoon & Bradbury, Reference Muldoon and Bradbury1998). Surface fracture stratigraphy can be used to characterize and understand such controlling parameters on fracture formation and distribution in the subsurface (e.g. Hanks et al. Reference Hanks, Lorenz, Teufel and Krumhardt1997; Nelson, Reference Nelson2001; Underwood et al. Reference Underwood, Cooke, Simo and Muldoon2003; Di Naccio et al. Reference Di Naccio, Boncio, Cirilli, Casaglia, Morettini, Lavecchia and Brozzetti2005; Cooke et al. Reference Cooke, Simo, Underwood and Rijken2006; Wennberg et al. Reference Wennberg, Svana, Azizzadeh, Aqrawi, Brockbank, Lyslo and Ogilvie2006; Olson, Laubach & Lander, Reference Olson, Laubach and Lander2009; Zahm & Hennings, Reference Zahm and Hennings2009; Barbier et al. Reference Barbier, Hamon, Callot, Floquet and Daniel2012; Bosworth et al. Reference Bosworth, Khalil, Clare, Comisky, Abdelal, Reed, Kokkoros, Spence, Redfern, Aguilera, Bevan, Cosgrove, Couples and Daniel2012; Rotevatn & Bastesen, Reference Rotevatn, Bastesen, Spence, Redfern, Aguilera, Bevan, Cosgrove, Couples and Daniel2012; Sonntag et al. Reference Sonntag, Evans, La Pointe, Deraps, Sisley, Richey, Spence, Redfern, Aguilera, Bevan, Cosgrove, Couples and Daniel2012; Couples, Reference Couples, Spence, Redfern, Aguilera, Bevan, Cosgrove, Couples and Daniel2013).
Fracture stratigraphy has been defined as the classification of layers with different density or spacing of fractures, and the way that these fractures break layers) Corbett, Friedman & Spang, Reference Corbett, Friedman and Spang1987; Nelson, Reference Nelson2001; Gross, Reference Gross2003, Shackleton, Cooke & Sussman, Reference Shackleton, Cooke and Sussman2005; Laubach, Olson & Gross, Reference Laubach, Olson and Gross2009). Fracture stratigraphy studies have been applied for layered rocks both in carbonates (e.g. Huang & Angelier, Reference Huang and Angelier1989; Underwood et al. Reference Underwood, Cooke, Simo and Muldoon2003) and siliciclastic sequences (e.g. Ruf, Rust & Engelder, Reference Ruf, Rust and Engelder1998; Silliphant, Engelder & Gross, Reference Silliphant, Engelder and Gross2002). These studies document how fractures are terminated, usually in special horizons as mechanical surfaces or boundaries (MB). These surfaces have a specific relationship with stratigraphic surfaces (Narr & Suppe, Reference Narr and Suppe1991; Gross, Reference Gross1993; Underwood, Reference Underwood1999; Cooke & Underwood, Reference Cooke and Underwood2001; Underwood et al. Reference Underwood, Cooke, Simo and Muldoon2003; Ortega, Marrett & Laubach, Reference Ortega, Marrett and Laubach2006). In fact, the stratigraphic surfaces are considered as bounding surfaces of stratigraphic units and mechanical surfaces, and are considered as surfaces at which a specific structural pattern (e.g. a joint set) terminates (Narr & Suppe, Reference Narr and Suppe1991; Cooke & Underwood, Reference Cooke and Underwood2001; Graham, Antonellini & Aydin, Reference Graham, Antonellini and Aydin2003; Underwood et al. Reference Underwood, Cooke, Simo and Muldoon2003; Ortega, Marrett & Laubach, Reference Ortega, Marrett and Laubach2006).
Fracture spacing related to rock unit properties (such as lithology, thickness and diagenetic process) has been considered in some fracture stratigraphy studies (Gross et al. Reference Gross, Fisher, Engelder, Greenfield and Ameen1995; Hanks et al. Reference Hanks, Lorenz, Teufel and Krumhardt1997; Hatzor & Palchik, Reference Hatzor and Palchik1997). Based on previous work, structural and tectonic conditions could control fracture attributes and cause changes in fracture spacing, length and aperture (e.g. Bergbauer & Pollard, Reference Bergbauer and Pollard2004; Ortega, Gale & Marrett, Reference Ortega, Gale and Marrett2010; Barbier et al. Reference Barbier, Hamon, Callot, Floquet and Daniel2012; Awdal et al. Reference Awdal, Braathen, Wennberg and Sherwani2013; Watkins, Reference Watkins, Butler, Bond and Healy2015). Many studies also demonstrate that fracture pattern in sedimentary successions is controlled by variations in lithology, diagenesis processes, mechanical properties of the rocks at the time of fracturing, and rock grain size (e.g. Gross, Reference Gross1995; Bjorlykke & Hoeg, Reference Bjorlykke and Hoeg1997; Hanks et al. Reference Hanks, Lorenz, Teufel and Krumhardt1997; Fabbri, Gaviglio & Gamond, Reference Fabbri, Gaviglio and Gamond2001; Laubach, Reference Laubach2003; Gale et al. Reference Gale, Laubach, Marrett, Olson, Holder, Reed, Braithwaite, Rizzi and Darke2004; Wennberg et al. Reference Wennberg, Svana, Azizzadeh, Aqrawi, Brockbank, Lyslo and Ogilvie2006; Ferrill & Morris, Reference Ferrill and Morris2008; Al Kharusi, Reference Al Kharusi2009; Laubach, Olson & Gross, Reference Laubach, Olson and Gross2009; Olson, Laubach & Lander, Reference Olson, Laubach and Lander2009; Laubach et al. Reference Laubach, Eichhubl, Hilgers and Lander2010; Ortega, Gale & Marrett, Reference Ortega, Gale and Marrett2010; Barbier et al. Reference Barbier, Hamon, Callot, Floquet and Daniel2012; Ellis et al. Reference Ellis, Laubach, Eichhubl, Olson and Hargrove2012; Lavenu et al. Reference Lavenu, Lamarche, Salardon, Gallois and Gauthier2012). Although tectonics creates stress which initiates fractures within rocks, lithology still remains the primary controller of fracture development. However, tectonics becomes the dominant factor in higher-stress conditions (Lorenz et al. Reference Lorenz, Farrell, Hanks, Rizer and Sonnenfeld1997). Fracture spacing is also controlled by the thickness of mechanical layers (Price, Reference Price1966; McQuillan, Reference McQuillan1973; Narr & Suppe, Reference Narr and Suppe1991; Gross, Reference Gross1993; Ji & Saruwatari, Reference Ji and Saruwatari1998; Bai & Pollard, Reference Bai and Pollard2000; Wennberg et al. Reference Wennberg, Svana, Azizzadeh, Aqrawi, Brockbank, Lyslo and Ogilvie2006). Indeed, fracture spacing has been considered as the main controller of internal properties of rock units such as porosity, elastic modulus, grain size and tensile strength (Hugman & Friedman, Reference Hugman and Friedman1979; Yale & Jamieson, Reference Yale and Jamieson1994; Hanks et al. Reference Hanks, Lorenz, Teufel and Krumhardt1997; Durrast & Siegesmund, Reference Durrast and Siegesmund1999; Nelson, Reference Nelson2001).
In this study, the impact of different parameters such as lithology, thickness, diagenetic processes and grain size on fracture patterns (including fracture spacing and fracture spacing ratio) are evaluated and compared for different rock units such as dolomitic limestone, limestone, sandstone, conglomerate, argillaceous limestone, marl and shale. In previous work, these evaluations were performed only for one or two rock units. Here, we evaluate fracture patterns via geometrical (scan line method) and statistical analyses in two sections of Dizlu and Kolah Ghazi (the Isfahan region). The study area provides a broad range of different lithologies; Cretaceous sediments are well cropped out and tectonic fractures are well developed. This study determines whether integration of structural-stratigraphy interpretations can lead to predictive understanding of fracture pattern throughout different cropped-out rock units or even rock units in the subsurface. This research also contributes to fluid flow (underground water or hydrocarbon) studies within subsurface rock units.
2. Geological setting
The study area (in the vicinity of Isfahan city) is located in the central part of the Iran plateau (Fig. 1). Based on geological classification, Isfahan province covers (from NE to SW) some parts of the Central Iran zone, the Urumieh–Dokhtar magmatic arc, the Sanandaj–Sirjan zone and the Zagros fold–thrust belt (Aghanabati, Reference Aghanabati2004). Geologically, broad sequences of sedimentary, metamorphic and igneous rocks with different ages are exposed in this province. Precambrian and Palaeozoic metamorphic rocks exist mainly in eastern regions while Mesozoic and Cenozoic deposits are exposed in other parts of the province (Zahedi, Reference Zahedi1978; Sorbi, Reference Sorbi2002). After relative stability during Palaeozoic–Mesozoic times in this region, important tectonic movements occurred along with different disconformities and metamorphisms during Late Triassic – Early Cretaceous time. The second phase of the Alpine tectonic event during Jurassic–Cretaceous time occurred with folding (Central Iran), parallel unconformity (the Alborz, Kopeh Dagh and Zagros mountain ranges) and emplacement of igneous intrusive and metamorphic masses (Aghanabati, Reference Aghanabati2004).
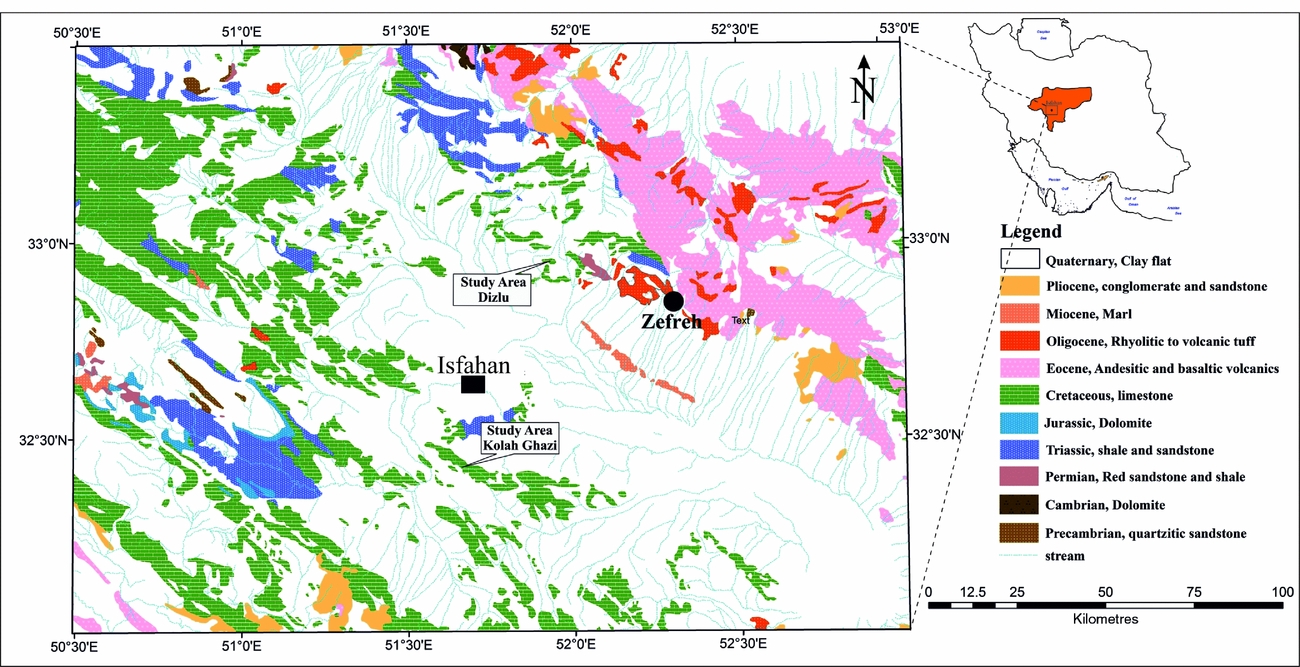
Figure 1. Geological map of the Isfahan region including Dizlu and Kolah Ghazi areas (modified after Zahedi, Reference Zahedi1978). Exposed sedimentary units in Dizlu and Kolah Ghazi areas belong to Lower and Upper Cretaceous units, located in the NE and south of the Isfahan region, respectively.
A complete section of Lower Cretaceous sediments is present within the Dizlu area (WGS84: 33° 03' 14'' N, 51° 58' 50'' E) (Figs 1, 2a). These sediments include conglomerate, sandstone, limestone and shale units which rested as angular unconformity on shale layers (Rhaetian–Lias). Based on Foraminifera (fossil), these rock units are assigned late Barremian – early Albian age (A. Safari, unpub. M.Sc. thesis, University of Isfahan, Iran, 1995). Moreover, a complete succession of Upper Cretaceous deposits crops out within the Kolah Ghazi area (Figs 1, 2b). Cropped out stratigraphic units in this area consist of sandy glauconitic limestone (upper Albian – Cenomanian), Inoceramus limestone (Turonian–Coniacian), marl (Santonian–Campanian) and argillaceous limestone (Maastrichtian) (Yazdi, Bahrami & Vega, Reference Yazdi, Bahrami and Vega2009). These units are rested disconformably on Lower Cretaceous units (Seyed-Emami, Brants & Bozorgnia, Reference Seyed-Emami, Brants and Bozorgnia1971). Further, M. Sadri (unpub. MSc. Thesis, Islamic Azad University Khorasgan (Isfahan) Branch, Iran, 2009) identified five stratigraphic units in Takhte Shidan Mountain (Kolah Ghazi area). These units consist of hard-ground pelagic limestone, glauconitic pelagic limestone, lower pelagic limestone, argillaceous pelagic limestone and upper pelagic limestone. In the Shidan mountain (Kolah Ghazi area), total thickness of sedimentary units is c. 330 m. These units include alternation of marl and argillaceous limestone (248.6 m thickness), covered by a 81 m thick layer of Rudist limestone (M. Sadri, unpub. MSc. Thesis, Islamic Azad University Khorasgan (Isfahan) Branch, Iran, 2009).

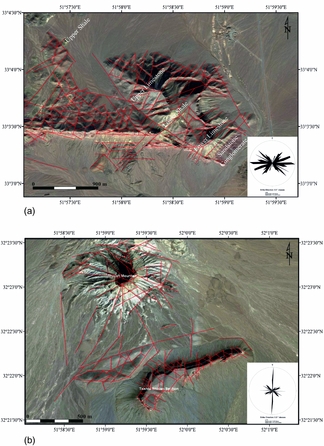
Figure 2. (a) Satellite image of Dizlu area, outcrop of Lower Cretaceous units and their main fracture system. (b) Satellite image of the Takhte Shidan and Shidan mountain sections in Kolah Ghazi area, outcrop of Upper Cretaceous units and their main fracture system. Rose diagrams, based on satellite image fracture interpretation for Dizlu and Kolah Ghazi areas, show main trends of the fractures.
In addition to well-cropped-out Cretaceous sediments (a broad range of different lithology), in two sections of Dizlu and Kolah Ghazi (the Isfahan region) tectonic natural fractures are well developed within these areas (Fig. 2). Farzipour Saein et al. (Reference Farzipour Saein, Tajmir Riahi, Safaei and Beygi2015) determined 28 mechanical units (MUs) within Lower and Upper Cretaceous sediments based on fracture patterns throughout different stratigraphic units in the area (Fig. 3).

Figure 3. The identified mechanical units in Dizlu area. Broad ranges of different lithology exist in Dizlu and Kolah Ghazi of Isfahan. Twenty-eight mechanical units (MUs) are determined within Lower and Upper Cretaceous sediments based on the fracture patterns throughout different stratigraphic units in the area (Farzipour Saein et al. Reference Farzipour Saein, Tajmir Riahi, Safaei and Beygi2015).
3. Methodology
Fracture spacing (FS) and fracture spacing ratio (FSR) have been used to quantify the abundance of fractures in a reservoir (Nelson, Reference Nelson2001). Fracture spacing is defined as the average (or modal) perpendicular distance between two adjacent fractures of the same fracture set, measured along a scan line (Priest, Reference Priest1993; Nelson, Reference Nelson2001; Singhal & Gupta, Reference Singhal and Gupta2010). FS is the reciprocal of fracture density and controls fracture intensity and matrix block size (Singhal & Gupta, Reference Singhal and Gupta2010). Variations in FS affect the porosity and permeability of different reservoirs (Nelson, Reference Nelson2001). To measure FS, orientation bias can be removed by weighting or correcting data by a factor w = 1/cosθ, where θ is the angle between the sampling line and the line perpendicular to each fracture set. True fracture spacing (FS) can therefore be obtained from the correction angle (θ) and measured fracture spacing (FSmeas) from the equation:
 $$\begin{equation*} {\rm{FS}} = {\rm{F}}{{\rm{S}}_{{\rm{meas}}}}\cos \,\theta . \end{equation*}$$
Similar techniques are widely used to determine fracture spacing (e.g. LaPointe & Hudson, Reference LaPointe and Hudson1985; Barton & Zoback, Reference Barton, Zoback, Barton and Stephansson1990, Reference Barton and Zoback1992; Peacock & Sanderson, Reference Peacock and Sanderson1993). Fracture spacing ratio (FSR) is defined as the ratio of the median fracture spacing to the bed thickness. FSR can be used to compare fracture spacing among different layers (Gross, Reference Gross1993; Gross et al. Reference Gross, Fisher, Engelder, Greenfield and Ameen1995; Ruf, Rust & Engelder, Reference Ruf, Rust and Engelder1998; Bai & Pollard, Reference Bai and Pollard2000; Al Kharusi, Reference Al Kharusi2009).
In this study, field measurements and geometrical analysis of fractures have been performed to study fracture patterns in two areas (Dizlu and Kolah Ghazi). These areas are extremely cluttered due to lead-zinc and stone mining operations (Yousefzadeh, Zamanian & Makizadeh, Reference Yousefzadeh, Zamanian and Makizadeh2012; Zamanian et al. Reference Zamanian, Ahmadnejad, Yousefzadeh and Makizadeh2013). Suitable outcrops which are intact and not cluttered were therefore chosen for fracture stratigraphy. Using the scan line method (Priest, Reference Priest1993; Wu & Pollard, Reference Wu and Pollard1995; Priest, Reference Priest2004; Wennberg et al. Reference Wennberg, Svana, Azizzadeh, Aqrawi, Brockbank, Lyslo and Ogilvie2006), FS and FSR were computed for several sedimentary rock units.
4. Fracture study
From measured and computed data from two sections of Dizlu and Kolah Ghazi (Table 1), the effects of controlling parameters such as lithology, thickness, diagenetic process and grain size of the rock units (Cretaceous sediments) on fracture patterns are analysed.
Table 1. Exposed stratigraphic units and sub-units in Dizlu and Kolah Ghazi areas (A. Safari, unpub. M.Sc. thesis, University of Isfahan, Iran, 1995; M. Sadri, unpub. M.Sc. thesis, Islamic Azad University Khorasgan (Isfahan) Branch, Iran, 2009) along with the identified mechanical units (Farzipour Saein et al. Reference Farzipour Saein, Tajmir Riahi, Safaei and Beygi2015) and collected data of fractures. MU – mechanical units; MFS – median fracture spacing; AFS – average fracture spacing; NFS – number of fracture spacing measured; SDFS – standard deviation of fracture spacing; AT – average thickness; and FSR – fracture spacing ratio.

4.a. Lithology
For layers with the same average thickness and variable lithology, changes in FS and FSR are evaluated. In the study area, the thickness of mechanical layers ranges from very thick (˃100 cm) to thick (30–100 cm), medium thickness (10–30 cm) and thin (1–10 cm) (Tucker, Reference Tucker2001). The FS measurements for the very thick layers demonstrate ascending values from dolomitic limestone to limestone, sandstone and conglomerate rock units (Figs 4a, b, 5a). Within the thick layers, FS increases from dolomitic limestone to limestone, sandstone, conglomerate and argillaceous limestone rock units (Figs 5a, 6). In the medium-thickness units, FS increases from dolomitic limestone to conglomerate, sandstone, limestone and argillaceous limestone rock units (Fig. 5a). For the thin layers, minimum FS is observed in sandstone (Fig. 5a).

Figure 4. Effects of variable lithology parameters on FS, considering constant thickness (very thick layer) for sedimentary units: (a) dolomitic limestone units; and (b) limestone units.
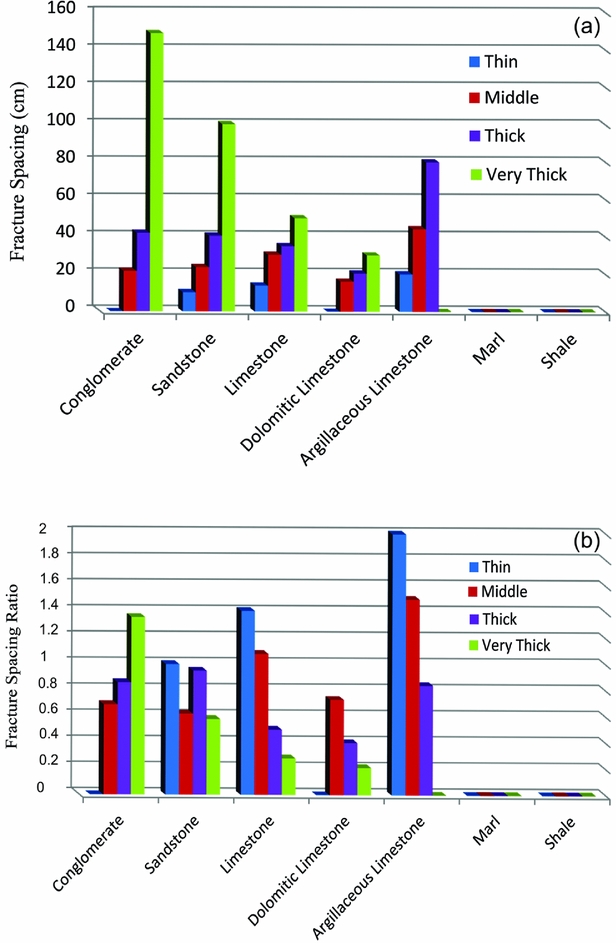
Figure 5. Statistical diagram for the fracture pattern analysis in response to the variable lithology for sedimentary rock units throughout the study area: (a) average fracture spacing; and (b) average fracture spacing ratio.
Regarding FSR, for the very thick layers FSR increases from dolomitic limestone to limestone, sandstone and conglomerate rock units (Fig. 5b). For the thick layers, minimum and maximum FSR are calculated for dolomitic limestone and sandstone rock units, respectively (Fig. 5b). Within the medium-thickness layers, FSR increases from sandstone to conglomerate, dolomitic limestone, limestone and argillaceous limestone rock units (Fig. 5b). For the thin layers, the minimum and maximum FSR are observed in sandstone and argillaceous limestone rock units, respectively (Fig. 5b). Note that fracture data gathering was not possible within the marl and shale layers due to their weak mechanical properties (Zhang, Reference Zhang2005; Fig. 7).
4.b. Thickness
Changes in FS and FSR are evaluated while assuming constant lithology for rock units with variable thickness. FS decreases with decreasing average thickness (Figs 4a, 5a, 6b, d, 8), while FSR decreases with increasing average thickness of dolomitic limestone, limestone and argillaceous limestone units (in ascending order). However, sandstone and conglomerate units do not follow this pattern (Fig. 5b). Within conglomerate units, FSR increases with increasing average thickness (Fig. 5b).
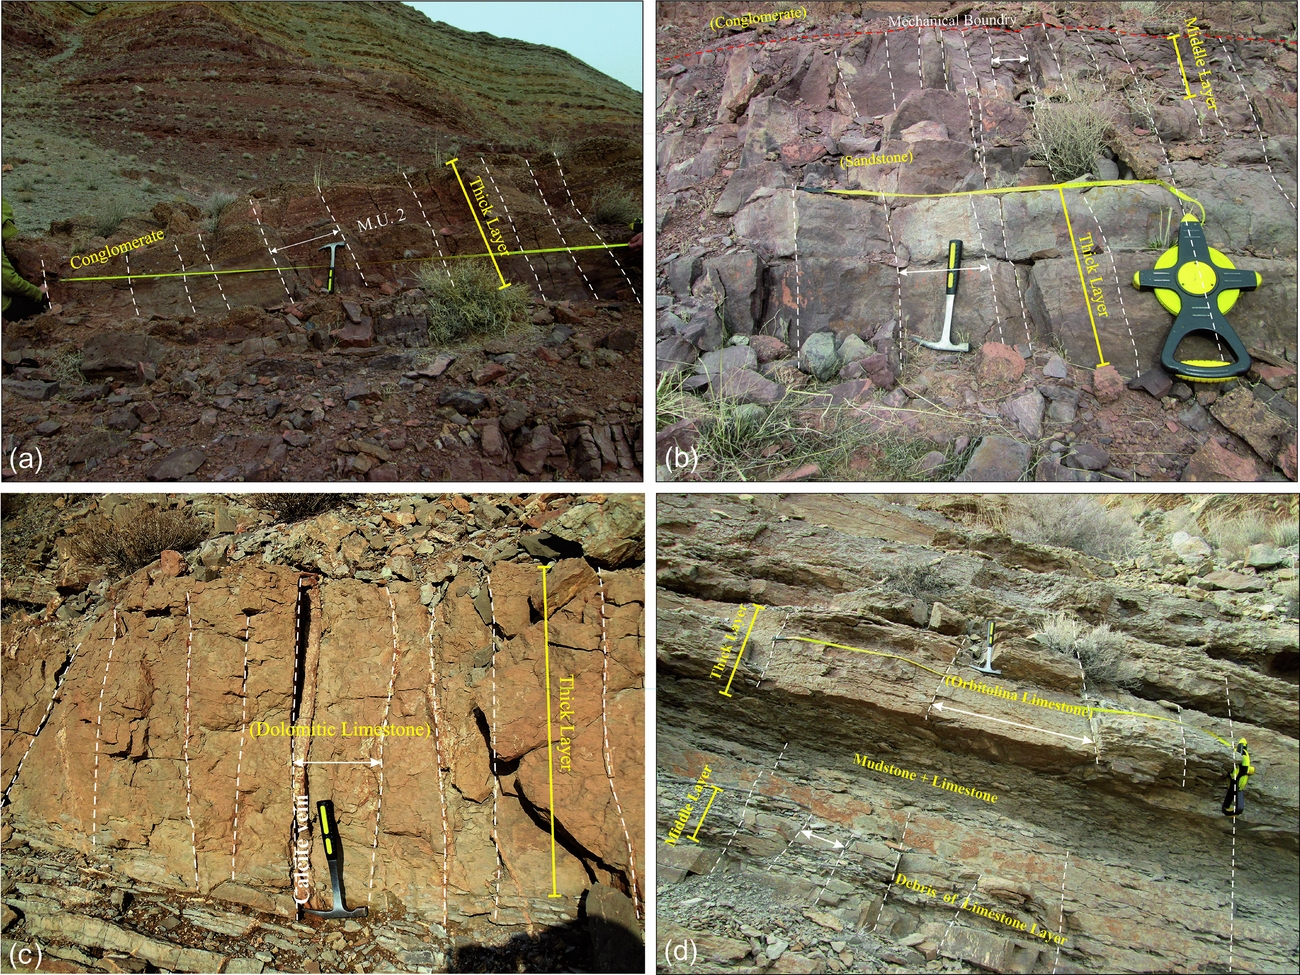
Figure 6. Effect of the variable lithology parameter on fracture density (FD) and FS considering constant thickness (thick layer) for the sedimentary units: (a) conglomerate units; (b) sandstone units; (c) dolomitic limestone units, based on opening (mostly filled by calcite) of the observed fractures in the study area, demonstrate tensile mode (Fossen, Reference Fossen2010); and (d) limestone units.
Figure 7. Two different views from the outcrop of the incompetent marl layers in Dizlu section, where there exists a lack of fracture data.
4.c. Diagenetic processes
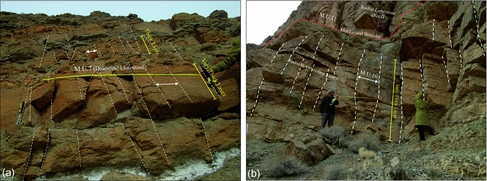
In addition to the effects on properties of host rocks, diagenesis can also affect fracture properties by processes of dissolution along fractures and precipitation of cement in fractures (Olson, Laubach & Lander, Reference Olson, Laubach, Lander, Lonergan, Jolley, Sanderson and Rawnsley2007; Hooker et al. Reference Hooker, Gomez, Laubach, Gale, Marrett, Garland, Neilson, Laubach and Whidden2012). Timing evidence of fracturing can be acquired from sealed, micrometre-scale fractures (Laubach, Reference Laubach2003). The timing of fracturing can be determined within Cretaceous sediments throughout the study area, based on presented thin-sections in previous work (A. Safari, unpub. M.Sc. thesis, University of Isfahan, Iran, 1995; Safari, Reference Safari2000; Yousefzadeh, Zamanian & Makizadeh, Reference Yousefzadeh, Zamanian and Makizadeh2012; Karimzadeh, Mehrabi & Bazargani Gilani, Reference Karimzadeh, Mehrabi and Bazargani Gilani2015). In the study area limestone rock units were initially affected by diagenetic events (e.g. dolomitization), creating dolomitic limestone. During the Laramide orogeny, several fracture sets occurred within Cretaceous sediments (Safari, Reference Safari2000; Yousefzadeh, Zamanian & Makizadeh, Reference Yousefzadeh, Zamanian and Makizadeh2012). Most of the observed fractures in the study area demonstrate a sharp opening, mostly filled by calcite (Fig. 6c); it can therefore be considered that fractures in the area demonstrate tensile mode (Fossen, Reference Fossen2010; Fig. 6c). Diagenetic events such as dolomitization of limestone in the study area have generated different FS and FSR values for carbonate rock units with the same thickness: FS and FSR values in dolomitic limestone units are lower compared to limestone units (Figs 4, 5, 6c, d). In general, dolomitic limestone units with various thicknesses have minimum FS values among different sedimentary rock units (Fig. 5a). Minimum FSR is observed in dolomitic limestones with thick and very thick layers (Fig. 5b).
5. Discussion
Lithology, thickness, diagenetic processes and grain size are controllers of fracture patterns (e.g. FS and FSR parameters) in sedimentary layers (Narr & Suppe, Reference Narr and Suppe1991; Gross et al. Reference Gross, Fisher, Engelder, Greenfield and Ameen1995; Nelson, Reference Nelson2001; Al Kharusi, Reference Al Kharusi2009). This study demonstrates that fracture patterns within different stratigraphic units in two sections of Dizlu and Kolah Ghazi can be affected by lithology, layer thickness, diagenesis processes (such as dolomitization) and grain size of the rock units (Table 1, Figs 4–8). The FS and FSR can be used to compare fracture patterns in beds with variable thickness and variable lithology (Narr & Suppe, Reference Narr and Suppe1991). In this study two distinct scenarios – (1) variable lithology and constant layer thickness; and (2) constant lithology and variable layer thickness – are considered for a study of fracture pattern in different rock units with various lithologies and layer thicknesses.
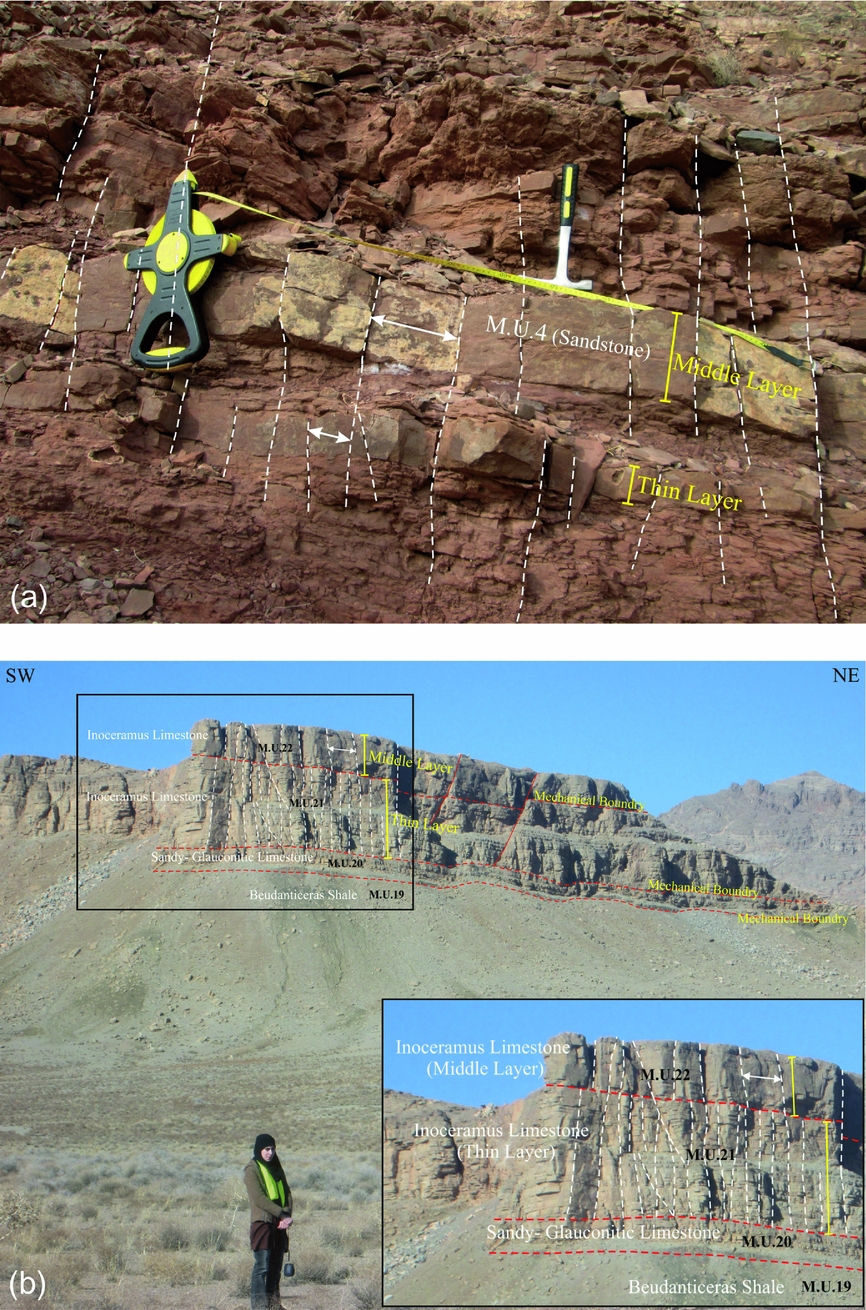
Figure 8. Interaction between FS and variable thickness of sedimentary units: (a) sandstone units in Dizlu section; and (b) limestone units in Kolah Ghazi section.
5.a. Variable lithology and constant layer thickness
Rock lithology has an important effect on fracture distribution (Wennberg et al. Reference Wennberg, Svana, Azizzadeh, Aqrawi, Brockbank, Lyslo and Ogilvie2006; Ferrill & Morris, Reference Ferrill and Morris2008; Ortega, Gale & Marrett, Reference Ortega, Gale and Marrett2010; Barbier et al. Reference Barbier, Hamon, Callot, Floquet and Daniel2012). For layers with the same average thickness but variable lithology, minimum FS values are generally observed in dolomitic limestone, limestone, sandstone, conglomerate and argillaceous limestone rock units (in descending order; Fig. 5a).
Elastic (or Young's) module describes rock capacity for deformation and its degree of stiffness. In a high elastic module, a rock is stiffer and less deformable (Hudson & Harrison, Reference Hudson and Harrison1997; Nelson, Reference Nelson2001; Gudmundsson, Reference Gudmundsson2011). Stress shadow is increased in the lateral extent with increasing Young's module. This implies that fracture spacing should be greater in beds with higher Young's modulus (Warpinski, Wolhart & Wright, Reference Warpinski, Wolhart and Wright2004; Soliman, East & Adams, Reference Soliman, East and Adams2008; Cheng, Reference Cheng2009). However, there are exceptions and some stiffer beds in nature have closer-spaced joints than beds with lower Young's modulus. Despite a larger stress shadow, a stiffer bed contains more joints relative to other beds as jointing in the stiffer bed occurs at lower strain levels (Gross et al. Reference Gross, Fisher, Engelder, Greenfield and Ameen1995). This could be observed in some sedimentary rock sequences where fractures are often well, or exclusively, developed in the stiffer layers (e.g. dolomite-rich carbonates; Bourne, Reference Bourne2003; Ferrill & Morris, Reference Ferrill and Morris2008; Memarian, Reference Memarian2009; Ortega, Gale & Marrett, Reference Ortega, Gale and Marrett2010; Schöpfer et al. Reference Schöpfer, Arslan, Walsh and Childs2011; Barbier et al. Reference Barbier, Hamon, Callot, Floquet and Daniel2012). Dolomitic limestone units are therefore generally stiffer and have lower FS than limestone rock units (Figs 5a, 6c, d).
In addition, FS is expected to fall in response to a falling ratio of layer tensile to interface shear strength (T/s) (Schöpfer et al. Reference Schöpfer, Arslan, Walsh and Childs2011). In dolomite-rich carbonates, tensile strength (or T/s) is lower than in limestone rock units (Zhang, Reference Zhang2005; Peng & Zhang, Reference Peng and Zhang2007; Memarian, Reference Memarian2009). Accordingly, dolomite-rich carbonates have lower FS compared with limestone rock units (Figs 5a, 6c, d). Despite their higher Young's module and lower tensile strength compared with sandstone units (Zhang, Reference Zhang2005; Peng & Zhang, Reference Peng and Zhang2007; Memarian, Reference Memarian2009), limestone units have lower FS due to layering (Figs 5a, 6b, d). Generally, layered sandstone rock units have lower FS compared with conglomerates (Ogata et al. Reference Ogata, Senger, Braathen, Tveranger, Olaussen, Spence, Redfern, Aguilera, Bevan, Cosgrove, Couples and Daniel2012; Figs 5a, 6a, b).
Although Young's module in sandstone is higher than in conglomerate rock units (Zhang, Reference Zhang2005; Peng & Zhang, Reference Peng and Zhang2007; Memarian, Reference Memarian2009), its grain size affects rock strength and fracture initiation (Hugman & Friedman, Reference Hugman and Friedman1979; Hatzor & Palchik, Reference Hatzor and Palchik1997). Sandstone is a fine-grained rock and conglomerate is coarse-grained (Edelbro, Reference Edelbro2003). Decreasing grain size leads to increasing fracture initiation stress and, finally, decreasing FS (Nelson, Reference Nelson2001). Indeed, beds with finer grain size are often thinner than corresponding coarser-grained beds; their FS are therefore generally lower (Nelson, Reference Nelson2001). Argillaceous limestones are often associated with high fracture spacing (Fig. 5a) as they have lower elastic modulus than other rock units (Zhang, Reference Zhang2005; Peng & Zhang, Reference Peng and Zhang2007; Ferrill & Morris, Reference Ferrill and Morris2008; Memarian, Reference Memarian2009). Shale and marl units also act as ductile weak layers (Gross, Reference Gross1995), meaning that fractures cannot be observed clearly within these layers (Fig. 7).
Several exceptions are observed in this study. For instance, in the medium-thickness rock units, conglomerates have lower FS compared with sandstones (Fig. 5a). This is supported by other studies (e.g. Van Golf-Racht, Reference Van Golf-Racht1982; Ogata et al. Reference Ogata, Senger, Braathen, Tveranger, Olaussen, Spence, Redfern, Aguilera, Bevan, Cosgrove, Couples and Daniel2012). The reason could be due to the grain/matrix ratio of clastic rocks (Ogata et al. Reference Ogata, Senger, Braathen, Tveranger, Olaussen, Spence, Redfern, Aguilera, Bevan, Cosgrove, Couples and Daniel2012). Comparison of the thin and medium-thickness layers of sandstones and limestones demonstrates that FS of sandstone is lower than limestone (Fig. 5a). This could be due to diagenetic events (cementation) in the sandstone, increasing its strength relative to limestone (Peng & Zhang, Reference Peng and Zhang2007; Memarian, Reference Memarian2009; Fig. 8). Indeed, dolomitization of limestone (another kind of diagenetic process) causes FS and FSR to decrease (Figs 4–6, 9). Calcite-bearing rock units demonstrate lower FS within mechanically stiffer dolomite mineral-bearing rock units (Yale & Jamieson, Reference Yale and Jamieson1994; Gale et al. Reference Gale, Laubach, Marrett, Olson, Holder, Reed, Braithwaite, Rizzi and Darke2004; Memarian, Reference Memarian2009; Lavenu et al. Reference Lavenu, Lamarche, Salardon, Gallois and Gauthier2012).
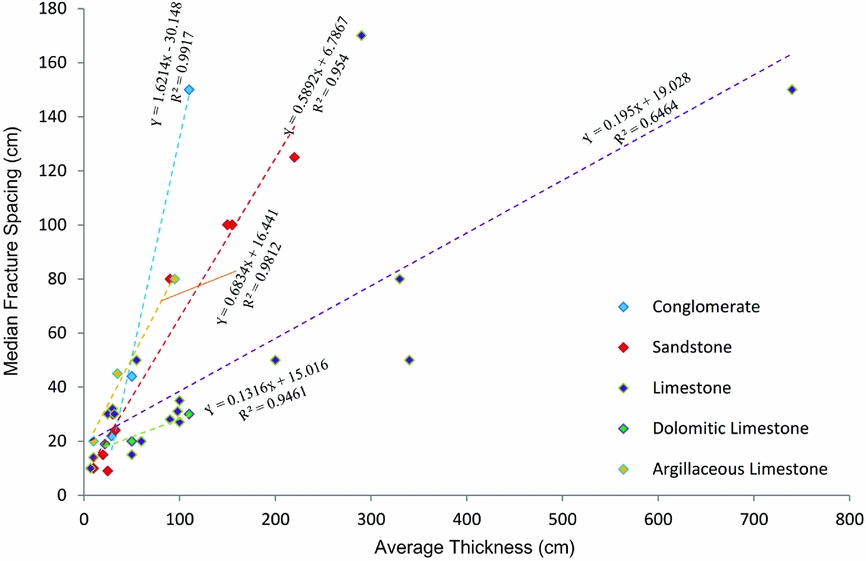
Figure 9. Graph of median fracture spacing v. average thickness for the different lithology in the study area (Dizlu and Kolah Ghazi sections). FSR is calculated using the slope of the best-fit line to the data points. R 2 is coefficient of determination.
FSR can be obtained for different rock units with different thicknesses by plotting points showing median fracture spacing versus mean bed thickness, and measuring the slope of the best-fit line (Gross, Reference Gross1993; Gross et al. Reference Gross, Fisher, Engelder, Greenfield and Ameen1995; Ruf, Rust & Engelder, Reference Ruf, Rust and Engelder1998; Bai & Pollard, Reference Bai and Pollard2000; Al Kharusi, Reference Al Kharusi2009; Fig. 9). FSR was calculated in dolomitic limestone (0.13; R 2 = 0.95), limestone (0.19; R 2 = 0.65), sandstone (0.59; R 2 = 0.95), argillaceous limestone (0.68; R 2 = 0.98) and conglomerate units (1.6; R 2 = 0.99) (Fig. 9). Coefficients of determination (R 2) show well-normalized datasets for each lithology. Conglomerate units in the Dizlu area display significantly higher FSR values, and therefore more distantly spaced joints relative to bed thickness than other rock types. This higher FSR exists despite lower Young's module of conglomerate. How such a joint spacing distribution can develop has been considered in terms of numerical models and theoretical considerations (Gross et al. Reference Gross, Fisher, Engelder, Greenfield and Ameen1995). Despite a smaller stress reduction shadow, a weaker bed contains less joints relative to other beds as jointing in weaker beds occurs in higher-strain levels (Gross et al. Reference Gross, Fisher, Engelder, Greenfield and Ameen1995). Furthermore, the large grain size of conglomerate among other rock types is another contributing factor. Consequently, this causes conglomerate to contain fewer joints and higher FSR relative to other beds (Fig. 9). In the case of variable lithology and constant layer thickness, FS and FSR are directly related. In other words, for constant layer thickness, the main controller of fracture distribution is lithology for both FS and FSR.
5.b. Constant lithology and variable layer thickness
Generally, for layers with variable thickness and constant lithology, FS decreases and FSR increases with decreasing average thickness of sedimentary rock units (Figs 5, 6b, d, 8, 9). Note that fracture patterns are controlled by the thickness of the mechanical layer (Gross, Reference Gross1993; Gross, Reference Gross1995; Gross et al. Reference Gross, Fisher, Engelder, Greenfield and Ameen1995; Wu & Pollard, Reference Wu and Pollard1995; Ji & Saruwatari, Reference Ji and Saruwatari1998; Shaocheng, Zheming & Zichao, Reference Shaocheng, Zheming and Zichao1998; Bai & Pollard, Reference Bai and Pollard2000; Wennberg et al. Reference Wennberg, Svana, Azizzadeh, Aqrawi, Brockbank, Lyslo and Ogilvie2006). Consequently, fracture spacing increases with increasing layer thickness (Ladeira & Price, Reference Ladeira and Price1981; Huang & Angelier, Reference Huang and Angelier1989; Narr & Suppe, Reference Narr and Suppe1991; Wu & Pollard, Reference Wu and Pollard1995; Ji & Saruwatari, Reference Ji and Saruwatari1998; Gillespie et al. Reference Gillespie, Walsh, Watterson, Bonson and Manzocchi2001; Tang et al. Reference Tang, Liang, Zhang, Chang, Tao, Wang, Zhang, Liu, Zhu and Elsworth2008; Iyer & Podladchikov, Reference Iyer and Podladchikov2009; Figs 5a, 6b, d, 8), illustrating that the formation of joints relieves tensile stress in a layer over a lateral distance proportional to joint length (Mitra, Reference Mitra1988). In addition, FSR in dolomitic limestone, limestone and argillaceous limestone units increases in response to layer thickness reduction. However, sandstone and conglomerate units do not follow this pattern (Fig. 5b). Conglomerates are the coarsest-grained rock units among other sedimentary rock units (Edelbro, Reference Edelbro2003). Beds with coarser grain size are often thicker (Nelson, Reference Nelson2001), so median fracture spacing and layer thickness are higher in these units. As a result, FSR could be of increased value.
Supporting previous work (Narr & Suppe, Reference Narr and Suppe1991; Gross, Reference Gross1995; Gross et al. Reference Gross, Fisher, Engelder, Greenfield and Ameen1995; Wu & Pollard, Reference Wu and Pollard1995; Hanks et al. Reference Hanks, Lorenz, Teufel and Krumhardt1997; Ji & Saruwatari, Reference Ji and Saruwatari1998; Shaocheng, Zheming & Zichao, Reference Shaocheng, Zheming and Zichao1998), this study shows a linear relationship between fracture spacing and layer thickness of the rock units (Fig. 9). In general, ignoring different lithology, all data points display a correlation between median fracture spacing and bed thickness in rock units for thicknesses <50 cm (Fig. 9). However, in response to increasing bed thickness, the relationship is not linear and becomes scattered (Fig. 9). This scattered plot could be attributed to the presence of internal beds, the boundaries of which may act as bedding internal mechanical unit boundaries (Al Kharusi, Reference Al Kharusi2009). These observations should be considered with caution beyond this range of average thickness. Drawing a 1:1 correlation line shows different data points (median fracture spacing v. average thickness of rock units) with distribution pattern above and below it (Fig. 9). The data points above the 1:1 line demonstrate that the ratio of fracture spacing to average thickness of the rock units is >1, and for points below the 1:1 line is <1 (Fig. 9). This can be considered as the effect of other parameters, such as lithology and grain size. In the case of constant lithology and variable layer thickness, FS and FSR are inversely related. In other words, when considering rock units of consistent lithology, the main controller of fracture distribution is layer thickness (both for FS and FSR).
Generally, dolomitic limestone and thinner layers have the lowest FS and FSR values compared with other rock units (Table 1, Figs 5, 9). Dolomitic limestone and limestone layers (particularly thin layers) have favourable potential as reservoir rocks for fluid flow such as underground water or hydrocarbon. Finally, fracture patterns are not affected by a single factor; a set of parameters should be considered and evaluated together.
6. Conclusions
(1) Fracture patterns can be affected by lithology, diagenetic processes, layer thickness and the grain size of rock units.
(2) If lithology is the only parameter affecting fracture pattern, FS and FSR are generally directly related. Lower FS and FSR values were observed in dolomitic limestone, limestone, sandstone, conglomerate and argillaceous limestone units, in ascending order.
(3) If thickness is the controlling parameter affecting fracture pattern, FS and FSR are generally inversely related. FS decreases and FSR increases in response to decreasing average thickness in different sedimentary units.
(4) In general, setting aside different lithology, all data points displayed correlation between median fracture spacing and bed thickness in rock units with thicknesses <50 cm. However, with increasing bed thickness, the relation is no longer linear and becomes scattered.
(5) Diagenetic events such as dolomitization of limestones causes FD to increase and FS and FSR to decrease within carbonate rock units compared with other sedimentary units. Cementation of rock units also causes FS to decrease.
(6) Dolomitic limestones and limestone units have maximum FD and minimum FS and FSR compared with other sedimentary rock units.
(7) Dolomitic limestone and limestone layers (particularly thin layers) have favourable potential as reservoir rocks for fluid flow such as underground water or hydrocarbons. These rock units are therefore considered with priority for hydrocarbon and hydrogeology studies around Isfahan.
(8) Fracture patterns are not affected by any single factor; a set of parameters should be considered and evaluated for analysing fractures.
Acknowledgements
We would like to express our appreciation to the Research Deputy of the University of Isfahan and the Department of Geology for their support and assistance in performing various stages of this research. Jonathan Imber is also thanked for his constructive comments.