


1. Introduction
Adakites are geochemically intermediate to felsic magmatic products formed by the melting of subducted young and hot oceanic crust (Defant & Drummond, Reference Defant and Drummond1990) in subduction-zone settings. Adakite is generally characterized by unusual geochemical features such as the following: (1) SiO2 ≥ 56 wt %, Al2O3 ≥ 15 wt %, and usually MgO < 3 wt %; (2) low Y and heavy rare earth elements (HREEs) relative to the normal andesite–dacite–rhyolite (ADR) series (e.g. Y and Yb ≤ 18 and 1.9 ppm, respectively) and high Sr relative to island arc ADRs; and (3) low high-field-strength elements (HFSEs), as in most island arc ADRs. These geochemical characteristics are required for slab melting under pressures high enough to stabilize garnet ± amphibole without plagioclase (Kay, Reference Kay1978; Defant & Drummond, Reference Defant and Drummond1990; Rapp, Watson & Miller, Reference Rapp, Watson and Miller1991; Peacock, Rushmer & Thompson, Reference Peacock, Rushmer and Thompson1994; Şen & Dunn, Reference Şen and Dunn1994; Drummond, Defant & Kepezhinskas, Reference Drummond, Defant and Kepezhinskas1996; Martin, Reference Martin1999).
The petrogenesis of adakitic rocks has been hotly debated during the last two decades (e.g. Defant et al. Reference Defant, Xu, Kepezhinskas, Wang, Zhang and Xiao2002; Richards & Kerrich, Reference Richards and Kerrich2007; Moyen, Reference Moyen2009; Castillo, Reference Castillo2012). It is commonly accepted that adakites are the products of slab melts that variably interacted with the peridotitic mantle in the subduction zone (Rapp et al. Reference Rapp, Shimizu, Norman and Applegate1999; Prouteau et al. Reference Prouteau, Scaillet, Pichavant and Maury2001; Condie, Reference Condie2005; Martin et al. Reference Martin, Smithies, Rapp, Moyen and Champion2005; Zheng et al. Reference Zheng, Hou, Gong and Liang2014). However, alternative genetic models for adakitic rocks have been proposed, including fractional crystallization from parental basaltic magmas (Castillo, Janney & Solidum, Reference Castillo, Janney and Solidum1999; Macpherson, Dreher & Thirwall, Reference Macpherson, Dreher and Thirwall2006; Li et al. Reference Li, Li, Li, Lo, Wang, Ye and Yang2009), mixing of mantle-derived mafic magma and crust-derived felsic magma (Guo et al. Reference Guo, Nakamuru, Fan, Kobayoshi and Li2007; Streck, Leeman & Chesley, Reference Streck, Leeman and Chesley2007) and partial melting of thickened/delaminated lower crust and subducting continental crust (Atherton & Petford, Reference Atherton and Petford1993; Xu et al. Reference Xu, Castillo, Li, Yu, Zhang and Han2002, Reference Xu, Hergt, Gao, Pei, Wang and Yang2008, Reference Xu, Zhang, Guo and Yuan2010, Reference Xu, Ma and Zhang2012; Chung et al. Reference Chung, Liu, Ji, Chu, Lee, Wen, Lo, Lee, Qian and Zhang2003; Gao et al. Reference Gao, Rudnick, Yuan, Liu, Liu, Xu, Ling, Ayers, Wang and Wang2004; Condie Reference Condie2005; Wang, Q. et al. Reference Wang, McDermott, Xu, Bellon and Zhu2005, Reference Wang, Xu, Jian, Bao, Zhao, Li, Xiong and Ma2006, Reference Wang, Wyman, Xu, Jian, Zhao, Li, Xu, Ma and He2007; Wang, Wu & Jia, Reference Wang, Wu and Jia2008; Huang et al. Reference Huang, Li, Dong, He and Chen2008; Wen et al. Reference Wen, Chung, Song, Iizuka, Yang, Ji, Liu and Gallet2008; Zhao et al. Reference Zhao, Xiong, Wang, Wyman, Bao, Bai and Qiao2008; Goss & Kay, Reference Goss and Kay2009; Hastie et al. Reference Hastie, Kerr, McDonald, Mitchell, Pearce, Millar, Barfod and Mark2010; Karsli et al. Reference Karsli, Dokuz, Uysal, Aydin, Kandemir and Wijbrans2010; Yuan et al. Reference Yuan, Sun, Wilde, Xiao, Xu, Long and Zhao2010; Zeng et al. Reference Zeng, Gao, Xie and Zeng2011; Xu, Ma & Zhang, Reference Xu, Ma and Zhang2012; Yu, Zhang & Real, Reference Yu, Zhang and Real2012; Yin et al. Reference Yin, Long, Yuan, Sun, Zhao and Geng2013, Reference Yin, Chen, Yuan, Yu, Xiao, Long, Li and Sun2015; Yu et al. Reference Yu, Zhang, Qin, Sun, Zhao, Cong and Li2015).
The North Qilian and North Altun orogenic belts are located at the northern margin of the Tibetan Plateau. Previous petrological and geochronological studies suggested that they are probably a single early Palaeozoic suture zone with simultaneous ophiolite and high-pressure/low-temperature (HP/LT) eclogite and blueschist, offset ~ 400 km by the Altun Tagh fault (Xu et al. Reference Xu, Yang, Zhang, Jiang, Li and Cui1999; Yue & Liou, Reference Yue and Liou1999; Zhang et al. Reference Zhang, Mattinson, Meng and Wan2005; Zhang, Meng & Yang, Reference Zhang, Meng and Yang2005). The North Qilian and North Altun orogenic belts are mainly composed of subduction accretionary complexes, including ophiolites, HP/LT metamorphic rocks, arc volcanic and plutonic rocks, flysch formation and molasse (Zhang et al. Reference Zhang, Meng and Wan2007, Reference Zhang, Li, Yu, Meng, Mattinson, Yang and Ker2012; Song et al. Reference Song, Zhang, Niu, Wei, Liou and Shu2007, Reference Song, Niu, Su and Xia2013; Xiao et al. Reference Xiao, Windley, Yong, Yan, Yuan, Liu and Li2009; Yan et al. Reference Yan, Xiao, Windley, Wang and Li2010; Li et al. Reference Li, Zhao, Li, Cao, Liu, Guo, Xiao, Lai, Yan, Li and Yu2016a, Reference Li, Zhao, Yu, Cao, Li, Liu, Guo, Xiao, Lai, Yan, Li, Yu and Zhangb). Abundant early Palaeozoic granitoids are exposed in these two orogenic belts. In the North Qilian orogenic belt, these granitoids are subdivided into (1) volcanic arc granite (VAG) (520–490 Ma), (2) syn-collisional granite (460–420 Ma) and (3) post-collisional granite (< 420 Ma) (Song et al. Reference Song, Niu, Su and Xia2013; Wang et al. Reference Wang, Li, Smithies, Li, Peng, Chen and He2017). Both high-Mg and low-Mg adakitic plutons with U–Pb zircon ages of 463–428 Ma have been reported in the western and eastern parts of the orogenic belt (Wu et al. Reference Wu, Yang, Yang, Wooden, Shi, Chen and Zheng2004, Reference Wu, Xu, Gao, Li, Lei, Gao, Frost and Wooden2010; Wu, Yao & Zeng, Reference Wu, Yao and Zeng2006; Wang, J. R. et al. Reference Wang, Guo, Fu, Chen, Qin, Zhang and Yang2005, Reference Wang, Wu, Cai, Guo, Wu and Liu2006; Wang, Wu & Jia, Reference Wang, Wu and Jia2008; Tseng et al. Reference Tseng, Yang, Yang, Liu, Wu, Cheng, Chen and Ker2009; Xiong, Zhang & Zhang, Reference Xiong, Zhang and Zhang2012; Chen, Xia & Song, Reference Chen, Xia and Song2013; Song et al. Reference Song, Niu, Su and Xia2013; Yu et al. Reference Yu, Zhang, Qin, Sun, Zhao, Cong and Li2015). In contrast, the granitoids reported in the North Altun orogenic belt generally range from 510 to 460 Ma, with volcanic arc characteristics that are probably the result of oceanic subduction. Syn-collisional and post-collisional granitoids are poorly studied in this area Wu et al. Reference Wu, Yao, Zeng, Yang, Wooden, Chen and Mazdab(2006b). Moreover, adakitic granitoids have not yet been recognized in the North Altun orogenic belt, which will not only hamper studies on the tectonic evolution of this region but also restrict comparative studies between the North Qilian and North Altun orogenic belts.
In this contribution, we present petrological, whole-rock geochemical, Sr–Nd isotopic and Lu–Hf isotopic data and zircon U–Pb ages for both high-Mg and low-Mg adakite-like granitoids from the North Altun orogenic belt. These new data will be helpful for (1) evaluating the processes involved in the geochemical evolution of these rocks, (2) constraining the compositions of their sources, and (3) providing constraints on the distribution, petrogenesis and tectonic settings of the adakite-like granitoids in the North Altun orogenic belt. Our data will also provide important insights for understanding the continuities of the North Qilian and North Altun orogenic belts during early Palaeozoic times.
2. Geological background and petrology
The Altun orogenic belt, which is located on the northern margin of the Qinghai–Tibet Plateau, is bounded to the north by the Tarim Basin and to the south by the sinistral strike-slip Altun Tagh fault (Fig. 1). On the basis of geological mapping and lithotectonic characteristics, the Altun orogenic belt is subdivided into the following three tectonic units from south to north: (1) the southern Altun Tagh subduction–collision complex zone (SATS), (2) the central Altun Tagh massif (CAB) and (3) the north Altun Tagh subduction complex (NAS). These units are bounded by WNW–ESE-striking shear zones and can be correlated with similar tectonic units in the Qilian, assuming a 350–400 km left-lateral displacement for the Altun Tagh fault (Fig. 1) (Zhang, Meng & Yang, Reference Zhang, Meng and Yang2005; Wang et al. Reference Wang, Wang, Liu, He, Li, Li, Yang, Cao, Meert, Shi and Yu2014).
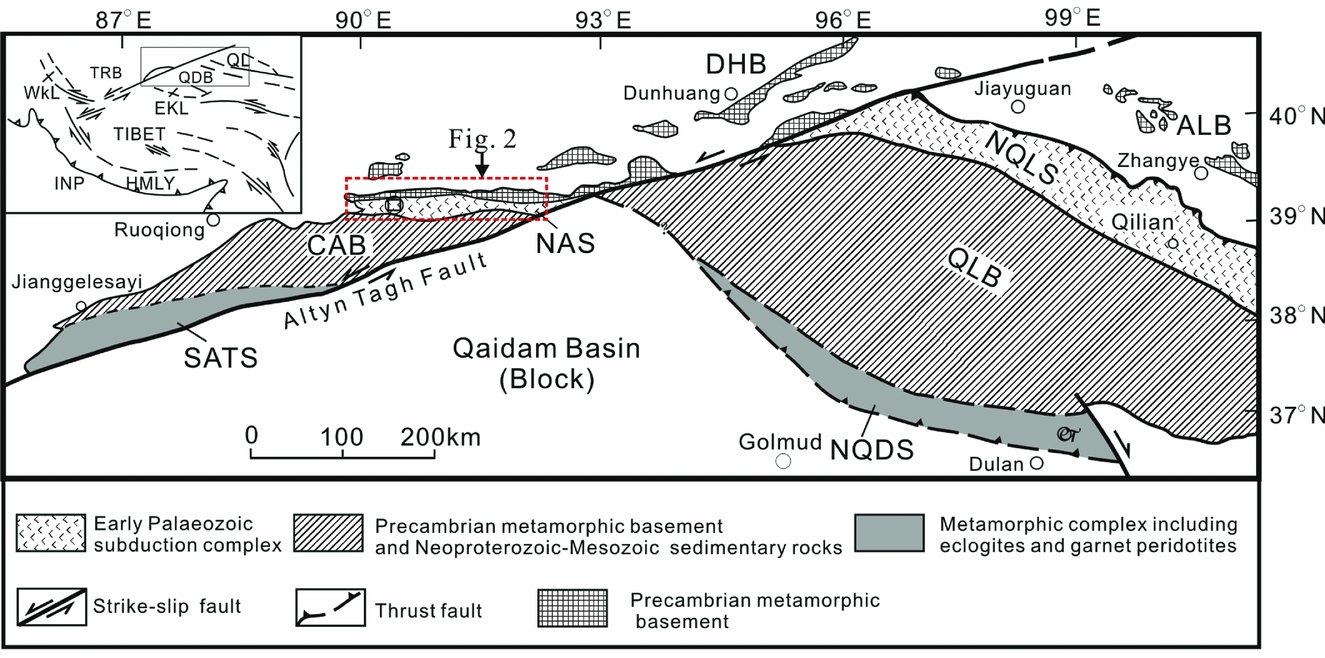
Figure 1. Schematic map of the Qilian–Altun Tagh region showing the tectonic units. ALB – Alashan block; NAS – North Altun Tagh suture; NQLS – North Qilian suture; CAB – Central Altun Tagh block; QLB – Qilian block; SATS – South Altun Tagh subduction–collision zone; NQDS – North Qaidam subduction–collision zone. TRB – Tarim Basin; QL – Qilian Mountains; QDB – Qaidam Basin; HMLY – Himalaya Mountains; INP – Indian plate; WKL – Western Kunlun Mountains; EKL – Eastern Kunlun Mountains. Modified after Zhang et al. (Reference Zhang, Li, Yu, Meng, Mattinson, Yang and Ker2012).
The SATS consists mainly of medium- to high-grade metamorphic rocks, ophiolite, granite and minor clastic sediments. The HP/UHP metamorphic rocks, including eclogite, HP granulite and garnet peridotite, occur as lenses in the Altun Group metamorphic unit. The zircon U–Pb geochronology from eclogites and HP granulite from the SATS suggests that the peak HP/UHP metamorphism occurred at c. 500 Ma (Zhang et al. Reference Zhang, Zhang, Xu, Yang and Cui1999, Reference Zhang, Meng and Yang2005; Liu et al. Reference Liu, Wang, Chen, Zhang and Liou2009, Reference Liu, Wang, Cao, Chen, Kang, Yang and Zhu2012).
The CAB consists of the Altun and Tashidaban (or Jinyanshan) groups. The Altun Group is composed of amphibolite-facies quartzo-feldspathic gneiss, pelitic gneiss, marble and amphibolite and was considered to be part of the Precambrian craton basement rocks of lower Proterozoic–Archaean age (BGMX, 1993). However, recent radiometric data demonstrate that the Altun Group formed at 1000–800 Ma (Wan et al. Reference Wan, Xu, Yang and Zhang2001; Gehrels & Yin, Reference Gehrels and Yin2003; Wang et al. Reference Wang, Liu, Yang, Zhu, Cao, Kang, Chen, Li and He2013). The Tashidaban group is dominated by mid to upper Proterozoic metasedimentary rocks that are composed of thick carbonate-rich continental margin sequences containing variable amounts of volcanic and clastic rocks.
The study area of the NAS is an elongated, NW-trending belt that lies between the Dunhuang block to the north and the central Altun block to the south, from Hongliugou to Lapeiquan (Fig. 2). It is composed mainly of clastic and volcanic rocks with rare mafic and ultramafic intrusive rocks. Well-preserved pillow lavas and serpentinized ultramafic rocks suggest that they are part of an ophiolite suite. The HP/LT metamorphic terrane, which is characterized by blueschist and eclogite, occurs as a tectonic block or slab in the subduction complex. Ar–Ar dating of eclogite and blueschist suggests that HP/LT metamorphism occurred at 512–490 Ma (Zhang et al. Reference Zhang, Meng, Yu, Chen and Chen2007). Abundant early Palaeozoic granitoids are exposed in the NAS and mainly occur as elongated bodies within the island arc igneous belt.
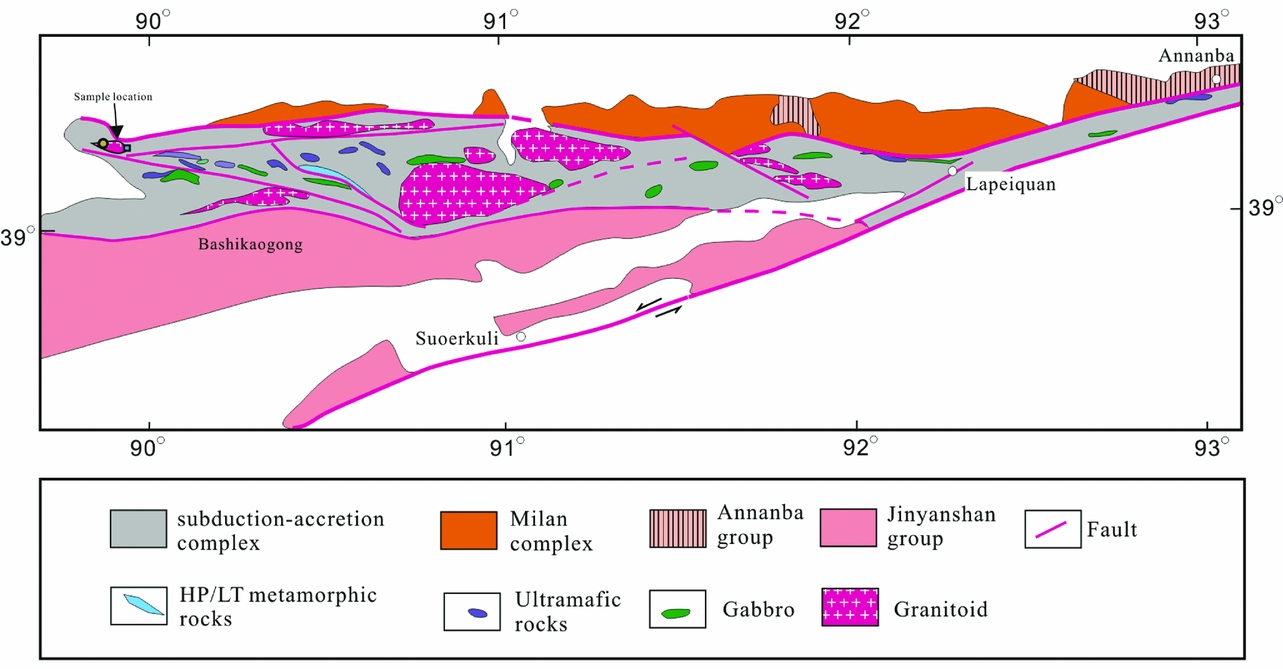
Figure 2. (a) Geological map of the North Altun Orogen with the localities of the major granitic plutons and their ages.
A total of two types of granitoids were collected for study in the NAS, including medium-grained tonalites and fine- to medium-grained granodiorites (Fig. 3). The tonalites locally intrude into the granodiorites, and rare granodiorites occur as xenoliths in the tonalites. Mafic magmatic enclaves have been widely found in the host tonalite but are rarely found in the granodiorites. The fine-grained granodiorites are primarily composed of alkali feldspar (20–25 %), plagioclase (50–55 %) and quartz (20–25 %) and rare biotite and amphibole (Fig. 3c). The medium-grained tonalites generally consist of alkali feldspar (25–30 %), plagioclase (35–40 %), quartz (20–25 %), amphibole (5–10 %) and rare biotite (Fig. 3d). Accessory minerals include epidote, chlorite, titanite and zircon. The plagioclase is euhedral to subhedral and commonly zoned.

Figure 3. Field and microphotographs of the early Palaeozoic granitic plutons in the North Altun orogen. (a) Field outcrop of fine- to medium-grained granodiorites (low-Mg). (b) Field outcrop of coarse-grained tonalites (high-Mg). (c) Fine- to medium-grained granodiorite (low-Mg) with a mineral assemblage of alkali feldspar, plagioclase, quartz, biotite and rare amphibole (plane-polarized light). (d) Medium- to coarse-grained tonalites (high-Mg) with a mineral assemblage of alkali feldspar, plagioclase, quartz and amphibole (cross-polarized light). The mineral abbreviations are after Whitney & Evans (Reference Whitney and Evans2010).
3. Analytical procedures
3.a. Zircon U–Pb geochronology
Four representative fresh granitoid samples were chosen for zircon U–Pb analyses. Zircons were separated from ~ 2–5 kg of each sample by crushing and sieving, followed by standard magnetic and heavy-liquid separation techniques. After selection under a binocular microscope, zircons were mounted in epoxy resin and polished to expose the centre of the grains. Zircon U–Pb analyses were conducted by laser-ablation multi-collector inductively coupled plasma mass spectrometry (LA-MC-ICP-MS) at the Institute of Mineral Resources, Chinese Academy of Geological Sciences, Beijing. The operating conditions for the laser-ablation system, the MC-ICP-MS and data reduction procedures are the same as those described by Hou, Li & Tian (Reference Hou, Li and Tian2009). Zircon GJ1 was used as the external standard for U–Pb dating and was analysed twice every 5–10 analyses (i.e. two zircon GJ1 + 5–10 samples + two zircon GJ1). Time-dependent drifts of U–Th–Pb isotopic ratios were corrected using a linear interpolation (with time) according to the variations of GJ1 (Liu et al. Reference Liu, Gao, Hu, Gao, Zong and Wang2010). Concordia diagrams and weighted mean calculations were made using Isoplot/Ex ver. 3. The zircon Plesovice was dated as an unknown sample and yielded a weighted mean 206Pb–238U age of 337 ± 2 Ma (2SD, n = 12), which is in good agreement with the recommended 206Pb–238U age of 337.13 ± 0.37 Ma (2SD) (Sláma et al. Reference Sláma, Kosler, Condon, Crowley, Gerdes, Hanchar, Horstwood, Morris, Nasdala, Norberg, Schaltegger, Schoene, Tubrett and Whitehouse2008).
3.b. Zircon Lu–Hf isotope analyses
Zircon Lu–Hf isotope analyses were performed using a Newwave UP213 laser-ablation microprobe attached to a Neptune MC-ICP-MS at the Institute of Mineral Resources, CAGS, Beijing. Instrumental conditions and data acquisition follow those described by Hou et al. (Reference Hou, Li, Zou, Qu, Shi and Xie2007). A stationary spot was used for the present analyses, with a beam diameter of either 40 μm or 55 μm, depending on the size of the ablated domains. Helium gas was used as a carrier gas to transport the ablated sample from the laser-ablation cell to the ICP-MS torch via a mixing chamber in combination with Ar. To correct for the isobaric interferences of 176Lu and 176Yb on 176Hf, 176Lu/175Lu = 0.02658 and 176Yb/173Yb = 0.796218 ratios were determined (Chu, Taylor & Chavagnac, Reference Chu, Taylor and Chavagnac2002). For instrumental mass bias correction, Yb isotope ratios were normalized to a 172Yb/173Yb ratio of 1.35274 (Chu, Taylor & Chavagnac, Reference Chu, Taylor and Chavagnac2002) and Hf isotope ratios to a 179Hf/177Hf ratio of 0.7325 using an exponential law. The mass bias behaviour of Lu was assumed to follow that of Yb; mass bias correction protocols were performed as described by Lizuka & Hirata (Reference Lizuka and Hirata2005), Wu et al. (Reference Wu, Yang, Xie, Yang and Xu2006a) and Hou et al. (Reference Hou, Li, Zou, Qu, Shi and Xie2007). Zircon GJ1 was used as the reference standard with a weighted mean 176Hf/177Hf ratio of 0.282008 ± 27 (2σ) during our routine analyses. This ratio is not distinguishable from a weighted mean 176Hf/177Hf ratio of 0.282013 ± 19 (2σ) according to the in situ analysis of Elhlou, Belousova & Griffin (Reference Elhlou, Belousova and Griffin2006).
The calculation of the Hf model age (single-stage model age) (TDM) is based on a depleted-mantle source with the present-day 176Hf/177Hf ratio of 0.28325, using the 176Lu decay constant 1.865 × 10⁻¹¹ year−1 (Scherer, Munker & Mezger, Reference Scherer, Munker and Mezger2001). The calculation of the ‘crust’ (two-stage) Hf model age (TDMC) is based on the assumption of a mean 176Lu/177Hf value of 0.011 for average continental crust (Wedepohl, Reference Wedepohl1995). The calculation of the εHf(t) values was based on zircon U–Pb ages and chondritic values (176Hf/177Hf = 0.282772, 176Lu/177Hf = 0.0332; Blichert-Toft & Albarede, Reference Blichert-Toft and Albarede1997).
3.c. Bulk-rock geochemical analysis
Bulk-rock major, trace and rare earth element (REE) concentrations were obtained by X-ray fluorescence (XRF) and ICP-MS at the National Research Centre for Geoanalysis, CAGS. The major elements were analysed by XRF with analytical uncertainties < 5 %. The trace and REEs were analysed by ICP-MS. REEs were separated using cation-exchange techniques. The analytical uncertainties are 10 % for elements with abundances < 10 ppm and ~ 5 % for those > 10 ppm (Zeng et al. Reference Zeng, Gao, Dong and Tang2012).
3.d. Sr–Nd isotopes
Whole-rock Sr–Nd isotopic ratios were obtained using a Finnigan Triton thermal ionization mass spectrometer (TIMS) at GPMR, China University of Geosciences, Wuhan. The 147Sm/144Nd and 87Rb/86Sr ratios of the samples were calculated using Sr and Nd concentrations measured by an Agilent 7500a ICP-MS with uncertainties of 0.3 % based on USGS standard analyses. The total analytical blanks were 5 × 10⁻¹¹ g for Sm and Nd and (2–5) × 10−10 g for Rb and Sr. A detailed account of the analytical procedures for the sparse Nd isotopic measurements is given in Ling et al. (Reference Ling, Duan, Xie, Zhang, Zhang, Cheng, Liu and Yang2009).
4. Results
4.a. Zircon microstructure and U–Pb ages
A total of four granitoid samples were chosen for zircon U–Pb dating. The zircons from these samples show similar transparent, euhedral crystals that are 200–400 μm in length. The cathodoluminescence (CL) images mostly exhibit oscillatory zonation with Th/U ratios greater than 0.1, indicative of a magmatic origin (Fig. 4). Except for sample YY125, the other three samples have inherited magmatic or metamorphic cores. Sixteen spots from sample YY095 were analysed for U–Pb dating (Table 1). Except for one inherited core with 206Pb–238U ages of 1094 Ma, the remaining 15 analyses yielded a weighted mean 206Pb–238U age of 445 ± 2 Ma (MSWD = 0.48) (Fig. 4a). A total of 25 spots from sample YY096 were analysed for U–Pb dating (Table 2). Except for one inherited core with a 207Pb–206Pb age of 1598 Ma, the remaining 24 analyses yielded a weighted mean 206Pb–238U age of 439 ± 2 Ma (MSWD = 0.66) (Fig. 4b). A total of 21 spots from sample YY122 were analysed for U–Pb dating (Table 3). Except for two inherited cores with 207Pb–206Pb ages of 1528 Ma and 929 Ma, the remaining 19 analyses yielded a weighted mean 206Pb–238U age of 425 ± 2 Ma (MSWD = 0.75) (Fig. 4c). Sixteen spots from sample YY125 were analysed for U–Pb dating, which yielded a weighted mean 206Pb–238U age of 422 ± 2 Ma (MSWD = 0.58) (Fig. 4d; Table 4).

Figure 4. Zircon LA-ICP-MS U–Pb results for both low-Mg and high-Mg adakitic rocks in the North Altun orogen. The error ellipses are 1σ.
Table 1. U–Th–Pb LA-ICP-MS data of zircons from low-Mg adakitic rocks (YY095) in the North Altun orogenic belt

Table 2. U–Th–Pb LA-ICP-MS data of zircons from low-Mg adakitic rocks (YY096) in the North Altun orogenic belt

Table 3. U–Th–Pb LA-ICP-MS data of zircons from high-Mg adakitic rocks (YY122) in the North Altun orogenic belt

Table 4. U–Th–Pb LA-ICP-MS data of zircons from high-Mg adakitic rocks (YY125) in the North Altun orogenic belt

4.b. Zircon Lu–Hf isotope compositions
Except for the inherited zircon cores, the Lu–Hf isotopes were analysed at the same zircon locations for which U–Pb dating was conducted (or close to them). The Lu–Hf isotopic data on dated zircons from the three samples are given in Table 5 and Figure 5.
Table 5. LA–MC–ICP–MS Lu–Hf isotope data of zircon from adakitic rocks in the North Altun orogenic belt

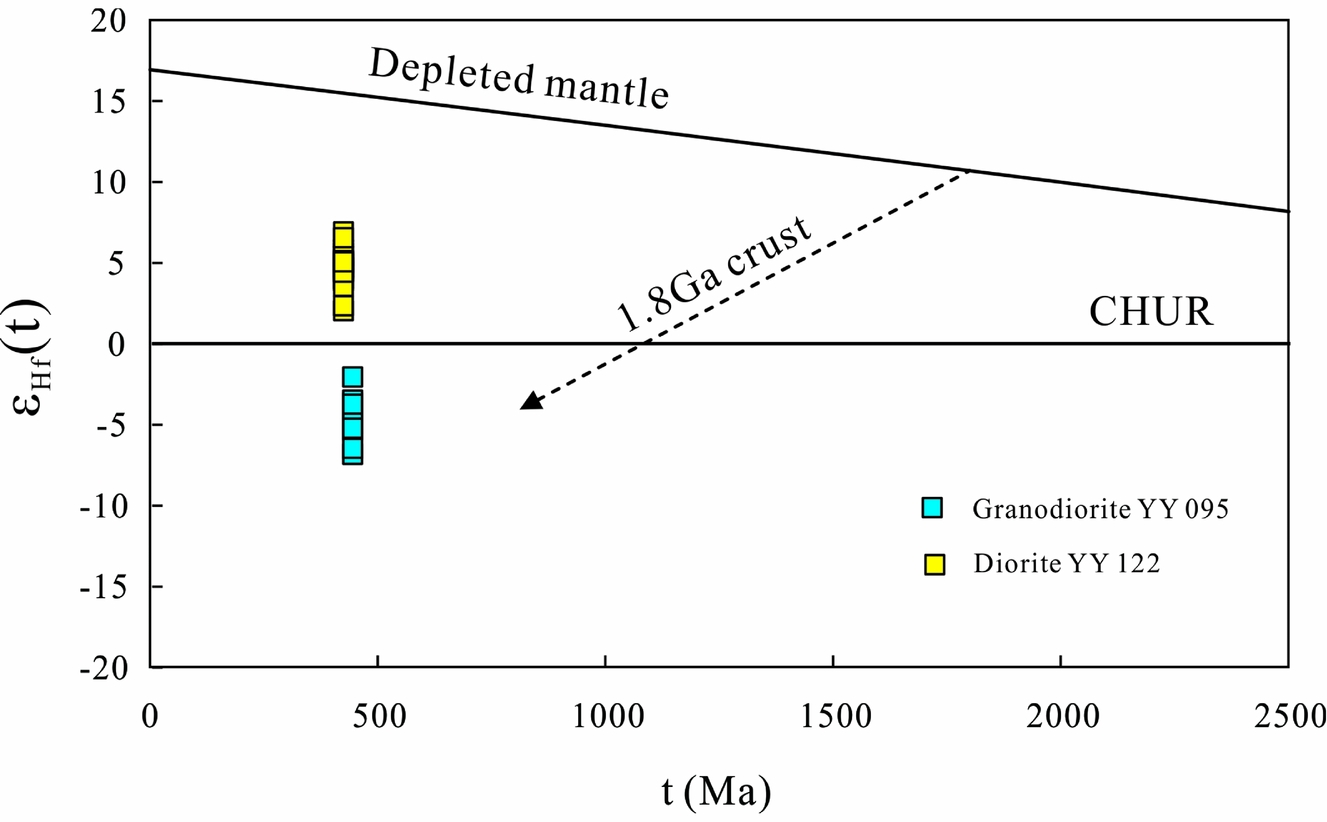
Figure 5. Lu–Hf isotope diagram for both low-Mg and high-Mg adakitic rocks in the North Altun orogen. The blue and yellow squares represent the low-Mg and high-Mg adakitic rocks of this study, respectively.
The εHf(t) values were calculated based on 445 Ma for sample YY095. A total of 15 spots yielded 176 Hf/177Hf ratios varying from 0.282302 to 0.2824377. Their age-corrected εHf (t) values are between −6.8 and −2.0 at 445 Ma. The two-stage zircon Hf model ages (TDMC) are within the range 1.4–1.7 Ga.
The εHf(t) values were calculated based on 425 Ma for sample YY122. Nineteen zircon Lu–Hf isotope analyses gave similar 176Hf/177Hf ratios of 0.282565–0.282703, corresponding to εHf(t) values ranging from 2.0 to 6.9 and two-stage Hf model ages (TDMC) within the range 0.9–1.2 Ga.
4.c. Whole-rock major and trace elements
The major and trace element compositions of selected granitoids from the study area are listed in Table 6. Based on the petrological, geochronological and geochemical results, these granitoids can be divided into two groups: an early group (445–439 Ma) with higher SiO2 and lower Mg no. and Cr and Ni contents (hereinafter called the low-Mg granitoids) and a later group (425–422 Ma) with lower SiO2 and higher Mg no. and Cr and Ni contents (hereinafter called the high-Mg granitoids).
Table 6. Major and trace element compositions of adakitic rocks and mafic enclaves in the North Altun orogenic belt

The low-Mg granitoids are rich in SiO2 (69.09–70.06 wt %) and Na2O (4.19–4.67 wt %), with Na2O/K2O ratios greater than 1.5, but are poor in FeOt (1.76–2.06 wt %), TiO2 (0.28–0.31 wt %) and MnO (0.03–0.05 wt %) (Fig. 6). These granitoids also have low MgO (0.85–0.94 wt %) and correspondingly low Mg nos. of 43–48 (Fig. 7). These granitoids are weakly peraluminous, with A/CNK ratios in the range of 0.98 to 1.02. In the Ab–An–Or ternary diagram, these granitoids are plotted in the granodiorite region (Fig. 8). All of the low-Mg granitoids have similar chondrite-normalized REE patterns, showing significant enrichments of light REEs (LREEs) relative to heavy REEs (HREEs), without obvious Eu anomalies (Fig. 9a). In the primitive mantle-normalized trace element diagram, the low-Mg granitoids are depleted in HFSEs (e.g. Nb, Ta and Ti) and enriched in large-ion lithophile elements (LILEs, e.g. Rb, Ba, K and Sr) (Fig. 9b). Most importantly, these granitoids exhibit high Sr/Y ratios ranging from 67 to 89 (Fig. 10).
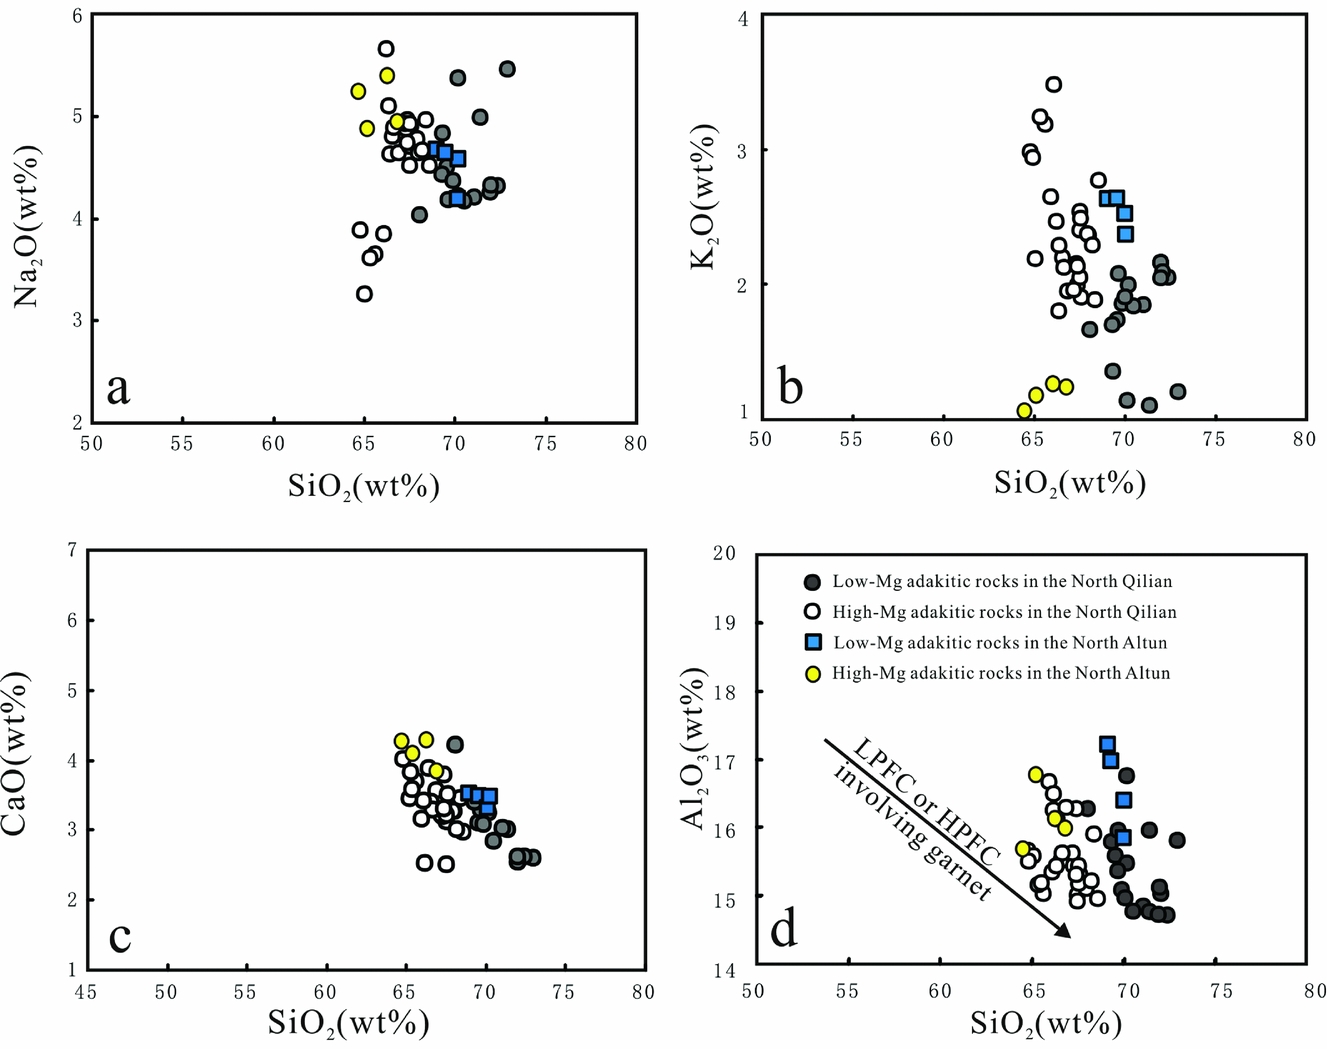
Figure 6. Representative major and trace elements plotted against SiO2 of low-Mg and high-Mg adakitic rocks in the North Altun orogen. The blue squares and yellow circles represent the low-Mg and high-Mg adakitic rocks of this study, respectively. The grey and white circles represent previous data for low-Mg and high-Mg adakitic rocks in the North Qilian orogen, respectively.
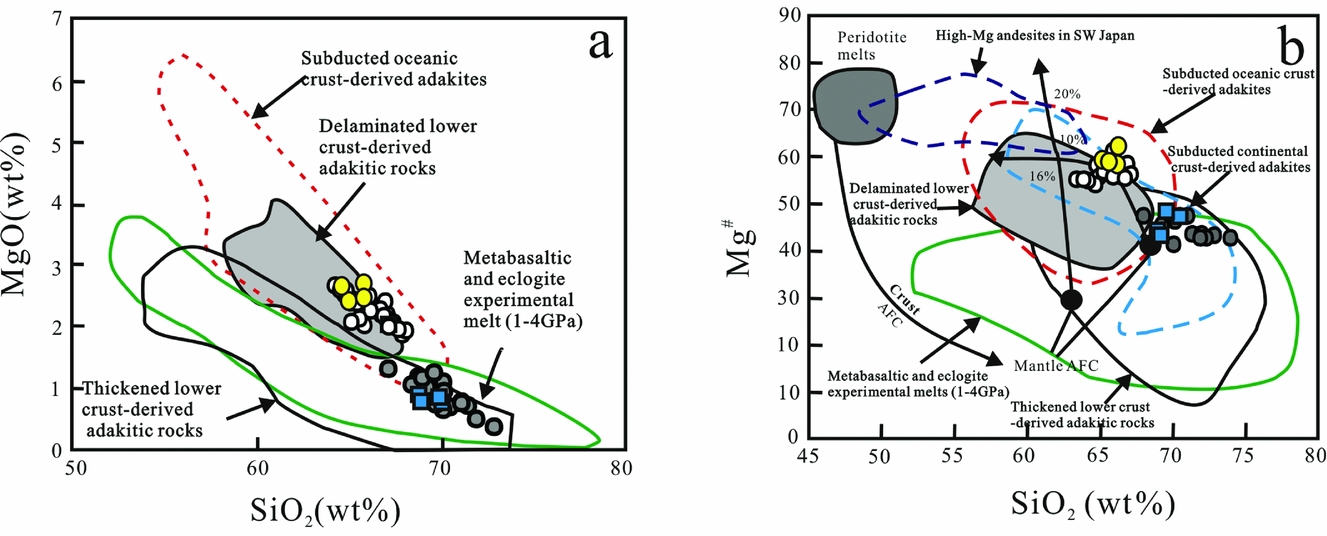
Figure 7. (a) MgO versus SiO2 diagram and (b) Mg no. versus SiO2 diagram. Modified after Tang et al. (Reference Tang, Wang, Wyman, Li, Zhao, Jia and Jiang2010). The mantle AFC curves, with proportions of assimilated peridotite indicated, are after Stern & Kilian (Reference Stern and Kilian1996) (Curve 1) and Rapp et al. (Reference Rapp, Shimizu, Norman and Applegate1999) (Curve 2), and the peridotite melts and crust AFC curves are from Stern & Kilian (Reference Stern and Kilian1996). The data for the high-Mg andesites of SW Japan are from the following references: Shimoda et al. (Reference Shimoda, Tatsumi, Nohda, Ishizaka and Jahn1998) and Tatsumi et al. (Reference Tatsumi, Suzuki, Kawabata, Sato, Miyazaki, Chang, Takahashi, Tani, Shibata and Yoshikawa2006). The data for the metabasaltic and eclogite experimental melts (1–4.0 GPa) and peridotite-hybridized equivalents are from Rapp et al. (Reference Rapp, Shimizu, Norman and Applegate1999). The fields for the subducted oceanic crust-derived adakites and delaminated or thickened lower crust-derived adakitic rocks are after Wang, Q. et al. (Reference Wang, Xu, Jian, Bao, Zhao, Li, Xiong and Ma2006, Reference Wang, Wyman, Xu, Jian, Zhao, Li, Xu, Ma and He2007). The blue squares and yellow circles represent the low-Mg and high-Mg adakitic rocks of this study in the North Qilian orogen, respectively. The grey and white circles represent previous data for low-Mg and high-Mg adakitic rocks in the North Qilian orogen, respectively.
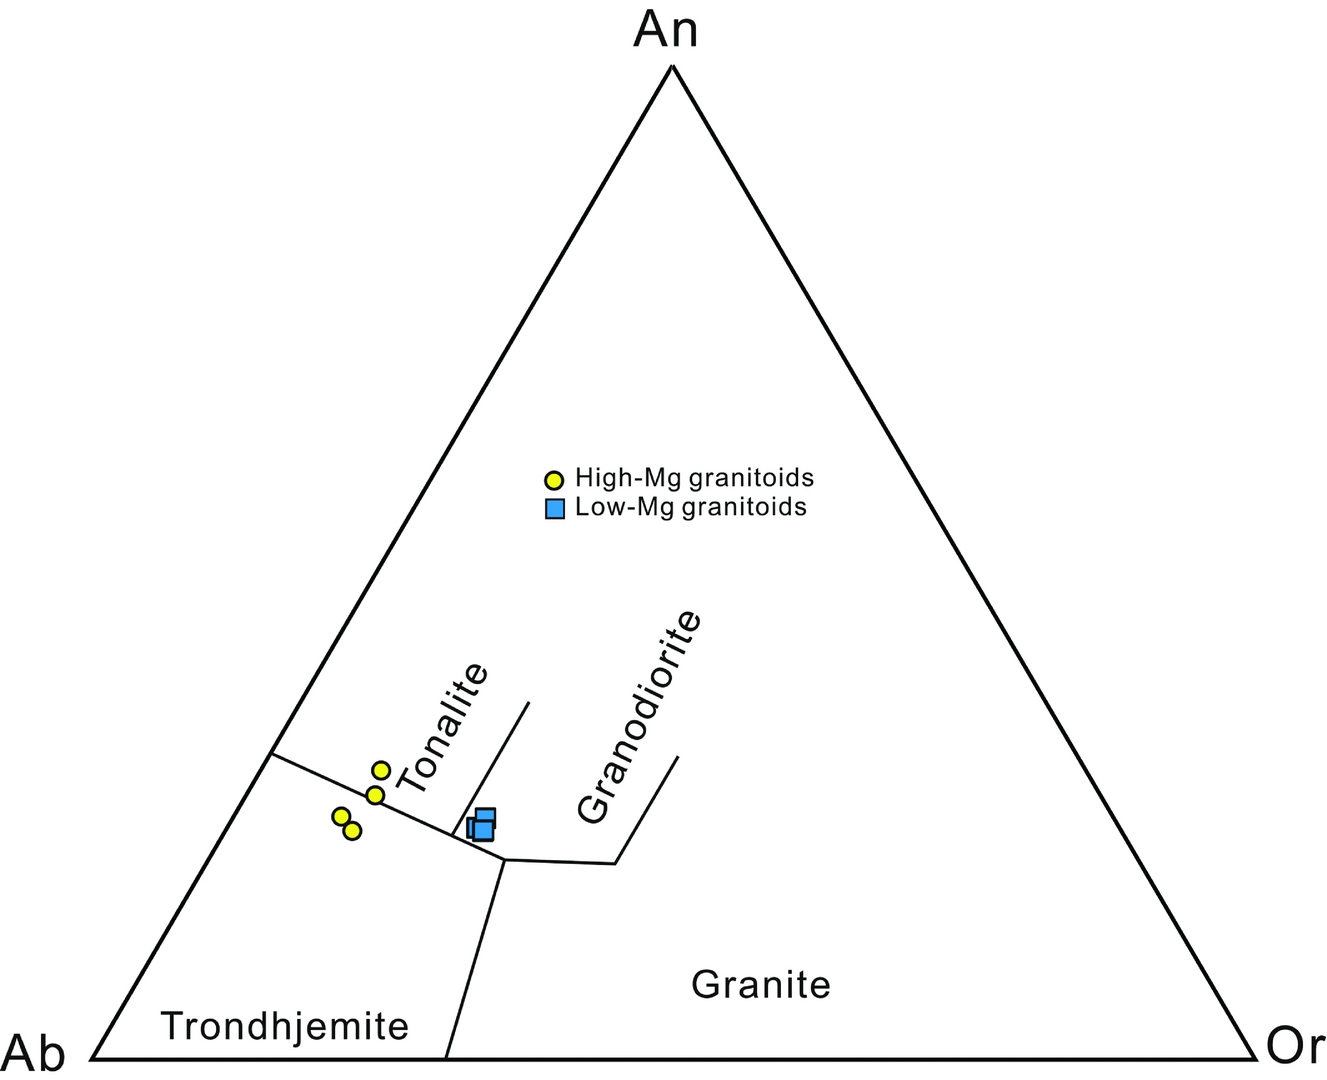
Figure 8. Normative albite (Ab) – anorthite (An) – orthoclase (Or) contents of the granitoids from the North Altun orogenic belt. The Ab–An–Or classification for silicic rocks is after Barker (Reference Barker1979). The blue squares and yellow circles represent the low-Mg and high-Mg adakitic rocks of this study in the North Qilian orogen, respectively.
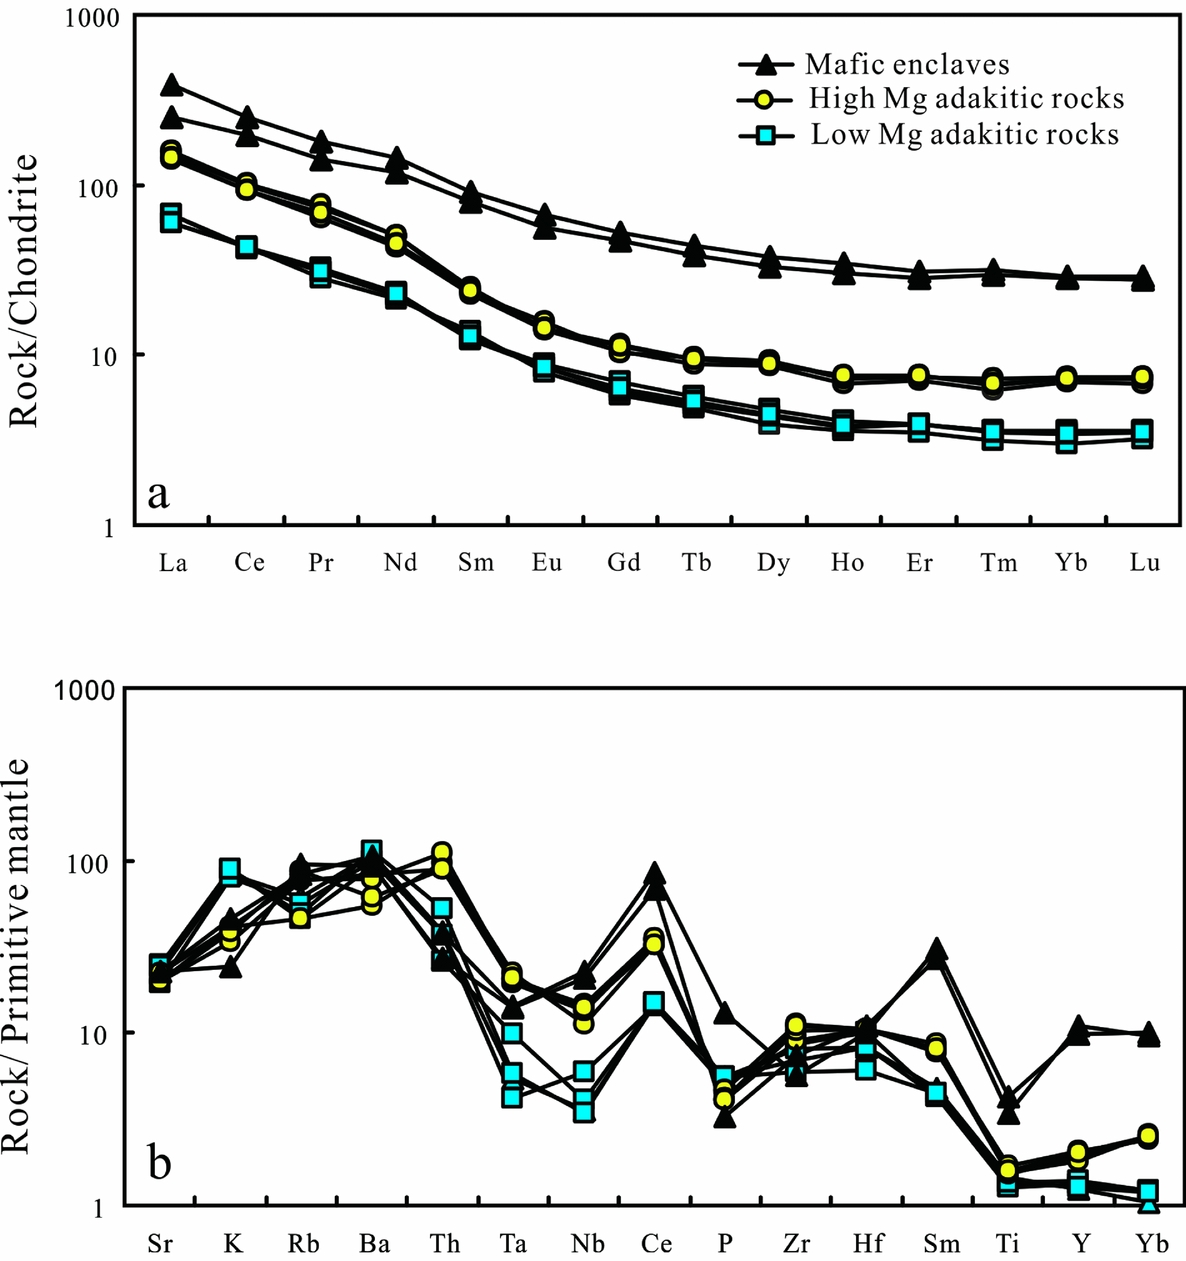
Figure 9. Chondrite-normalized REE and primitive-mantle-normalized trace element patterns for low-Mg, high-Mg adakitic rocks and mafic enclaves in the North Altun orogen. The chondrite and primitive mantle values are from Sun & McDonough (Reference Sun, McDonough and Saunders1989).
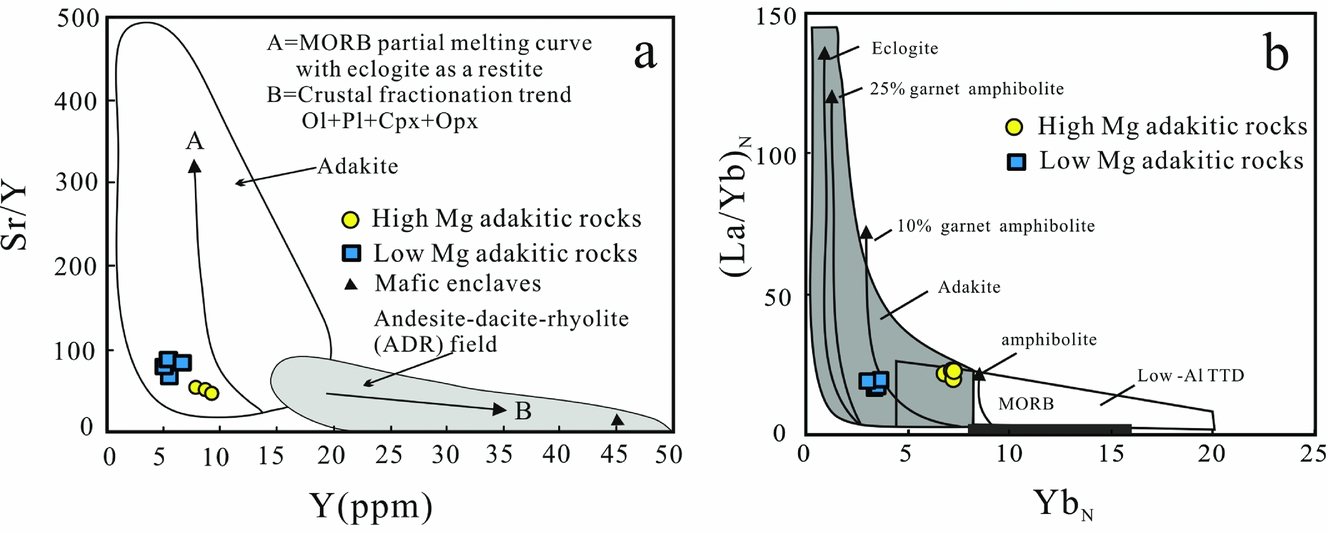
Figure 10. Plots of (a) Sr/Y v. Y and (b) (La/Yb)N v. YbN for the granitoids and mafic enclaves. The fields for the adakite and arc magmatic rocks are from Petford & Atherton (Reference Petford and Atherton1996) and Defant & Drummond (Reference Defant and Drummond1990). The blue squares and yellow circles represent the low-Mg and high-Mg adakitic rocks of this study, respectively.
In comparison to the low-Mg group, the high-Mg granitoids show lower SiO2 (64.58–66.78 wt %) and Na2O (4.89–5.41 wt %) with variable Na2O/K2O ratios of 4.01–5.14. These granitoids are relatively rich in FeOt (2.91–3.24 wt %), TiO2 (0.33–0.36 wt %) and MnO (0.05–0.08 wt %). The high-Mg granitoids also exhibit higher MgO (2.46–2.75 wt %) and correspondingly higher Mg nos. of 60–62 (Fig. 7). The A/CNK ratios range from 0.90 to 1.00, demonstrating that these granitoids are metaluminous. In the Ab–An–Or ternary diagram, these granitoids are plotted in the tonalite and trondhjemite region (Fig. 8). All of the high-Mg granitoids have similar chondrite-normalized REE patterns, showing significant enrichments of LREEs relative to HREEs, without obvious Eu anomalies (Fig. 9a). In the primitive mantle-normalized trace-element diagram, the high-Mg granitoids are also depleted in HFSEs and enriched in LILEs (Fig. 9b). Most importantly, these granitoids are high in Sr (≥ 417 ppm) and La (≥ 33.7 ppm), with low Y (≤ 9.4 ppm) and Yb (≤ 1.27 ppm) abundances (Fig. 10).
The mafic enclaves in the high-Mg granitoids are characterized by lower SiO2 (49.27–50.03 wt %) and Na2O (2.20–2.76 wt %), with enrichments of FeOt (7.03–9.03 wt %), TiO2 (0.75–0.93 wt %) and CaO (10.14–11.54 wt %). The mafic enclaves also exhibit higher MgO (8.33–8.52 wt %) and correspondingly higher Mg nos. of 63–68. The mafic enclaves have similar chondrite-normalized REE patterns, showing weak enrichment of LREEs relative to HREEs, and without obvious Eu anomalies (Fig. 9a). In the primitive mantle-normalized trace element diagram, the mafic enclaves are also depleted in HFSEs and enriched in LILEs (Fig. 9b).
4.d. Sr–Nd isotopes
The Rb–Sr and Sm–Nd radiogenic isotopic data for the low-Mg and high-Mg granitoids are listed in Table 7. Values of t = 445 Ma and t = 425 Ma were assigned to calculate the Sr and Nd radiogenic isotopic composition of the low-Mg and high-Mg groups, respectively, at the time of melt crystallization. All points in this plot have a symbol size greater than the analytical uncertainties. The low-Mg granitoids have 87Sr/86Sr(t) and εNd(t) values of 0.707323–0.708400 and −1.9 to −4.0. In contrast, the high-Mg granitoids have lower 87Sr/86Sr(t) and higher εNd(t) values of 0.704419–0.705671 and −0.7 to 3.1, respectively (Fig. 11).
Table 7. Sr and Nd isotope compositions of adakitic rocks in the North Altun orogenic belt

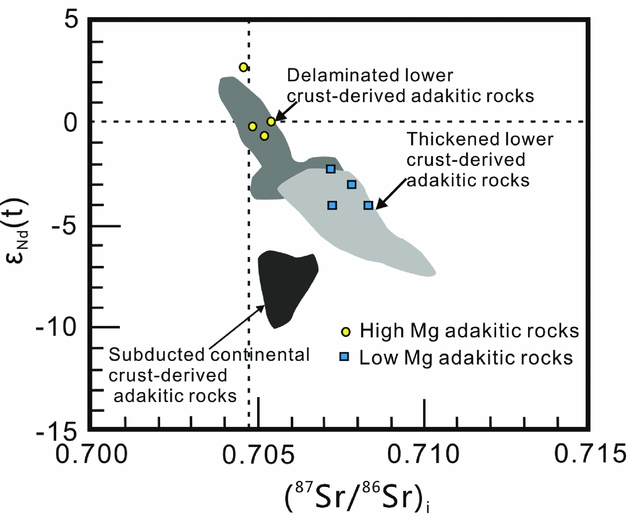
Figure 11. εNd(t) versus (87Sr/86Sr)i plot for adakitic granitoids in the North Altun orogenic belt. The fields for the subducted continental crust-derived adakites and delaminated or thickened lower crust-derived adakitic rocks are after Wang, Q. et al. (Reference Wang, Xu, Jian, Bao, Zhao, Li, Xiong and Ma2006, Reference Wang, Wyman, Xu, Jian, Zhao, Li, Xu, Ma and He2007) and Wang, Wu & Jia (Reference Wang, Wu and Jia2008). The blue squares and yellow circles represent the low-Mg and high-Mg adakitic rocks of this study, respectively.
5. Discussion
The granitoids in this study have high Sr/Y and (La/Yb)N ratios and low Y and Yb N concentrations. As a result, all of the granitoids described herein clearly fall within the adakite field in commonly used discrimination diagrams such as the Sr/Y versus Y plot and the (La/Yb)N versus YbN plot illustrated in Figure 10. Several genetic models have been proposed for the origins of adakites and adakitic rocks, including (a) crustal assimilation and fractional crystallization (AFC) processes from parental basaltic magmas (Castillo, Janney & Solidum, Reference Castillo, Janney and Solidum1999; Macpherson, Dreher & Thirwall, Reference Macpherson, Dreher and Thirwall2006; Li et al. Reference Li, Li, Li, Lo, Wang, Ye and Yang2009), (b) a mixed origin from mantle-derived mafic magma and crust-derived felsic magma (Guo et al. Reference Guo, Nakamuru, Fan, Kobayoshi and Li2007; Streck, Leeman & Chesley, Reference Streck, Leeman and Chesley2007), and (c) a partial melting origin, including thickened/delaminated lower crust and subducted oceanic/continental crust (Defant & Drummond, Reference Defant and Drummond1990; Huang et al. Reference Huang, Li, Dong, He and Chen2008; Xu et al. Reference Xu, Hergt, Gao, Pei, Wang and Yang2008, Reference Xu, Ma, Zhang and Ye2012; Zeng et al. Reference Zeng, Gao, Xie and Zeng2011; Xu, Ma & Zhang, Reference Xu, Ma and Zhang2012; Yu, Zhang & Real, Reference Yu, Zhang and Real2012). Here, we will evaluate several possible petrogenetic mechanisms for adakitic rocks, and we will assess the most adequate model for the generation of the low-Mg and high-Mg adakitic rocks in the North Altun orogenic belt.
5.a. Petrogenetic model of the low-Mg adakitic rocks
First, the unique chemical signature of the low-Mg adakitic magma in the North Altun orogenic belt cannot be solely explained by high- or low-pressure fractional crystallization. In general, high-pressure fractional crystallization (involving garnet) of hydrous basaltic melts results in unique geochemical trends (Prouteau et al. Reference Prouteau, Scaillet, Pichavant and Maury2001; Macpherson, Dreher & Thirwall, Reference Macpherson, Dreher and Thirwall2006). For example, Al2O3 and La contents decrease with increased SiO2 content, and the Sr/Y and Dy/Yb ratios clearly increase with increasing SiO2 content because garnet is involved in the crystallization. The North Altun adakitic low-Mg adakitic rocks display none of these trends (Figs 6d, 12a, b). Therefore, the high-pressure fractional crystallization of hydrous basaltic melts seems unlikely to generate the low-Mg adakitic rocks in the region. Castillo, Janney & Solidum (Reference Castillo, Janney and Solidum1999) also claimed that adakitic rocks could be produced by the crustal assimilation and low-pressure fractionation of basaltic magma. The La/Sm–La discrimination diagram could be effectively used to identify the genesis for granitoids (Allegre & Minster, Reference Allegre and Minster1978). As shown in the La/Sm–La diagram, the low-Mg adakitic rocks show a partial melting trend (Fig. 13). In addition, an important feature of low-pressure crystallization is that some key elements or ratios, such as Ba, would increase with increasing SiO2 content, and Al2O3 and La would decrease with increasing SiO2 content (Castillo, Janney & Solidum, Reference Castillo, Janney and Solidum1999). However, the low-Mg adakitic rocks do not exhibit the compositional trends associated with differentiation in the North Altun suture zone (Figs 6d, 12a). Therefore, it is difficult to explain the unique chemical signature of the low-Mg adakitic magma through crustal assimilation and fractional crystallization in the North Altun suture zone. Moreover, for the same age interval, there are no coexisting large volume mafic lavas that could be responsible for the high- or low-pressure fractional crystallization of the basaltic magma in the region.

Figure 12. Variations in some trace elements with SiO2 for both low-Mg and high-Mg adakitic rocks in the North Altun orogen. HPFC – high-pressure fractional crystallization involving garnet (Macpherson, Dreher & Thirwall, Reference Macpherson, Dreher and Thirwall2006); LPFC – low-pressure fractional crystallization involving olivine + clinopyroxene + plagioclase + hornblende + titanomagnetite (Castillo, Janney & Solidum, Reference Castillo, Janney and Solidum1999). The blue squares and yellow circles represent the low-Mg and high-Mg adakitic rocks of this study in the North Altun orogen, respectively. The grey and white circles represent previous data for low-Mg and high-Mg adakitic rocks in the North Qilian orogen, respectively.

Figure 13. Zr–Zr/Sm diagram for the low-Mg and high-Mg adakitic rocks in the North Altun orogen. The fractional crystallization and partial melting curves are after Allegre & Minster (Reference Allegre and Minster1978). The blue squares and yellow circles represent the low-Mg and high-Mg adakitic rocks of this study in the North Altun orogen, respectively. The grey and white circles represent previous data for low-Mg and high-Mg adakitic rocks in the North Qilian orogen, respectively.
Second, a magma-mixing mechanism can be ruled out owing to the following consideration. The melts from this model have similar geochemical characteristics to high-Mg adakitic rocks, which are distinct from the geochemical characteristics of the low-Mg adakitic rocks in this region.
Based on the above analysis, the low-Mg adakitic rocks in the North Altun orogenic belt could have a partial melting origin, including thickened/delaminated lower crust and subducted oceanic/continental crust (Defant & Drummond, Reference Defant and Drummond1990; Huang et al. Reference Huang, Li, Dong, He and Chen2008; Xu et al. Reference Xu, Hergt, Gao, Pei, Wang and Yang2008, Reference Xu, Zhang, Guo and Yuan2010, Reference Xu, Ma, Zhang and Ye2012; Zeng et al. Reference Zeng, Gao, Xie and Zeng2011; Xu, Ma & Zhang, Reference Xu, Ma and Zhang2012; Yu, Zhang & Real, Reference Yu, Zhang and Real2012). Studies have indicated that oceanic slab-derived and delamination-related adakitic melts generally contain high mantle components (e.g. MgO, CaO, Cr and Ni) because of contamination by mantle magma, which is distinct from the North Altun suture zone low-Mg adakitic rocks (Figs 7, 12c, d) (Rapp et al. Reference Rapp, Shimizu, Norman and Applegate1999). Moreover, the negative Nb and Ta anomalies (Fig. 9) and negative εNd(t) values (Fig. 11) are distinct from oceanic crust-derived adakitic melts, which generally show an absence of Nb and Ta anomalies and positive εNd(t) values (Defant & Drummond, Reference Defant and Drummond1990). Furthermore, the low-Mg adakitic rocks in the North Altun suture zone have Nb/U, Ce/Pb, Ti/Eu and Nd/Sm ratios that are different from those of these source-contaminated ocean ridges but do resemble the crustal values (Fig. 14), further strengthening their continental affinity. As a result, these geochemical features, as well as the very negative to weakly positive εHf(t) values of the zircons, indicate an affinity to ‘potassium-rich adakite’ (Rapp, Xiao & Shimizu, Reference Rapp, Xiao and Shimizu2002) and likely derivation from subducted or thickened lower continental crust (Defant et al. Reference Defant, Xu, Kepezhinskas, Wang, Zhang and Xiao2002). However, for the same age interval, the existence of continental subduction has not been reported in this region (Song et al. Reference Song, Niu, Su and Xia2013). Thus, a model of partial melting of thickened lower crust could adequately represent the generation of the low-Mg adakitic rocks in the North Altun orogenic belt.

Figure 14. Ce/Pb v. Nb/U and Ti/Eu v. Nd/Sm plots showing the similarity between the North Qilian adakitic rocks and average continental crust (Rudnick & Fountain, Reference Rudnick and Fountain1995). The blue squares and yellow circles represent the low-Mg and high-Mg adakitic rocks of this study in the North Altun orogen, respectively. The grey and white circles represent previous data for low-Mg and high-Mg adakitic rocks in the North Qilian orogen, respectively.
5.b. Petrogenetic model of the high-Mg adakitic rocks
The composition of the high-Mg adakitic rocks is generally interpreted as implying a mixing origin and has provided important clues for deciphering the mechanisms of Archaean crustal growth (Stern & Hanson, Reference Stern and Hanson1991) and Phanerozoic continental crust recycling (Gao et al. Reference Gao, Rudnick, Yuan, Liu, Liu, Xu, Ling, Ayers, Wang and Wang2004, Reference Gao, Rudnick, Xu, Yuan, Liu, Walker, Puchtel, Liu, Huang, Wang and Yang2008; Zhang et al. Reference Zhang, Ma and Holtz2010). High-Mg adakitic magmas with a mixing origin could have been produced by the following various dynamic models: (1) mixing between a mantle-derived mafic adakitic melt and a crust-derived magma (Guo et al. Reference Guo, Nakamuru, Fan, Kobayoshi and Li2007; Streck, Leeman & Chesley, Reference Streck, Leeman and Chesley2007); (2) partial melting of subducted oceanic crust contaminated by mantle peridotite during emplacement in an island arc setting (Peacock, Rushmer & Thompson, Reference Peacock, Rushmer and Thompson1994; Şen & Dunn, Reference Şen and Dunn1994; Martin, Reference Martin1999); and (3) partial melting of the delaminated lower continental crust interacting with mantle-derived magma (Xu et al. Reference Xu, Castillo, Li, Yu, Zhang and Han2002; Gao et al. Reference Gao, Rudnick, Yuan, Liu, Liu, Xu, Ling, Ayers, Wang and Wang2004).
First, Guo et al. (Reference Guo, Nakamuru, Fan, Kobayoshi and Li2007) suggested that the Paleocene adakitic andesites from the Yanji area (NE China) could be interpreted as a mixture between a crust-derived magma with low Mg no. and Sr and high Y and HREEs and a mantle-derived high Mg no. adakite with high Sr and low Y and HREEs. The adakitic melts from this model generally have geochemical characteristics similar to those of high-Mg adakitic rocks. It is unlikely that the first magma-mixing model between a mantle-derived mafic adakitic melt and a crust-derived magma could account for the North Altun high-Mg adakitic rocks for the following reasons: (1) the mafic enclaves within the high-Mg adakitic rocks show low Sr/Y ratios, without adakitic affinity (Fig. 9); (2) coeval mafic and ultramafic magmatic rocks with adakitic signatures have not been found in this region.
Second, an oceanic crust-melting mechanism can also be ruled out owing to the following considerations. (1) The Sr–Nd isotope character of the high-Mg adakitic rocks in the North Altun suture zone is distinct from melts derived from typical oceanic crust (Fig. 11), and the adakitic melts in the North Altun suture zone have Nb/U, Ce/Pb, Ti/Eu and Nd/Sm ratios differing from those of source-contaminated ocean ridges but resemble crustal values (Fig. 14). (2) The closure and subduction cessation of the Altun Ocean could have occurred at ~ 450 Ma, prior to the crystallization age of the high-Mg adakitic rocks (Hao et al. Reference Hao, Wang, Liu and Sang2006; Wu et al. Reference Wu, Yang, Xie, Yang and Xu2006b; Liu et al. Reference Liu, Wu, Gao, Lei and Qin2016).
In this regard, based on the field outcrops, petrology (Fig. 3), geochemistry (low SiO2, high Mg no. and Cr and Ni), zircon Lu–Hf and whole-rock Sr–Nd isotopes (Figs 5, 11), magma mixing is a possible mechanism for producing the high-Mg adakitic rocks in the North Altun orogenic belt. The high-Mg adakitic magma with mixing origin could have been formed by the partial melting of the delaminated lower continental crust interacting with mantle-derived magma.
5.c. Tectonic continuity of the North Qilian and North Altun orogenic belt
Similar to other typical subduction–accretionary orogenic belts (e.g. the Central Asian Orogenic Belt), the tectonic evolution of the early Palaeozoic North Altun orogenic belt was characterized by a combination of subduction, accretion, collision and crustal thickening followed by extension and thinning of the previously thickened crust (Liu et al. Reference Liu, Wu, Gao, Lei and Qin2016).
The data obtained in this study give us added information about the geological and tectonic processes after the closure of the Altun Ocean. Here we suggest a two-stage tectonic evolution model for the North Altun orogenic belt.
Stage I (445–439 Ma): continent–continent collision and thickening.
The petrology, zircon dating and geochemical data presented in this study suggest that the low-Mg adakitic rocks (445–439 Ma) in the North Altun orogenic belt were probably derived from the partial melting of the thickened lower crust resulting from collision-related compression and thickening. Evidence in support of initial collision and thickening during this period is also based on the following data: (a) the emplacement of arc magmatism occurred during 490–460 Ma (Qi, Wu & Li, Reference Qi, Wu and Li2005); (b) the youngest gabbroic cumulate in the Hongliugou supra-subduction zone (SSZ) ophiolite crystallized at 479 ± 9 Ma (Yang et al. Reference Yang, Shi, Wu, Su, Chen, Wang and Wooden2008); (c) Ar–Ar plateau ages indicate that the latest ophiolite formed at 455 ± 2 Ma (Hao et al. Reference Hao, Wang, Liu and Sang2006); and (d) collision-related S-type granite intruded mainly during 450–440 Ma (Wu et al. Reference Wu, Yao, Zeng, Yang, Wooden, Chen and Mazadab2007).
Stage II (~ 420 Ma): transition from compression (thickening) to extension (thinning)
On the basis of the field outcrops, petrology, whole-rock geochemistry and Sr–Nd isotopes, the high-Mg adakitic magma in this study probably formed by the partial melting of the delaminated lower continental crust interacting with mantle-derived magma. In addition, Silurian (425–390 Ma) granitoids without adakitic affinity are also found in the North Altun suture zone. Qi, Wu & Li (Reference Qi, Wu and Li2005) reported a 420–405 Ma granite pluton in the Qishikansayi and Kazisayi areas, and Wu et al. (Reference Wu, Yao, Zeng, Yang, Wooden, Chen and Mazdab2006b) reported a 420–404 Ma granite pluton in the Simierbulake area. Recently, the Kuoshibulake granitic pluton was dated at 419–411 Ma (Liu et al. Reference Liu, Wang, Yang, Luo, Gao and Huang2013). These granitoids generally have low Sr, Sr/Y and (La/Yb)N ratios with flat HREE patterns and strong negative Eu anomalies. Partial melting experiments indicate that these granitoids could only have been formed at pressures lower than 10 kbar (< 30 km) (e.g. Springer & Seck, Reference Springer and Seck1997), indicating thinned continental crust during this stage in the North Altun suture zone. Thus, the transition of the tectonic regime from compression to extension probably occurred during this stage, with the formation of widespread high-Mg adakitic rocks and post-collision granitoids.
Prior to our discovery of the North Altun adakitic rocks, adakitic rocks have also been widely reported in the North Qilian orogenic belt. For example, 461~440 Ma low-Mg adakitic rocks have been recognized mainly in the Leigongshan, Wuqiaoling, Heishishan and Xinkaiba plutons (Tseng et al. Reference Tseng, Yang, Yang, Liu, Wu, Cheng, Chen and Ker2009; Qin, Reference Qin2012; Yu et al. Reference Yu, Zhang, Qin, Sun, Zhao, Cong and Li2015). High-Mg adakitic rocks (435–425 Ma) have been reported in the Tongyinliang and Shenmutou plutons of the North Qilian suture zone (Tseng et al. Reference Tseng, Yang, Yang, Liu, Wu, Cheng, Chen and Ker2009; Qin, Reference Qin2012; Xiong, Zhang & Zhang, Reference Xiong, Zhang and Zhang2012; Yu et al. Reference Yu, Zhang, Qin, Sun, Zhao, Cong and Li2015). The rocks in the North Altun and the low-Mg and high-Mg adakitic rocks in the North Qilian are compositionally comparable to those formed in thickened lower crust and delaminated lower continental crust (Tseng et al. Reference Tseng, Yang, Yang, Liu, Wu, Cheng, Chen and Ker2009; Qin, Reference Qin2012; Yu et al. Reference Yu, Zhang, Qin, Sun, Zhao, Cong and Li2015). The geochemical, geochronological and petrogenetic similarities between the North Altun and North Qilian adakitic rocks suggest these two orogenic belts were subjected to similar tectonomagmatic processes during early Palaeozoic times. This inference is supported by the general similarities in their tectonic configurations and lithological assemblages. Specifically, the North Altun and North Qilian orogenic belts were both formed by the double subduction of the Palaeozoic ocean (Zhang et al. Reference Zhang, Meng and Wan2007; Wu et al. Reference Wu, Gao, Frost, Robinson, Wooden, Wu, Chen and Lei2009a, Reference Wu, Yang, Robinson, Wooden, Mazdab, Gao, Wu and Chenb, Reference Wu, Xu, Gao, Li, Lei, Gao, Frost and Wooden2010). They are both characterized by the occurrence of simultaneous subduction accretionary complexes including ophiolites, HP/LT metamorphic rocks, and arc volcanic and plutonic rocks. It is worth noting that coeval lawsonite-bearing eclogites of similar character have been newly reported in the North Altun and North Qilian orogenic belts (Zhang, Meng & Wan, Reference Zhang, Meng and Wan2007; Wu et al. Reference Wu, Gao, Frost, Robinson, Wooden, Wu, Chen and Lei2009a, Reference Wu, Yang, Robinson, Wooden, Mazdab, Gao, Wu and Chenb, Reference Wu, Xu, Gao, Li, Lei, Gao, Frost and Wooden2010; Xiao et al. Reference Xiao, Windley, Yong, Yan, Yuan, Liu and Li2009; Song et al. Reference Song, Niu, Su and Xia2013). The occurrences of low-Mg and high-Mg adakitic rocks with similar ages and petrogenesis provide further support for the suggestion that the North Altun orogenic belt is the northwestward extension of the North Qilian orogenic belt and was subsequently offset by the left-lateral slip of the Altun Tagh fault. In summary, the overall consistencies in the tectonic configurations and constituent lithological assemblages with the occurrence of adakitic rocks suggest that the continuity of the North Qilian and North Altun orogenic belts forms a single early Palaeozoic orogenic belt.


