


1. Introduction
When using sedimentary rocks or sediments as palaeoclimate archives, constraining provenance is an essential step in understanding sediment distribution pathways and for the interpretation of other proxies, such as those related to changes in climate. The isotopic composition of strontium (87Sr/86Sr) and neodymium (εNd) have been used extensively to characterize the provenance of siliciclastic sediments in the Arabian Sea (e.g. Kessarkar et al. Reference Kessarkar, Rao, Ahmad and Babu2003; Khim et al. Reference Khim, Horikawa, Asahara, Kim and Ikehara2018; Clift et al. Reference Clift, Zhou, Stockli and Blusztajn2019b; Yu et al. Reference Yu, Colin, Wan, Saraswat, Song, Xu, Clift, Lu, Lyle, Kulhanek, Hahn, Tiwari, Mishra, Miska and Kumar2019; Dailey et al. Reference Dailey, Clift, Kulhanek, Blusztajn, Routledge, Calvès, O’Sullivan, Jonell, Pandey, Andò, Coletti, Zhou, Li, Neubeck, Bendle, Aharonovich, Griffith, Gurumurthy, Hahn, Iwai, Khim, Kumar, Kumar, Liddy, Lu, Lyle, Mishra, Radhakrishna, Saraswat, Saxena, Scardia, Sharma, Singh, Steinke, Suzuki, Tauxe, Tiwari, Xu and Yu2020). Nd isotopes are a useful proxy for provenance because they are not considered to be significantly altered during erosion and weathering, and are not significantly fractionated during transport or diagenesis (Goldstein & Jacobsen, Reference Goldstein and Jacobsen1988; Goldstein & Hemming, Reference Goldstein and Hemming2003). In contrast, Sr isotopes are known to be sensitive to a variety of processes other than provenance; care must therefore be taken in their interpretation. For example, Sr isotopes are sensitive to carbonate content, weathering intensity and diagenesis. Despite these complications, Sr isotopes, when used in combination with Nd isotopes, can be useful in distinguishing between potential sediment sources. 87Sr/86Sr and εNd in sediments from the Indus Submarine Fan in the Arabian Sea can be used to trace the source of detrital sediments because of the varied isotopic compositions of sediments in rivers, which drain contrasting tectonic blocks (Fig. 1) (see Clift et al. Reference Clift, Zhou, Stockli and Blusztajn2019b).
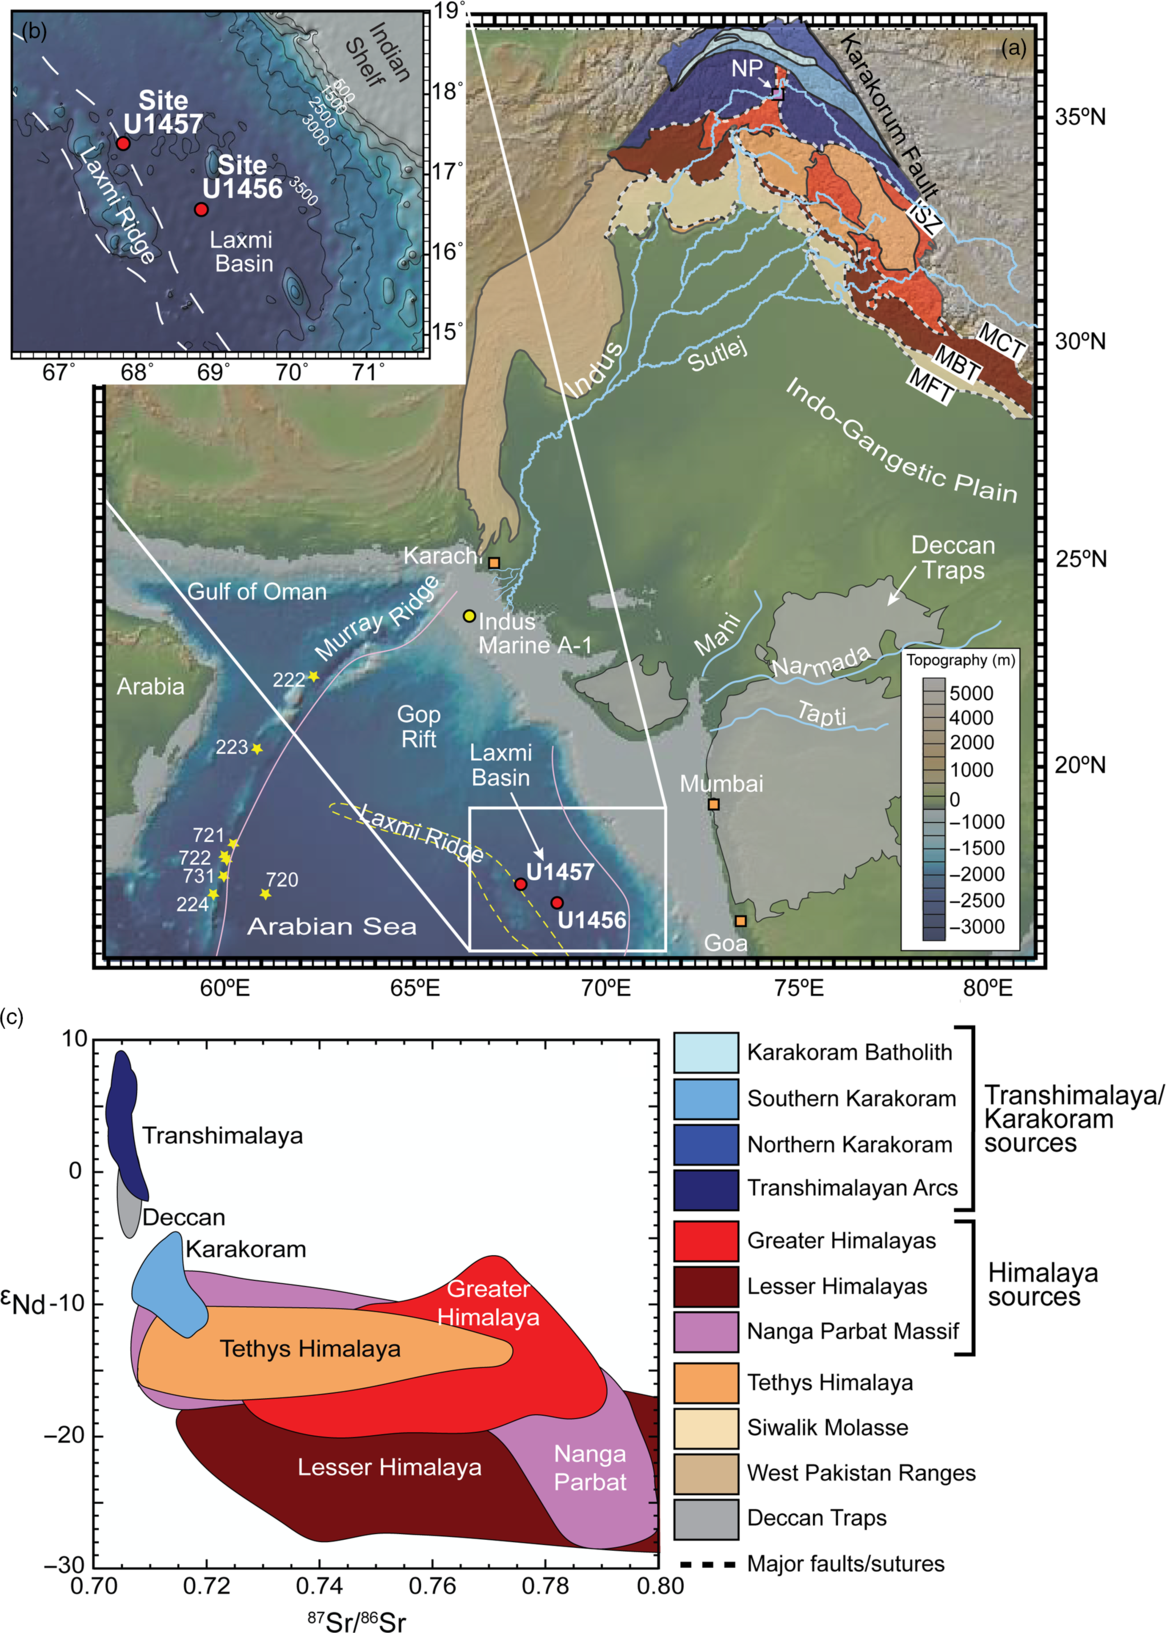
Fig. 1. (a) Shaded bathymetric and topographic map of the study area showing the location of the drilling sites in the Arabian Sea within the Laxmi Basin, the primary source terranes and major tributary systems of the Indus River, and smaller peninsular rivers that may have provided material to the drill sites. Numbered yellow stars indicate existing scientific boreholes from Deep Sea Drilling Project (DSDP) and Ocean Drilling Program (ODP). The major tectonic units of the western Himalaya that are eroded by the Indus River and its tributaries are overlaid. Rivers shown as blue lines. ISZ – Indus Suture Zone; MBT – Main Boundary Thrust; MCT – Main Central Thrust; MFT – Main Frontal Thrust; NP – Nanga Parbat. (b) Inset map with detail of the Laxmi Basin and location of the drill sites used in this study. (c) Strontium and neodymium isotopic composition of major tectonic units in the western Himalaya shown in (a). Figures modified from (Clift et al. Reference Clift, Zhou, Stockli and Blusztajn2019b).
Studies of provenance are often done using bulk sediment. However, this method can be biased in certain depositional settings due to the physical fractionation of sediment grains that occurs during transport and deposition (Garzanti et al. Reference Garzanti, Ando and Vezzoli2009; Garçon et al. Reference Garçon, Chauvel, France-Lanord, Limonta and Garzanti2014; Jonell et al. Reference Jonell, Li, Blusztajn, Giosan and Clift2018). Bulk sediment can be spatially heterogeneous as large and/or dense minerals settle more quickly and concentrate in bedloads while smaller and/or less dense minerals are preferentially transported in suspension (e.g. Dietrich, Reference Dietrich1982; Singh & France-Lanord, Reference Singh and France-Lanord2002; Galy et al. Reference Galy, France-Lanord and Lartiges2008; Garzanti et al. Reference Garzanti, Andò and Vezzoli2008). As a result, hydrodynamic sorting can occur during transport, affecting the chemical and isotopic composition of the deposited sediments (Garzanti et al. Reference Garzanti, Ando and Vezzoli2009, Reference Garzanti, Andó, France-Lanord, Censi, Vignola, Galy and Lupker2011; Bouchez et al. Reference Bouchez, Gaillardet, France-Lanord, Maurice and Dutra-Maia2011a, b; Lupker et al. Reference Lupker, France-Lanord, Lavé, Bouchez, Galy, Métivier, Gaillardet, Lartiges and Mugnier2011, Reference Lupker, France-Lanord, Galy, Lavé, Gaillardet, Gajurel, Guilmette, Rahman, Singh and Sinha2012).
In this study, the clay fraction (< 2 µm) is gravimetrically separated from the bulk sediment and analysed independently for provenance. As the smallest grain-size fraction, clays settle from the water column at a much slower rate, allowing them to travel further, more quickly and with a transfer time an order of magnitude shorter than that of the coarse fraction transported with the bedload (Granet et al. Reference Granet, Chabaux, Stille, Dosseto, France-Lanord and Blaes2010). A study of the Quaternary Indus Canyon has shown that while sand is often trapped near the river mouth, muddy sediments are directly transported deep into the Indus Canyon (Li et al. Reference Li, Clift and O’Sullivan2018). Due to the large distance between the study sites and the mouth of the Indus River (c. 800 km; Fig. 1), which is the major source for these sediments (Pandey et al. Reference Pandey, Clift, Kulhanek and Pandey2016; Clift et al. Reference Clift, Zhou, Stockli and Blusztajn2019b), we anticipate that the influence of hydrodynamic sorting and sediment transport processes will cause less bias on the provenance signal to the clay-sized fraction compared with that of larger-size fractions and bulk sediment. In addition, specific mineral phases strongly control the Sr (feldspars, epidote, carbonate) and Nd (monazite and allanite) isotopic compositions, and may be relatively enriched or depleted into a particular size fraction during transport (e.g. Garzanti et al. Reference Garzanti, Ando and Vezzoli2009; Garçon et al. Reference Garçon, Chauvel, France-Lanord, Limonta and Garzanti2014). However, clays are formed by chemical weathering, largely in flood plain environments, and therefore reflect the overall composition (in terms of radiogenic isotopic composition) of what is being weathered at the time of alteration (e.g. Chamley, Reference Chamley1989; Derry & France-Lanord, Reference Derry and France-Lanord1996). The records produced from the clay-sized fraction are compared with records from bulk sediment from the same samples (Clift et al. Reference Clift, Zhou, Stockli and Blusztajn2019b) to determine if sorting caused by sediment transport plays a significant role in controlling the isotopic compositions. Additionally, records of bulk grain size and K/Al (a common measure of chemical alteration) of the clay fraction are also presented to assess whether the provenance records are significantly affected by weathering and sediment transport.
1.a. Links to climate and the South Asian monsoon
The intricacies of the relationships between continental erosion, climate and mountain building, and how these ultimately impact Earth’s environment, continue to be debated. However, these relationships are important to study if we are to increase our understanding of how the solid Earth interacts with the climate system, as modulated by surface processes (e.g. Raymo et al. Reference Raymo, Ruddiman and Froelich1988; Raymo & Ruddiman, Reference Raymo and Ruddiman1992; Berner & Caldeira, Reference Berner and Caldeira1997; Li & Elderfield, Reference Li and Elderfield2013). The Himalayas have undergone substantial weathering and erosion due to the region’s high rock uplift rates over long periods of time. The intensity and pattern of the monsoon rains affecting this region influence erosion within each drainage basin, which in turn affects the supply of sediments to the seas and surface and deep water circulation, ultimately determining sediment dispersal and deposition (Clift et al. Reference Clift, Hodges, Heslop, Hannigan, Van Long and Calves2008; Rahaman et al. Reference Rahaman, Singh, Sinha and Tandon2009; Goswami et al. Reference Goswami, Singh, Bhushan and Rai2012). Heavy or prolonged rainfall can trigger landslides in this region (e.g. Dahal & Hasegawa, Reference Dahal and Hasegawa2008; Mathew et al. Reference Mathew, Babu, Kundu, Kumar and Pant2014) which can also influence sediment efflux and dispersal (Allen & Hovius, Reference Allen and Hovius1998), at least over short time periods of years to decades (Li et al. Reference Li, Clift and O’Sullivan2018). Because of the progressive imbrication and uplift of the Himalayan tectonic wedge (Webb, Reference Webb2013) and the changing environmental conditions, the source of erosion in the western Himalaya is expected to (and does) evolve through time. Constraining how this may have happened is an additional goal of this study. Although the proximal foreland basin provides some information about this process, individual sections of these sedimentary rocks must reflect deposits from rivers in that part of the foreland and thus erosion of a limited portion of the ranges (Najman, Reference Najman2006). In contrast, the deep-sea record we examine here provides a basin-wide overview, not previously available prior to the drilling of Expedition 355 sites. In addition to investigating the influence of sediment transport, this study aims to elucidate what tectonic units were being eroded and if this may correlate with monsoon intensity and weathering in a well-dated core from the Indus Fan.
2. Materials and methods
2.a. Study site location and the Indus Fan
IODP Expedition 355 ‘Arabian Sea Monsoon’ drilled two locations, Sites U1456 and U1457 (Fig. 1), located within the Laxmi Basin in the eastern Arabian Sea (Pandey et al. Reference Pandey, Clift, Kulhanek and Pandey2016) c. 115 km away from each other. The two sites recovered sediments dating back to the middle Miocene Epoch (although there are several hiatuses) and are split into four lithologic units that are similar at both sites (Figs 2 and 3), with an additional unit (Unit V) recovered at Site U1457 that was not recovered at Site U1456 (Pandey et al. Reference Pandey, Clift, Kulhanek and Pandey2016). Although the units are similar at both sites, they were not defined to be correlatable between the sites. Depths at each site are reported on a composite depth scale (core composite depth below seafloor, or CCSF) that was constructed to place samples from different holes on a common depth scale (Pandey et al. Reference Pandey, Clift, Kulhanek and Pandey2016; Routledge et al. Reference Routledge, Kulhanek, Tauxe, Scardia, Singh, Steinke, Griffith and Saraswat2019) that are shown here as metres below seafloor (mbsf). Unit I (U1456: 121 m thick; U1457: 74 m thick) consists of hemipelagic nannofossil and foraminifer-rich ooze interbedded with clay, silt and sand. Unit II (U1456: 240 m thick; U1457: 311 m thick) is made up of mostly terrigenous sediment with some hemipelagic sequences; these are mainly massive sand and silt interbedded with thinly bedded nannofossil-rich clay, interpreted as a series of turbidites. Unit III (U1456: 370 m thick; U1457: 450 m thick) is interpreted as a series of turbidite deposits, although a slightly more distal lobe than the overlying Unit II, and largely consists of clay/claystone, sand/sandstone, nannofossil chalk and nannofossil-rich claystone. Unit IV (U1456: 380 m thick; U1457: 225 m thick) consists of interbedded layers of massive claystone, calcarenite and conglomerate/breccia with minor amounts of limestone. A mass-transport deposit, the Nataraja Slide, dominates Unit IV (U1456: 774–1101.65 mbsf; U1457 848–1054.1 mbsf) (Dailey et al. Reference Dailey, Clift, Kulhanek, Blusztajn, Routledge, Calvès, O’Sullivan, Jonell, Pandey, Andò, Coletti, Zhou, Li, Neubeck, Bendle, Aharonovich, Griffith, Gurumurthy, Hahn, Iwai, Khim, Kumar, Kumar, Liddy, Lu, Lyle, Mishra, Radhakrishna, Saraswat, Saxena, Scardia, Sharma, Singh, Steinke, Suzuki, Tauxe, Tiwari, Xu and Yu2020). Unit V at Site U1457 is a 30-m-thick Paleocene unit comprising claystone and volcaniclastic sediment overlying the basaltic basement.

Fig. 2. Results from Site U1456. (a) The average grain size of sediments (green). The solid black line is the 5-point running average. The background shows the proportion of clay (< 2 µm), silt (2–63 µm) and sand (> 63 µm) -sized grains. (b) K/Al ratio of the separated clay fraction. (c) 87Sr/86Sr of the separated clay fraction. (d) εNd of the separated clay fraction. The dark-grey shaded areas in (b–d) show the 5-point running standard deviation of the data, while the light-grey shaded areas show the error derived from replicate samples, which are a new digestion of the separated clay fraction for each sample (see Table 1). These are shown in the context of lithology (from Pandey et al. Reference Pandey, Clift, Kulhanek and Pandey2016). Orange zone outlines the location of the mass-transport deposit (MTD), the Nataraja slide, as defined by Dailey et al. (Reference Dailey, Clift, Kulhanek, Blusztajn, Routledge, Calvès, O’Sullivan, Jonell, Pandey, Andò, Coletti, Zhou, Li, Neubeck, Bendle, Aharonovich, Griffith, Gurumurthy, Hahn, Iwai, Khim, Kumar, Kumar, Liddy, Lu, Lyle, Mishra, Radhakrishna, Saraswat, Saxena, Scardia, Sharma, Singh, Steinke, Suzuki, Tauxe, Tiwari, Xu and Yu2020).

Fig. 3. Results from Site U1457. (a) The average grain size of sediments (green). The solid black line is the 5-point running average. The background shows the proportion of clay (< 2 µm), silt (2–63 µm) and sand (> 63 µm) -sized grains. (b) K/Al ratio of the separated clay fraction. (c) 87Sr/86Sr of the separated clay fraction. (d) εNd of the separated clay fraction. The dark-grey shaded areas in (b–d) show the 5-point running standard deviation of the data, while the light-grey shaded areas show the error derived from replicate samples, which are a new digestion of the separated clay fraction for each sample (see Table 1). These are shown in the context of lithology (from Pandey et al. Reference Pandey, Clift, Kulhanek and Pandey2016). Orange zone outlines the location of the mass-transport deposit (MTD), the Nataraja slide, as defined by Dailey et al. (Reference Dailey, Clift, Kulhanek, Blusztajn, Routledge, Calvès, O’Sullivan, Jonell, Pandey, Andò, Coletti, Zhou, Li, Neubeck, Bendle, Aharonovich, Griffith, Gurumurthy, Hahn, Iwai, Khim, Kumar, Kumar, Liddy, Lu, Lyle, Mishra, Radhakrishna, Saraswat, Saxena, Scardia, Sharma, Singh, Steinke, Suzuki, Tauxe, Tiwari, Xu and Yu2020).
A total of 83 sediment samples were processed and analysed, spanning the majority of the cored section at Site U1457 dating from 11.76 to 0.05 Ma, with an approximate average sample spacing of 0.1 Ma. This was complemented with 44 samples from Site U1456. Sedimentation rates at the sites were highly variable, with the mass-transport deposit being rapidly emplaced during the late Miocene Epoch, just prior to 10.8 Ma (Dailey et al. Reference Dailey, Clift, Kulhanek, Blusztajn, Routledge, Calvès, O’Sullivan, Jonell, Pandey, Andò, Coletti, Zhou, Li, Neubeck, Bendle, Aharonovich, Griffith, Gurumurthy, Hahn, Iwai, Khim, Kumar, Kumar, Liddy, Lu, Lyle, Mishra, Radhakrishna, Saraswat, Saxena, Scardia, Sharma, Singh, Steinke, Suzuki, Tauxe, Tiwari, Xu and Yu2020). The age model applied is the revised age model constructed from biostratigraphy, palaeomagnetic reversal stratigraphy and Sr-isotope stratigraphy (Routledge et al. Reference Routledge, Kulhanek, Tauxe, Scardia, Singh, Steinke, Griffith and Saraswat2019) (see online Supplementary Material SM1, available at http://journals.cambridge.org/geo).
Samples were dried and c. 5 cm3 was used for clay separation and digestion, while c. 0.5 cm3 was reserved for grain-size analysis. Grain-size distribution was analysed using the Malvern® Mastersizer 2000™ (Malvern, UK) at the Texas A&M University at Galveston following the method outlined in Dellapenna et al. (Reference Dellapenna, Fielder, Noll and Savarese2015). The Mastersizer 2000™ uses laser diffraction to produce a grain-size distribution ranging from 0.02 to 2000 µm. It should be noted that there are some limitations to the accuracy of laser particle sizing for natural sediments. Due to particle non-sphericity, the measured particle size is heavily skewed towards the length of a given particle’s longest axis (Xu & Di Guida, 2003) and, as such, tends to underestimate the clay content (Loizeau et al. Reference Loizeau, Arbouille, Santiago and Vernet1994; Buurman et al. Reference Buurman, Pape and Muggler1997; Beuselinck et al. Reference Beuselinck, Govers, Poesen, Degraer and Froyen1998). Laser diffraction techniques assume the particles are spheres, which is not necessarily the case in natural materials. As the shape of a particle deviates more from that of a sphere, laser diffraction tends to estimate progressively larger sizes (Xu & Di Guida, 2003). This causes an underestimation of clay content in samples because clay minerals are elongate and platy in shape (Loizeau et al. Reference Loizeau, Arbouille, Santiago and Vernet1994; Buurman et al. Reference Buurman, Pape and Muggler1997; Beuselinck et al. Reference Beuselinck, Govers, Poesen, Degraer and Froyen1998).
To prepare the samples, the 0.5 cm3 aliquot was dispersed with sodium hexametaphosphate and sonicated. Pipette draws of the sonicated samples were then added to the Mastersizer until instrument obscuration reached an optimal level to properly analyse the sample. Samples were not sieved prior to analysis because there were no grains larger than 2000 µm.
To prepare the 5 cm3 samples for clay separation and dissolution, carbonates were first removed by adding 25 mL of 10% acetic acid. The carbonate fraction was dissolved in the acetic acid solution, then decanted from the remaining solid fraction. For carbonate leaching, acetic acid was used in preference to hydrochloric acid (HCl) to avoid the introduction of systematic bias that HCl can have on measured 143Nd/144Nd values, which is more corrosive and leads to significant loss of Sm and Nd during the leaching process (Hein et al. Reference Hein, Galy, Galy, France-Lanord, Kudrass and Schwenk2017). The clay-sized fraction (< 2 μm) was then separated from the bulk decarbonated sediment. This separation method was modified from a shipboard IODP method (Brandt et al. Reference Brandt, Barnes and Bronk2013) which, when examined, was found to cause significant contamination of grain sizes > 2 μm. The centrifugation speeds were therefore modified and liquid nitrogen was employed to prevent contamination by larger grain sizes while decanting (online Supplementary Material SM1, Section S2). This method was tested with a particle size analyser and found to successfully separate the < 2 μm fraction, with no contamination of larger grain-size fractions.
2.b. Sample digestion and concentration analysis
To prepare the clays for isotopic analysis, 20–50 mg of the separated clay fraction were digested with a concentrated HF-HNO3-HCl-H2O2 mixture in airtight Teflon vessels for 5 days at 95°C. Samples not fully digested were subjected to an additional microwave digestion (online Supplementary Material SM1, Section S3). An aliquot of the digested sample was taken for analysis of K, Al, Sr and Nd concentrations using inductively coupled plasma optical emission spectroscopy (ICP-OES) and ICP-mass spectrometry (ICP-MS). A total of 15 full method blanks were analysed on the ICP-OES or ICP-MS, with average concentrations of 1.62% for K, 0.19% for Al, 0.14% for Sr and 0.79% for Nd of sample concentration (online Supplementary Material SM1, Section S4). For Al, Sr and Nd, over half of the measured method blanks were below the detection limit of the instrument, which was 0.32 ppm for K (1.49% of sample concentration), 0.43 ppm for Al (0.57% of sample concentration), 0.46 ppb for Sr (0.70% of sample concentration), and 0.01 ppb for Nd (0.10% of sample concentration). Detection limits were determined as three times the standard deviation of blank measurements.
2.c. Sr separation and isotopic analysis
Sr separation was carried out on all 127 samples using Eichrom’s Sr-specific resin following the method outlined by Scher et al. (Reference Scher, Griffith and Buckley2014) with additional rinses to ensure removal of Rb prior to release of Sr. The isotopic composition of Sr for 60 samples was measured using the Neptune Plus MC-ICP-MS at the University of South Carolina. Instrumental mass fractionation during analyses was corrected by normalizing measured ratios to 86Sr/88Sr = 0.1194 using an exponential law. Samples were split into four different sets to run on the MC-ICP-MS, with replicate analysis of standard reference material (SRM) 987 yielding 0.710313 ± 0.000024 (2σ, n = 32) over all sample runs. Sample 87Sr/86Sr data from the MC-ICP-MS were normalized to SRM 987, which has a reported value of 0.710248 (McArthur, Reference McArthur1994). Isotopic composition of Sr on the remaining samples (23 from Site U1457 and 44 from Site U1456) was measured using the Triton Plus multicollector thermal ionization mass spectrometer (TIMS) at Ohio State University after its installation in February 2018 (online Supplementary Material SM1, Section S5). To ensure the data would not be biased due to instrumental differences, eight sets of duplicate samples were run on both the MC-ICPMS and TIMS. Duplicated samples yielded identical results within error, allowing us to conclude that instrumental bias did not affect the data (online Supplementary Material SM1, Section S6). On the TIMS, Sr was ionized using a Re single filament with Ta2O5 activator. Within-run isotope fractionation was corrected by normalizing measured ratios to 88Sr/86Sr = 8.3752 using an exponential law. Replicate analysis of SRM 987 yielded 0.710247 ± 0.000013 (2σ, n = 33), equivalent to the accepted value of 0.710248 (McArthur, Reference McArthur1994).
2.d. Nd separation and isotopic analysis
From the 127 clay-fraction samples measured for Sr, a subset of 38 was chosen for Nd isotope analysis. The subset of 38 clay-fraction samples were selected because they were at the same depth as the carbonate-free bulk samples (at the same depth or directly adjacent, within 2 cm, in the cored sediment; chosen so they appeared to be identical sediments to those analysed by Clift et al. Reference Clift, Zhou, Stockli and Blusztajn2019b), meaning that results between the clay-fraction and bulk sediment could be compared. Separation of the rare earth elements (REEs) was carried out using 1 mL columns filled with AG50W-X8 (200–400 mesh) resin. Samples were loaded onto columns, washed with 20 mL 2 N HCl, and the REE fraction was collected in 10 mL 6 N HCl. Nd was separated from the REE fraction using LN Resin (HDEHP (di-2ethylhexyl-orthophosphoric acid) -coated Teflon powder) following the method outlined by Scher & Delaney (Reference Scher and Delaney2010). On the TIMS, Nd was ionized using a Re double filament with H3PO4 (online Supplementary Material SM1, Section S5). Instrumental mass fractionation during analyses was corrected by normalizing measured ratios to 146Nd/144Nd = 0.7219 using an exponential law. Replicate analysis of La Jolla Nd yielded 0.511844 ± 0.000005 (2σ, n = 13). 143Nd/144Nd ratios are reported in epsilon notation (εNd) (DePaolo & Wasserburg, Reference DePaolo and Wasserburg1976) using a 143Nd/144Nd value of 0.512638 for the chondritic uniform reservoir (CHUR) (Bouvier et al. Reference Bouvier, Vervoort and Patchett2008) (for results, see online Supplementary Material SM1, Tables S6 and S7).
3. Results
3.a. Grain size
Sediments from Site U1456 are largely dominated by silt-sized grains throughout most of the section (Fig. 2a). Because of poor recovery below 465 mbsf, grain size in deeper sediments should be interpreted with caution. Unit IV has abundant clay, including in the mass-transport deposit, with an average grain size of 2.7 µm. Unit III is similar in grain size, with mainly silt and clay and a few sand interbeds that increase the average grain size of the unit to 6.3 µm. Unit II coarsens upsection from silt-dominated sediment with several interbedded sandy layers to sand-dominated beginning at c. 225 mbsf and has the largest average grain size compared with the other units of 38.8 µm. Unit I is silt-dominated with an overall average grain size of 13.0 µm, with a slight decrease in average grain size upsection.
Depth-related grain-size trends are similar at Site U1457 (Fig. 3a), with a dominance of silt-sized grains. This pattern remains relatively consistent throughout the cored section. Unit V has the largest average grain sizes compared with the other units and has the highest percentage of sand, with an average grain size of 34.0 µm. Unit V is a silty claystone interbedded with volcanic-bearing breccia (Pandey et al. Reference Pandey, Clift, Kulhanek and Pandey2016). The largest average grain size seen in Unit V (100 µm) occurs within one of the volcanic-bearing breccia layers, while the other samples from this unit are medium to coarse silt. The mass-transport deposit comprises most of Unit IV, which has more clay-sized grains, similar to that found at Site U1456, and an average grain size of 3.9 µm. Unit III is silt dominated, with sandy interbeds and a slight increase in the overall average grain size, which is 5.7 µm. The average grain size continues to increase slightly upsection, with an average of 7.5 µm in Unit II, which has relatively less clay-sized grains throughout the section compared with Unit III. In Unit I, clay-sized grains account for around 30% of the total sediment volume, higher than the underlying unit, with an average grain size of 4.5 µm.
3.b. Clay K/Al ratios
Clay K/Al ratios at Site U1456 range from 0.20 to 0.36 mg L–1 (mg L–1)–1 (Fig. 2b), with an average value of 0.28. The error applied to the record (±0.04; light grey envelope) is defined from the reproducibility of replicate measurements (n = 35) (online Supplementary Material SM1, Section S7) in order to express the error produced by the heterogeneity of the sample clay sediment. The bottom of Unit IV, the mass-transport deposit, has low K/Al values, which increase slightly upsection through Unit III until c. 620 mbsf, above which values remain relatively stable, with some fluctuations at c. 400 mbsf. K/Al values increase slightly over Unit II, with a peak at c. 200 mbsf, after which they decrease again and remain relatively consistent through Unit I.
Clay K/Al values at Site U1457 range from 0.04 to 0.49 (Fig. 3b), with an average of 0.31. Unit V has extremely low K/Al ratios compared with other sediments at this site or at Site U1456. K/Al values increase upsection through Unit IV and into Unit III, until c. 600 mbsf where there is a distinct drop. After this, values increase until c. 500 mbsf, followed by another decrease until c. 400 mbsf. K/Al values remain relatively consistent through Unit II, although recovery is poor through this interval, resulting in fewer measurements, and then increase upsection in Unit I.
3.c. Sr isotopes
Values of 87Sr/86Sr fall within the range 0.7111–0.7213 in the clay at Site U1456 (Fig. 2c), with an average of 0.7159. The error applied to the record (±0.000246; light grey envelope) stems from the reproducibility of replicate clay sample measurements (n = 9) in order to show the error produced by the heterogeneity of sample clay sediment, although this is much smaller than the effective reproducibility for fine-grained Indus delta sediment noted by Jonell et al. (Reference Jonell, Li, Blusztajn, Giosan and Clift2018) (online Supplementary Material SM1, Section S7). 87Sr/86Sr values are stable around 0.712 in Unit IV and begin to increase upsection through Unit III until c. 620 mbsf, above which they remain relatively stable. Values increase in variability at the top of the section. This variability continues upsection through Unit II. 87Sr/86Sr decreases to less radiogenic values above c. 200 mbsf, continuing through Unit I.
At Site U1457, 87Sr/86Sr values fall within the range 0.7084–0.7228 in the clay (Fig. 3c), with an average of 0.7152. Unit V is characterized by particularly low values of c. 0.709. There is a gradual increase in 87Sr/86Sr values upsection from Unit IV, including the mass-transport deposit, and upsection through Unit III to 700 mbsf. Above this depth, there is a short trend towards less radiogenic values to 600 mbsf. Most of Unit II has relatively stable values, with an average of 0.7211. There is a large increase in 87Sr/86Sr values upsection within Unit I.
3.d. Nd isotopes
εNd values in the clay at Site U1456 range from −12.30 to −6.14 (Fig. 2d), with an average of −9.88. Only one set of replicates was done for Nd analysis, so that the error applied (±1 εNd; light grey envelope) stems from the average deviation of isotopic composition as a result of mineralogy, grain-size distribution and analytical error as determined by Jonell et al. (Reference Jonell, Li, Blusztajn, Giosan and Clift2018). Values vary by up to four εNd units in Unit III and II, but no discernable trends are apparent due to low sampling resolution. There is a slight increase upsection of one εNd unit in Unit I.
At Site U1457 εNd values in the clay vary from −12.06 to −0.01 (Fig. 3d), with an average of −8.88. There is one extremely high value (near zero) in Unit V. There is a gradual decrease in εNd values upsection from the mass-transport deposit to 700 mbsf. There are fluctuations of close to four εNd units in Unit III and II, with a distinct increase of two εNd units upsection in Unit I.
4. Discussion
4.a. Sediment transport influence: bulk sediment v. clay-fraction isotopes
Sediment transport processes are known to bias isotopic records (Garzanti et al. Reference Garzanti, Ando and Vezzoli2009, Reference Garzanti, Andó, France-Lanord, Censi, Vignola, Galy and Lupker2011; Bouchez et al. Reference Bouchez, Gaillardet, France-Lanord, Maurice and Dutra-Maia2011a, b; Lupker et al. Reference Lupker, France-Lanord, Lavé, Bouchez, Galy, Métivier, Gaillardet, Lartiges and Mugnier2011, Reference Lupker, France-Lanord, Galy, Lavé and Kudrass2013; Jonell et al. Reference Jonell, Li, Blusztajn, Giosan and Clift2018). As sediments are transported, weathered and deposited, hydrodynamic sorting caused by differences in grain size, shape and density leads to mineralogical and therefore chemical differentiation of sediments (Singh & France-Lanord, Reference Singh and France-Lanord2002; Bouchez et al. Reference Bouchez, Gaillardet, France-Lanord, Maurice and Dutra-Maia2011a, b; Garzanti et al. Reference Garzanti, Andó, France-Lanord, Censi, Vignola, Galy and Lupker2011; Lupker et al. Reference Lupker, France-Lanord, Lavé, Bouchez, Galy, Métivier, Gaillardet, Lartiges and Mugnier2011, Reference Lupker, France-Lanord, Galy, Lavé and Kudrass2013). For marine detrital records such as those cored at Sites U1456 and U1457, changes in sediment transport and deposition patterns (e.g. the autocyclic switching of fan depositional lobes and sea level modulating temporary sediment storage and mixing on the continental shelf) induce changes in the grain size of deposited sediments that, in turn, affect the chemical composition (Lupker et al. Reference Lupker, France-Lanord, Galy, Lavé and Kudrass2013).
In order to investigate the influence of sediment transport processes, the clay 87Sr/86Sr and εNd records measured in this study are compared with 87Sr/86Sr and εNd data from the bulk decarbonated sediment measured in the same cores and reported by Clift et al. (Reference Clift, Zhou, Stockli and Blusztajn2019b). Due to the small-scale changes in lithology at these locations (e.g. turbidites), clay and bulk samples were only compared (i.e. matched) if they were directly adjacent to one another (at the same depth or < 2 cm apart in the same core) and appeared to consist of the same sediment lithology. There is a strong positive relationship between bulk and clay 87Sr/86Sr and εNd (Fig. 4). The terms used to describe relationship strength are chosen based on Cohen’s classification scheme of interpreting correlation strength by r-values (Cohen, Reference Cohen and Cohen1988). The strong positive relationship between bulk and clay isotopic records is stronger for εNd (r = 0.90) than it is for 87Sr/86Sr (r = 0.65) (Fig. 4), which is probably due to the various processes other than provenance that influence 87Sr/86Sr (discussed in more detail in Section 4.b). However, there is still a strong correlation between the clay-fraction 87Sr/86Sr and εNd records (r = −0.8). Because εNd is strongly controlled by provenance and is not as sensitive to other influences as 87Sr/86Sr (e.g. weathering, transport, diagenesis), a strong correlation indicates that the measured 87Sr/86Sr values are dominated by provenance.

Fig. 4. Correlation matrix showing the Pearson correlation coefficients (r) between designated records from Sites U1456 and U1457, excluding samples from the mass-transport deposit in Unit IV. Colours indicate the strength and direction of the relationship between records (dark blue – strong positive; light blue – weak positive; white – very weak/none; pink – weak negative; red – strong negative). Relationship strength is based on the Cohen (Reference Cohen and Cohen1988) classification scheme for interpreting correlation strength using r-values. Relationships in bold formatting are significant at the 95% confidence level (i.e. P < 0.05). Bulk 87Sr/86Sr and bulk εNd records from Clift et al. (Reference Clift, Zhou, Stockli and Blusztajn2019b).
The average grain size of the sediment deposited at these sites is strongly correlated to the bulk Sr and Nd isotopic records (r = 0.62) and weakly correlated with the clay-fraction records (r = 0.36; Fig. 5). As the average grain size increases, 87Sr/86Sr increases while εNd decreases (Fig. 5). This is true for both the bulk sediment and the clay fraction (although only weakly correlated in the clay fraction).

Fig. 5. The isotopic composition of Sr and Nd in clay fraction (green; this study) and bulk sediment (blue; Clift et al. Reference Clift, Zhou, Stockli and Blusztajn2019b) versus the average grain size. The Pearson correlation coefficients (r) between the records are shown for each figure. The figures show a stronger relationship between average grain size and the bulk sediment isotopes than with the clay fraction isotopes.
The strong correlation with grain size for bulk isotope records may be caused by hydrodynamic sorting, as several river and delta systems demonstrate a clear correlation between higher 87Sr/86Sr and increasing grain size (Dasch, Reference Dasch1969; Colin et al. Reference Colin, Turpin, Blamart, Frank, Kissel and Duchamp2006; Jonell et al. Reference Jonell, Li, Blusztajn, Giosan and Clift2018) because more radiogenic phases concentrate into the coarser fractions, with less radiogenic phases sorted into the finer fraction. Sr isotopes in the smaller grain-size fractions are strongly controlled by potassium feldspar, mica, epidote and clay minerals (Jonell et al. Reference Jonell, Li, Blusztajn, Giosan and Clift2018). This relationship has also been observed to occur with Nd isotopes, although to a lesser extent, with more radiogenic values observed in the clay fraction (Bayon et al. Reference Bayon, Toucanne, Skonieczny, André, Bermell, Cheron, Dennielou, Etoubleau, Freslon, Gauchery, Germain, Jorry, Ménot, Monin, Ponzevera, Rouget, Tachikawa and Barrat2015); however, a systematic offset is not observed in all sediments (Jonell et al. Reference Jonell, Li, Blusztajn, Giosan and Clift2018). For Nd isotopes, the fine-grained sediments are controlled by the minerals monazite and allanite, while coarse bulk sediments are controlled by mica (Jonell et al. Reference Jonell, Li, Blusztajn, Giosan and Clift2018).
Alternatively, the relationship with grain size may be influenced by shifts in sediment provenance. At Sites U1456 and U1457, variations in Sr–Nd isotopes from bulk sediment over the last 1.2 Ma have been interpreted to represent changes in the relative proportions of sediments derived from the Indus River and the Deccan Traps (Khim et al. Reference Khim, Horikawa, Asahara, Kim and Ikehara2018; Yu et al. Reference Yu, Colin, Wan, Saraswat, Song, Xu, Clift, Lu, Lyle, Kulhanek, Hahn, Tiwari, Mishra, Miska and Kumar2019). Low 87Sr/86Sr and high εNd in the bulk sediment are interpreted to be associated with more erosion from the Deccan Traps, and high 87Sr/86Sr and low εNd associated with the Indus River (Khim et al. Reference Khim, Horikawa, Asahara, Kim and Ikehara2018; Yu et al. Reference Yu, Colin, Wan, Saraswat, Song, Xu, Clift, Lu, Lyle, Kulhanek, Hahn, Tiwari, Mishra, Miska and Kumar2019). Influence from a Transhimalayan source was not considered in this study, though it is impossible to rule this out without additional proxies due to their similar isotopic composition (discussed further in Section 4.c). These isotopic variations are accompanied by clay mineral changes, with smectite accompanying the more Deccan-like isotopic signature, and illite accompanying the more Indus-like isotopic signature. In our longer record, Sr isotopes in both clay and bulk sediment strongly negatively correlate with the proportion of clay, while Nd isotopes are strongly positively correlated. This suggests that times of low 87Sr/86Sr and high εNd are more clay-rich and times of high 87Sr/86Sr and low εNd are more sand-rich, consistent with interpreted variations in Deccan-like and Indus-like sediments in younger records at these same sites (Cai et al. Reference Cai, Xu, Clift, Khim, Lim, Yu, Kulhanek and Li2018; Khim et al. Reference Khim, Horikawa, Asahara, Kim and Ikehara2018; Yu et al. Reference Yu, Colin, Wan, Saraswat, Song, Xu, Clift, Lu, Lyle, Kulhanek, Hahn, Tiwari, Mishra, Miska and Kumar2019). Chemical weathering of the Deccan Traps produces large volumes of clay minerals (mainly smectite) (Debrabant et al. Reference Debrabant, Krissek, Bouquillon, Chamley, Prell and Niitsuma1991; Rao & Rao, Reference Rao and Rao1995; Kessarkar et al. Reference Kessarkar, Rao, Ahmad and Babu2003; Phillips et al. Reference Phillips, Johnson, Underwood, Guo, Giosan and Rose2014). The isotopic variations, which may be indicative of a Deccan-like source, may therefore be mainly identified in the clay-sized fraction, but remain absent in the isotopic characteristics of the silt- and sand-sized fractions. This difference highlights the necessity of comparing records of provenance from separate size fractions to fully understand the variations in erosion that may be impacting the sedimentary record.
Examining the magnitude of the difference between clay 87Sr/86Sr and bulk 87Sr/86Sr (|87Sr/86Srclay − 87Sr/86Srbulk| =|Δ87Sr/86Sr|) and clay εNd and bulk εNd (|εNd-clay − εNd-bulk| = |ΔεNd|), or how large the difference is between the bulk and the clay fraction, reveals interesting relationships within the isotopic records. |Δ87Sr/86Sr| is strongly correlated with bulk 87Sr/86Sr (r = 0.74) and bulk εNd (r = 0.59), but is only weakly correlated with the clay-fraction 87Sr/86Sr (r = 0.35) and clay-fraction εNd (r = 0.38) (Fig. 6). |ΔεNd| is strongly correlated to bulk 87Sr/86Sr (r = 0.53) and weakly correlated to bulk εNd (r = 0.34), but does not significantly correlate with clay-fraction 87Sr/86Sr (r = 0.15) or the clay-fraction εNd (r = 0.02) (Fig. 6). This suggests that heterogeneity of the bulk sediment is responsible for the differences between the bulk and clay-fraction isotopic records for Sr and, to a lesser degree, Nd. In turn this is most likely caused by transport processes during deposition on the fan. The |Δ87Sr/86Sr| and |ΔεNd| are also strongly positively correlated with average grain size (r > 0.6). As the grain size becomes larger, the heterogeneity of the isotopic composition of the sediment (i.e. the difference between the bulk and clay fraction) therefore increases.

Fig. 6. The isotopic composition of Sr and Nd in clay fraction (green; this study) and bulk sediment (blue; Clift et al. Reference Clift, Zhou, Stockli and Blusztajn2019b) versus the magnitude of the difference between the clay fraction and bulk sediment Sr composition (|∆87Sr/86Sr|) and Nd composition (|∆εNd|). The Pearson correlation coefficients (r) between the records are shown for each figure. The figures show a stronger relationship between |∆87Sr/86Sr| and bulk sediment 87Sr/86Sr than the clay fraction 87Sr/86Sr, and a stronger relationship between |∆εNd| and bulk sediment εNd than the clay fraction εNd.
The heterogeneity of sediment deposited in the distal Indus Fan can lead to difficulty reproducing isotopic values from replicate samples. It is important to be able to replicate results within a single sample to affirm the reliability of the data and to reduce uncertainty in the measurement. Replicate analyses of Sr isotopic measurements on clay-fraction sediments reveal better reproducibility when compared with that of the bulk sediment or other size fractions. Jonell et al. (Reference Jonell, Li, Blusztajn, Giosan and Clift2018) performed replicate analyses on multiple size fractions from relatively coarse Holocene Indus delta sediments, although not the clay fraction alone. Reproducibility varied between samples and grain-size fractions, ranging from a maximum difference in 87Sr/86Sr between replicates of 0.012453 in the 63–125 μm fraction to a minimum of 0.000012 in the 125–250 μm fraction. The average reproducibility for the clay-fraction data in our study (Table 1) is c. 0.000246, with the maximum difference (0.000893) below the average reproducibility from other size fractions as measured by Jonell et al. (Reference Jonell, Li, Blusztajn, Giosan and Clift2018) (Fig. 7). This indicates that the heterogeneity of the sediment material is not as influential on the Sr isotopic record when analysing the separated clay fraction. This reduces the uncertainty in the measurements of the clay fraction and increases the confidence in interpreting isotopic variability measured in the clay fraction as changes in provenance. If sediment transport processes appear to play a significant role in a sedimentary archive, it is important to reconstruct provenance from multiple grain-size fractions to allow for a more reliable interpretation of provenance variability.
Table 1. Replicate measurements of Sr isotopes on clay-fraction samples. Replicate measurements are performed on a new digestion of the separated clay fraction for each sample. SEM – standard error of the mean.


Fig. 7. Difference between replicate analyses of sediment samples in specified grain-size fractions. Green points in the < 2 µm fraction represent data from this study. Blue points in other size fractions represent data from Jonell et al. (Reference Jonell, Li, Blusztajn, Giosan and Clift2018). Black crosses represent the average for each size fraction. This shows the more reliable reproducibility of Sr isotopic composition from replicate analyses in the < 2 µm fraction compared with other grain size fractions.
For Nd isotopes, the heterogeneity of the sediment is not as much of an issue for replication of results as for Sr isotopes (Jonell et al. Reference Jonell, Li, Blusztajn, Giosan and Clift2018). Reproducibility for Nd isotopes ranged from a maximum difference between replicates of 0.61 εNd units in bulk sediment to a minimum difference of 0.02 εNd units in the 63–125 μm fraction. The average difference between replicates of all size fractions was 0.27 εNd units. Here, only one clay-fraction sample was done in replicate for Nd, with a difference of 0.2 εNd units, comparable to that of the average difference between other size fractions.
4.b. Provenance or weathering signals?
Traditionally, K/Al ratios from bulk sediment have been used as a proxy for weathering intensity because strong chemical weathering leaches water-mobile elements, such as Na and K, relative to immobile elements such as Al and Ti (Thiry, Reference Thiry2000). This can be extended to the clay fraction because the clay minerals smectite and kaolinite, which are the products of intense chemical weathering, have lower K/Al ratios, while illite and chlorite, which result from physical erosion in dry conditions, have higher K/Al ratios (Derry & France-Lanord, Reference Derry and France-Lanord1996). With more intense chemical weathering, the K/Al ratio will therefore be lower in both the clay fraction and the bulk sediment. However, there are several complications concerning the use of K/Al to evaluate weathering. Similar to the isotopic composition of sediments, K/Al ratios could also be affected by sediment transport processes. At Sites U1456 and U1457, it has been shown during deposition of turbidites that segregation of minerals occurs depending on whether it is a channel-fill or overbank deposit, with the finer-grained bed tops enriched in K and other metals as they are associated with slow-settling phyllosilicates (Andò et al. Reference Andò, Aharonovich, Hahn, George, Clift and Garzanti2019). It should be noted that this is not necessarily the case in all depositional settings. A study of river sediments shows the opposite trend, with K tending to increase with grain size, while Al decreases (Lupker et al. Reference Lupker, France-Lanord, Lavé, Bouchez, Galy, Métivier, Gaillardet, Lartiges and Mugnier2011). However, in this study the clay K/Al ratio is not significantly correlated with grain size or bulk isotopic records, so we conclude that sediment transport does not seem to be strongly influencing the clay K/Al record.
Both K/Al ratios and clay mineralogy can also be significantly affected by changes in sediment provenance. Studies of clay mineralogy from Sites U1456 and U1457 over the last 3.5 Ma show variations in the proportions of smectite versus illite, which has been interpreted to be mostly controlled by changes in provenance, switching between Indus-dominated (illite-rich) and the more Deccan-like influence (smectite-rich) (Cai et al. Reference Cai, Xu, Clift, Khim, Lim, Yu, Kulhanek and Li2018; Chen et al. Reference Chen, Xu, Clift, Lim, Khim and Yu2019; Yu et al. Reference Yu, Colin, Wan, Saraswat, Song, Xu, Clift, Lu, Lyle, Kulhanek, Hahn, Tiwari, Mishra, Miska and Kumar2019). In this study, clay K/Al ratios have a weak relationship with clay 87Sr/86Sr (r = 0.41), and no significant relationship with clay εNd (r = 0.03; Fig. 4; online Supplementary Material SM1, Section S7). There is no significant relationship with bulk isotopic data. This lack of a strong relationship to provenance proxies suggests that K/Al is responding to another process, such as chemical weathering and not provenance.
When interpreting clay 87Sr/86Sr as a provenance proxy, it is important to consider other processes that can influence the measured composition, such as weathering, laterization and diagenesis (e.g. Goldstein & Jacobsen, Reference Goldstein and Jacobsen1988; Walter et al. Reference Walter, Hegner, Diekmann, Kuhn and Rutgers Van Der Loeff2000). If weathering and laterization processes were driving changes in clay K/Al and clay Sr isotopes, a negative relationship between records is expected; more intense chemical weathering would lower K/Al and increase 87Sr/86Sr due to the increased mobilization of Sr in silicate rocks, which typically have more radiogenic 87Sr/86Sr values (Derry & France-Lanord, Reference Derry and France-Lanord1996; Quade et al. Reference Quade, English and Decelles2003). Our long-term record indicates only a weak positive relationship (the opposite of what is expected if weathering is the control), which does not support chemical weathering as being a primary control on clay 87Sr/86Sr. To investigate the role of diagenesis, clay 87Sr/86Sr was compared with porewater 87Sr/86Sr (Carter et al. Reference Carter, Griffith, Scher, Pandey, Clift and Kulhanek2017), which shows there is no significant influence by diagenetic processes within the sedimentary column on the clay 87Sr/86Sr (online Supplementary Material SM1, Section S9). However, the dissolution of siliciclastic sediment within the methane generation zone does appear to increase the porewater 87Sr/86Sr values in Unit II with values as high as 0.71032, significantly above those of contemporaneous seawater.
Neodymium isotopes are not considered to be significantly altered during erosion and transport, weathering or diagenesis (Goldstein & Jacobsen, Reference Goldstein and Jacobsen1988; Goldstein & Hemming, Reference Goldstein and Hemming2003). Although there are biases due to grain size, these effects are sufficiently small that resolvable provenance-driven trends can be identified. Holocene Indus delta sediments are estimated to deviate on average no more than ±1.04 εNd as a result of mineralogy, grain-size distribution and analytical error (Jonell et al. Reference Jonell, Li, Blusztajn, Giosan and Clift2018).
Altogether, these data argue that the long-term records of clay Sr and Nd isotopes are all dominated by processes linked to changes in sediment provenance (and not chemical weathering), while clay K/Al is influenced by chemical weathering and/or clay mineralogy.
4.c. Long-term shifts in clay-fraction provenance
Using a two-step cluster analysis based on the clay Sr and Nd isotopic results, the data can be separated into three clusters (Fig. 8). Cluster analysis was performed using IBM SPSS Statistics 25 Software. Clusters were assigned based on similarity of the isotopic data in terms of a Euclidean distance function. Cluster 1 (blue) has less radiogenic Sr and more radiogenic Nd (more positive εNd), characteristic of greater influence from primitive igneous sources such as the Transhimalaya, Karakoram or the Deccan Traps. Cluster 2 (red) shows more influence from Himalayan units, such as the Greater Himalaya or Lesser Himalaya, with more radiogenic Sr and less radiogenic Nd (more negative εNd). Cluster 3 (green) is characterized by one Paleocene sample with extremely high εNd compared with the rest of the analysed samples and signifies drastically different provenance and/or alteration of the sediment in the lowermost unit (discussed in paragraphs below). There appears to be a mostly linear relationship for samples between clusters 1 and 2, explainable by a simple mixing of sediment from two basement sources. For samples that were not analysed for Nd isotopes, each sample was assigned to a cluster based solely on its Sr isotopic composition, using the range of Sr isotopic values assigned from the two-step cluster analysis. If 87Sr/86Sr is below 0.71383, the sample is assigned to cluster 1 and shown as light blue symbols (Fig. 9). If 87Sr/86Sr is over 0.71645, the sample is assigned to cluster 2 and shown as pink symbols. Any sample with 87Sr/86Sr between these two values cannot be unambiguously assigned to a cluster based solely on its Sr isotopic composition and is shown with purple symbols. It is clear in the record that the dominant influence from the two or more sources changes throughout the record (Fig. 9).

Fig. 8. Sr–Nd cross-plot. Coloured points indicate the clusters identified by a two-step cluster analysis of the data, with Cluster 1 in blue indicative of more Transhimalaya/Deccan influence and Cluster 2 in red indicative of more Himalayan influence. Site U1456 samples are represented by diamonds and Site U1457 samples by circles. The single green point shows data from Unit V, considered either Deccan-derived or diagenetically altered sediment. The light blue squares indicate the composition of modern river sediments, the Indus, Mahi, Narmada and Tapti Rivers (Goswami et al. Reference Goswami, Singh, Bhushan and Rai2012). For all points, the error bar associated with both Sr and Nd isotopic measurements (2 × standard error of the mean) is smaller than the data symbol. Figures modified from Clift et al. (Reference Clift, Zhou, Stockli and Blusztajn2019b).

Fig. 9. Records vs age with colours indicating the two clusters identified using the Sr and Nd isotopic results of the data. Cluster 1 (blue/light blue) indicative of more Transhimalayan/Deccan sources and Cluster 2 (red/pink) indicative of more Himalayan sources. Purple symbols indicate samples in which no cluster could be identified based solely on the Sr isotopic composition. Site U1456 samples represented by diamonds and Site U1457 by circles. (a) The average grain size of sediments. The solid black line is the 5-point running average. The background shows the proportion of clay (< 2 µm), silt (2–63 µm) and sand (> 63 µm) -sized grains. (b) K/Al ratio of the separated clay fraction. (c) 87Sr/86Sr of the separated clay fraction. (d) εNd of the separated clay fraction. (e) Δ87Sr/86Sr, the difference between clay and bulk Sr isotopic composition. (f) ΔεNd, the difference between clay and bulk Nd isotopic composition. The dark-grey shaded areas in (b–d) show the 5-point running standard deviation of the data, while the light-grey shaded areas in (b–f) show the error derived from replicate samples, which are a new digestion of the separated clay fraction for each sample (see Table 1). Orange zone outlines the location of the mass-transport deposit (MTD), the Nataraja slide, as defined by Dailey et al. (Reference Dailey, Clift, Kulhanek, Blusztajn, Routledge, Calvès, O’Sullivan, Jonell, Pandey, Andò, Coletti, Zhou, Li, Neubeck, Bendle, Aharonovich, Griffith, Gurumurthy, Hahn, Iwai, Khim, Kumar, Kumar, Liddy, Lu, Lyle, Mishra, Radhakrishna, Saraswat, Saxena, Scardia, Sharma, Singh, Steinke, Suzuki, Tauxe, Tiwari, Xu and Yu2020). Gaps in the 5-point running average highlight locations of unconformities in the records, which affect the running averages. The boxes on the left side show the associated geological epochs and the lithological units (Pandey et al. Reference Pandey, Clift, Kulhanek and Pandey2016). Green boxes in (c) and (d) show the range of values seen in the bulk sediment at these same sites over the last 800 ka (Khim et al. Reference Khim, Horikawa, Asahara, Kim and Ikehara2018; Yu et al. Reference Yu, Colin, Wan, Saraswat, Song, Xu, Clift, Lu, Lyle, Kulhanek, Hahn, Tiwari, Mishra, Miska and Kumar2019). The arrows on the right indicate climatic events mentioned in the text: Northern Hemisphere glaciation (NHG) strengthening and monsoon weakening.
Previous studies highlight the potential influence of the erosion of sediments from the Deccan Traps from peninsular India via the Tapti and Narmada Rivers to Sites U1456 and U1457 (Khim et al. Reference Khim, Horikawa, Asahara, Kim and Ikehara2018; Chen et al. Reference Chen, Xu, Clift, Lim, Khim and Yu2019; Clift et al. Reference Clift, Zhou, Stockli and Blusztajn2019b; Yu et al. Reference Yu, Colin, Wan, Saraswat, Song, Xu, Clift, Lu, Lyle, Kulhanek, Hahn, Tiwari, Mishra, Miska and Kumar2019) and show sediments with isotopic compositions similar to those seen in this study (online Supplementary Material SM1, Section S11). It is impossible to unambiguously attribute some proportion of the clay isotopic data to peninsular India because the Deccan Traps have isotopic characteristics similar to that of the Transhimalaya (e.g. Lightfoot & Hawkesworth, Reference Lightfoot and Hawkesworth1988; Khan et al. Reference Khan, Stern, Gribble and Windley1997; Rolland et al. Reference Rolland, Picard, Pecher, Lapierre, Bosch and Keller2002) (Fig. 8, online Supplementary Material SM1, Section S10). Additional data are needed to distinguish between sediment derived from the Transhimalaya (and transported by the Indus) or the Deccan Traps (from peninsular India), such as heavy-mineral analyses, which has been done at these sites over the Plio-Pleistocene section (Andò et al. Reference Andò, Aharonovich, Hahn, George, Clift and Garzanti2019). Andò et al. (Reference Andò, Aharonovich, Hahn, George, Clift and Garzanti2019) were able to establish that the sediment deposited in the turbidites from the Plio-Pleistocene sequence had a Himalayan origin. In order to differentiate between sediment sourced from the Transhimalaya or Deccan Traps, a similar method (or others) would need to be applied.
Clay mineral composition over the last 1.2 Ma from Site U1456 with varying proportions of smectite and illite+chlorite was previously interpreted in terms of sediment provenance, with more smectite originating from the Deccan Traps, and illite and chlorite originating from the Indus River (Chen et al. Reference Chen, Xu, Clift, Lim, Khim and Yu2019). However, it is also possible that these time periods of increased smectite sedimentation represent an increase in smectite production in the Indus basin, because the Transhimalayan units (batholiths) have similar isotopic composition and, being of partial volcanic origin, might be expected to produce more smectite. A record over the last 14 ka from the Indus River delta shows that the Indus River deposits up to 65% smectite during intervals of intense chemical weathering throughout periods of summer monsoon intensification (Alizai et al. Reference Alizai, Hillier, Clift, Giosan, Hurst, VanLaningham and Macklin2012). Clearly, smectite at Sites U1456 and U1457 could be originating from the Indus and is not solely attributed to the Deccan Traps.
It would be expected that periods of strong Deccan influence would be accompanied by similarly strong transitions in the type of sediment deposition, mineralogy and isotopic character. For Units I–III at Sites U1456 and U1457, the mineralogy of the bulk sediment requires derivation of material mainly from the Indus River (Pandey et al. Reference Pandey, Clift, Kulhanek and Pandey2016), although records produced over the past 3.6 Ma interpret varying proportions of two sources: the Indus River and the Deccan Traps (Cai et al. Reference Cai, Xu, Clift, Khim, Lim, Yu, Kulhanek and Li2018; Khim et al. Reference Khim, Horikawa, Asahara, Kim and Ikehara2018; Chen et al. Reference Chen, Xu, Clift, Lim, Khim and Yu2019; Yu et al. Reference Yu, Colin, Wan, Saraswat, Song, Xu, Clift, Lu, Lyle, Kulhanek, Hahn, Tiwari, Mishra, Miska and Kumar2019). The mass-transport deposit in Unit IV, the Nataraja Slide, shows clear mineralogical evidence of derivation from the western Indian margin (Pandey et al. Reference Pandey, Clift, Kulhanek and Pandey2016; Dailey et al. Reference Dailey, Clift, Kulhanek, Blusztajn, Routledge, Calvès, O’Sullivan, Jonell, Pandey, Andò, Coletti, Zhou, Li, Neubeck, Bendle, Aharonovich, Griffith, Gurumurthy, Hahn, Iwai, Khim, Kumar, Kumar, Liddy, Lu, Lyle, Mishra, Radhakrishna, Saraswat, Saxena, Scardia, Sharma, Singh, Steinke, Suzuki, Tauxe, Tiwari, Xu and Yu2020). This evidence is also accompanied by an εNd value of −2 in the bulk sediment, as well as the presence of vesicular basalt fragments (Dailey et al. Reference Dailey, Clift, Kulhanek, Blusztajn, Routledge, Calvès, O’Sullivan, Jonell, Pandey, Andò, Coletti, Zhou, Li, Neubeck, Bendle, Aharonovich, Griffith, Gurumurthy, Hahn, Iwai, Khim, Kumar, Kumar, Liddy, Lu, Lyle, Mishra, Radhakrishna, Saraswat, Saxena, Scardia, Sharma, Singh, Steinke, Suzuki, Tauxe, Tiwari, Xu and Yu2020). The Paleocene Unit V has extremely high clay εNd (c. 0) and low 87Sr/86Sr (c. 0.708870) (Cluster 3, Fig. 8; online Supplementary Material SM1, Section S11). The dramatic change in isotopic values suggests the sediment source was different during Paleocene time compared with the younger units. Because the depositional age pre-dates the India–Eurasia collision, and therefore the very existence of the Himalayas and the Indus River (Clift et al. Reference Clift, Shimizu, Layne, Blusztajn, Gaedicke, Schlüter, Clark and Amjad2001), Unit V is probably sourced entirely from peninsular India, or from weathering of the oceanic basement of Laxmi Basin and associated seamounts, as this unit directly overlies the basaltic basement. This unit is also characterized by almost 100% smectite (Dailey et al. Reference Dailey, Clift, Kulhanek, Blusztajn, Routledge, Calvès, O’Sullivan, Jonell, Pandey, Andò, Coletti, Zhou, Li, Neubeck, Bendle, Aharonovich, Griffith, Gurumurthy, Hahn, Iwai, Khim, Kumar, Kumar, Liddy, Lu, Lyle, Mishra, Radhakrishna, Saraswat, Saxena, Scardia, Sharma, Singh, Steinke, Suzuki, Tauxe, Tiwari, Xu and Yu2020) and extremely low clay K/Al (online Supplementary Material SM1, Section S11).
Because clay can be transported long distances by underwater currents, it is possible that the clays could be sourced from the Bay of Bengal, carried by surface currents around peninsular India during the winter monsoon or by deep currents during the summer monsoon (Shetye et al. Reference Shetye, Gouveia, Shenoi, Sundar, Michael, Almeida and Santanam1990; Chauhan & Gujar, Reference Chauhan and Gujar1996). However, previous work spanning the Holocene and late Pleistocene periods in this region has clearly shown that the Bay of Bengal sediments are not an important source of clay here (Kessarkar et al. Reference Kessarkar, Rao, Ahmad and Babu2003). The clay isotopic records can therefore be interpreted as sourced from the Transhimalaya and Karakoram or the Deccan Traps (Cluster 1), with periods of more influence from Himalayan units (Cluster 2; Fig. 8).
4.d. Link to Asian monsoon, climatic and tectonic events
Overall, there are clear and systematic variations in the Sr and Nd isotopic character of the clay fraction from the two sites (Fig. 9). These variations appear to correspond to periods of climatic change in the region: (1) the well-recognized, but highly debated climatic transition at 8–7 Ma (Clift, Reference Clift2017); and (2) the onset of Northern Hemisphere glaciation at c. 3.5 Ma.
4.d.1. Ties to the South Asian monsoon at 8–7 Ma
Many studies recognize 8–7 Ma as a time of a marked transition in both climatic and oceanic productivity proxies, which record a change in the Asian monsoon impacting the Indian subcontinent. This was a time of strengthening of wind-driven upwelling in the western Arabian Sea (Kroon et al. Reference Kroon, Steens, Troelstra, Prell and Niitsuma1991; Prell et al. Reference Prell, Murray, Clemens, Anderson, Duncan and Al1992; Gupta et al. Reference Gupta, Yuvaraja, Prakasam, Clemens and Velu2015), stronger winds in the Maldives (Betzler et al. Reference Betzler, Eberli, Kroon, Wright, Swart, Nath, Alvarez-Zarakian, Alonso-García, Bialik, Blätter, Guo, Haffen, Horozal, Inoue, Jovane, Lanci, Laya, Mee, Lüdmann, Nakakuni, Niino, Petruny, Pratiwi, Reijmer, Reolid, Slagle, Sloss, Su, Yao and Young2016), a transition from C3- to C4-dominance in foreland vegetation (Quade et al. Reference Quade, Cerling and Bowman1989; Singh et al. Reference Singh, Parkash, Awasthi and Kumar2011) and a decrease of chemical weathering in Asia (Clift et al. Reference Clift, Hodges, Heslop, Hannigan, Van Long and Calves2008, Reference Clift, Kulhanek, Zhou, Bowen, Vincent, Lyle and Hahn2019a; Dettman et al. Reference Dettman, Kohn, Quade, Ryerson, Ojha and Hamidullah2001). For the present-day monsoon, both wind and rain are associated with a strong summer monsoon. However, for this time period the clear disagreement between wind-based and rain-related erosion and weathering proxies (e.g. strengthening of wind-driven upwelling, but a decrease in chemical weathering) has led to markedly different interpretations of monsoon strength at this time (Clift, Reference Clift2017).
New records of chemical weathering, erosion, and relative humidity at Site U1456 show a shift toward more arid conditions beginning after 7.7 Ma, associated with weaker chemical alteration and reduced coarse clastic flux (Clift et al. Reference Clift, Kulhanek, Zhou, Bowen, Vincent, Lyle and Hahn2019a). This transition is clearly present in the records produced from this study (Fig. 9), showing a trend towards more negative εNd and higher 87Sr/86Sr following emplacement of the mass-transport deposit, a brief period of more positive εNd and lower 87Sr/86Sr at c. 7.3 Ma, followed by a transition back to more negative εNd and higher 87Sr/86Sr. This would suggest an overall increase over the time period 9–5 Ma to a more dominantly Himalayan source, with a potential brief increase in flux from Transhimalaya/Deccan sources at c. 7.0 Ma.
We interpret the provenance change during 9–5 Ma in our clay record to generally indicate more Himalayan erosion, which could signify weakening of the monsoon, that is, a decrease of rainfall penetration into higher orographic areas of the Transhimalaya. For example, during normal years in the present day, monsoonal rainfall dominates erosion in low- to medium-elevation areas; however, when the monsoon increases in strength, rainfall patterns conquer orographic barriers and the rain penetrates high into the NW Himalayas at elevations in excess of 3 km (Bookhagen et al. Reference Bookhagen, Thiede and Strecker2005).
The brief excursion to more positive εNd and lower 87Sr/86Sr within this overall trend at c. 7.3 Ma is more challenging to interpret because more evidence is needed to constrain whether the change signifies more Transhimalaya/Karakoram influence or Deccan Trap influence over this time interval.
If this provenance change at c. 7.0 Ma in our clay record indicates more Transhimalaya/Karakoram erosion, it might imply strengthening of the monsoon, that is, an increase in rainfall penetration into higher orographic areas of the Transhimalaya. However, this is in contrast to conclusions drawn by previous results from the region, which indicate drying over this time period, a decrease in erosion and monsoon weakening (Clift, Reference Clift2006; Clift et al. Reference Clift, Kulhanek, Zhou, Bowen, Vincent, Lyle and Hahn2019a, b).
Instead, we suggest that the excursion is caused by a shift of the summer monsoon part of the InterTropical Convergence Zone (ITCZ) towards the south, which could induce more precipitation over peninsular India. The shift would lead to a higher proportion of eroded sediments from the Deccan Traps entering the eastern Arabian Sea. This is seen in records from the Quaternary Period (Stoll et al. Reference Stoll, Vance and Arevalos2007; Kotlia et al. Reference Kotlia, Sanwal, Phartiyal, Joshi, Trivedi and Sharma2010). During glacial times the monsoon becomes weaker and the ITCZ shifted southwards (Stoll et al. Reference Stoll, Vance and Arevalos2007). Additionally, the difference between clay 87Sr/86Sr and bulk 87Sr/86Sr (Δ87Sr/86Sr) and clay εNd and bulk εNd (ΔεNd) shows that, on average, the clay sediment tends to be less radiogenic with respect to Sr isotopes (−Δ87Sr/86Sr), but more radiogenic with respect to Nd isotopes (+ΔεNd) (Fig. 9e, f). This is true over most of the record with the exception of this period at c. 7.3 Ma, where the ratios are more similar and the relationship even reverses to +Δ87Sr/86Sr and −ΔεNd. This could indicate that transport processes causing a difference between the clay and bulk isotopic signals become less important during this event. We hypothesize that if the ITCZ shifted southwards at that time, the sediments eroded from the Deccan Plateau would have had a significantly shorter distance to travel (via the Tapti or Narmada River as opposed to the Indus River) and there was therefore less size sorting as the sediment was deposited, leading to a stronger agreement between the clay and bulk provenance signals. We suggest that Δ87Sr/86Sr and ΔεNd could be used to reconstruct how sediment transport processes change through time in deep-sea sediment. Future studies are required to make any strong conclusions, such as measuring Sr and Nd isotopes from the bulk sediment and clay fraction along a transect away from a large river mouth over time periods of known changes in precipitation or monsoon intensity, such as glacial–interglacial cycles.
4.d.2. Evidence for control of sediment provenance by glacial–interglacial cycles
The overall variability of the clay isotopic composition increases dramatically at c. 3.5 Ma, probably reflecting the link between monsoon strength and glacial–interglacial cycles following the onset of Northern Hemisphere glaciation (e.g. An et al. Reference An, Clemens, Shen, Qiang, Jin, Sun, Prell, Luo, Wang, Xu, Cai, Zhou, Liu, Liu, Shi, Yan, Xiao, Chang, Wu, Ai and Lu2011; Kim et al. Reference Kim, Khim, Ikehara and Lee2018). Shorter timescale fluctuations occurred over at least the last 800 ka where 87Sr/86Sr and εNd are shown to vary quasi-cyclically (Khim et al. Reference Khim, Horikawa, Asahara, Kim and Ikehara2018) and are interpreted to be controlled by sediment transport dominated by sea-level variations and possibly the Indian summer monsoon (Yu et al. Reference Yu, Colin, Wan, Saraswat, Song, Xu, Clift, Lu, Lyle, Kulhanek, Hahn, Tiwari, Mishra, Miska and Kumar2019). The records here suggest that the clay fraction is behaving similarly, with large fluctuations in both 87Sr/86Sr and εNd that are similar in magnitude to those of the bulk sediment over these glacial–interglacial cycles (Fig. 9c, d). However, the resolution of our record is not sufficient to resolve such cycles.
It is apparent in these new clay records that the climatic evolution of the western Himalayan region plays an active role in the erosion and weathering of sediments reaching the Indus Fan. Additionally, sediment transport processes could be influenced by these same processes and are important to consider when using sediments at deep ocean sites as proxy signals. This consideration will not only help the understanding of how a siliciclastic sediment record may be affected by transport, but may also reveal information about what is affecting the changes in sediment transport, which might be expected to be at least partially controlled by climate.
5. Conclusions
Overall, sediment transport processes appear to be affecting the sediment’s isotopic compositional records from IODP Sites U1456 and U1457. It is important to consider these effects when reconstructing and interpreting proxy data from deep ocean basins such as those sampled at Sites U1456 and U1457. Correlations between average grain size of sediments and the isotopic composition of the bulk sediment show the expected relationship when sediment transport processes are playing a role, that is, higher 87Sr/86Sr and lower εNd during periods when deposition involved increased grain size. This relationship, although still present, is not as strong in the clay-fraction isotopic records.
The differences between clay and bulk 87Sr/86Sr and εNd indicate more radiogenic Sr and less radiogenic Nd in the clay fraction over most of the record, although this relationship changes at c. 7.0 Ma. The magnitude of the difference correlates strongly with bulk isotopic records, but is not significantly correlated to clay-fraction isotopic records. This suggests that it is the heterogeneity of the bulk sediment that drives the differences between the clay and bulk sediment, which is most likely controlled by sediment transport processes.
Reproducibility of 87Sr/86Sr from replicate samples on the clay fraction is much better than that of bulk sediment and other size fractions. This indicates that the clay fraction is less isotopically heterogeneous. If sediment transport processes play a significant role in a sedimentary archive, Sr isotopic analysis of the clay fraction could provide more reliable provenance information, if it can be established that the clay fraction is not carried by bottom-water currents from another source distinctive from the coarser fraction.
The interpretation of the records presented here reveals changes in provenance of the Indus Fan. From 9 Ma to the present day, the clay Sr and Nd isotopes form a linear array between primitive igneous sources, such as Transhimalaya, Karakoram or the Deccan Plateau and Himalaya-like basement sources, suggesting a simple mixing between the two compositions. Clear variability occurs in the clay-fraction records over the well-established climatic transition at 8–7 Ma, which is characterized in our record by an overall decrease in εNd and an increase in 87Sr/86Sr values, with a brief excursion of more positive εNd and lower 87Sr/86Sr. This suggests that the provenance of sediments at this time was changing, with more Himalayan erosion relative to the Transhimalaya/Deccan Traps, correlating with a weaker monsoon. The overall variability of the clay-fraction records appears to increase in both magnitude and timing beginning at c. 3.5 Ma. This indicates a strong link between monsoon strength and glacial–interglacial cycles following the onset of Northern Hemisphere glaciation, as seen in other studies.
These new records highlight the potential for proxy records from the clay fraction to not only provide provenance and weathering data that may be related to climate, but also information on the sediment transport processes active during deposition at deep ocean sites. Future work investigating Sr and Nd isotopes in the clay fraction and bulk sediment along a transect away from a large river mouth could reveal important information regarding how transport processes change in response to climate, and how these are reflected in the isotopic signals. Being able to understand these processes is important in resolving differences in isotopic composition and confidently attributing changes in distal isotopic records to changes in provenance and/or weathering.
Supplementary material
To view supplementary material for this article, please visit https://doi.org/10.1017/S0016756820000394
Acknowledgements
This research used samples and data provided by the International Ocean Discovery Program (IODP). Funding for this research was provided by a US Science Support Program Post-Expedition Activity Award to EM Griffith (NSF OCE 1450528, Subaward No. 61(GG009393)). We thank Cameron Zimny for his assistance in preparing samples and acquiring data for grain-size analysis. We also thank the School of Earth Sciences and the Graduate School at The Ohio State University for their support of SC Carter during this work and Friends of Orton Hall for their support for travel to present this research at conferences. PD Clift thanks the support of the Charles T McCord Jr chair in petroleum geology at LSU. Lastly, the authors thank Stephen Hubbard, Sergio Andó, Eduardo Garzanti and anonymous reviewers of previous versions of this manuscript for comments, which helped to improve the manuscript.
Declaration of Interest
None.


