1. Introduction
Primary stable isotope signatures retained in Phanerozoic carbonates (e.g. Veizer et al. Reference Veizer, Ala, Azmy, Bruckschen, Bruhn, Buhl, Carden, Diener, Ebneth, Goddris, Jasper, Korte, Pawellek, Podlaha and Strauss1999) have become increasingly used as a potential tool for refining global stratigraphic correlations, particularly those of the Early Palaeozoic that have poor biostratigraphic resolution or biostratigraphic correlation problems. Primary/near-primary carbon-isotope variations associated with eustasy allow the construction of reliable profiles for correlating sedimentary sequences of different depositional settings within the same basin and from different palaeocontinents (e.g. Jing et al. Reference Jing, Deng, Zhao, Lu and Zhang2008; Miller et al. Reference Miller, Evans, Freeman, Ripperdan and Taylor2011, Reference Miller, Repetski, Nicoll, Nowlan and Ethington2014; Azomani et al. Reference Azomani, Azmy, Blamey, Brand and Al-Aasm2013; Terfelt, Eriksson & Schmitz, Reference Terfelt, Eriksson and Schmitz2014). The eustatic changes along the eastern Laurentian passive margin during the latest Cambrian influenced the redox conditions of the depositional environment and accordingly primary organic productivity along with the C-isotope compositions of marine carbonates (Landing, Reference Landing and Landing2007, Reference Landing2012; Landing, Westrop & Miller, Reference Landing, Westrop, Miller, Fatka and Budil2010; Miller et al. Reference Miller, Evans, Freeman, Ripperdan and Taylor2011, Reference Miller, Repetski, Nicoll, Nowlan and Ethington2014; Azmy et al. Reference Azmy, Stouge, Brand, Bagnoli and Riiperdan2014, Reference Azmy, Kendall, Brand, Stouge and Gordon2015; Terfelt, Eriksson & Stouge, Reference Terfelt, Eriksson and Schmitz2014).
The evaluation of preservation of the δ13C signatures, in earlier studies, was mainly based on their insignificant correlation with their δ18O counterparts, but elemental proxies were rarely discussed. Therefore, the main objectives of the current study are to evaluate in detail the petrographic and geochemical preservation of the carbonates of the Martin Point section (western Newfoundland, Canada) that spans the uppermost (Furongian) Cambrian and to reconstruct a reliable primary C-isotope profile that allows recognition of the stratigraphic levels of the HERB event (Hellnmaria – Red Tops Boundary; also called TOCE (Top Of Cambrian Excursion)). This will also enhance the global correlation of the uppermost Cambrian sequences on eastern Laurentia and beyond.
2. Geological setting
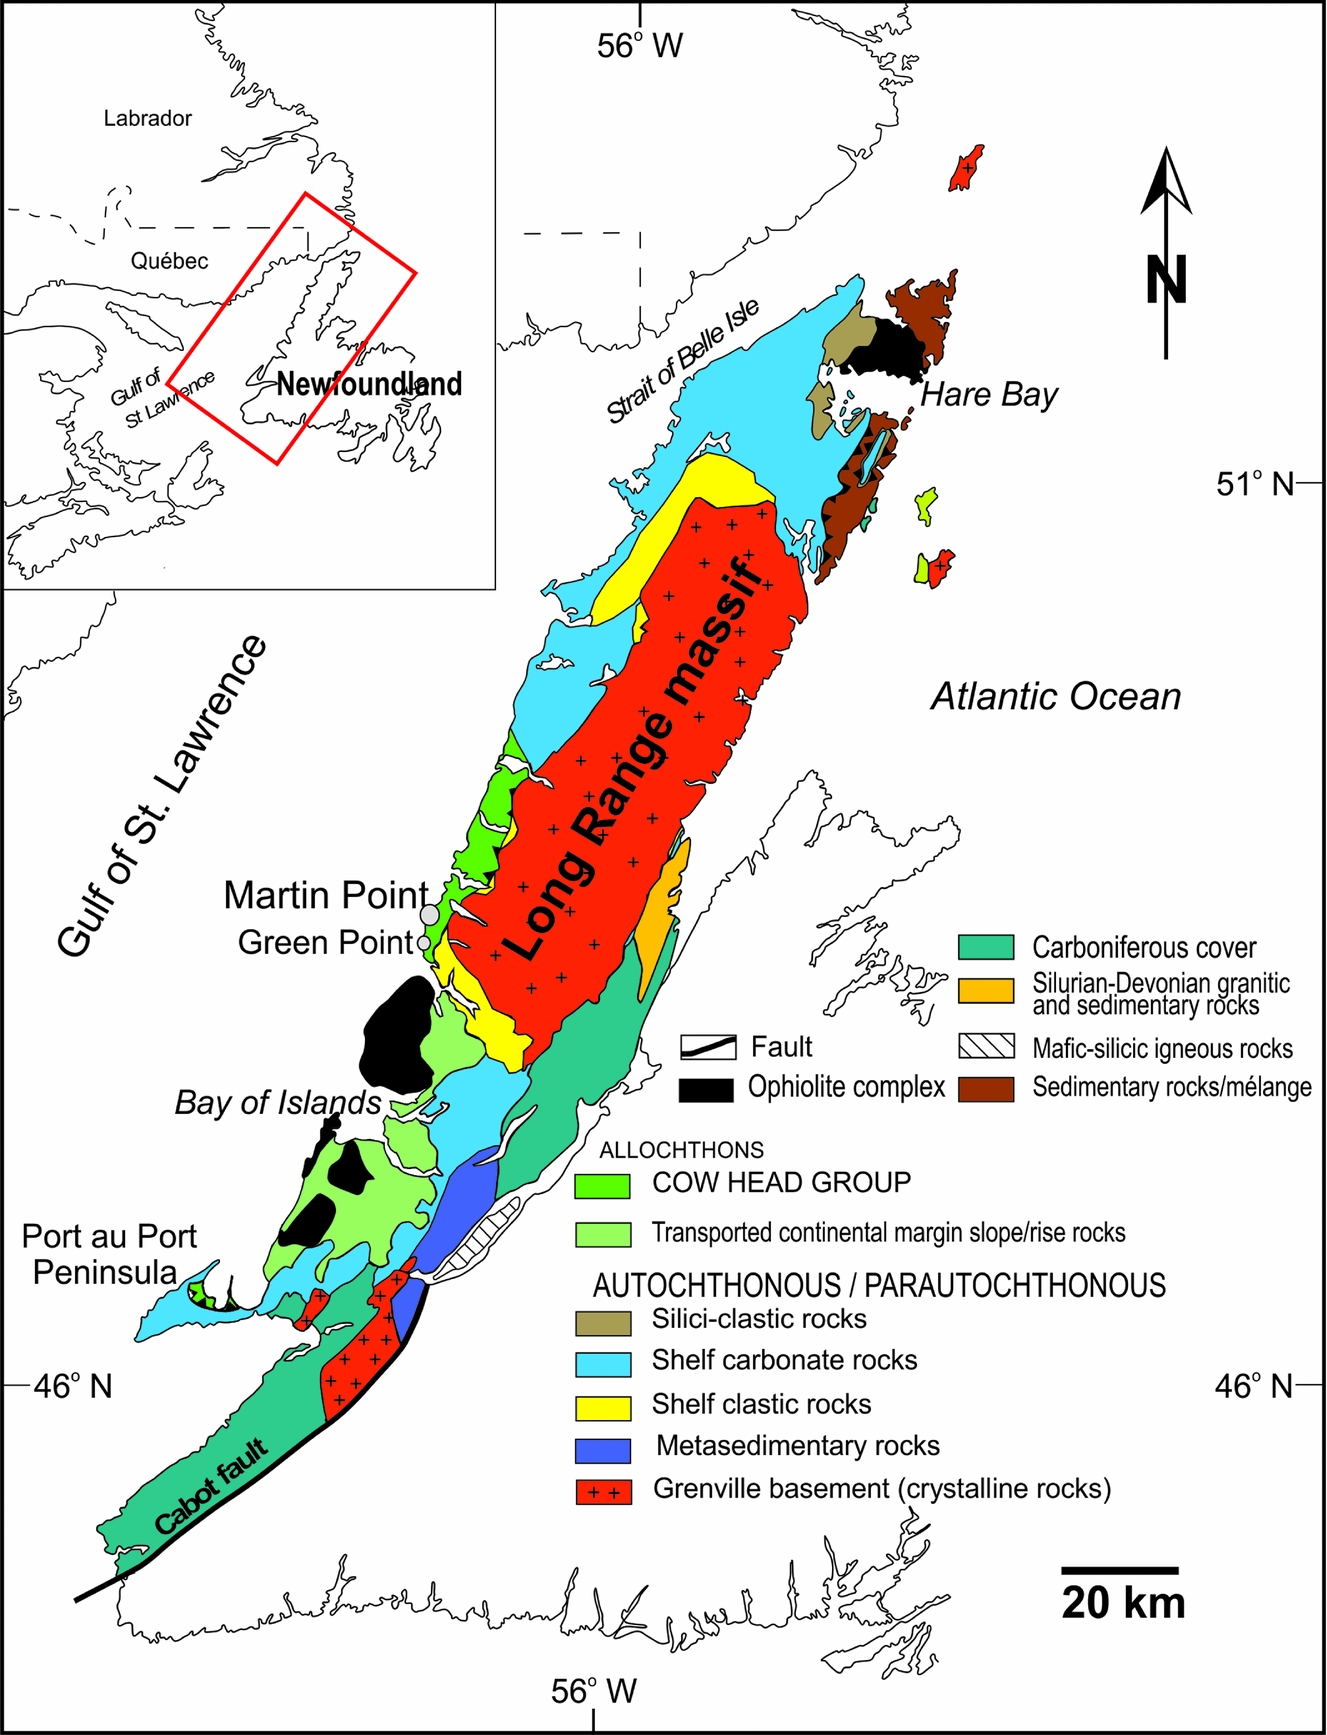
Palaeozoic sedimentary rocks of western Newfoundland (Fig. 1) were deposited on the eastern (palaeosouthern) Laurentian margin. The Laurentian plate developed by active rifting around 570–550 Ma (e.g. Cawood, McCausland & Dunning, Reference Cawood, McCausland and Dunning2001; Hibbard, Van Staal & Rankin, Reference Hibbard, Van Staal and Rankin2007), and a pre-platform shelf formed and was eventually covered by clastic sediments (James et al. Reference James, Stevens, Barnes, Knight, Crevello, Wilson, Sarg and Read1989). A major transgression flooded the Laurentian platform margin and resulted in the accumulation of thick carbonate deposits, particularly during the Late Cambrian (Wilson et al. Reference Wilson, Medlock, Fritz, Canter, Geesaman, Candelaria and Reed1992; Landing, Reference Landing and Landing2007, Reference Landing2012; Lavoie et al. Reference Lavoie, Desrochers, Dix, Knight, Hersi, Derby, Fritz, Longcare, Morgan and Sternbach2012).

Figure 1. Map of the study area showing the surface geology and location of the Martin Point section (49° 40′ 51″ N; 57° 57′ 36″ W) in western Newfoundland, Canada (modified from Cooper, Nowlan & Williams, Reference Cooper, Nowlan and Williams2001).
3. Stratigraphy
3.a. Lithostratigraphy
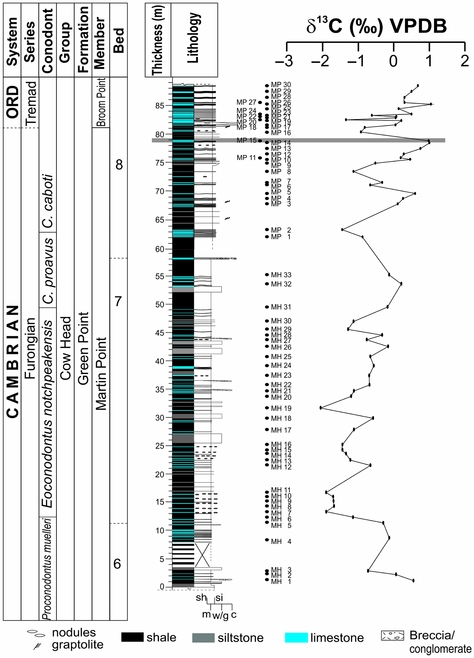
The lithostratigraphy of the investigated interval of the Martin Point section, which is part of the Green Point Formation of the Cow Head Group (Fig. 2), has been studied and discussed in detail by James & Stevens (Reference James and Stevens1986), and is therefore only summarized here. It consists of the uppermost part of the Cambrian Martin Point Member and lowermost part of the overlying Ordovician Broom Point Member, which are generally composed of rhythmites of dark-grey to black fissile shale alternating with thin (~1 cm-thick) interbeds of ribbon limestone (micritic to near-micritic) that are very fine-grained (James & Stevens, Reference James and Stevens1986). Siltstone interbeds (up to 1 cm thick) may co-occur with shale, and the limestone interbeds vary from isolated and thin to up to 20 cm thick. Conglomerate beds, deposited by turbidites (James & Stevens, Reference James and Stevens1986), occur in both members and contain blocks of shallow water carbonates that were transported into deep-water facies along the slope of the Laurentian margin (James & Stevens, Reference James and Stevens1986). The overlying Lower and Middle Ordovician strata are composed of shale with occasional limestone horizons. These distal shales are mostly red, indicating accumulation under oxidizing conditions above a postulated oxygen minimum layer or continental red muds that were shed in the basin and rapidly accumulated (James & Stevens, Reference James and Stevens1986).

Figure 2. Stratigraphic framework of the investigated Martin Point section in western Newfoundland, Canada, showing bed number and detailed measured positions of investigated samples and conodont zonation scheme (Barnes, Reference Barnes1988). The solid grey line marks the approximate level correlated with the geochemical anomaly documented by Azmy et al. (Reference Azmy, Stouge, Brand, Bagnoli and Riiperdan2014, Reference Azmy, Kendall, Brand, Stouge and Gordon2015), which revealed distinct geochemical changes across the Cambrian‒Ordovician boundary in the GSSP section.
3.b. Biostratigraphy
The investigated interval spans, from bottom to top, the Proconodontus muelleri, Eoconodontus notchpeakensis, Cordylodus proavus and Cordylodus caboti conodont zones (Furongian, uppermost Cambrian) (James & Stevens, Reference James and Stevens1986; Barnes, Reference Barnes1988; Miller et al. Reference Miller, Evans, Freeman, Ripperdan and Taylor2011; Stouge, Bagnoli & Azmy, Reference Stouge, Bagnoli, Azmy, Laurie, Kruse, Garcia-Bellido and Holmes2016).
Rooted benthic graptolites appear in the lower part of the succession and extend upwards, where planktonic graptolites (Rhabdinopora flabelliformis subspecies) appear just above the Cambrian–Ordovician boundary. The top of the Broom Point Member contains a prolific assemblage of graptolites of early Tremadocian age (James & Stevens, Reference James and Stevens1986; Williams & Stevens, Reference Williams and Stevens1991).
4. Material and methodology
Sixty-four closely spaced samples (sampling intervals as small as 10 cm; Appendix and Fig. 2) were collected from the Martin Point section (49° 40′ 51″ N, 57° 57′ 36″ W), western Newfoundland (Fig. 1). Samples were taken from the most micritic lime mudstones to avoid allochthonous clasts. Thin-sections of samples were petrographically examined with a polarizing microscope and stained with Alizarin Red – S and potassium ferricyanide solutions (Dickson, Reference Dickson1966). Cathodoluminescence (CL) observations were performed using a Technosyn 8200 MKII cold cathode instrument operated at 8 kV accelerating voltage and 0.7 mA current.
A mirror-image slab of each thin section was also prepared and polished for microsampling. These polished slabs were washed with deionized water and dried overnight at 50° C prior to isolating the finest-grained lime mudstone free of secondary cements and other contaminants. Due to the possible heterogeneity in geochemical composition of texturally distinct carbonate phases in whole-rock samples, and in order to avoid silicate-rich and secondary carbonate cements and veins, microsamples were drilled from the finest-grained micritic material under a binocular microscope. Approximately 10 mg of carbonate was microsampled from the cleaned slabs using a low-speed microdrill.
For C- and O-isotope analyses, about 220 μg of powder sample was reacted in an inert atmosphere with ultrapure concentrated (100 %) orthophosphoric acid at 70 °C in a Thermo Finnigan GasBench II. The liberated CO2 was automatically delivered to a Thermo Finnigan DELTA V plus isotope ratio mass spectrometer in a stream of helium, where the gas was ionized and measured for isotope ratios. Uncertainties of better than 0.1 ‰ (2σ) for the analyses were determined by repeated measurements of NBS-19 (δ18O = –2.20 ‰ and δ13C = +1.95 ‰ vs VPDB) and L-SVECS (δ18O = –26.64 ‰ and δ13C = –46.48 ‰ vs VPDB).
For elemental analyses, a subset of sample powder (~10 mg each) was digested in 2 % (v/v) HNO3 and analysed for major and trace elements using an Elan DRC II ICP-MS (inductively coupled plasma mass spectrometer) (Perkin Elmer SCIEX) at Memorial University of Newfoundland. The relative uncertainties of these measurements are less than 5 %, and results are normalized to a 100 % carbonate basis (e.g. Azmy et al. Reference Azmy, Stouge, Brand, Bagnoli and Riiperdan2014).
5. Results
Petrographic examinations indicate that the sampled carbonates are dominantly lime mudstones, which have retained micritic to near-micritic (<4 to 10 μm) texture and appear dull under cathodoluminescence (Fig. 3a, b).
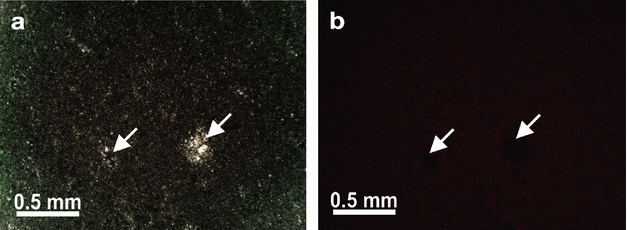
Figure 3. Photomicrographs of the investigated carbonates showing (a) micritic lime mudstones from Martin Point section micrites (sample MP28) and (b) CL image of (a). Arrows point at late cement in microvugs that appears non-luminescent.
The geochemical attributes of the investigated Martin Point carbonates are described in detail in the Appendix, and their statistics are summarized in Table 1. Their mean Sr (324 ± 192 ppm) is slightly higher than their counterparts of the GSSP (global boundary stratotype section and point) carbonates at Green Point (Table 1; Azmy et al. Reference Azmy, Stouge, Brand, Bagnoli and Riiperdan2014) although their Mn content (360 ± 160 ppm) is slightly lower (Table 1) and the Sr and Mn values are poorly correlated (R 2 = 0.1). The Sr contents are also poorly correlated with their δ13C counterparts (Fig. 4a; R 2 = 0.0006) and similarly the Mn contents (R 2 = 0.03; Appendix). The mean δ13C and δ18O values of the Martin Point carbonates (‒0.5 ± 0.8 and ‒7.1 ± 0.3 ‰ VPDB, respectively; Table 1) are comparable to their counterparts of the GSSP section in Green Point although they might be slightly enriched (Table 1; Azmy et al. Reference Azmy, Stouge, Brand, Bagnoli and Riiperdan2014) and they fall within the documented range of Upper Cambrian well-preserved marine carbonates (Veizer et al. Reference Veizer, Ala, Azmy, Bruckschen, Bruhn, Buhl, Carden, Diener, Ebneth, Goddris, Jasper, Korte, Pawellek, Podlaha and Strauss1999; Fig. 4b). The δ13C profile exhibits a broad negative excursion, consisting of subpeaks, that reaches its most negative value at the base of bed 7 and the base of the E. notchpeakensis Zone (Fig. 5). This peak negative value correlates with distinct shifts on the Th/U and Ni profiles (Fig. 5) that are reliable redox and bioproductivity proxies (e.g. Wignall & Twitchett, Reference Wignall and Twitchett1996; Śliwiński, Whalen & Day, Reference Śliwiński, Whalen and Day2010). The Th/U values range from 0.1 to 5.1 (1.1 ± 1.3; Appendix) and those of Ni from 1.4 to 8.5 ppm (3.5 ± 1.8 ppm; Appendix). Both of these proxies have insignificant correlation with their Sr counterparts (R 2 ≤ 0.03). There is also an upper negative δ13C excursion that consists of sharp subpeaks and correlates with the Cambrian‒Ordovician Boundary.
Table 1. Statistics of the geochemical compositions of the investigated Martin Point carbonates.The Green Point data (from Azmy et al. Reference Azmy, Stouge, Brand, Bagnoli and Riiperdan2014) represent the Cambrian‒Ordovician boundary interval (GSSP)


Figure 4. Scatter diagrams showing correlations of (a) Sr with δ13C and (b) δ18O with δ13C for the micritic lime mudstones from the Martin Point section. The rectangle in (b) shows the composition of well-preserved uppermost Cambrian and lowermost Ordovician marine carbonates (Veizer et al. Reference Veizer, Ala, Azmy, Bruckschen, Bruhn, Buhl, Carden, Diener, Ebneth, Goddris, Jasper, Korte, Pawellek, Podlaha and Strauss1999).
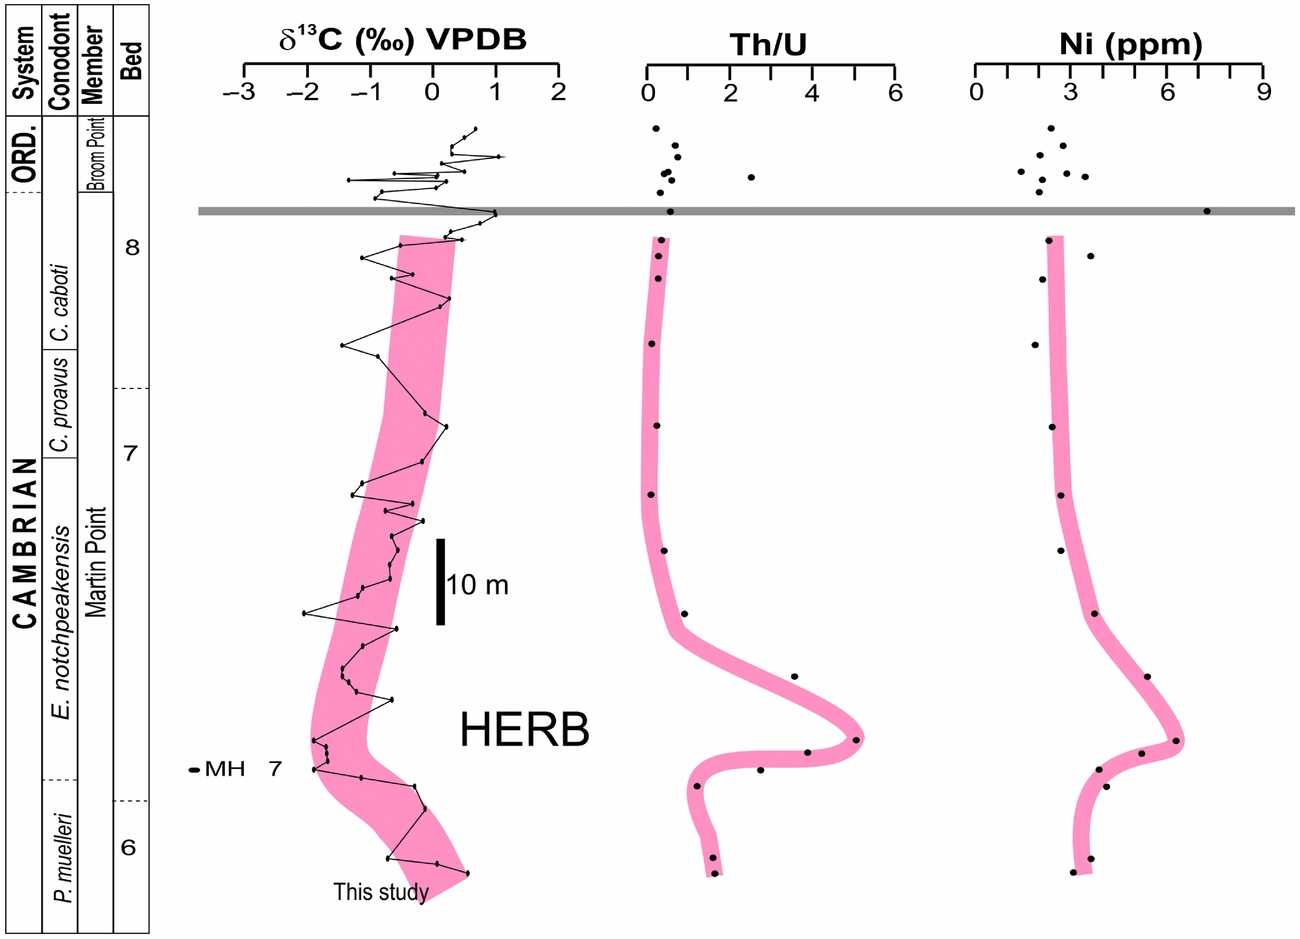
Figure 5. Carbon-isotope, Th/U and Ni profiles spanning the uppermost Cambrian and lowermost Ordovician lime mudstones at Martin Point. The red lines show the general first-order trends of the HERB geochemical profiles of the investigated section at Martin Point. The solid grey line as in Figure 2.
6. Discussion
Carbon-isotope chemostratigraphy is mainly based on the distinctive variations in the δ13Ccarb profile, which may reflect environmental and/or diagenetic perturbations (e.g. Veizer et al. Reference Veizer, Ala, Azmy, Bruckschen, Bruhn, Buhl, Carden, Diener, Ebneth, Goddris, Jasper, Korte, Pawellek, Podlaha and Strauss1999; Halverson et al. Reference Halverson, Hoffman, Schrag, Maloof and Rice2005). In ancient sediments, particularly those of the Palaeozoic, it is almost impossible for those sediments to remain entirely unaltered by diagenetic fluids through their burial history. However, the degree of alteration varies depending on the water/rock interaction ratio and the strength of reset of the retained proxy signal (Veizer, Reference Veizer, Arthur, Anderson, Kaplan, Veizer and Land1983; Banner & Hanson, Reference Banner and Hanson1990). Thus, restricted diagenesis at near-closed system may not significantly alter some of the proxies and they may provide near-primary signatures that can be utilized to reconstruct the depositional marine settings. Therefore, evaluation of the degree of preservation of the retained (primary or near-primary) isotopic and elemental geochemical signatures is a cornerstone for the reconstruction of a reliable C-isotope profile that can be utilized for high-resolution chemostratigraphic correlations within the same sedimentary basin and also on a global basis.
6.a. Evaluation of sample preservation
The investigated carbonates were examined by multiscreening petrographic and geochemical techniques to evaluate their degree of preservation. The examined interval of the Green Point Formation at Martin Point section spans the Late Cambrian to Early Ordovician and is dominated by lime mudstones that show insignificant recrystallization (Fig. 3a). They retained original sedimentary fabrics and a micritic to near-micritic grain size, thus suggesting a high degree of textural preservation. They also exhibit dull luminescence under a cathodoluminoscope (Fig. 3b) compared with the nearly non-luminescent late cement in microvugs likely due to enrichment of Fe in those cements. Luminescence in carbonates is mainly activated by high concentrations of Mn and quenched by high concentrations of Fe (Machel & Burton, Reference Machel, Burton, Barker and Kopp1991). Dull luminescence, in many cases, indicates relative preservation of primary geochemical signatures although diagenetic carbonates, such as late cements, might still exhibit no luminescence due to high Fe content (Rush & Chafetz, Reference Rush and Chafetz1990). Therefore, cathodoluminescence should be taken with caution and has to be complemented by additional screening tests (Brand et al. Reference Brand, Logan, Bitner, Griesshaber, Azmy and Buhl2011).
Diagenetic alteration of carbonates leads to depletion in Sr content and δ18O values but enrichment in Mn (Veizer, Reference Veizer, Arthur, Anderson, Kaplan, Veizer and Land1983). In an oxic shallow-water environment, the ocean water has low Mn concentrations, but the deeper water of the slope settings (dysoxic or less oxic) is expected to have at least slightly higher Mn. Microbial lime mudstones have been documented in Palaeozoic slope carbonates at depths down to 300 m (e.g. Della Porta et al. Reference Della Porta, Kenter, Bahamonde, Immenhauser and Villa2003; Bahamonde, Merino-Tomé & Heredia, Reference Bahamonde, Merino-Tomé and Heredia2007). If so, the investigated Martin Point lime mudstones might have had contributions from carbonates that precipitated in situ through microbial mediation (cf. George, Reference George1999; Della Porta et al. Reference Della Porta, Kenter, Bahamonde, Immenhauser and Villa2003; Bahamonde, Merino-Tomé & Heredia, Reference Bahamonde, Merino-Tomé and Heredia2007; Bartley et al. Reference Bartley, Kah, Frank and Lyons2015) under dysoxic conditions where Mn2+ is more available in the seawater and they may therefore have incorporated higher Mn contents (360 ± 160 ppm; Table 1) than those of shallow water environment (≤100 ppm; Veizer, Reference Veizer, Arthur, Anderson, Kaplan, Veizer and Land1983). This suggests that their enriched Mn contents are not entirely caused by diagenesis, which agrees with their relatively high Sr contents (up to 980 ppm; Table 1) and with the consistent clean lime mudstone interbeds that lack clastic inclusions (cf. James & Stevens, Reference James and Stevens1986; Coniglio & James, Reference Coniglio and James1990; Li et al. Reference Li, Jenkyns, Wang, Hu, Chen, Wei, Huang and Cui2006). Also, the Mn contents of the investigated carbonates still have very poor correlation with their δ13C values (R 2 = 0.03; Appendix), which argues against significant alteration of the δ13C signatures.
On the other hand, the Sr contents of the Martin Point carbonates exhibit insignificant correlation (R 2 = 0.0002; Fig. 4a) with their δ13C counterparts (e.g. Derry, Kaufman & Jacobsen, Reference Derry, Kaufman and Jacobsen1992; Veizer et al. Reference Veizer, Ala, Azmy, Bruckschen, Bruhn, Buhl, Carden, Diener, Ebneth, Goddris, Jasper, Korte, Pawellek, Podlaha and Strauss1999; Halverson et al. Reference Halverson, Hoffman, Schrag, Maloof and Rice2005), which supports the preservation of at least near-primary δ13C values. Also, the poor correlation between the Sr and the δ18O values (R 2 = 0.02; Appendix) suggests that the reset of the δ18O signatures was restricted, which is consistent with the fact that the isotopic composition of the investigated carbonates falls within that documented for the best-preserved marine carbonates of the same age (Fig. 4b; Veizer et al. Reference Veizer, Ala, Azmy, Bruckschen, Bruhn, Buhl, Carden, Diener, Ebneth, Goddris, Jasper, Korte, Pawellek, Podlaha and Strauss1999). This is because the impact of diagenesis on the δ13C signatures of carbonates is relatively less than that on their δ18O counterparts since the diagenetic fluids, in many cases, do not contain enough CO2 to reset the C-isotope composition, which leads to the preservation of near-primary δ13C signatures of the ancient carbonates. Therefore, the reset of the δ13C signature requires a high water/rock interaction ratio and is associated with significant recrystallization and increase in crystal size (aggrading neomorphism), which is inconsistent with the micritic to near-micritic grain size of the investigated Martin Point lime mudstones. By contrast, the diagenetic fluids are basically water and their O-isotope composition certainly resets the δ18O of carbonates quickly at variable degrees depending on the water/rock interaction ratio, and, thus the preservation of primary/near-primary δ18O signatures in marine lime mudstones is rare compared to their δ13C counterparts. This may suggest that the poor correlation of Sr, and also Mn (R 2 = 0.008; Appendix), with the δ18O values has to be treated with caution.
Although Fe is enriched with progressive diagenesis like Mn (Veizer, Reference Veizer, Arthur, Anderson, Kaplan, Veizer and Land1983), the possible contamination from hidden bacterial microrhombic pyrite during microsampling, particularly in carbonates associated with sealevel rise and increasing reducing conditions, makes it an unreliable proxy for the evaluation of degree of geochemical preservation.
Alteration of organic matter, which is associated with recrystallization of carbonates, may deplete the primary δ13C signatures of carbonates. If, for argument's sake, the organic content was high in sediments during deposition and organic remineralization influenced the δ13C of those carbonates during diagenesis, the effect would be consistent throughout the C-isotope profile and the shifts would be irregular and randomly spread rather than distinct excursions correlated specifically with the Cambrian‒Ordovician boundary and with the base of the E. notchpeakensis zone (HERB event; Buggisch, Keller & Lehnert, Reference Buggisch, Keller and Lehnert2003; Miller et al. Reference Miller, Evans, Freeman, Ripperdan and Taylor2011, Reference Miller, Repetski, Nicoll, Nowlan and Ethington2014). No diagenetic model or system has been known so far to cause excursions in the δ13C profiles of carbonate sections from different palaeocontinents (Buggisch, Keller & Lehnert, Reference Buggisch, Keller and Lehnert2003; Miller et al. Reference Miller, Evans, Freeman, Ripperdan and Taylor2011, Reference Miller, Repetski, Nicoll, Nowlan and Ethington2014) at the exact stratigraphic level.
In summary, the petrographic evidence of insignificant recrystallization but preservation of sedimentary fabric (cf. Banner & Hanson, Reference Banner and Hanson1990), the insignificant correlation between δ13C and Sr values, the consistency of δ13C values in closely spaced stratigraphic samples (Appendix) and the similarities between the mean δ13C value of the Martin Point carbonates and that of the equivalent Cambrian‒Ordovician GSSP boundary section counterparts (Table 1) support the preservation of their primary geochemical signatures and suggest that the variations in the δ13C compositions of the Martin Point carbonates reflect their primary depositional conditions and can be reliably utilized for high-resolution chemostratigraphic correlations (cf. Azmy et al. Reference Azmy, Veizer, Misi, De Olivia, Sanches and Dardenne2001, Reference Azmy, Kaufman, Misi and Oliveira2006, Reference Azmy, Stouge, Brand, Bagnoli and Riiperdan2014; Halverson et al. Reference Halverson, Hoffman, Schrag, Maloof and Rice2005).
6.b. Environmental changes
Changes in sealevel influence oxygen levels in water column and accordingly the oxidation state of redox-sensitive elements. This selectively controls their solubility in seawater and also their degree of enrichment in marine sediments (e.g. Wignall & Twitchett, Reference Wignall and Twitchett1996; Arnaboldi & Meyers, Reference Arnaboldi and Meyers2007, Wignall et al. Reference Wignall, Zonneveld, Newton, Amor, Sephton and Hartley2007). In oxidizing environments, uranium ions maintain the higher oxidation state (U6+) and form uranyl carbonate, which is soluble in water, whereas in reducing conditions they retain the lower oxidation state (U4+) and form the insoluble uranous fluoride which is trapped into marine carbonates (Wignall & Twitchett, Reference Wignall and Twitchett1996). Unlike U, Th is not affected by redox conditions in the water column and occurs permanently in the insoluble Th4+ state. Thus, sediments of anoxic environments are richer in uranium and have lower Th/U than those of oxic environments. Therefore, the Th/U ratio has been used as a proxy for environmental redox conditions, with ratios <2 in anoxic marine sediments and >2 in oxic sediments of open basins (cf. Wignall & Twitchett, Reference Wignall and Twitchett1996). The insignificant correlation (R 2 ≤ 0.03) of the Th/U values with their Sr counterparts argues against their impact by diagenesis and suggests that they are at least near-primary signatures since Sr is known to be consistently depleted by diagenesis (Veizer, Reference Veizer, Arthur, Anderson, Kaplan, Veizer and Land1983).
The Th/U values of the Furgonian Martin Point Formation carbonates are generally <2 but they sharply increase to reach ~5 near the bottom of Bed 7 before they drop quickly back to ~1 (Fig. 5), thus suggesting a possible brief distinct drop in sealevel (Miller et al. Reference Miller, Evans, Freeman, Ripperdan and Taylor2011) associated with enhancement of oxygenation that interrupted the general long-term low oxygen conditions (Landing, Reference Landing2012, Reference Landing, Derby, Fritz, Longacre, Morgan and Sternbach2013).
Also, Ni was utilized as a proxy of bioproductivity and input of nutrients and terrigenous material (e.g. Śliwiński, Whalen & Day, Reference Śliwiński, Whalen and Day2010). Like Th/U values, the Ni contents have very poor correlation with their Sr counterparts (R 2 < 0.03; Appendix), thus suggesting insignificant impact by diagenesis. The Ni profile of the investigated carbonate section (Fig. 5) exhibits a short-term fast increase in the water column Ni budget that correlates with the positive Th/U shift, which is consistent with the suggested brief drop in the sealevel that likely resulted in an increase in the input of nutrients and possible enhancement in bioproductivity but for a short time interval.
Both the Th/U and Ni shifts correlate with the peak of the broad negative δ13C shift on the C-isotope profile of the investigated carbonates (Fig. 5), which also agrees with the suggested brief sealevel drop before it resumed rising again. Although no sealevel profile has been documented for the currently investigated Martin Point section, the sealevel curve, reconstructed from an equivalent but shallow-water section in Utah, USA (Lawson Cove), shows a brief drop at the same stratigraphic level correlated with the base of the notchpeakensis Zone (Miller et al. Reference Miller, Evans, Freeman, Ripperdan and Taylor2011, their figure 8). This drop likely resulted in shifting shallower O2-rich water relatively down to slope settings, which enhanced the oxidation of buried organic matter to release light 12CO2 that led to the deposition of 13C-depleted carbonates and caused the negative δ13C swing. This effect seems to have overprinted the increase in primary productivity, particularly in a slope setting where organic productivity is restricted, to some extent, compared with shallow-shelf environments. Also, the low abundance of marine and terrestrial biota during the very early Palaeozoic would argue against significant inputs of weathered light carbon into the ocean. The consistency of evidence from trace elements with that from the C-isotopes suggests that the uppermost Cambrian carbonates of the investigated Martin Point Formation were deposited likely under dysoxic rather than anoxic conditions, which is similar to conditions of the deposition of the Cambrian‒Ordovician GSSP sediments at Green Point (e.g. Azmy et al. Reference Azmy, Stouge, Brand, Bagnoli and Riiperdan2014, Reference Azmy, Kendall, Brand, Stouge and Gordon2015). Thus, this demonstrates that the stratigraphic level of the peak of the broad negative δ13C shift represents the well-documented HERB event known for the Late Cambrian (e.g. Ripperdan, Magaritz & Kirschvink, Reference Ripperdan, Magaritz and Kirschvink1993; G. S. Nowlan, unpublished report, 1995; Buggisch, Keller & Lehnert, Reference Buggisch, Keller and Lehnert2003; Jing et al. Reference Jing, Deng, Zhao, Lu and Zhang2008; Landing, Westrop & Adrain, Reference Landing, Westrop and Adrain2011; Miller et al. Reference Miller, Evans, Freeman, Ripperdan and Taylor2011, Reference Miller, Repetski, Nicoll, Nowlan and Ethington2014; Terfelt, Eriksson & Schmitz, Reference Terfelt, Eriksson and Schmitz2014).
6.c. Carbon-isotope stratigraphy
The Late Cambrian through Early Ordovician times are known to be associated with global sealevel changes (e.g. James & Stevens, Reference James and Stevens1986; Cooper, Nowlan & Williams, Reference Cooper, Nowlan and Williams2001; Landing, Reference Landing and Landing2007, Reference Landing2012, Reference Landing, Derby, Fritz, Longacre, Morgan and Sternbach2013; Landing, Westrop & Miller, Reference Landing, Westrop, Miller, Fatka and Budil2010) that influenced the abundance of biota and their productivity in oceans and/or the preservation of organic debris in sediments. These changes were accordingly reflected in the global ocean water chemistry, particularly the C-isotope composition of marine carbonates during those time intervals that were characterized by two major negative δ13C excursions, one correlated with the Upper Cambrian HERB event and the other with the Cambrian‒Ordovician boundary (e.g. Ripperdan, Magaritz & Kirschvink, Reference Ripperdan, Magaritz and Kirschvink1993; Chen et al. Reference Chen, Zhang, Nicoll and Nowlan1995; G. S. Nowlan, unpublished report, 1995; Buggisch, Keller & Lehnert, Reference Buggisch, Keller and Lehnert2003; Jing et al. Reference Jing, Deng, Zhao, Lu and Zhang2008; Miller et al. Reference Miller, Evans, Freeman, Ripperdan and Taylor2011, Reference Miller, Repetski, Nicoll, Nowlan and Ethington2014; Azmy et al. Reference Azmy, Stouge, Brand, Bagnoli and Riiperdan2014; Terfelt, Eriksson & Schmitz, Reference Terfelt, Eriksson and Schmitz2014; Li et al. Reference Li, Zhang, Chen, Zhang, Chen, Huang, Peng and Shen2017). Similar δ13C excursions, caused by variations in primary productivity or organic preservation, have been documented in marine environments throughout the Earth's history (e.g. Veizer et al. Reference Veizer, Ala, Azmy, Bruckschen, Bruhn, Buhl, Carden, Diener, Ebneth, Goddris, Jasper, Korte, Pawellek, Podlaha and Strauss1999; Halverson et al. Reference Halverson, Hoffman, Schrag, Maloof and Rice2005; Landing, Reference Landing, Derby, Fritz, Longacre, Morgan and Sternbach2013).
Eustatic variations during the Late Cambrian through Early Ordovician influenced the oceanic redox conditions (Cooper, Nowlan & Williams, Reference Cooper, Nowlan and Williams2001; Landing, Reference Landing, Derby, Fritz, Longacre, Morgan and Sternbach2013), which impacted the primary productivity. Earlier studies indicate that the Upper Cambrian Martin Point carbonates were deposited in a slope setting (James & Stevens, Reference James and Stevens1986) likely under dysoxic conditions (Azmy et al. Reference Azmy, Kendall, Brand, Stouge and Gordon2015).
The petrographic and geochemical characteristics of the investigated Martin Point carbonates argue for an insignificant degree of alteration and a high degree of preservation of chemical signatures. This suggests that they retain at least their near-primary δ13C signatures, particularly when diagenetic fluids do not have much CO2 that would reset the C-isotope composition of those carbonates. Thus, a reliable chemostratigraphic δ13C profile can be reconstructed to investigate temporal variations in seawater chemistry during the Late Cambrian.
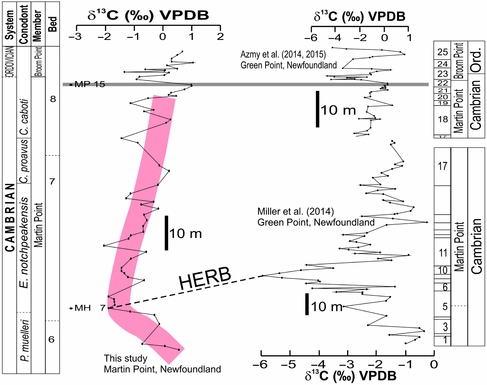
The δ13C profile of the currently investigated succession at Martin Point (Fig. 6) exhibits a lower broad C-isotope excursion that ends barely below the stratigraphic level of the boundary between the Martin Point and Broom Point members where an upper excursion occurs. No physical stratigraphic hiatuses have been documented throughout the section (cf. James & Stevens, Reference James and Stevens1986; Barnes, Reference Barnes1988). The broad excursion (~3 ‰) consists of approximately five main subpeaks (each about 2 ‰) and reaches its maximum at Sample MH7 (Fig. 6). The upper excursion (~2.5 ‰) consists of two main distinctive narrow and sharp subpeaks that match those immediately above the geochemical anomaly level documented by Azmy et al. (Reference Azmy, Stouge, Brand, Bagnoli and Riiperdan2014, Reference Azmy, Kendall, Brand, Stouge and Gordon2015) at Green Point, and therefore the base of the upper excursion (Fig. 6, Sample MP15) can be reliably correlated with the level of the geochemical anomaly (Azmy et al. Reference Azmy, Kendall, Brand, Stouge and Gordon2015). The geochemical anomaly level marks distinct changes in the δ13Corg, δ15N and δ238U profiles of carbonates across the Cambrian‒Ordovician GSSP boundary section at Green Point (Azmy et al. Reference Azmy, Stouge, Brand, Bagnoli and Riiperdan2014, Reference Azmy, Kendall, Brand, Stouge and Gordon2015) that reflect an increase in dysoxic conditions. The lower broad excursion of the Martin Point C-isotope profile reaches its maximum swing at a subpeak near the bottom of Bed 7 that can be correlated with the HERB (Fig. 6) subpeak documented by Miller et al. (Reference Miller, Repetski, Nicoll, Nowlan and Ethington2014). The peak value of the negative HERB δ13C excursion nearly coincides with the lower boundary of the E. notchpeakensis biozone (Stouge, Bagnoli & Azmy, Reference Stouge, Bagnoli, Azmy, Laurie, Kruse, Garcia-Bellido and Holmes2016), which is the same stratigraphic level of the HERB event documented by earlier studies (Miller et al. Reference Miller, Evans, Freeman, Ripperdan and Taylor2011, Reference Miller, Repetski, Nicoll, Nowlan and Ethington2014) in the equivalent section of Green Point.
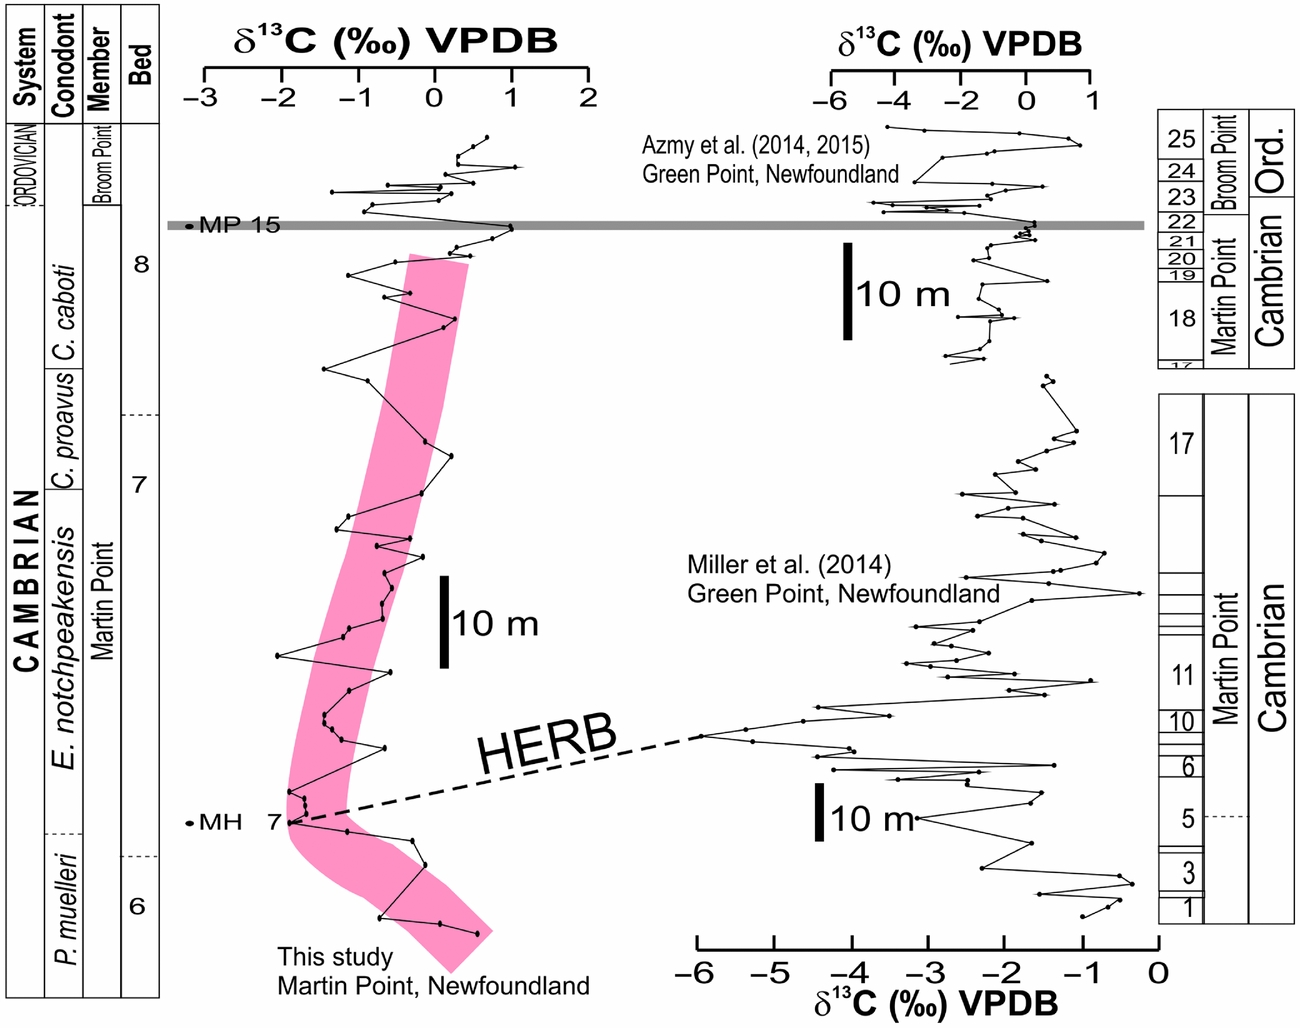
Figure 6. Carbon-isotope profiles spanning the uppermost Cambrian and lowermost Ordovician at Martin Point, Newfoundland (current study), and the uppermost Cambrian (from Miller et al. Reference Miller, Evans, Freeman, Ripperdan and Taylor2011) and the GSSP Cambrian‒Ordovician boundary (from Azmy et al. Reference Azmy, Stouge, Brand, Bagnoli and Riiperdan2014) at Green Point in western Newfoundland, Canada. The solid grey line refers to the level of the geochemical anomaly documented by Azmy et al. (Reference Azmy, Stouge, Brand, Bagnoli and Riiperdan2014, Reference Azmy, Kendall, Brand, Stouge and Gordon2015), and the thick red line shows the general first-order trend of the HERB C-isotope profile of the investigated section at Martin Point.
The amplitudes of the δ13C subpeaks and the magnitude of the entire excursion are influenced by the response of organic productivity to changes in sealevel, which varies from basin to basin and from one location to another inside the same basin depending on the position of the investigated sections relative to the palaeogeography (basin depth). The uppermost Cambrian sedimentary rocks in allochthonous western Newfoundland were deposited in a slope setting (James & Stevens, Reference James and Stevens1986) of restricted light due to depth where dysoxic conditions likely dominated and changes in sealevel would enhance the negative δ13C shifts on the isotope profile (Azmy et al. Reference Azmy, Kendall, Brand, Stouge and Gordon2015). Thus, the more negative values and sharper and higher magnitudes of negative δ13C excursions of the Upper Cambrian ‒ Lower Ordovician carbonates at the Green Point section (Miller et al. Reference Miller, Repetski, Nicoll, Nowlan and Ethington2014) relative to their Martin Point counterparts suggest that the Martin Point section was located at relatively shallower level on the slope settings near the boundary of the photic zone where the primary productivity is relatively higher (more positive δ13C), which is also consistent with the thicker sediments of the Martin Point section relative to their equivalent Green Point counterpart (James & Stevens, Reference James and Stevens1986; Playton, Janson & Kerans, Reference Playton, Janson, Kerans, James and Dalrymple2010). Unfortunately, no detailed trace element compositions have yet been documented for the Green Point carbonates to allow comparison with those of the current study to shed light on the variations of dysoxic conditions.
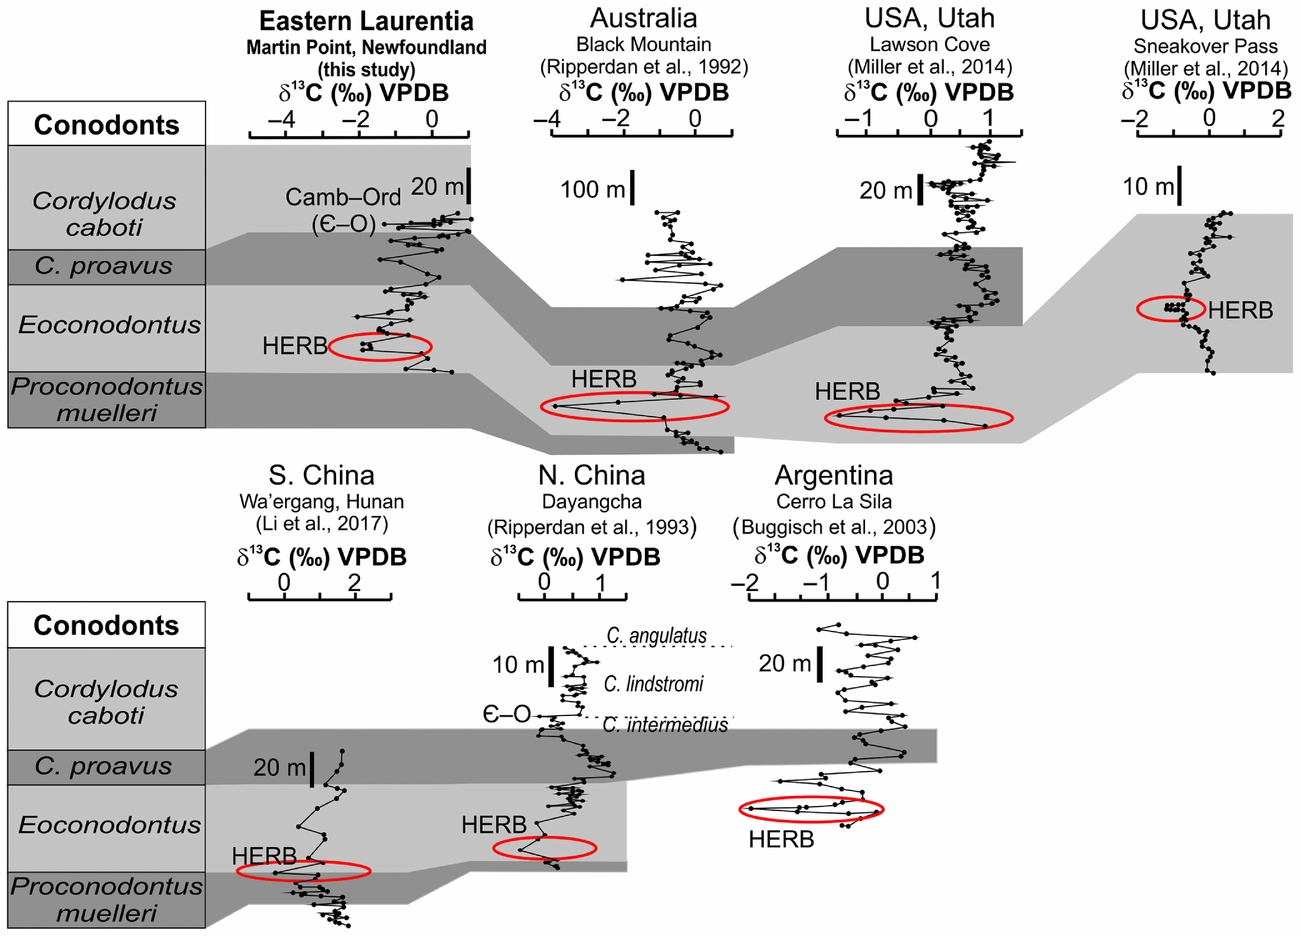
The negative δ13C excursions of the Upper Cambrian carbonates at Martin Point are not only correlated with their counterparts of the GSSP section at Green Point in western Newfoundland but can also be correlated with other global equivalent excursions spanning the same time interval (Fig. 7) but from shallow-water carbonates (cf. Chen et al. Reference Chen, Zhang, Nicoll and Nowlan1995; Jing et al. Reference Jing, Deng, Zhao, Lu and Zhang2008; Landing, Westrop & Adrain, Reference Landing, Westrop and Adrain2011; Miller et al. Reference Miller, Evans, Freeman, Ripperdan and Taylor2011, Reference Miller, Repetski, Nicoll, Nowlan and Ethington2014; Azmy et al. Reference Azmy, Stouge, Brand, Bagnoli and Riiperdan2014; Terfelt, Eriksson & Schmitz, Reference Terfelt, Eriksson and Schmitz2014, fig. 9; Li et al. Reference Li, Zhang, Chen, Zhang, Chen, Huang, Peng and Shen2017, fig. 4). The HERB δ13C excursion was documented in Utah (Lawson Cove, Sneakover Pass, and Sevier Lake Corral; Miller et al. Reference Miller, Evans, Freeman, Ripperdan and Taylor2011, Reference Miller, Repetski, Nicoll, Nowlan and Ethington2014), Australia (Black Mountain; Ripperdan et al. Reference Ripperdan, Magaritz, Nicoll and Shergold1992), China (Ripperdan, Magaritz & Kirschvink, Reference Ripperdan, Magaritz and Kirschvink1993; Chen et al. Reference Chen, Zhang, Nicoll and Nowlan1995; Jing et al. Reference Jing, Deng, Zhao, Lu and Zhang2008; Terfelt, Eriksson & Schmitz, Reference Terfelt, Eriksson and Schmitz2014; Li et al. Reference Li, Zhang, Chen, Zhang, Chen, Huang, Peng and Shen2017) and Argentina (Buggisch, Keller & Lehnert, Reference Buggisch, Keller and Lehnert2003; Sial et al. Reference Sial, Peralta, Gaucher, Alonso and Pimentel2008).

Figure 7. Global carbon-isotope chemostratigraphic correlations of the HERB event (latest Cambrian) documented in sections from basins on different palaeocontinents (modified from Barnes, Reference Barnes1988; Terfelt, Eriksson & Schmitz, Reference Terfelt, Eriksson and Schmitz2014; Li et al. Reference Li, Zhang, Chen, Zhang, Chen, Huang, Peng and Shen2017). The peaks of the δ13C excursions are marked.
Although earlier investigations (e.g. Glumac & Mutti, Reference Glumac and Mutti2007) studied the C-isotope profile of the Late Cambrian of northern Appalachia (US), they documented only the older SPICE (Steptoean Positive Carbon Isotope Excursion) event rather than the HERB.
7. Conclusions
• The petrographic and geochemical examinations support the preservation of very near-primary δ13C signatures in the investigated lime mudstone beds of the continuous Upper Cambrian ‒ Lower Ordovician section at Martin Point in western Newfoundland. The δ13C profile exhibits two main negative excursions, a lower broad excursion (~3 ‰) that has five subpeaks and reaches its maximum near the base of Bed 7 but ends barely below the stratigraphic level of the boundary between the Martin Point and Broom Point members and an upper narrow excursion (~2.5 ‰) that has two sharp subpeaks immediately above the earlier-documented geochemical anomaly level.
• The lower negative δ13C excursion is associated with positive shifts on the Th/U and Ni profiles and can also be correlated with the global Late Cambrian HERB event, whereas the upper excursion matches that of the Cambrian‒Ordovician GSSP boundary section at Green Point.
• The amplitudes of the major negative excursions of the Martin Point C-isotope profiles are less than those of their Green Point counterparts, which can likely be attributed to the location of the sections within the basin. It is possible that the Martin Point section was located at a relatively shallower setting where the impact of bioproductivity is higher.
• The occurrence of the peak of HERB δ13C excursion at the base of the E. notchpeakensis is a potential tool for the global correlation of the uppermost Cambrian in eastern Laurentia with equivalent sections on the same palaeocontinent and also on others.
Acknowledgements
The author wishes to thank Dr Denis Lavoie and other anonymous reviewers for their constructive reviews. Also, the efforts of Dr Chad Deering (editor) are much appreciated. Special thanks to Dr Svend Stouge for his help in the field. This project was supported by funding (to Karem Azmy) from the Petroleum Exploration Enhancement Program (PEEP), NL, Canada.
Appendix. Elemental and isotopic geochemical compositions of Martin Point carbonates