


1. Introduction
To understand how the Earth behaves under greenhouse conditions, the study of Cretaceous palaeoclimates has proven useful. Reconstruction of Cretaceous pCO2 has been attempted using techniques such as determination of stomatal indices of fossil cuticle (e.g. Beerling, McElwain & Osborne, Reference Beerling, McElwain and Osborne1998; Retallack, Reference Retallack2001; Beerling & Royer, Reference Beerling and Royer2002; Beerling & Berner, Reference Beerling and Berner2005; Haworth et al. Reference Haworth, Hesselbo, McElwain, Robinson and Brunt2005), organic geochemistry (Sinninghe Damsté et al. Reference Sinninghe Damsté, Kuypers, Pancost and Schouten2008), study of carbon isotope composition of calcium carbonate in ancient soils (e.g. Cerling, Reference Cerling1991; Ekart et al. Reference Ekart, Cerling, Montañez and Tabor1999; Robinson et al. Reference Robinson, Andrews, Hesselbo, Radley, Dennis, Harding and Allen2002; Retallack, Reference Retallack2005, Reference Retallack2009) and geochemical modelling (e.g. Berner, Reference Berner1994, Reference Berner2001, Reference Berner2006; Tajika, Reference Tajika1999; Wallmann, Reference Wallmann2001; François, Grard & Goddéris, Reference François, Grard, Goddéris, Steemans and Javaux2005).
In the generalized models of Berner (Reference Berner2001, Reference Berner2006) and Tajika (Reference Tajika1999), atmospheric pCO2 is high during latest Jurassic–earliest Cretaceous time (150–140 Ma), quickly falls during middle Early Cretaceous time (c. 140–130 Ma), recovers to a higher level during late Early Cretaceous time (c. 130–120 Ma), maintains a stable higher level through mid-Cretaceous time (c. 120–110 Ma) and then falls towards the end of Cretaceous time. The only difference in the Wallmann (Reference Wallmann2001) model is that atmospheric pCO2 is reconstructed as being much lower during Early Cretaceous time. Changes in Cretaceous pCO2 based on stomatal indices from plant cuticle are not readily comparable with one another because of the difference in stratigraphic resolution (Retallack, Reference Retallack2001; Haworth et al. Reference Haworth, Hesselbo, McElwain, Robinson and Brunt2005; Sun et al. Reference Sun, Xiao, Xie, Deng, Wang, Jia and Turner2007); the study of Haworth et al. (Reference Haworth, Hesselbo, McElwain, Robinson and Brunt2005), based on cuticle from England and the United States, produces data that can, however, be compared with results from pedogenic carbonate from the same sedimentary unit in England. Estimates of pCO2, primarily based on study of pedogenic carbonate from localities worldwide, match more closely the earlier model of Berner (Reference Berner1994) in terms of absolute values than the later models (Berner, Reference Berner2001, Reference Berner2006), although the trends are broadly similar. In summary, Cretaceous pCO2 is considered to have been on average 4–8 times higher than pre-industrial values; some reconstructions show little variation on a scale of tens of millions of years, while others show significant short-term excursions.
However, three major problems persist: (1) the pCO2 pedogenic carbonate palaeobarometer typically yields much higher values than do fossil stomata (Royer, Reference Royer2006; Fletcher et al. Reference Fletcher, Brentnall, Anderson, Berner and Beerling2008); (2) the exact intervals to which the ancient pCO2 determinations apply are commonly only approximate because, in the absence of unambiguous palaeomagnetic reversals (cf. Nordt, Atchley & Dworkin, Reference Nordt, Atchley and Dworkin2002, Reference Nordt, Atchley and Dworkin2003), stratigraphy is compromised by the common lack of age-diagnostic taxa in continental lithofacies; and (3) (following from (2)) the lack of high-resolution data precludes correlation of movements in pCO2 with changes in the global carbon cycle derived from marine sediments. The first problem may be addressed by using more realistic constraints on the assumed concentrations of soil CO2 (Breecker, Sharp & McFadden, Reference Breecker, Sharp and McFadden2010); the second and third problem can be overcome by finding pedogenic carbonates that can be accurately dated.
There is little in the way of pCO2 reconstructions from Chinese sequences and all those investigated to date suffer from the stratigraphic limitations that beset continental sediments: the investigated material includes two mid-Cretaceous palaeosols from the Lhasa terrane in Tibet (Leier et al. Reference Leier, Quade, DeCelles and Kapp2009), Lower Cretaceous palaeosols in southwestern China (Huang, Retallack & Wang, Reference Huang, Retallack and Wang2012) and fossil Ginkgo leaves from the lowermost Cretaceous of north China that have yielded stomatal indices (Sun et al. Reference Sun, Xiao, Xie, Deng, Wang, Jia and Turner2007). However, Jurassic–Cretaceous continental sediments are widespread in mainland China and offer potential for this type of investigation. In this work, we present new carbon isotope data from well-dated pedogenic carbonates cropping out in Zhejiang and Jiangxi, SE China (Fig. 1), and estimate atmospheric pCO2 during middle–late Early Cretaceous time. Furthermore, we endeavour to explore the linkages between changes in atmospheric pCO2 and large-scale geological events that may have affected the global carbon cycle.

Figure 1. Sketch map of Cretaceous outcrops in SE China, simplified after Shu et al. (Reference Shu, Zhou, Deng, Wang, Jiang, Yu and Zhao2009). The squares are the sample localities and the numbers in white in black squares indicate sample locations: (1) Tongjia to Yanxia, Jiande; (2) Gaoxiantang, Longyou; (3) Zhongdai, Jinhua; (4) Guantou to Fenglin, Yongkang; (5) Laozhu, Lishui; (6) Huobashan, Yiyang; and (7) Xintian, Guixi. Sections 1–5 are located in Zhejiang province and sections 6–7 are located in Jiangxi province.
2. Geological setting
A number of Cretaceous continental sedimentary basins were formed by regional extension during late Mesozoic tectonic events in east and SE Asia (e.g. Liu, Reference Liu1982; Ren, Reference Ren1990; Okada, Reference Okada1999; Shu et al. Reference Shu, Faure, Wang, Zhou and Song2008, Reference Shu, Zhou, Deng, Wang, Jiang, Yu and Zhao2009); those in SE China are of relatively small sizes, typically several hundred square kilometres but ranging up to c. 3000 km2 for a single basin (Ren & Chen, Reference Ren and Chen1989; Yu et al. Reference Yu, Shu, Deng, Wang and Zhu2003; Shu et al. Reference Shu, Zhou, Deng, Wang, Jiang, Yu and Zhao2009). Moving from east to west in South China, the continental sedimentary basins are dominated by volcanic rocks, passing to sediments interbedded with volcanic rocks, in turn passing to predominantly sedimentary successions (e.g. Li, Shen & Wang, Reference Li, Shen and Wang1987; Lu, Zhu & Qin, Reference Lu, Zhu and Qin2000; Chen et al. Reference Chen, Chen, Xu and Zhang2005; Shu et al. Reference Shu, Zhou, Deng, Wang, Jiang, Yu and Zhao2009) (Fig. 1). We chose to investigate sequences with interbedded volcanic and sedimentary rocks because they provide the opportunity to determine more closely the age of the samples.
In this area, argillisols, calcisols and oxisols are the typical pedogenic sediments and were mostly developed during mid-Cretaceous time under inferred arid to semi-arid climatic conditions (Li et al. Reference Li, Chen, Cao, Chen, Xu and Ji2009). The argillisols are characterized by burrow and root traces within reddish silty mudrock, the calcisols comprise pedogenic carbonate concretions in pale-purple calcareous mudrock and the oxisols are an association of ferric oxide coatings and concretions within reddish-purple to greyish-orange siltstone and mudrock. Calcisols are interpreted as having formed in fluvial floodplain deposits and marginal lacustrine environments. The palaeosol and calcretes primarily occur in the Jiande Group, Yongkang Group, Qujiang Group in the basins of western Zhejiang and Shixi and Luotang Formations in the basins of NE Jiangxi. The Jiande Group comprises the Laocun, Huangjian, Shouchang and Hengshan Formations, the Yongkang Group is composed of the Guantou, Chaochuan and Fangyan Formations and the Qujiang Group consists of the Zhongdai, Jinhua and Quxian Formations. All these units are generally attributed to the Lower Cretaceous (e.g. Cao, Reference Cao1986; Zheng, Reference Zheng1993; Shou, Reference Shou1995; Yu & Xu, Reference Yu and Xu1999; Chen et al. Reference Chen, Komatsu, Cao and Stiller2006, Reference Chen, Lee, Lu and Hseh2008).
To date, the stratigraphic organization and age assignment of strata in these basins has been problematic due to the presence of many local lithostratigraphic units compounded by a lack of datable material in different basins (Yu et al. Reference Yu, Shu, Deng, Wang and Zhu2003). Fossils of stratigraphic use are few and far between, and changes in lithofacies have led to different classifications and correlation of complicated lithostratigraphic units in SE China. Some palaeontological studies of plants, spores, bivalves, ostracods and dinosaurs have been undertaken (e.g. Cao, Reference Cao1986; Zheng, Reference Zheng1993; Shou, Reference Shou1995; Chen et al. Reference Chen, Komatsu, Cao and Stiller2006), as have palaeomagnetic stratigraphy (Hu, Li & Ma, Reference Hu, Li and Ma1990; Liu et al. Reference Liu, Zhu, Jin, Lu, Du and Wang1992; Morinaga, Inokuchi & Miyata, Reference Morinaga, Inokuchi and Miyata1999) and isotope chronology of volcanic and plutonic rocks (e.g. Hu et al. Reference Hu, Hu, Wang and Zhu1982; Li, Shen & Wang, Reference Li, Shen and Wang1989; Yu & Xu, Reference Yu and Xu1999; Chen et al. Reference Chen, Lee, Lu and Hseh2008). However, the strata are not yet well constrained in terms of age.
3. Sample dating
In this study, concretionary pedogenic carbonates were sampled within calcisols in seven locations (Fig. 1) from seven different formations: Chaochuan, Guantou, Jinhua, Laocun, Luotang, Shixi and Zhongdai Formations (Fig. 2). In the past, these formations were often described in general terms as either Early or late Early Cretaceous in age.
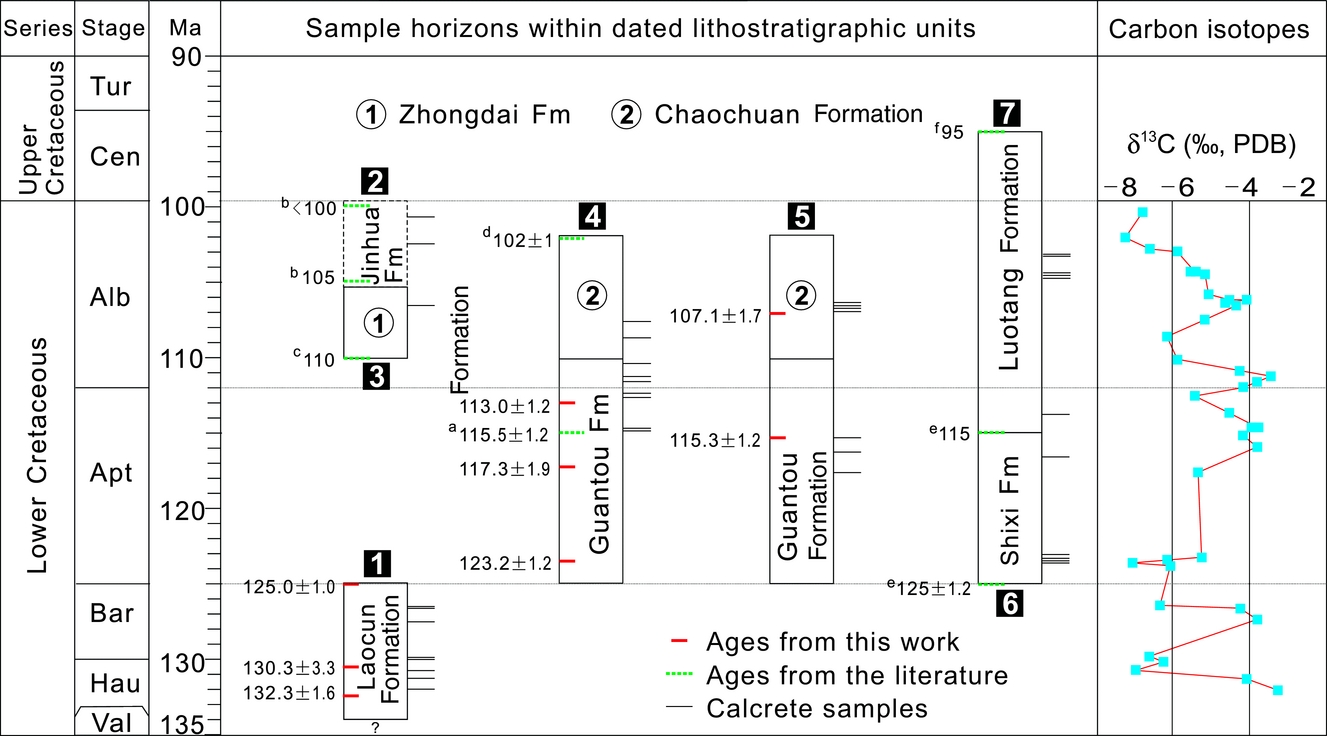
Figure 2. Diagram showing the Cretaceous stratigraphy in SE China with sample horizons of pedogenic carbonate calcretes and changes in carbon isotope values. The ages of samples were assigned by absolute-age positions of volcanically derived zircons (this work) and from minerals and rocks studied by other workers. The numbers in black squares represent the sample locations referred to in Figure 1. Short lines to the right of the rectangles (lithostratigraphic units) are the horizons of calcrete samples. Short bars within rectangles indicate the positions of the volcanic horizons, giving the newly determined U–Pb isotope and other isotope absolute ages. Those age numbers with superscript letters are the ages cited from: (a) Li et al. (Reference Li, Chen, Luo, Wan, Cao and Liu2011); (b) Zhang (Reference Zhang1987); (c) TRGZ (1992); (d) Xing et al. (Reference Xing, Lu, Chen, Zhang, Nie, Li, Huan and Lin2008); (e) Wang et al. (Reference Wang, Guan, Huang, Yu and Chen2002); (f) Xing et al. (Reference Xing, Lu, Chen, Zhang, Nie, Li, Huan and Lin2008) and inferred (see text). These dates were chosen to estimate the ages of calcrete samples from the assigned ages at the top and bottom of key formations. More details are given in Table 2.
To improve the age control of the sequences, samples of the intercalated volcanic rocks were taken for single zircon U–Pb isotope analyses (Table 1, Fig. 2) and the results combined with newly published U–Pb zircon data (Li et al. Reference Li, Chen, Luo, Wan, Cao and Liu2011) as well as with other published isotope ages where appropriate (Table S1, available at http://journals.cambridge.org/geo; Fig. 2). In this work and Li et al. (Reference Li, Chen, Luo, Wan, Cao and Liu2011), zircon U–Pb isotopic measurements (10–15 single zircons for each sample) were completed by laser ablation inductively coupled plasma mass spectrometry (LA-ICP-MS) at the State Key Laboratory for Mineral Deposits Research, Nanjing University following methods described by Jackson et al. (Reference Jackson, Pearson, Griffin and Belousova2004). Analyses of Mud Tank zircon as an unknown yielded a weighted 206Pb/238U age of 720±12 Ma – 736±6 Ma (2σ) for the standard samples, which is in good agreement with the recommended value (thermal ionization mass spectrometry or TIMS age = 732±5 Ma; Black & Gulson, Reference Black and Gulson1978). Analytical results and relevant isotopic rates were calculated using GLITTER 4.4 (van Achterbergh et al. Reference van Achterbergh, Ryan, Jackson, Griffin and Sylvester2001). Common Pb corrections were carried out using the method described by Andersen (Reference Andersen2002). The concordant results are mainly <2.0% in error and <1.5 in mean square weighted distribution (MSWD; Table 1). The new results combined with extant data allow the sedimentary formations containing pedogenic calcrete to be better constrained than previously in terms of age (Fig. 2).
Table 1. Description of volcanic rocks from western Zhejiang, SE China and absolute ages of single zircon U–Pb isotopes
Calcrete sample ages were estimated by interpolation: A = B – γ × C where A is the estimated age of a calcrete sample, B is the nearest isotopic age of an intercalated volcanic rock below, C is the thickness of the sediment to that same volcanic rock and γ is the ratio of age to thickness between the nearest absolute ages of volcanic rocks sampled above and below the pedogenic carbonate in question. All sample ages are estimated and listed in supplementary materials (Table S1, available at http://journals.cambridge.org/geo) and can be read from Figure 2.
The Laocun Formation comprises volcanic rocks interbedded with sedimentary rocks, and was relatively easy to date in the past. The isotopes derived from sanidine and biotite by Ar–K, Ar–Ar and Rb–Sr methods show an age range between 135 Ma and 127 Ma (Yu & Xu, Reference Yu and Xu1999). In this work, zircon U–Pb dating of volcanic single zircons mostly indicates a range of c. 132.13±1.6 Ma – 125.0±1.0 Ma (Table 1, Fig. 2). The new isotopic dating allows the calcrete samples to be relatively well constrained in age.
The Guantou Formation mainly comprises varicoloured (tuffaceous) mudrocks with intercalations of tuff, and is robustly confined between 123.0±1.2 Ma and 113.0±1.2 Ma by the new zircon U–Pb dating presented in this work. Considering other isotope ages (Li et al. Reference Li, Chen, Luo, Wan, Cao and Liu2011) and the positions of volcanic samples (Table S1, available at http://journals.cambridge.org/geo), it is suggested that the formation ranges from 125.0 Ma to 110.0 Ma (Fig. 2). Correspondingly, the overlying Chaochuan Formation, comprising reddish siltstone and mudrock with intercalated sandstone, was adjusted to give a duration of 110.0 Ma to c. 102.0 Ma by the age limits of the underlying Guantou Formation and the 102.0±1.0 Ma Rb–Sr isotope age of an ignimbrite (Xing et al. Reference Xing, Lu, Chen, Zhang, Nie, Li, Huan and Lin2008) at the top of the Chaochuan Formation.
The Zhongdai Formation is characterized by a succession of coarse to fine terrigenous sediment with basalt intercalations. The dinosaur fossil Chilantaisaurus zhejiangensis (PGSZ, 1979) and K–Ar isotope ages of basalt indicate that the formation is of late Early Cretaceous age (Zhang, Reference Zhang1987; TRGZ, 1992). The calcrete sample is roughly constrained to date between 110.0±1.9 Ma (TRGZ, 1992) and 105.0±1.7 Ma (Zhang, Reference Zhang1987), and is estimated as c. 106.5 Ma (Table S1, available at http://journals.cambridge.org/geo; Fig. 2). The Jinhua Formation consists of pale purple silty mudrock and argillaceous siltstone. It is conformable with the underlying Zhongdai Formation and the overlying Quxian Formation, indicating an age younger than c. 105 Ma. We used the estimated sedimentary rate (49.6 m Ma−1) of the Zhongdai Formation to give an approximate age of the two sampled calcretes by reference to their positions within the Jinhua Formation (Table S1, available at http://journals.cambridge.org/geo; Fig. 2) since both formations developed in the same tectonic and sedimentary setting.
The Shixi Formation in eastern Jiangxi province is composed of sandstone interbedded with mudrock. The underlying volcanic Ehuling Formation was dated as 137.0±0.94 Ma (132–144 Ma) by U–Pb isotopes of zircons in trachyte (Liu, Wu & Liu, Reference Liu, Wu and Liu2009) and indicates that the Shixi Formation was formed later than 132 Ma. Two isotopic ages have been published for the Shixi Formation: 125.0±1.2 Ma (Rb–Sr isotope of dacite; Wang et al. Reference Wang, Guan, Huang, Yu and Chen2002) and 119.2±1.3 Ma (K–Ar isotope of sanidine; Li, Shen & Wang, Reference Li, Shen and Wang1989) at the lower and middle part of the section, respectively. The top of the section is estimated as 115 Ma in age. Consequently, the age of the calcrete samples was readily estimated within the formation (Table S1, available at http://journals.cambridge.org/geo; Fig. 2).
Above the Shixi Formation lies the Luotang Formation, constituted by reddish terrigenous sediment with many calcrete nodules and a few intercalations of volcanic rock. Wu (Reference Wu1995, Reference Wu2000) suggested the Luotang Formation as Albian–Cenomanian in age based on the biota (plants, ostracods, bivalves, charophytes and conchostraca). Isotopic data gave the following ages: 119.2±1.3 Ma, 101.8±3.2 Ma based on K–Ar isotopes in sanidine (Li, Shen & Wang, Reference Li, Shen and Wang1989); and 98.0±1.1 Ma, 91.7±1.0 Ma based on K–Ar isotope ages of basalt (Wang et al. Reference Wang, Guan, Huang, Yu and Chen2002). By combining these ages, the Luotang Formation is suggested as lasting from 115 Ma to 95 Ma. This estimate is used for calculating the ages of the calcrete samples.
4. Materials and methods
A total of 87 calcrete samples were collected in situ from 38 horizons (Table 1; Table S1, available at http://journals.cambridge.org/geo) at seven locations (Figs 1, 2); 2–4 calcretes from each horizon were used to measure carbon isotope ratios, and differences in carbon isotope values among single calcretes in the same horizon were determined.
Calcretes are quite readily recognized following criteria assembled by Alonso-Zarza (Reference Alonso-Zarza2003): they are typically spherical–elliptical to ginger-root shaped; they vary in size over the range 2–100 mm in length or diameter; and they represent up to 50% of the mudrock in which they are enclosed (Fig. 3a). Calcrete fabrics are characterized by fine-grained carbonate (Fig. 3b) in the form of concentric (pisolitic) concretions and continuous multi-layered laminar coatings, solutional pipes and cavities, locally with a brecciated texture (cf. Ludvigson et al. Reference Ludvigson, Joeckel, González, Gulbranson, Rasbury, Hunt, Kirkland and Madsen2010). Cathodoluminescence reveals an evenly textured orange to salmon-red colour (Fig. 3b), indicating homogenous precipitation of micritic calcite during calcrete formation. Carbon and oxygen isotope values show little covariance with R 2 = 0.05 (using the binomial single equation) and R 2 = 0.08 (using the binomial quadratic equation), indicating that δ 13C and δ 18O values are independent of each other (Fig. 4). The uniform cathodoluminescence colour of micritic calcite, the small degree of covariance between δ 13C and δ 18O values and scanty evidence for compaction demonstrate that the micritic calcites have not been diagenetically altered in the areas chosen for drilling.

Figure 3. (a) Field photo showing the pedogenic calcretes. Sample 0127-02, Upper Guantou Formation at section 4, northern Guantou village of Yongkang county, Zhejiang province. Pen is 15 cm long. (b) Cathodoluminescence micrograph showing evenly distributed salmon-red colour of micritic calcite in calcrete, indicating little diagenetic alteration. Dark-grey and black non-luminescent areas indicate non-carbonates (quartz, lithic fragments and feldspar as well as other opaques). Sample 1109-01, upper 42nd bed of the Luotang Formation, Wanghua village of Guixi county, Jiangxi province.
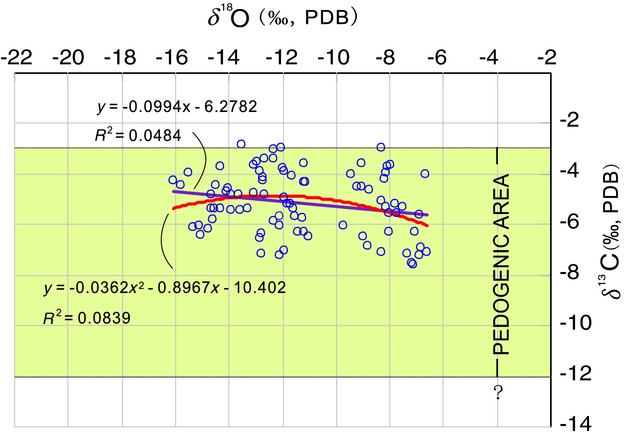
Figure 4. Cross-plot of carbon and oxygen isotopic values of the Lower Cretaceous pedogenic calcretes in SE China. Note the minimal covariance of δ 13C with δ 18O: R 2 = 0.05 using binomial single regression equation and R 2 = 0.08 using binomial quadratic regression equation. These data indicate little diagenetic imprint on δ 13C values. Yellow shaded area indicates the main distribution of δ 13C values for globally distributed Cretaceous pedogenic calcrete.
Powdered samples of 0.5–1.0 mg were drilled for isotopic analysis within strictly limited 1.0–2.0 mm diameter areas where spar-filled micro-cracks, veins and vugs were absent. The resultant powder was dried in an oven at 60°C for 10 hours before being moved to sample vials. Carbon dioxide for isotopic analysis was released using orthophosphoric acid at 70°C and analysed online in a Finnigan MAT 252 mass spectrometer at the Key Laboratory of Marine Geology, Tongji University. Precision was regularly checked with a Chinese national carbonate standard (GBW04405) and the international standard NBS19, and reproducibility of both δ 18O and δ 13C on standards and unknowns is within ±0.07‰. Calibration to the international PeeDee Belemnite (PDB) scale was performed through NBS19 and NBS18 standards.
5. Model equation
The equation of Cerling (Reference Cerling, Thiry and Simon-Coinçon1999) was used to calculate pCO2 in this study:
 \begin{eqnarray*}
{\rm C}_{\rm a} = S(z)(\delta ^{13} {\rm C}_{\rm s} {-} 1.0044\,\delta ^{13} {\rm C}_{\rm r} {-} 4.4)/(\delta ^{13} {\rm C}_{\rm a} {-} \delta ^{13} {\rm C}_{\rm s} )
\end{eqnarray*}
\begin{eqnarray*}
{\rm C}_{\rm a} = S(z)(\delta ^{13} {\rm C}_{\rm s} {-} 1.0044\,\delta ^{13} {\rm C}_{\rm r} {-} 4.4)/(\delta ^{13} {\rm C}_{\rm a} {-} \delta ^{13} {\rm C}_{\rm s} )
\end{eqnarray*}
where Ca is atmospheric pCO2; δ 13Cs, δ 13Cr and δ 13Ca are the isotopic compositions (‰) of soil CO2, soil-respired CO2 and atmospheric CO2, respectively; and S(z) is the CO2 contributed by soil respiration (in parts per million by volume or ppmV). All the parameter values used in the calculation are listed in Table 2 and Tables S3–S4 (available at http://journals.cambridge.org/geo).
Table 2. Comparative estimates of middle–late Early Cretaceous pCO2 at different time horizons
1. Measured carbon isotope composition of pedogenic carbonate from SE China.
2. Carbon isotope composition of well-dated marine carbonate from SE France (northern Tethys). Refer to text and caption of Figure 5.
3. Carbon isotope composition of pedogenic carbonate calibrated by temperature-dependent fractionation factor –8.98‰ (Ekart et al. Reference Ekart, Cerling, Montañez and Tabor1999): δ 13Cs = 8.98 + δ 13Cc.
4. Carbon isotope composition of pedogenic carbonate at 25°C based on palaeomagnetic data and latitude–temperature correlations (Besse & Courtillot, Reference Besse and Courtillot1988; Ekart et al. Reference Ekart, Cerling, Montañez and Tabor1999) following the formula of Romanek, Grossman & Morse (Reference Romanek, Grossman and Morse1992): δ 13Csc = (δ 13Cc + 1000)/[(11.98 – 0.12×T)/1000+1] – 1000.
5. Carbon isotope composition of soil-respired CO2, read in Figure 6 from the highly smoothed average of Ekart et al. (Reference Ekart, Cerling, Montañez and Tabor1999), reflecting atmospheric δ 13CO2 linearly across pCO2 levels.
6. Atmospheric carbon isotopes calibrated by pedogenic organic matter (δ 13Cac = (δ 13Cr + 18.67)/1.1; Arens, Jahren & Amundson, Reference Arens, Jahren and Amundson2000), in which δ 13Cr is derived from the highly smoothed average of Ekart et al. (Reference Ekart, Cerling, Montañez and Tabor1999).
7. Carbon isotope composition of soil-respired CO2 calculated using a −26‰ fractionation between the carbon isotope composition of well-dated marine carbonate from SE France (northern Tethys) and soil organic matter (Ekart et al. Reference Ekart, Cerling, Montañez and Tabor1999).
8. Atmospheric carbon isotopes calibrated from pedogenic organic matter (δ 13Cac = (δ 13Cr + 18.67)/1.1; Arens, Jahren & Amundson, Reference Arens, Jahren and Amundson2000), in which δ 13Cr is derived from the measured carbon isotope composition of marine carbonate from SE France (northern Tethys).
9. Atmospheric pCO2 estimated from the equation of Cerling (Reference Cerling, Thiry and Simon-Coinçon1999), using S(z) = 5000; δ 13Cs = δ 13Cs; δ 13Cø = δ 13Cr; δ 13Ca = δ 13Ca
10. Atmospheric pCO2 estimated from the equation of Cerling (Reference Cerling, Thiry and Simon-Coinçon1999), using S(z) = 5000; δ 13Cs = δ 13Csc; δ 13Cr = δ 13Cr; δ 13Ca = δ 13Cac
11. Atmospheric pCO2 estimated from the equation of Cerling (Reference Cerling, Thiry and Simon-Coinçon1999), using S(z) = 2500; δ 13Cs = δ 13Cs; δ 13Cr = δ 13Cr; δ 13Ca = δ 13Ca
12. Atmospheric pCO2 estimated from the equation of Cerling (Reference Cerling, Thiry and Simon-Coinçon1999), using S(z) = 2500; δ 13Cs = δ 13Cs; δ 13Cr = δ 13Cr; δ 13Ca = δ 13Ca
13. Atmospheric pCO2 estimated from the equation of Cerling (Reference Cerling, Thiry and Simon-Coinçon1999), using S(z) = 2500; δ 13Cs = δ 13Csc; δ 13Cr = δ 13Cr; δ 13Ca = δ 13Cac
14. Atmospheric pCO2 estimated from the equation of Cerling (Reference Cerling, Thiry and Simon-Coinçon1999), using S(z) = 2500; δ 13Cs = δ 13Cs; δ 13Cr = δ 13Cr; δ 13Ca = δ 13Cac; of these, δ 13Cr is from the highly smoothed average of Ekart et al. (Reference Ekart, Cerling, Montañez and Tabor1999).
15. Atmospheric pCO2 estimated from the formula of Cerling (Reference Cerling, Thiry and Simon-Coinçon1999), using S(z) = 2500; δ 13Cs = δ 13Csc; δ 13Cr = δ 13Croc; δ 13Ca = δ 13Caoc; of these, δ 13Cr represents the −26‰ fractionation between oceanic carbonate and soil organic matter (Ekart et al. Reference Ekart, Cerling, Montañez and Tabor1999) derived from the carbon isotope composition of shallow marine carbonate from SE France.
16. Discrepancy of atmospheric pCO2 estimated by different δ 13Cr values as indicated in columns 14 and 15. pCO2 in column 15 is on average 125 ppmV greater than that shown in column 14. The trend of pCO2 changes is, however, similar in both columns 14 and 15.
Equation of pCO2 is referred to in the text. δ 13Ca = −6.5‰; T = 25°C.
As for Ekart et al. (Reference Ekart, Cerling, Montañez and Tabor1999), δ 13Cs was calculated from the carbon isotope composition (δ 13Cc) of pedogenic carbonate according to the temperature-dependent fractionation factor –8.98‰; in this case the pCO2 values are much lower than those used in the Romanek, Grossman & Morse (Reference Romanek, Grossman and Morse1992) formula (cf. columns 3 and 4 of Table 2). δ 13Cs was therefore further calibrated as δ 13Csc by the formula of Romanek, Grossman & Morse (Reference Romanek, Grossman and Morse1992) (see Table 2; Tables S2–S3, available at http://journals.cambridge.org/geo), in which palaeotemperature is estimated as 25°C based on palaeomagnetic data and latitude–temperature correlations (Besse & Courtillot, Reference Besse and Courtillot1988; Ekart et al. Reference Ekart, Cerling, Montañez and Tabor1999). An average value of –6.5‰ was chosen as the δ 13Ca for the mid-Cretaceous (c. 130–95 Ma) soil-respired CO2 (e.g. Ekart et al. Reference Ekart, Cerling, Montañez and Tabor1999; Lee et al. Reference Lee1999; Lee & Hisada, Reference Lee and Hisada1999; Robinson et al. Reference Robinson, Andrews, Hesselbo, Radley, Dennis, Harding and Allen2002; Leier et al. Reference Leier, Quade, DeCelles and Kapp2009) and the δ 13Ca was generally calibrated as δ 13Cac from δ 13Cr (see below) of soil-respired CO2 using the Arens, Jahren & Amundson (Reference Arens, Jahren and Amundson2000) relation: (δ 13Cr + 18.67)/1.1.
δ 13Cr represents average bulk C3 vascular land-plant tissue (Arens, Jahren & Amundson, Reference Arens, Jahren and Amundson2000), reflecting atmospheric δ 13CO2 linearly across pCO2 levels (Jahren et al. Reference Jahren, Arens, Sarmiento, Guerrero and Amundson2001; Jahren, Arens & Harbeson, Reference Jahren, Arens and Harbeson2008). As indicated by Ekart et al. (Reference Ekart, Cerling, Montañez and Tabor1999), some degree of error in pCO2 reconstructions would result if δ 13Cr changed from –23.5 to –24.3 ‰. However, the possible errors (at most 10%, generally <5%) do not significantly influence the trend of the result. The δ 13Com (carbon isotope ratio of soil organic matter based on the range of modern C3 ecosystem fractionations; Buchmann et al. Reference Buchmann, Brooks, Flanagan, Ehleringer and Griffiths1998; Ekart et al. Reference Ekart, Cerling, Montañez and Tabor1999) of organic matter within palaeosols is commonly thought to be representative of δ 13Cr in the model equation (Cerling, Reference Cerling, Thiry and Simon-Coinçon1999), and values through the Phanerozoic can be read from the model curve of Ekart et al. (Reference Ekart, Cerling, Montañez and Tabor1999). The δ 13Com (i.e. δ 13Cr) varies between –23.5 and –24.3‰ for the middle–late Early Cretaceous interval; details are given in column 6 of Table 2 and supplementary materials (Tables S2–S4, available at http://journals.cambridge.org/geo).
However, the model curve of Ekart et al. (Reference Ekart, Cerling, Montañez and Tabor1999) is a highly smoothed average, designed for very long-term (tens to hundreds of millions of years) reconstructions and does not capture the variability in δ 13C of the ocean–atmosphere carbon reservoir on shorter time scales such as those investigated here. We therefore also used the Early Cretaceous δ 13C curve (Fig. 5b) of biostratigraphically well-dated hemipelagic sediments from northern Tethys (SE France) for an estimate of δ 13Cr. Firstly, we read the δ 13Coc (marine calcite) value corresponding to the age point of samples in this work, and made a calculation using a –26‰ fractionation factor between pelagic carbonate and soil organic matter (Ekart et al. Reference Ekart, Cerling, Montañez and Tabor1999). The δ 13Croc (column 7 of Table 2) of soil-respired CO2 obtained in this way yielded values of –22.4 to –24.8‰ (mostly −23.5 to −24.6‰), which are broadly consistent with those given by Ekart et al. (Reference Ekart, Cerling, Montañez and Tabor1999). Secondly, following the calibration of Arens, Jahren & Amundson (Reference Arens, Jahren and Amundson2000), the δ 13Caoc (column 8 of Table 2) of atmospheric CO2 values were calculated, also derived from carbon isotope values of pelagic sediment. Thirdly, Ca (pCO2) was estimated using the formula of Cerling (Reference Cerling, Thiry and Simon-Coinçon1999). The resulting levels of pCO2 are different from those derived from δ 13Cr of the highly smoothed average of Ekart et al. (Reference Ekart, Cerling, Montañez and Tabor1999) (cf. columns 14 and 15 of Table 2). The method utilizing δ 13C values of pelagic carbonate generally yielded higher values: 125 ppmV on average (column 16 of Table 2) and as much as 522 ppmV higher in one instance (but 455 ppmV lower in another instance). However, there is no distinct difference in the trend of the reconstructed pCO2 between the two curves.
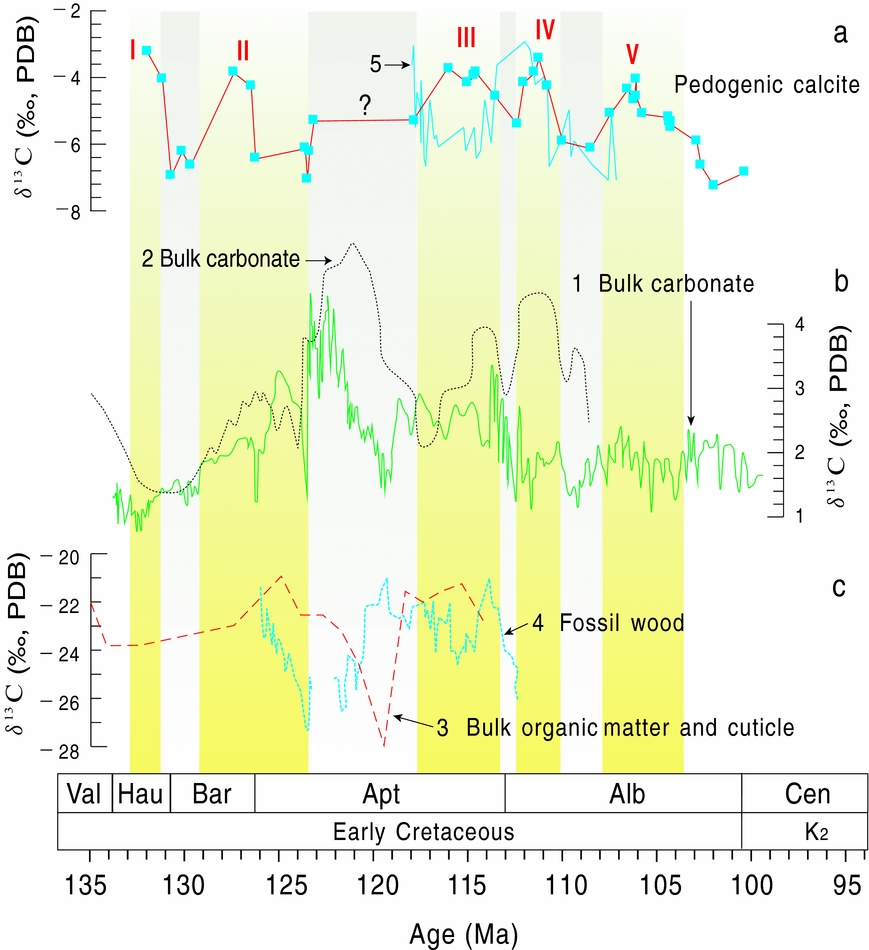
Figure 5. Correlation diagram of carbon isotope values from the Lower Cretaceous. Note that ages and stages are tuned to the time chart of Ogg, Hinnov & Huang (Reference Huang, Retallack and Wang2012) using biostratigraphical correlation. (a) Pedogenic calcite, this work, shown as unfilled rectangles; (b) bulk carbonate; and (c) bulk organic matter (plant cuticle and fossil wood). (1) Five-point moving average from bulk marine hemipelagic carbonate from Northern Tethys (Col de Palluel, SE France), derived from Moullade et al. (Reference Moullade, Kuhnt, Bergen, Masse and Tronchetti1998), Hennig, Weissert & Bulot (Reference Hennig, Weissert and Bulot1999), van de Schootbrugge et al. (Reference van de Schootbrugge, Föllmi, Bulot and Burns2000), Herrle et al. (Reference Herrle, Kößler, Friedrich, Erlenkeuser and Hemleben2004), Föllmi et al. (Reference Föllmi, Godet, Bodin and Linder2006) and Gale et al. (Reference Gale, Bown, Caron, Crampton, Crowhurst, Kennedy, Petrizzo and Wray2011). (2) Mainly pelagic bulk carbonate from other western Tethyan localities based on Weissert & Channell (Reference Weissert and Channell1989), Channell, Erba & Lini (Reference Channell, Erba and Lini1993), Erba et al. (Reference Erba, Channell, Claps, Jones, Larson, Opdyke, Premoli Silva, Riva, Salvini and Torricelli1999) and Herrle (Reference Herrle2002). (3) Bulk organic matter and cuticle after Jahren et al. (Reference Jahren, Arens, Sarmiento, Guerrero and Amundson2001): the lack of agreement between this and other curves is probably due to stratigraphic mis-assignment. (4) Fossil wood after Gröcke, Hesselbo & Jenkyns (Reference Gröcke, Hesselbo and Jenkyns1999). (5) Terrestrial calcrete after Ludvigson et al. (Reference Ludvigson, Joeckel, González, Gulbranson, Rasbury, Hunt, Kirkland and Madsen2010). Roman numerals and grey and yellow bands indicate cycles of repeated change in pedogenic carbon isotope values.
S(z) is a function of depth but is effectively constant below 50 cm, where carbonates are precipitated (e.g. Cerling, Reference Cerling1991; Cerling & Quade, Reference Cerling, Quade, Swart, Lohmann, McKenzie and Savin1993). Both the (peaty organic matter) horizon O and (organic–clay) soil horizon A were not commonly preserved above the subsurface of concretion horizon Bk within the Cretaceous palaeosol, i.e. over 30–50 cm had been eroded. We generally undertook sampling in the middle of the horizon Bk (>30 cm Table S1, available at http://journals.cambridge.org/geo), which means that the depth of formation of the calcrete samples in the examined Cretaceous palaeosols was generally deeper than 50 cm below the palaeosol surface, meeting the requirement for a constant value of S(z).
In earlier publications, a value of 5000 ppmV was often adopted for S(z) in palaeoatmospheric CO2 reconstructions. However, this value is much higher than those estimated by examination of plant stomata (e.g. Royer, Reference Royer2006; Fletcher et al. Reference Fletcher, Brentnall, Anderson, Berner and Beerling2008). Why this difference exists is not clear at present. Cerling (Reference Cerling1991) gave values for S(z) that were assumed to be 5000–10000 ppmV. Breecker, Sharp & McFadden (Reference Breecker, Sharp and McFadden2010) interpreted the large discrepancy of S(z) as due to large variations in atmospheric pCO2 over relatively short time periods as well as inaccurate proxy estimates. They therefore used carbon isotope ratios of Holocene calcic soil to recalculate and calibrate atmospheric pCO2 from a value of S(z) = 2500 ppmV, which agreed better with estimates from other proxies and the GEOCARB model. In this context, we also chose an S(z) of 2500 ppmV for calculating pCO2 at 25°C (cf. Tables S2–4, available at http://journals.cambridge.org/geo), which compares more closely to estimates derived from plant cuticle. Clearly, however, the trend of pCO2 over time is not altered by using different values of S(z), and relative changes in atmospheric composition are still illustrated.
For comparison, the new data are illustrated together with previously published reconstructions for Cretaceous pCO2 derived from both pedogenic calcite and stomatal indices of fossil plants (Figs 5, 6). The Cretaceous global composite curve of pCO2 from pedogenic calcite comprises data from North America, England, India, South Korea, Japan and Tibet (Tables S3–S4, available at http://journals.cambridge.org/geo).
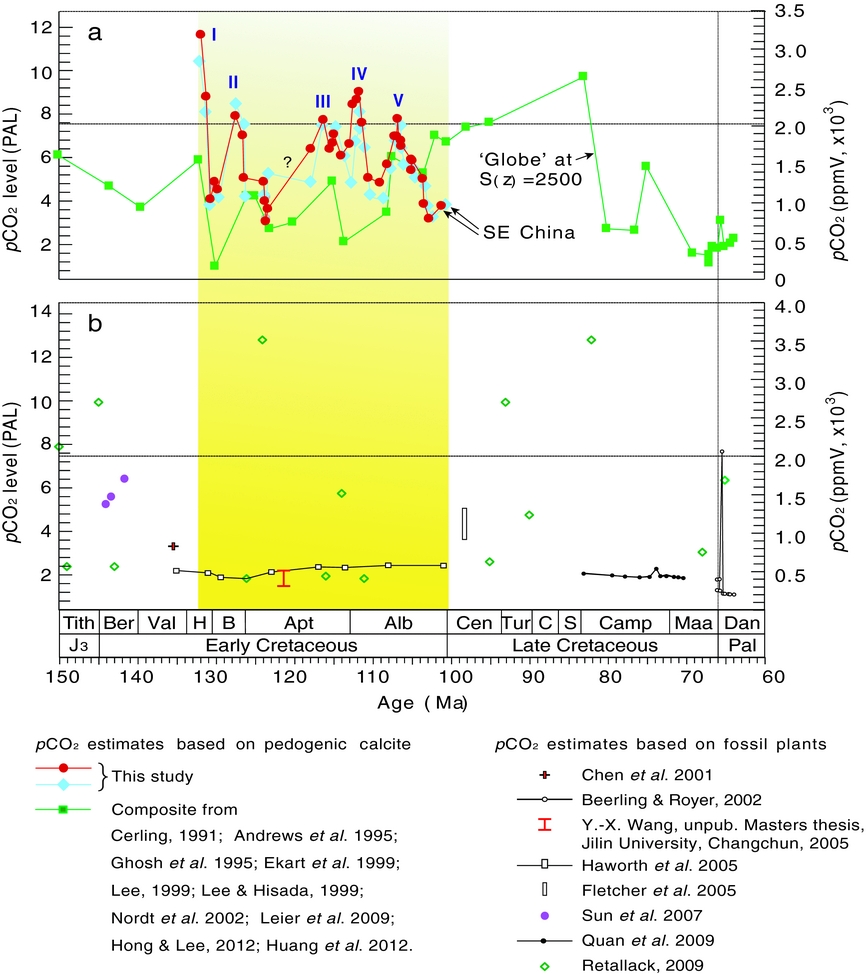
Figure 6. Comparison of the Cretaceous pCO2 estimates determined from (a) carbon isotope proxies of pedogenic calcretes and (b) stomata. The global curve is sourced from the northern hemisphere continents using S(z) = 2500 ppmV. For all parameters used for estimating pCO2 of the carbon isotopes of pedogenic calcite refer to Table 2 and Tables S3–S4 (available at http://journals.cambridge.org/geo) and for the fossil stomata refer to the references in the figure. All age data use the time scale of Ogg, Hinnov & Huang (Reference Huang, Retallack and Wang2012) to be consistent with previous studies. Pre-industrial atmospheric pCO2 level (PAL) is taken to be c. 275 ppmV. In (a), the curve of pCO2 marked by blue diamonds is estimated from the highly smoothed average of δ 13Cr from Ekart et al. (Reference Ekart, Cerling, Montañez and Tabor1999), and the curve marked by red circles is obtained from isotopic data of Tethyan pelagic sediments. See also Andrews, Tandon & Dennis (Reference Andrews, Tandon and Dennis1995), Ghosh, Bhattacharya & Jani (Reference Ghosh, Bhattacharya and Jani1995), Chen et al. (Reference Chen, Li, Chaloner, Beerling, Sun, Collinson and Mitchell2001), Fletcher et al. (Reference Fletcher, Beerling, Brentnall and Royer2005) and Y.-X. Wang, unpub. Masters thesis, Jilin University, Changchun (2005). Vertical yellow band indicates the time interval described in this study.
6. Results and discussion
6.a. Carbon isotope profiles
The carbon isotope profile shows that δ 13C values of calcites range from −3.0‰ to −7.0‰ (Figs 2, 5; Tables S2–S3, available at http://journals.cambridge.org/geo), as is typical for carbonate material of pedogenic origin (Fig. 4). Four complete and one incomplete increasing–decreasing stages of δ 13C values can be recognized: (I) early(?)–latest Hauterivian (c. 134–131 Ma); (II) earliest Barremian–early Aptian (c. 131–124 Ma); (III) early Aptian–earliest Albian (c. 124–113 Ma); (IV) earliest–middle Albian (c. 113–108 Ma); and (V) middle–late Albian (c. 108–102 Ma). Most stages have an estimated duration of c. 3.0–6 Ma.
Given the stratigraphic uncertainties, such patterns match global compilations in other materials in showing broad positive δ 13C excursions centred during late Barremian, latest Aptian and early Albian time (Fig. 5) and negative excursions during early Barremian, earliest Aptian and early and late Albian time: specifically, there is some level of agreement with isotopic records of bulk carbonate (Fig. 5b) from the Alpine Tethys and North Atlantic (e.g. Weissert, Reference Weissert1989; Erbacher, Thurow & Littke, Reference Erbacher, Thurow and Littke1996; Menegatti et al. Reference Menegatti, Weissert, Brown, Tyson, Farrimond, Strasser and Caron1998; Erba et al. Reference Erba, Channell, Claps, Jones, Larson, Opdyke, Premoli Silva, Riva, Salvini and Torricelli1999; Luciani, Cobianchi & Jenkyns, Reference Luciani, Cobianchi and Jenkyns2001; Herrle et al. Reference Herrle, Kößler, Friedrich, Erlenkeuser and Hemleben2004), the northern Tethys margin (Föllmi et al. Reference Föllmi, Godet, Bodin and Linder2006; Lorenzen et al. Reference Lorenzen, Kuhnt, Holbourn, Flögel, Moullade and Tronchetti2013) and the Middle East (Vahrenkamp, Reference Vahrenkamp, van Buchem, Al-Husseini, Maurer and Droste2010), from a shallow-water Pacific guyot (Jenkyns & Wilson, Reference Jenkyns and Wilson1999) and also with fossil wood (δ 13Corg; Fig. 5c) from southern Britain (Gröcke, Hesselbo & Jenkyns, Reference Gröcke, Hesselbo and Jenkyns1999; Robinson & Hesselbo, Reference Robinson and Hesselbo2004). Abruptly decreasing δ 13C values at the boundary of the Barremian and Aptian stages, the early and middle Aptian and the earliest Albian stages can be observed in both Chinese pedogenic calcrete and French (northern Tethys) marine carbonates.
However, relatively high δ 13C values seen in the middle and late Aptian and low δ 13C values in the transition between the middle and late Aptian of bulk marine carbonate from western Tethys and in bulk organic and cuticle from South America (cf. Fig. 5a–c) are not seen in the Chinese pedogenic record, possibly due to sparse availability of calcrete in the critical intervals. The somewhat higher δ 13C values in pedogenic calcite from SE China during late Aptian and earliest Albian time conform to trends recognized in bulk carbonate from the Alpine Tethys, Atlantic and Pacific regions (Menegatti et al. Reference Menegatti, Weissert, Brown, Tyson, Farrimond, Strasser and Caron1998; Jenkyns & Wilson, Reference Jenkyns and Wilson1999; Luciani, Cobianchi & Jenkyns, Reference Luciani, Cobianchi and Jenkyns2001; Herrle, Reference Herrle2002; Föllmi et al. Reference Föllmi, Godet, Bodin and Linder2006; Huber et al. Reference Huber, MacLeod, Gröcke and Kucera2011), bulk organic matter and plant cuticle from South America (Jahren et al. Reference Jahren, Arens, Sarmiento, Guerrero and Amundson2001) and fossil wood from southern England (e.g. Gröcke, Hesselbo & Jenkyns, Reference Gröcke, Hesselbo and Jenkyns1999; Robinson & Hesselbo, Reference Robinson and Hesselbo2004) and Japan (Ando et al. Reference Ando, Kakegawa, Takashima and Saito2003). Overall, Albian δ 13C values decrease relatively smoothly, albeit punctuated by a positive excursion, in bulk marine organic matter, bulk pelagic carbonate and fossil wood (Erbacher, Thurow & Littke, Reference Erbacher, Thurow and Littke1996; Bralower et al. Reference Bralower, Cobabe, Clement, Sliter, Osburn and Longoria1999; Luciani, Cobianchi & Jenkyns, Reference Luciani, Cobianchi and Jenkyns2004; Ando & Kakegawa, Reference Ando and Kakegawa2007), generally conforming to the pattern seen in the Chinese pedogenic calcrete.
Particularly noteworthy is the fact that absolute δ 13C values of pedogenic calcretes in SE China are similar to those of continental foreland-basin strata of the Cedar Mountain Formation in eastern Utah, USA (Ludvigson et al. Reference Ludvigson, Joeckel, González, Gulbranson, Rasbury, Hunt, Kirkland and Madsen2010) and to those of the middle Aptian–Albian fluvial–lacustrine facies of the Liupanshan Group in NW China (Li et al. Reference Li, Xu, Liu, Zhou, Wang, Sun and Liu2013). Two stages of increasing–decreasing δ 13C values can also be recognized in the δ 13C sequence of the late Aptian–early Albian interval from Utah (c. 118–110 Ma), although there are some differences that could be caused by errors in age assignment in either or both sequences.
6.b. Estimations and comparisons of pCO2
pCO2 values from the Chinese calcretes mostly range between 1000 and 2500 ppmV (Figs 6–8), supporting the idea of both atmospheric CO2 extremes and an accompanying greenhouse climate during mid-Cretaceous time based on δ18O and Mg/Ca ratios in well-preserved planktonic foraminifera (Bice & Norris, Reference Bice and Norris2002; Bice et al. Reference Bice, Birgel, Meyers, Dahl, Hinrichs and Norris2006). The proposed pCO2 levels are about 4–9 times the pre-industrial value of 275 ppmV and exceed this range during middle Hauterivian time (c. 132 Ma); an overall decrease in pCO2 values from Hauterivian time to the end of Albian time, albeit with major fluctuations, can be observed (Figs 6–8).

Figure 7. pCO2 relationships between Cretaceous models and pedogenic estimates. The model curve of Tajika (Reference Tajika1999) takes into account magma eruption and organic carbon burial rates; the Berner (Reference Berner1994) model is GEOCARB II; the Berner (Reference Berner2001) model is GEOCARB III; the Berner (Reference Berner2006) model is GEOCARBSULF; the Wallmann (Reference Wallmann2001) and Hansen & Wallmann (Reference Hansen and Wallmann2003) curves model the global carbon–calcium–strontium cycle of seawater and atmosphere and silicate weatherability. Blue diamonds and red circles are as in Figure 6.
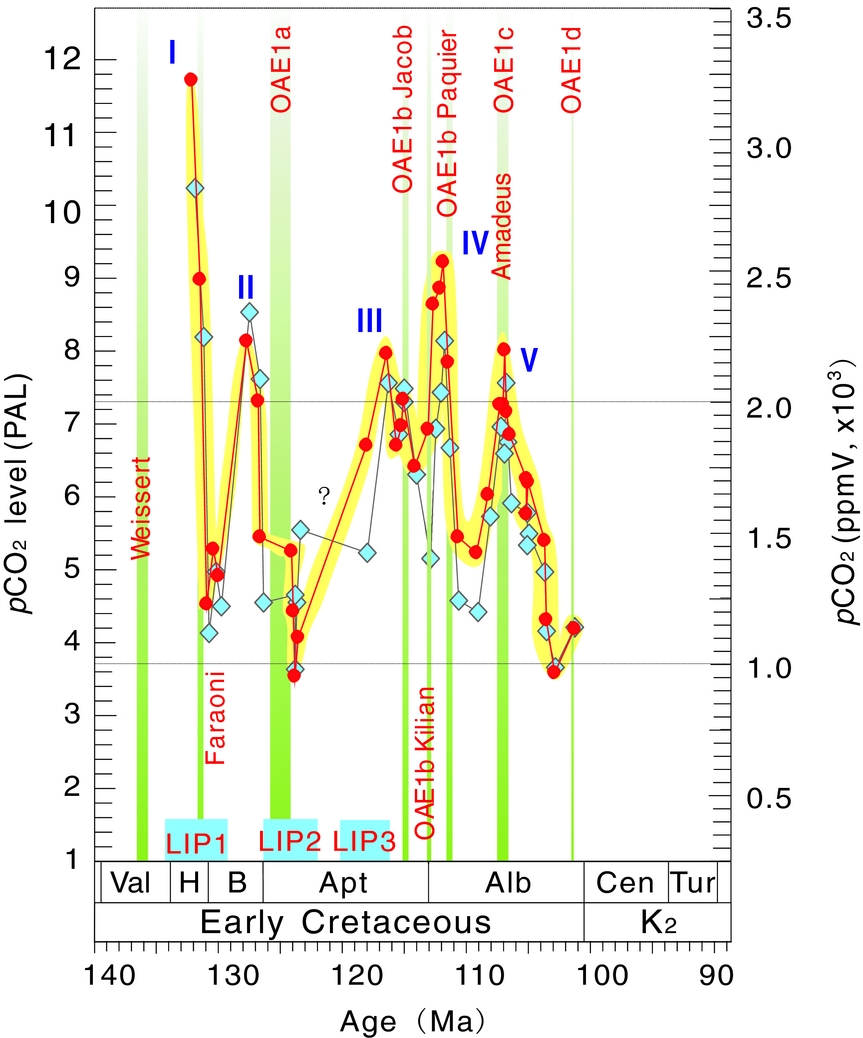
Figure 8. Ages of Cretaceous large igneous provinces (LIPs) and oceanic anoxic events (OAEs) in relation to the reconstructed Early Cretaceous pCO2 in SE China (symbols as in Fig. 6). LIP 1: 134–129 Ma, Paraná and Etendeka traps (Janasi, Freitas & Heaman, Reference Janasi, Freitas and Heaman2011) and Comei-Bunbury LIP (Zhu et al. Reference Zhu, Chung, Mo, Zhao, Niu, Song and Yang2009); LIP 2: 126–122 Ma, Ontong Java Plateau, Manihiki Plateau and Hikurangi Plateau (summary by Kuroda et al. Reference Kuroda, Tanimizu, Hori, Suzuki, Ogawa, Tejada, Coffin, Coccioni, Erba and Ohkouchi2011); LIP 3: 120–116 Ma, Kerguelen Plateau–Rajmahal traps (Wignall, Reference Wignall2001; Courtillot & Renne, Reference Courtillot and Renne2003). Weissert Event: 136.4–135.7 Ma, age data from Weissert & Lini (Reference Weissert, Lini, Müller, McKenzie and Weissert1991), Erba, Bartolini & Larson (Reference Erba, Bartolini and Larson2004), Ogg, Hinnov & Huang (Reference Huang, Retallack and Wang2012); Faraoni Event, 131.3–131.1 Ma, from Bodin et al. (Reference Bodin, Godet, Föllmi, Vermeulen, Arnaud, Strasser, Fiet and Adatte2006); OAE1a Selli/Goguel, 125.4–124.0 Ma, from summary of Ogg, Hinnov & Huang (Reference Huang, Retallack and Wang2012); OAE1b Jacob, 115.1–114.9 Ma, from Herrle et al. (Reference Herrle, Kößler, Friedrich, Erlenkeuser and Hemleben2004) and summary of Ogg, Hinnov & Huang (Reference Huang, Retallack and Wang2012); OAE 1b Kilian Event, 113.3–113.0 Ma, from summary of Reboulet et al. (Reference Reboulet, Rawson, Moreno-Bedmar, Aguirre-Urreta, Barragan, Bogomolov, Company, Gonzalez-Arreola, Stoyanova, Lukeneder, Matrion, Mitta, Randrianaly, Vasicek, Baraboshkin, Bert, Bersac, Bogdanova, Bulot, Latil, Mikhailova, Ropolo and Szives2011); OAE1b Paquier/Urbino, 111.3–111.1 Ma, from Gale et al. (Reference Gale, Bown, Caron, Crampton, Crowhurst, Kennedy, Petrizzo and Wray2011) and summary of Ogg, Hinnov & Huang (Reference Huang, Retallack and Wang2012); OAE1c Amadeus Segment, 107.2–106.7 Ma, from Leckie, Bralower & Cashman (Reference Leckie, Bralower and Cashman2002) and summary of Ogg, Hinnov & Huang (Reference Huang, Retallack and Wang2012); OAE1d Breistroffer, c. 101.1 Ma, from Erbacher, Thurow & Littke (Reference Erbacher, Thurow and Littke1996), Leckie, Bralower & Cashman (Reference Leckie, Bralower and Cashman2002) and summary of Ogg, Hinnov & Huang (Reference Huang, Retallack and Wang2012). Blue diamonds and red circles are as in Figure 6.
The reconstructed pCO2 is c. 20–50% higher than the 600–1200 ppmV (recalculated using S(z) = 2500) of the global composite (Fig. 4a). It is notable that reconstructed pCO2 from early–middle Albian time of SE China is 300–500 ppmV higher than that reconstructed from pedogenic calcretes in South Korea (Hong & Lee, Reference Hong and Lee2012); during late Albian time, however, similar levels of 1000–1500 ppmV are reconstructed from both regions. The cause of this discrepancy remains unknown, and may be partly attributed to large variations in atmospheric CO2 over relatively short time periods and inaccurate proxy estimates (Breecker, Sharp & McFadden, Reference Breecker, Sharp and McFadden2010). However, the fractionation factor between CO2 and precipitated calcite is dependent on temperature, global climate, palaeolatitude and palaeoelevation of formation of the different pedogenic calcites, and these factors may have played a role.
On the other hand, changes of pCO2 reconstructed for SE China and the global composite show similar trends: the major falls during late Hauterivian, early Aptian and latest Aptian time and rises during early Hauterivian, late Aptian and middle Albian time are approximately coeval (Fig. 6a). Differences in the curves are observed for the global falls and Chinese rises during early Hauterivian and earliest Albian time, and for the global rise and Chinese fall during late Albian time (Fig. 6a). Discrepancies between the global and Chinese curves can be attributed to low stratigraphic sample resolution and inaccurate dating of specimens used in the global composite. Nevertheless, the general correlation supports the view that the Chinese pedogenic carbonate calcretes are appropriate for reconstruction of ancient pCO2.
However, neither the pCO2 reconstructions from SE China nor the global composite readily match the stomatal-index data from fossil plants (cf. Fig. 6a, b). The pCO2 estimates of the Hauterivian–Albian interval based on stomata of the extinct conifer Pseudofrenelopsis in England and the United States (Haworth et al. Reference Haworth, Hesselbo, McElwain, Robinson and Brunt2005) are much lower than that reconstructed from the pedogenic calcite from SE China. Similar relative differences are seen when comparing Campanian pCO2 estimates from fossil cuticle of Ginkgo adiantoides from NE China (Quan et al. Reference Quan, Sun, Sun and Sun2009) with the pedogenic calcite from the global composite (Fig. 6a, b). The deviations between the stomatal and pedogenic calcrete pCO2 values must indicate inappropriate application of one or more parameters in the production of either one or both proxies, as well as possible dating errors of both plant material and calcrete. Significantly, pCO2 reconstructions from SE China have a similar general trend to those derived from δ 13C values of planktonic organic matter (Freeman & Hayes, Reference Freeman and Hayes1992), i.e. pCO2 was high during Early Cretaceous time (140–90 Ma) then fell thereafter. However, pCO2 values reconstructed from pedogenic calcrete are almost double those derived from organic matter.
The mid-Cretaceous pCO2 values determined from the Chinese deposits for some intervals are higher and for other intervals lower than those produced by modelling (Fig. 7; Berner, Reference Berner1994, Reference Berner2001, Reference Berner2006; Tajika, Reference Tajika1999; Wallmann, Reference Wallmann2001). Both the Chinese results and the data from GEOCARB III (Berner, Reference Berner2001) and GEOCARBSULF (Berner, Reference Berner2006) show a significant fall across the Hauterivian and Barremian stages (Fig. 5), indicating significant climate change over this interval. Secondly, a falling tendency during the late Aptian–Albian interval is observed after the increase of the early Aptian pCO2 values in GEOCARB III (Berner, Reference Berner2001) and GEOCARBSULF (Berner, Reference Berner2006), as well as in the weathering index curve (Wallmann, Reference Wallmann2001; Hansen & Wallmann, Reference Hansen and Wallmann2003) and the curve derived from magma eruption and organic carbon burial rate (Tajika, Reference Tajika1999). Thirdly, pCO2 values in the Chinese pedogenic curve are relatively high during the late Aptian–middle Albian interval, albeit punctuated by two periods of relatively low values.
There are several major discrepancies between our data and the modelling results (Fig. 7). The initiation of the modelled fall in pCO2 values started in Valanginian time and reached a minimum in Hauterivian (Tajika, Reference Tajika1999; Berner, Reference Berner2001, Reference Berner2006) or Barremian time (Wallmann, Reference Wallmann2001; Hansen & Wallmann, Reference Hansen and Wallmann2003), earlier than indicated by the Chinese pedogenic studies (Fig. 7). Furthermore, at the time of the lowest modelled value in middle Barremian time (Tajika, Reference Tajika1999; Hansen & Wallmann, Reference Hansen and Wallmann2003), relatively high values are indicated by the data from China. This discrepancy could be attributed to relatively low resolution in the time increments examined in the generation of the models, such that distinct periodic changes in Aptian–Albian pCO2 values reconstructed from pedogenically derived data are not captured (cf. Robinson et al. Reference Robinson, Andrews, Hesselbo, Radley, Dennis, Harding and Allen2002). In addition, the secular decrease in pCO2 reconstructed from Chinese pedogenic carbonates began in middle Albian time, c. 3–4 Ma earlier than those derived from modelling.
6.c. Explanations for rapid pCO2 change
Regardless of the absolute values, a key point of our results is the rapid changes of pCO2 registered during late Early Cretaceous time. Five rising–falling intervals are evident, similarly for changes in δ 13C values, namely during early(?)–middle Hauterivian time (c. 131 Ma), early Barremian–earliest Aptian time (c. 131–124 Ma) and earliest–latest Aptian time (c. 124–113 Ma). The absence of pedogenic data during early–middle Aptian time shows that intervals of rapid pCO2 change may have been missed during earliest–middle Albian time (c. 113–108 Ma) and middle–late Albian time (c. 108–102 Ma); these intervals are numbered as events or periods I–V (Figs 6–8). Both the rapid rises and falls in pCO2 occurred over intervals of c. 1–3 Ma, implying rapid changes in atmospheric composition and climatic fluctuations during this time rather than relatively high and largely invariant mid-Cretaceous pCO2 conditions implied by many models (e.g. Berner, Reference Berner2001, Reference Berner2006; Wallmann, Reference Wallmann2001; Hansen & Wallmann, Reference Hansen and Wallmann2003; Hong & Lee, Reference Hong and Lee2012).
Substantial local sources of volcanogenic CO2 over the interval in question could potentially include the late Mesozoic volcano-magmatic activity of the so-called late ‘Yanshanian’ sub-period in China (e.g. Ren & Chen, Reference Ren and Chen1989; Zhang, Reference Zhang1998). In SE China, four periods of Cretaceous volcanism have been distinguished: 145–140 Ma, 130–125 Ma, 125–117 Ma and 117–105 Ma by K–Ar, Ar–Ar and Rb–Sr methods (Li, Shen & Wang, 1989). These latter three periods have been partly confirmed by zircon U–Pb dating (Wang et al. Reference Wang, Zhou, Qiu and Fan2000; Fig. 2). Local volcanic eruption periods of 130–125 Ma and 117–105 Ma could correlate with the rising–falling stages II and III–V of pCO2, respectively. The original volume of volcanic rocks and their degassing rate cannot be established, however, meaning that the relative importance of local volcanism in controlling pCO2 is unknown. Furthermore, any cause-and-effect relationship between volcanism and pCO2 remains uncertain in the absence of more precise dating.
As shown in Figures 6–8, our reconstructed model of rapid rises and falls in atmospheric pCO2 during mid-Cretaceous time (five times within c. 30 Ma) seems consistent with the model of atmospheric CO2 based on pedogenic calcretes (Schaller, Wright & Kent, Reference Schaller, Wright and Kent2011), linked to the formation of the Late Triassic–Early Jurassic central Atlantic magmatic province (CAMP), except in the magnitude of the inferred changes. The reconstruction of pre-CAMP atmospheric composition is of pCO2 values of c. 2000 ppm that were subsequently increased to c. 4400 ppm (S(z) = 3000±1000 ppmV) immediately after the extrusion of the first volcanic unit that was presumably accompanied by effusion of volcanogenic CO2. Subsequently, there was a steady decrease in pCO2 towards pre-eruptive levels over the subsequent 0.3 Ma, interpreted as due to the effect of silicate weathering.
During the greenhouse Cretaceous Period a number of large igneous provinces (LIPs) were formed. Major volcanic pulses of Early Cretaceous LIPs took place around the interval 134–129 Ma (LIP1, Paraná and Etendeka traps and Comei-Bunbury LIP, onset 134 Ma, Janasi, Freitas & Heaman, Reference Janasi, Freitas and Heaman2011; mean 132 Ma, Zhu et al. Reference Zhu, Chung, Mo, Zhao, Niu, Song and Yang2009), 126–122 Ma (LIP2, Ontong Java Plateau, Manihiki Plateau and Hikurangi Plateau, end of Barremian time through early Aptian time; Kuroda et al. Reference Kuroda, Tanimizu, Hori, Suzuki, Ogawa, Tejada, Coffin, Coccioni, Erba and Ohkouchi2011) and 120–116 Ma (LIP3, Kerguelen Plateau–Rajmahal traps, mean c. 118 Ma; Wignall, Reference Wignall2001; Courtillot & Renne, Reference Courtillot and Renne2003). If we ignore the possible errors in dating of these volcanic edifices it is apparent that the intervals of rapid pCO2 rise do not correspond in timing to the formation of Early Cretaceous LIPs (Fig. 8), whose extrusion would have been accompanied by large volumes of CO2 (e.g. Arthur, Dean & Schlanger, Reference Arthur, Dean, Schlanger, Sundquist and Broecker1985; Coffin & Eldholm, Reference Coffin and Eldholm1993; Larson & Erba, Reference Larson and Erba1999). However, the extrusion periods of LIP1, LIP2 and LIP3 overlap with intervals of relatively rapid change in atmospheric pCO2 as reconstructed from the Chinese record (Fig. 8). For example, reconstructed pCO2 is particularly high during middle Hauterivian time and then falls to a relative minimum at the end of the stage, during which time extrusion of LIP1 apparently continued. The overall age of LIP eruptions is also incompatible with reconstructed Albian rising pCO2 from the pedogenic record of South Korea (Hong & Lee, Reference Hong and Lee2012). It is possible that the release of sediment-derived gases had a far greater impact on the environment than the emission of magmatic gases (Ganino & Arndt, Reference Ganino and Arndt2009). It is therefore reasonable to believe that factors such as weathering rate, oceanic anoxic events (OAEs, carbon burial and CO2 drawdown), degassing of magmatic bodies and dissociation of gas hydrates could have combined to generate a rapid change of pCO2; volcanism was but one factor behind the elevation of pCO2 values during the Early Cretaceous greenhouse period.
The Early–Middle Cretaceous Period was characterized by both major OAEs and more parochial environmental perturbations (Fig. 8), evidenced by relatively elevated depositional rates of marine organic matter and disturbances in the carbon isotope record that can manifest themselves as either positive or negative excursions. At its simplest, positive excursions should indicate burial of large amounts of organic matter and CO2 drawdown; negative excursions should indicate injection of isotopically light carbon into the ocean–atmosphere system by addition of CH4/CO2. Such phenomena, commonly linked stratigraphically, are recorded from the late Valanginian (Weissert Event), latest Hauterivian (Faraoni Event), the early Aptian (OAE1a, Selli Event), the late Aptian (part of OAE1b, Jacob Event), the Aptian–Albian boundary (part of OAE 1b, Kilian Event), the early Albian (part of OAE1b, Paquier/Urbino Event), a possible middle Albian event (OAE1c, Jassines/Amadeus Event) and the late Albian (OAE1d, Breistroffer Event). They have been viewed as a response to ‘ultrathermal’ climatic conditions that forced increased silicate weathering, enhanced fluvial nutrient supply accompanied by vigorous upwelling and consequently increased plankton productivity and carbon flux to the seafloor, in some cases accompanied by introduction of isotopically light carbon from a crustal/sedimentary reservoir (Schlanger & Jenkyns, Reference Schlanger and Jenkyns1976; Arthur et al. Reference Arthur, Brumsack, Jenkyns, Schlanger, Ginsburg and Beaudoin1990; Jenkyns, Reference Jenkyns2003, Reference Jenkyns2010; Herrle et al. Reference Herrle, Kößler, Friedrich, Erlenkeuser and Hemleben2004; Blättler et al. Reference Blättler, Jenkyns, Reynard and Henderson2011; Gale et al. Reference Gale, Bown, Caron, Crampton, Crowhurst, Kennedy, Petrizzo and Wray2011; Reboulet et al. Reference Reboulet, Rawson, Moreno-Bedmar, Aguirre-Urreta, Barragan, Bogomolov, Company, Gonzalez-Arreola, Stoyanova, Lukeneder, Matrion, Mitta, Randrianaly, Vasicek, Baraboshkin, Bert, Bersac, Bogdanova, Bulot, Latil, Mikhailova, Ropolo and Szives2011; Bottini et al. Reference Bottini, Cohen, Erba, Jenkyns and Coe2012; Petrizzo et al. Reference Petrizzo, Huber, Gale, Barchetta and Jenkyns2012). With OAEs, it is important to note that the run-up to the event itself generally correlates with rising global temperatures, but that the resulting widespread carbon burial and associated silicate weathering results in drawdown of CO2 and an inverse greenhouse effect (Jenkyns, Reference Jenkyns2010). The prediction would therefore be for rising pCO2 before such an event and falling pCO2 after: distinct minima following pronounced maxima are potentially within range of both the Hauterivian Faraoni Event and the early Aptian OAE1a, given the uncertainties in the dating (Fig. 8).
Palaeotemperature data are necessarily regional: of note is evidence for early Barremian warming and late Barremian cooling from oxygen isotope values of north European belemnites (Podlaha, Mutterlose & Veizer, Reference Podlaha, Mutterlose and Veizer1998; Malkoč & Mutterlose, Reference Malkoč and Mutterlose2010). These may be identifiable in the pedogenic pCO2 record (Fig. 8), although these shifts cannot be readily disentangled from those of early Aptian shifts. A number of oxygen isotope studies of different parts of the world, together with palynological data from the Russian Platform and elsewhere, suggest globally increasing temperatures prior to the early Aptian OAE 1a followed by cooling (Menegatti et al. Reference Menegatti, Weissert, Brown, Tyson, Farrimond, Strasser and Caron1998; Hochuli et al. Reference Hochuli, Menegatti, Weissert, Riva, Erba and Premoli Silva1999; Price, Reference Price2003; Weissert & Erba, Reference Weissert and Erba2004; Ando et al. Reference Ando, Kaiho, Kawahata and Kakegawa2008; Zakharov et al. Reference Zakharov, Baraboshkin, Weissert, Michailova, Smyshlyaeva and Safronov2013); the movement of palaeotemperatures through the latter half of the Aptian appears, however, to be relatively modest. High-resolution indicators for drops in temperature of a few degrees during the early Aptian OAE1a itself derives from Pacific and Southern Ocean TEX86 records (Dumitrescu et al. Reference Dumitrescu, Brassell, Schouten, Hopmans and Sinninghe Damsté2006; Jenkyns et al. Reference Jenkyns, Schouten-Huibers, Schouten and Sinninghe-Damsté2012) and from bulk-rock carbon and oxygen isotope data of a French marly subtropical intra-shelf basin (Kuhnt, Holbourn & Moullade, Reference Kuhnt, Holbourn and Moullade2011) as well as from n-alkanes of biomarkers from the Cismon section, Italy (Méhay et al. Reference Méhay, Keller, Bernasconi, Weissert, Erba, Bottini and Hochuli2009). However, only a modest drop in pCO2 (based on comparative carbon isotope stratigraphy of algal biomarkers and bulk carbonate) was suggested for this interval by Heimhofer et al. (Reference Heimhofer, Hochuli, Herrle, Andersen and Weissert2004). The inferred drop in global temperature around the Aptian–Albian boundary (potentially defined by the Kilian Event), based on the high-latitude occurrence of glendonites, oxygen isotope data from Argentinian belemnites and cool-water biota (Kemper, Reference Kemper1987; Pirrie et al. Reference Pirrie, Marshall, Doyle and Riccardi2004; Mutterlose, Bornemann & Herrle, Reference Mutterlose, Bornemann and Herrle2009), supports the relatively low pCO2 values reconstructed from the pedogenic record (Fig. 8). Available palaeotemperature data show a modest short-term rise during deposition of the Aptian–Albian boundary black shale, however (Kilian equivalent, in the Atlantic Ocean; Wagner et al. Reference Wagner, Herrle, Sinninghe Damsté, Schouten, Stüsser and Hofmann2008; stratigraphy reassigned by Huber & Leckie, Reference Huber and Leckie2011; Petrizzo et al. Reference Petrizzo, Huber, Gale, Barchetta and Jenkyns2012). Changes such as these are clearly not resolvable with the current pedogenic record. Relatively low δ 13C values for OAE1d during late Albian time were recorded from foraminiferal tests at ODP Site 1052, Blake Nose, western Atlantic (Wilson & Norris, Reference Wilson and Norris2001) and from both bulk organic matter and charcoals at Rose Creek Pit, Nebraska, Western Interior Basin, USA (Gröcke et al. Reference Gröcke, Ludvigson, Witzke, Robinson, Joeckel, Ufnar and Ravn Robert2006), correlating with low pCO2 derived from Chinese pedogenic calcites.
A δ 13Corg curve recorded from fossil wood from Hokkaido, Japan well illustrates the negative excursion characteristic of OAE 1a. This is followed by a positive excursion, above which there is a generally falling trend interrupted by a positive excursion around the Aptian–Albian boundary with values irregularly declining higher in the section (Ando & Kakegawa, Reference Ando and Kakegawa2007). Such an isotopic profile shows a limited degree of compatibility with the pCO2 trend derived from Chinese calcretes, again underscoring the complexities of the controls on levels of atmospheric carbon dioxide.
7. Summary and conclusions
The analysis of carbon isotopes from Lower Cretaceous pedogenic calcretes from SE China has yielded the following results and conclusions.
-
1. The δ 13C values of the pedogenic calcites range from –7.0‰ to –3.0‰. Four complete and one half (increasing–decreasing) excursions of δ 13C can be recognized: (I) early(?)–middle Hauterivian (c. 134–131 Ma); (II) early Barremian–earliest Aptian (c. 130–124 Ma); (III) earliest–latest Aptian (c. 124–113 Ma); (IV) earliest–middle Albian (c. 113–108 Ma); and (V) middle–late Albian (c. 108–102 Ma). During Barremian and late Aptian–earliest Albian time, the higher δ 13C values in pedogenic calcite from SE China conform to trends recognized in bulk carbonate from the Alpine Tethys, bulk organic matter and plant cuticle from South America and fossil wood from southern England and Japan.
-
2. Reconstructed pCO2 from pedogenic carbonates of Hauterivian–Albian age mostly range from 1000 to 2500 ppmV at S(z) = 2500 ppmV (4–9 times pre-industrial values), much higher than that reconstructed from coeval stomatal indices in fossil plants and 20–50% higher than the 600–1200 ppmV of the global composite curve. These results are, however, more consistent with those produced by modelling.
-
3. Rapid rises in pCO2 identified for the individual 2–3 Ma interval of early Hauterivian (c. 134–132 Ma), early Barremian (c. 130–127 Ma), middle Aptian (c. 124–121 Ma), earliest Albian (c. 113–111 Ma) and middle Albian (c. 109–107 Ma) time and succeeding rapid falls imply major rapid climatic fluctuations during this time.
-
4. The changes in pCO2 cannot be attributed to local volcanism and do not coincide exactly with the development of LIPs, whose formation could have vented large volumes of carbon dioxide into the atmosphere.
-
5. There is no simple relationship between estimated pCO2 and global carbon isotope curves. This demonstrates that carbon burial is not the only factor controlling the quantity of carbon dioxide in the atmosphere, and that silicate weathering could also have been responsible for drawdown of this greenhouse gas. Degassing from the extrusion of LIPs together with dissociation of gas hydrates may have induced transient high pCO2 values. It is suggested that the combination of these various factors could have led to rapid and repeated changes of pCO2 during Early Cretaceous time.
Acknowledgments
We are grateful to the reviewers for their helpful comments and constructive suggestions. Drs Sijing Liang and Sidun Chen are thanked for participating in the field work. We also thank National Natural Science Foundation of China (Climatic changes and atmospheric CO2 concentration estimate of the Cretaceous–Palaeogene from South China: 41372106) and National Basic Research Program of China (973 Program) 2012CB822003 for supporting this work.


