


1. Introduction
The Ossa Morena Zone is one of the zones of the Iberian massif which is considered to have become accreted to the Iberian autochthonous terrane during the Cadomian Orogeny (e.g. Quesada, Reference Quesada2006; Ribeiro et al. Reference Ribeiro, Munhá, Dias, Mateus, Pereira, Ribeiro, Fonseca, Araújo, Oliveira, Romão, Chaminé, Coke and Pedros2007, Reference Ribeiro, Munhá, Fonseca, Araújo, Pedro, Mateus, Tassinari, Machado and Jesus2010). However, the time of accretion of the Ossa Morena Zone is not consensual among the scientific community. Some authors consider that the accretion is of Variscan age (e.g. Matte, Reference Matte2001; Simancas et al. Reference Simancas, Martínez Poyatos, Expósito, Azor and González Lodeiro2001, Reference Simancas, Carbonell, González Lodeiro, Pérez Estaún, Juhlin, Ayarza, Kashubin, Azor, Martínez Poyatos, Almodóvar, Pascual, Sáez and Expósito2003). To the north, the Ossa Morena Zone is limited by the Coimbra–Cordoba Shear Zone (CCSZ) which is considered a Cadomian suture, reactivated as a Variscan flower structure. To the south, the suture between the Ossa Morena Zone and the South Portuguese Terrane corresponds to the SW Iberia Variscan suture (Munhá et al. Reference Munhá, Oliveira, Ribeiro, Oliveira, Quesada and Kerrich1986; Quesada et al. Reference Quesada, Fonseca, Munhá, Oliveira and Ribeiro1994; Fonseca, Reference Fonseca1995; Fonseca et al. Reference Fonseca, Munhá, Pedro, Rosas, Moita, Araújo and Leal1999; Ribeiro et al. Reference Ribeiro, Munhá, Dias, Mateus, Pereira, Ribeiro, Fonseca, Araújo, Oliveira, Romão, Chaminé, Coke and Pedros2007, Reference Ribeiro, Munhá, Fonseca, Araújo, Pedro, Mateus, Tassinari, Machado and Jesus2010).
The Ossa Morena Zone is characterized by a polyphase ductile deformation and metamorphism resulting in regional shear zones, with a NW–SE orientation materialized by schistosity (Araújo et al. Reference Araújo, Piçarra Almeida, Borrego, Pedro, Oliveira, Dias, Araújo, Terrinha and Kullerberg2013) and affected by weak crenulation. The intensity of the deformation increases in the direction of the major shear zone, the Coimbra–Cordoba Shear Zone (Fig. 1). The last ductile deformation phase is dated at 306 Ma (Moita et al. Reference Moita, Munhá, Fonseca, Pedro, Tassinari, Araújo and Palácios2005; Ribeiro et al. Reference Ribeiro, Munhá, Dias, Mateus, Pereira, Ribeiro, Fonseca, Araújo, Oliveira, Romão, Chaminé, Coke and Pedros2007).

Figure 1. Simplified geological map of the SEPC and its host rocks.
Three main Variscan metamorphic-igneous domains are recognized in the Ossa Morena Zone (Portuguese part), from the north to the south: the NE Alentejano Massif; the Évora Massif; and the Beja Igneous Complex (Pereira et al. Reference Pereira, Silva, Solá, Chichorro, Moita, Santos, Apraiz, Ribeiro, Linnemann, Nance, Kraft and Zulauf2007).
The Variscan magmatism from Beja Igneous Complex is typically calc-alkaline with a continental margin arc signature, being directly and indirectly related to the subduction of the Rheic Ocean (e.g. Jesus et al. Reference Jesus, Munhá, Mateus, Tassinari and Nutman2007; Pin et al. Reference Pin, Fonseca, Paquette, Castro and Matte2008; Lima, Reference Lima2013). The calc-alkaline plutonic bodies are complex, usually zoned and have small sizes.
The Ossa Morena Zone magmatism from the other metamorphic-igneous domains (NE Alentejano Massif and Évora Massif) is characterized by the appearance of gabbroic rocks associated with basic and acid rocks and to volcanic and subvolcanic events (Sanchez-Carretero et al. Reference Sanchez-Carretero, Eguiluz, Pascual, Carracedo, Dallmeyer and García1990). The work done by several authors on the magmatism of the Ossa Morena Zone (e.g. Lopes et al. Reference Lopes, Munhá, Wu and Oliveira1998; Moita, Santos & Pereira, Reference Moita, Santos and Pereira2009; Lima, Reference Lima2013; Pereira et al. Reference Pereira, Silva, Solá, Chichorro, Dias, Araújo, Terrinha and Kullerberg2013) has provided good geological mapping, geochemistry and petrography of these granites; however, the relationship between their emplacement and regional tectonics has so far remained unknown.
In this paper the characterization of the magnetic fabric for the Santa Eulália Plutonic Complex (SEPC), located in the NE Alentejano Massif, is carried out as part of a multidisciplinary study to examine the structural patterns of the pluton, the redox conditions of the magma genesis and the role of magma dynamics-related deformation of the Ossa Morena Zone.
The SEPC is a late Variscan granite massif with an elliptical outline intersecting the NW–SE Variscan dominant regional structures in the most northerly sectors of the Ossa Morena Zone. The SEPC is a ring complex composed, from the rim to the core, of a medium- to coarse-grained pink granite (G0-type) with biotite (±hornblende) as the dominant mafic mineral. This composition involves large (kilometre-scale) elongated masses of mafic (gabbroic) to intermediate (granodioritic) rocks, here referred to as the M-group, and a central grey medium-grained granite (G1-type) which is typically biotitic. The latter sometimes shows a slight porphyritic tendency, especially in a few outcrops located near the contact with the peripheral G0-type ring (Lopes, Lopes & Lisboa, Reference Lopes, Lopes and Lisboa1997; Lopes et al. Reference Lopes, Munhá, Wu and Oliveira1998; Menéndez et al. Reference Menéndez, Azor, Pereira and Acosta2006).
The petrophysical characterization of the SEPC presented here comprises anisotropy of magnetic susceptibility and isothermal remanent magnetization analyses. These methods have already been applied in Portuguese plutons of the Central Iberian Zone (e.g. Sant’Ovaia et al. Reference Sant’Ovaia, Bouchez, Noronha, Leblanc and Vigneresse2000, Reference Sant’Ovaia, Olivier, Ferreira, Noronha and Leblanc2010; Dória et al. Reference Dória, Sant’Ovaia, Ribeiro and Alves2009; Martins, Sant’Ovaia & Noronha, Reference Martins, Sant’Ovaia and Noronha2009, Reference Martins, Sant’Ovaia and Noronha2013; Martins et al. Reference Martins, Sant’Ovaia, Abreu, Oliveira and Noronha2011). Anisotropy of magnetic susceptibility studies may be used to characterize and measure weak anisotropic fabrics (foliations and lineations), either magmatic or solid-state. These are essential for describing the fabric of a granite, identifying the constraints leading to the granite intrusion and linking these features to the regional tectonics (e.g. Hrouda, Reference Hrouda1982; Borradaile, Reference Borradaile1988; Borradaile & Henry, Reference Borradaile and Henry1997; Bouchez, Reference Bouchez, Bouchez, Hutton and Stephens1997). Isothermal remanent magnetization analysis provides information about the magnetic carriers. These data are complemented by the study of the microstructures. Since the magnetic fabric provides structural information restricted to the exposure level of the complex, two-dimensional (2D) gravity modelling was also performed to obtain information about the geometry and location of the feeder zones. Finally, in order to understand the microfracturation geometry and the brittle stress constraints, microscopic observations of the geometry of the fluid-inclusion planes and the chemical characterization of the palaeofluid trapped in the healed microcracks from the studied lithologies were made.
2. Geological setting
2.a. General framework
The Santa Eulália Plutonic Complex (SEPC) is a granitic body that occupies an area of 400 km2 and is located in the northern part of the Ossa Morena Zone of the Variscan Iberian sector, near the limit of the Central Iberian Zone. Available geochronologic Rb–Sr data indicate an age of 290 Ma (Pinto, Reference Pinto1984).
This sector is characterized by a Variscan sinistral transpressive/transtensive tectonic regime; processes that co-existed together occurred separately in neighbouring regions by the means of strain partitioning (Araújo et al. Reference Araújo, Piçarra Almeida, Borrego, Pedro, Oliveira, Dias, Araújo, Terrinha and Kullerberg2013) which is materialized by the Coimbra–Cordoba Shear Zone (CCSZ) and associated strike-slip faults, namely Assumar and Alter do Chão structures (Fig. 1).
The SEPC is limited to the northeast by the CCSZ and to the southwest by the Juromenha vertical fault (Araújo et al. Reference Araújo, Piçarra Almeida, Borrego, Pedro, Oliveira, Dias, Araújo, Terrinha and Kullerberg2013). The Assumar and Alter do Chão faults separate two structural domains: the blastomylonitic structural domain to the northeast and the São Saturnino – Juromenha domain (e.g Araújo et al. Reference Araújo, Piçarra Almeida, Borrego, Pedro, Oliveira, Dias, Araújo, Terrinha and Kullerberg2013; Lopes et al. Reference Lopes, Carrilho, Sant’Ovaia, Nogueira and Ribeiro2013) to the southwest. The blastomylonitic domain is a sinistral transcurrent Variscan shear zone composed of metasedimentary and meta-igneous rocks (e.g. Oliveira, Oliveira & Piçarra, Reference Oliveira, Oliveira and Piçarra1991; Araújo et al. Reference Araújo, Piçarra Almeida, Borrego, Pedro, Oliveira, Dias, Araújo, Terrinha and Kullerberg2013), slightly deflected by the SEPC. The São Saturnino – Juromenha structural domain corresponds to a NW–SE-directed shear zone which preserves a complex sequence of transtensive and transpressive events (Lopes et al. Reference Lopes, Carrilho, Sant’Ovaia, Nogueira and Ribeiro2013). To the east, the SEPC is limited by a major NNE–SSW-oriented tectonic structure known as the Messejana fault. This fault has a complex tectonic history, as an initial late Variscan left-lateral strike-slip fault later reactivated as a transtensional fault allowing the emplacement of Triassic–Jurassic magmas (Schermerhorn et al. Reference Schermerhorn, Priem, Boelrijk, Hebeda, Verdurmen and Verschure1978).
The host rocks of the SEPC are composed of upper Proterozoic – lower Palaeozoic low- to high-grade metamorphic rocks. East of the SEPC, the host rocks are metasedimentary siliciclastic with black cherts of Ediacaran age referred to as ‘Série Negra’, and some intercalations of alkaline rocks. This low-grade unit is adjacent to a high-grade unit with migmatites and gneiss to the northeast. In the north, south and west of the SEPC, a low-grade metasedimentary and metavolcanic Cambrian sequence is composed of quartz-pelitic, carbonate and volcanic rocks. The roof pendants, spatially associated with G0-type rocks, show internal structure and lithological diversity consistent with the external metasedimentary and meta-igneous units.
To both the east and west, the host rocks comprise phyllite and quartz-phyllite in chlorite zone conditions without any thermal effects, even at a short metric distance from the contact. Further, the Cambrian carbonate rocks cropping out in narrow bands near the ESE border of SEPC do not show any post-kinematic thermal effect. The igneous and meta-igneous rocks (granites, migmatites, gneiss, gabbros, hyper-alkaline rocks, basic and acid volcanite) do not present thermal effects as expected, because these rocks are mineralogically and texturally stable at high temperatures. Unlike in the western sector of SEPC, the thermal effects are well marked in the metasedimentary roof pendants by metamorphic and metasomatic paragneisses in pelitic and carbonate hornfels. The latter show large wollastonite crystals (Dória et al. Reference Dória, Ribeiro, Sant’Ovaia and Fernandes2011; Cruz, Ribeiro & Sant’Ovaia, Reference Cruz, Ribeiro and Sant’Ovaia2013; Ribeiro, Cruz & Martins, Reference Ribeiro, Cruz and Martins2013).
2.b. Major and trace element geochemistry
The SEPC has two main granites which present different compositions and textures, exhibiting gradual contacts in the field. From the rim to the core, this ring plutonic complex is composed of G0 involving the M-group rocks, then passes to G1, the central grey monzonitic granite (Fig. 1).
Elemental geochemistry confirms important differences between M, G1 and G0 types. The mafic to intermediate rocks of the M-group (olivine gabbros to granodiorites) are metaluminous and present wide compositions: 3.34–13.51 wt% MgO; 0.70–7.20 ppm Th; 0.84–1.06 Eu* (chondritic normalized values between Sm and Tb). The G1-type are typically monzonitic granites with a slight peraluminous character and represent the less evolved granitic rocks: 0.65–1.02% MgO; 13.00–16.95 ppm Th; and 0.57–0.70 Eu*. The G0 granites are the most evolved magmatic rocks of the SEPC with a dominant metaluminous character and strongly differentiated compositions: 0.00–0.62 MgO; 15.00–56.00 Th; and 0.19–0.42 Eu*. According to SiO2 v. (Na2O+K2O–CaO) relationships (e.g. Frost et al. Reference Frost, Barnes, Collins, Arculus, Ellis and Frost2001; Frost & Frost, Reference Frost and Frost2011) the SEPC shows a calc-alkaline character, but a few samples of the G0 group reach the alkali-calcic field. On the basis of SiO2 v. FeOt/(FeOt+MgO) correlation (Fig. 2), the SEPC (M–G1–G0) plutonic association should be classified as magnesian (Frost et al. Reference Frost, Barnes, Collins, Arculus, Ellis and Frost2001; Frost & Frost, Reference Frost and Frost2011).

Figure 2. SiO2 v. FeOt/(FeOt/MgO) discriminant diagram for SEPC representative samples.
2.c. Petrography and microstructures
In the G0-type the main mineral assemblage observed includes quartz (26–39%), K-feldspar (36–53%), plagioclase (13–28%), biotite (5–19%) and amphibole (<2%). As accessory minerals, allanite, zircon and sphene are present. Quartz occurs as anhedral to subhedral grains. The biotite appears partially to completely chloritized with pleochroic halos of associated zircon and sphene. The plagioclases occur as altered megacrystals with a well-marked zonation. Myrmekitic intergrowths are common in the borders of plagioclases when in contact with K-feldspar. The K-feldspar, perthitic orthoclase and microcline occur as heterogranular crystals. Microcline also occurs as interstitial crystals with well-developed twins. The albitization of feldspar is common either inside the crystals or in their borders. The amphibole is hornblende and presents a chlorite alteration. The microstructures observed are quartz subgrain boundaries, sometimes folded biotites and occasionally bent plagioclase twin planes.
As the main mineralogical assemblage, the G1-type contains quartz (22–33%), plagioclase (29–40%), K-feldspar (16–27%), biotite (6–15%) and muscovite (2–16%). As accessory minerals, zircon and apatite are present. The quartz grains are anhedral and with a slight deformation. The biotite is partially to fully chloritized and presents zircon pleochroic halos. The K-felsdpar is orthoclase, generally perthitic and microcline. The muscovite is more frequent when compared to the G0-type and increases toward the centre of the SEPC. The plagioclase shows alteration, sericitization, is zoned and presents myrmekites. Another characteristic of the G1-type is the greater amount of plagioclase in relation to the K-feldspar when compared to the G0-type. As microstructures, the rare undulatory extinction in quartz grains is evident.
For textures observed in thin-sections of the G0 (Fig. 3a–e) and the G1 (Fig. 3f–h) granites which are essentially magmatic to submagmatic, the biotite is undeformed (Fig. 3f, h) and undulatory extinctions in quartz are rare or absent (Fig. 3g). However, the presence of bending of biotite cleavages (Fig. 3e) and of plagioclase twin planes (Fig. 3d), as well as quartz subgrains boundaries (Fig. 3b, c), in the G0-type can be interpreted as the result of a stronger deformation of the G0, although in a submagmatic state.

Figure 3. Mineralogy and microstructures observed in (A–E) facies G0 and (F–H) G1. All photomicrographs under crossed polars. (B, C) Subgrain boundaries in quartz; (D) bent plagioclase twins; (E) bent biotite clivages; and (G) rare undulatory extinction in quartz grains.
Gabbro-diorite rocks from the M-group are evident as the main mineralogical assemblage includes plagioclase, amphibole (hornblende), orthopyroxene, clinopyroxene, biotite and epidote. In the M-group granodiorite rocks, the assemblage plagioclase, potassic feldspar, quartz, amphibole, biotite and epidote prevails.
3. Petrophysical studies
3.a. Sampling
At each site, four oriented cores (25 mm in diameter and 60–70 mm in length) were collected in situ with a portable drill machine. Each core was sawed into two (eventually three) 22-mm-long specimens. At least eight specimens per station were obtained for magnetic measurements.
This study was based on 637 rock cylinders from 76 sampling sites roughly distributed throughout the SEPC and also in the host rocks: 29 sites in G0-type; 27 in G1-type; 5 in the M-group; and 15 in roof pendants and host rocks (Fig. 4).

Figure 4. Sampling sites for AMS and IRM studies.
3.b. Anisotropy of magnetic susceptibility and isothermal remanent magnetization analytical techniques
The relationship between the magnetization induced in a material M and the external field H is defined as M = kH, where k is the magnetic susceptibility. Because M (per unit volume) and H have the same units (A m−1), k is dimensionless. If the material is anisotropic, magnetic susceptibility is represented by a second-order symmetric tensor known as the anisotropy of magnetic susceptibility tensor (Graham, Reference Graham1954; Hrouda, Reference Hrouda1982; Collinson, Reference Collinson1983; Bouchez, Reference Bouchez, Bouchez, Hutton and Stephens1997). The magnetic susceptibility reflects the mineral composition of the rock which can have a diamagnetic (e.g. quartz or feldspar), paramagnetic (e.g. biotite, muscovite or hornblende) or a ferromagnetic behaviour (e.g. magnetite or hematite).
Anisotropy of magnetic susceptibility (AMS) measurements were performed using KLY-4S Kappabridge susceptometer Agico model (Czech Republic) from the Centro de Geologia of Porto University. For each site, the ANISOFT 4.2 program package (www.agico.com) enabled us to calculate the mean susceptibility K m, which is the mean of the eight (or more) individual arithmetic means (k 1+k 2+k 3)/3. Also calculated were the intensities and orientations of the three axes K 1 ≥ K 2 ≥ K 3, which are the tensorial means of the k 1 ≥ k 2 ≥ k 3 axes for the eight specimens, and the 95% confidence angles E 12, E 23 and E 31 corresponding to these three axes.
The magnetic fabric is defined by the magnetic lineation (parallel to the long axis of the mean ellipsoid orientation average, K 1) and the magnetic foliation (plane perpendicular to the orientation of K 3, the short axis). The degree of magnetic anisotropy P (%) corresponds to [(K 1/K 3)–1]×100. To describe the shape of the anisotropy of magnetic susceptibility ellipsoid, the shape parameter T is defined (Jelinek, Reference Jelinek1981)
 \begin{equation*}
T = 2\frac{{\ln \left( {K_2 /K_3 } \right)}}{{\ln \left( {K_1 /K_3 } \right)}} - 1.
\end{equation*}
\begin{equation*}
T = 2\frac{{\ln \left( {K_2 /K_3 } \right)}}{{\ln \left( {K_1 /K_3 } \right)}} - 1.
\end{equation*}
The remanence acquired by a sample exposed to a direct magnetic field at ambient temperature is referred to as isothermal remanent magnetization (IRM). The IRM acquisition curves are important to estimate the characteristic coercivity of ferromagnetic minerals. The trend of the acquisition curves depends on the relative concentration of low-coercivity magnetite-type minerals and high-coercivity hematite-type minerals.
The IRM values were measured using a Molspin magnetometer and fields were imparted using a Molspin pulse magnetizer at the University of Coimbra. Samples were magnetized first in the same direction and second in the opposite direction from 12.5 mT up to 1 T. The IRM at 1 T is defined as the saturation isothermal remanent magnetization (SIRM).
3.c. Anisotropy of magnetic susceptibility results
3.c.1. Bulk susceptibility, anisotropy degree and shape parameter
The K m values range between 30.3 and 18672.0×10−6 SI for all rocks (Table 1). Two major groups can be established: G0-type, with 41.6 < K m < 7343.7×10−6 SI (mean 1357.4×10−6 SI) and G1-type with 55.1 < K m < 133.7×10⁻⁶ SI (mean 97.0×10⁻⁶ SI).
Table 1. AMS data for the sampling sites. K m – mean magnetic susceptibility in 10–6 SI; P– anisotropy degree; T – shape parameter; Dec, Inc – declination, inclination; E12, E23 and E31 – 95% confidence angles corresponding to the three axes; N – number of specimens; *: – discarded measurement; ** – not enough data.

In basic rocks from the M-group K m values are homogeneous, ranging between 606.4 and 834.3×10⁻⁶ SI with a mean of 620.9×10⁻⁶ SI (Fig. 5). In the roof pendants and host rocks, K m values range between 55.9 and 717.8×10⁻⁶ SI; the wide variation is due to the different composition of these rocks.

Figure 5. Map of the magnetic susceptibility (K m) and histogram of the bulk susceptibility values.
The magnetic anisotropy P ranges between 1.5 and 18.7% for G0-type (mean 6.2%) and between 1.3 and 8.4% in the central granite G1 (mean 3.1%). G0-type has the highest anisotropy degree (Fig. 6). The ellipsoid shape T ranges between –0.354 and 0.768 in all granitic types, with the strongest oblate ellipsoids in G1 (mean 0.365) and slightly oblate in G0 (mean 0.099) (Fig. 7). The prolate ellipsoids are mainly present on the G0 samples in the east, NW and SE borders. In the M-group T values have a wide range and P values are between 1.0% and 5.9% (Fig. 7). Finally, in host rocks and roof pendant rocks, T and P values have a wide range due to the large variety of lithologies included in this group.

Figure 6. Map of the anisotropy of magnetic susceptibility P and correlation between bulk susceptibility and magnetic anisotropy.

Figure 7. Map of shape parameter T and correlations with (a) bulk susceptibility; and (b) magnetic anisotropy.
3.c.2. Magnetic fabric patterns
The magnetic fabric (lineation and foliation) is generally parallel to the mineral fabric in paramagnetic granites (Heller, Reference Heller1973; Tarling & Hrouda, Reference Tarling and Hrouda1993; Bouchez, Reference Bouchez, Bouchez, Hutton and Stephens1997). The exception is minerals, which present an inverse magnetic fabric (e.g. cordierite). In the studied granites that display magmatic to submagmatic microstructures, the magnetic foliation and lineation are markers of the flattening and stretching, respectively, of the magmas in the latest stages of their emplacement.
In G0 the magnetic foliations are concentrically distributed with inwards steep dips. In the east part of the SEPC (in G0) magnetic foliations are dominantly ENE–WSW-striking. The mean foliation orientation is N73E, 76SE (Fig. 8; see also stereograms of the three axes of the AMS ellipsoid in the online Supplementary Material available at http://journals.cambridge.org/geo). In G1 the magnetic foliations have outwards steep dips and are NE–SW to ENE–WSW-striking, displaying a dome-like structure. In G1 the mean foliation orientation is N72E, 78SE (Fig. 8).

Figure 8. Map of the magnetic foliations with orientation stereonets for the magnetic foliations poles (K 3) for G0-type and G1-type (Schmidt, lower hemisphere projection, 1–5% area contours).
The magnetic lineations in G0 (Fig. 9; see also stereograms of the three axes of the AMS ellipsoid in the online Supplementary Material available at http://journals.cambridge.org/geo) have a distinct behaviour over the pluton: magnetic lineations are subvertical in the eastern sector and they plunge c. 50° to the SW in the western sector. In G1 (Fig. 9), magnetic lineations are scattered in orientation but always plunging moderately.

Figure 9. Map of the magnetic lineations with orientation stereonets for the magnetic lineations (K 1) for G0-type (sector E and W) and G1-type (Schmidt, lower hemisphere projection, 1–5% area contours). Magmatic foliations are defined by preferred alignment of biotite and feldspar crystals.
In the M-group magnetic foliations are dominantly NE-striking and lineations are scattered with steep dips. Mean foliations and lineations were not calculated due to the reduced number of sampling sites.
In host rocks and roof pendant rocks, magnetic foliations are NW–SE-striking (mean N138E, 82NE) underlying the Variscan dominant regional structures and magnetic lineations have steep plunges to the northwest.
3.c.3. Thermomagnetic curves
In order to identify different ferromagnetic contributions, thermomagnetic experiments were performed in low field with a CS-2 furnace apparatus attached to the KLY-3 susceptometer (Laboratoire des Mécanismes et Transferts en Géologie, Université Toulouse). Samples consist of fragments obtained from four rock specimens (G0 ASM76, ASM77 and ASM85 and G1 Af57). The samples were subjected to increasing temperatures up to 700°C. Thermomagnetic experiments performed on samples ASM76 and ASM77 (G0) show a significant fall of magnetic susceptibility at 580°C, which indicates the presence of magnetite (Fig. 10a). On Af57 (G1) and ASM85 (G0), magnetic susceptibility decreases regularly with increasing temperature, typical of a paramagnetic behaviour; there is also a slight fall around 580°C, indicating the presence of a small quantity of magnetite (Fig. 10b).

Figure 10. Normalized magnetic susceptibility curves for continuously increasing (and decreasing) temperatures for (a) G0 (ASM76), showing dominantly ferromagnetic behaviour with magnetic susceptibility drop at 580ºC; and (b) G1 (Af57), showing dominantly paramagnetic behaviour with a decrease in magnetic susceptibility with increasing temperature.
3.d. Isothermal remanent magnetization results
The saturation isothermal remanent magnetization values range from 0.789 to 51.762 A m−1 (mean 9.345 A m−1, N = 16) in G0 and between 0.005 and 0.043 A m−1 (mean 0.027 A m−1, N = 13) in G1 granites (Table 2). In the M-group, the SIRM values range between 0.580 and 5.657 A m−1 (mean 2.634 A m−1, N = 5). In host rocks and roof pendant rocks, the values are widely dispersed between 0.062 and 20.776 A m−1 (mean 3.638 A m−1, N = 6).
Table 2. Saturation isothermal remanent magnetization (SIRM), isothermal remanent magnetization at 300 mT (IRM300), ratio of SIRM to magnetic susceptibility (SIRM/K) and ratio of IRM300 to SIRM in representative samples of the SEPC.

In G0 granites, the acquisition curves show saturation in fields between 300 and 400 mT followed by a small increase in intensity with increasing fields. In G1-type, the acquisition curves show that saturation is not obtained at the applied fields. In the M-group, the curves are similar to G0 (Fig. 11). In host rocks and roof pendant rocks, the curves show different shapes with saturation in fields of 300–400 mT for some samples and with no saturation in others.
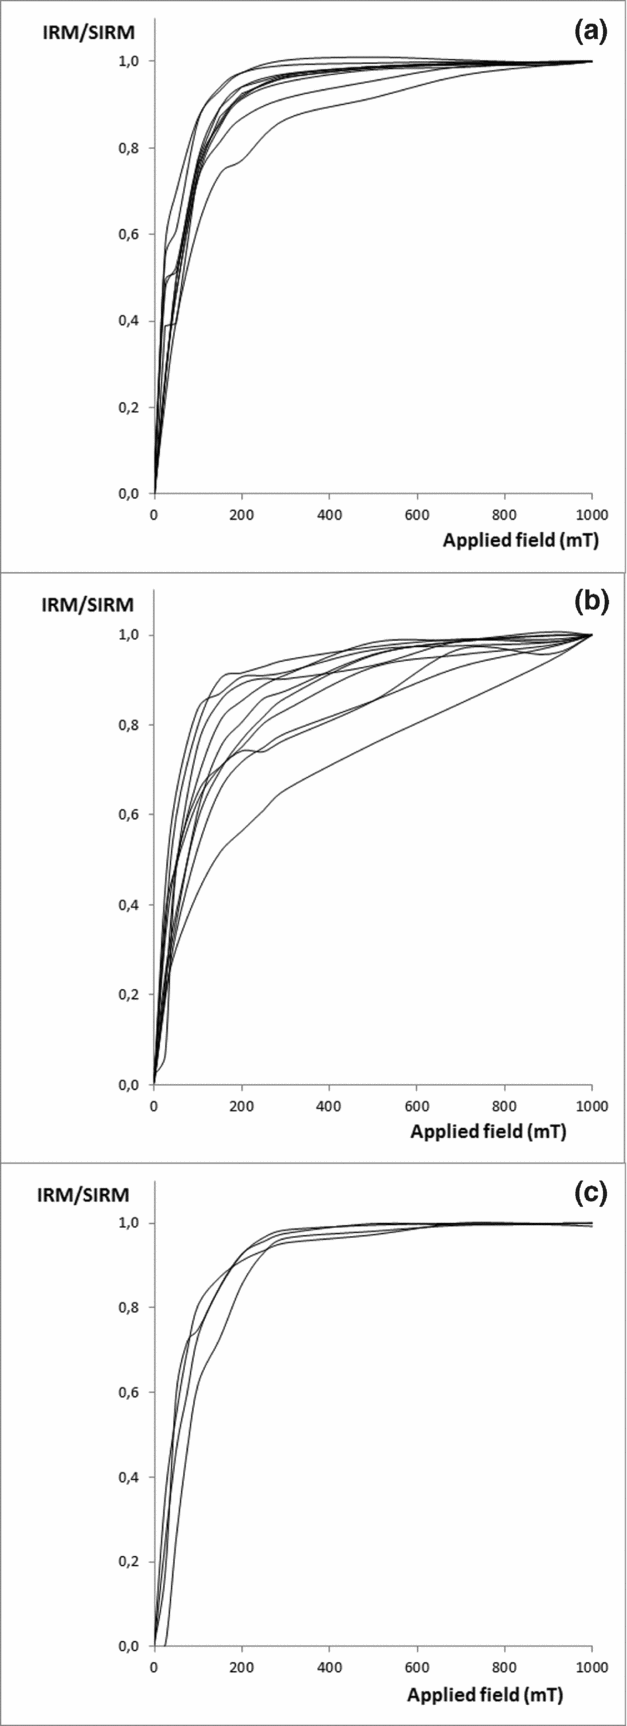
Figure 11. IRM normalized (IRM/SIRM) acquisition curves for the representative samples from (a) G0, (b) G1 and (c) M-group.
The ratio of the saturation isothermal remanent magnetization to the mean magnetic susceptibility (SIRM/K m) has values of 7.119, 0.298, 3.425 and 7.925 kA m−1 for G0, G1, M and host and roof pendant rocks, respectively.
4. Gravity study
An east–west gravity profile obtained using a Worden Prospector gravimeter with a precision of 0.02 mGal was performed over 76 closely spaced (500 m) stations.
Altitudes were determined using a differential GPS. The data were corrected for the intrinsic constant of the apparatus and for the usual topography, latitude and elevation corrections. The Bouguer correction was performed assuming a density of 2.70. Densities were measured using cylindrical specimens that were collected for the anisotropy of magnetic susceptibility study. The densities of the G0 and G1 types were calculated as 2.56 and 2.60, respectively, contrasting with an average density of 2.70 for the host rocks. The analysis of the Bouguer anomaly allowed us to model the 2D shape of the SEPC along the profile. To constrain the gravity model, the cropping out limits of the SEPC were used.
4.a. Two-dimensional gravity modelling
The G0-type in western part of the profile presents an almost flat footwall with a depth of c. 2.5 km. The gravimetric profile is steep in the vicinity of the contact with the G1-type. The profile indicates that the feeder zone of the SEPC must be located in the eastern part, overlapping with the probable position of the Alter do Chão shear zone which does not crop out at the present-day erosion level (Fig. 12). The eastern part of the gravimetric profile has a steeper shape, indicating the probable conditioning of the feeder zone by the Messejana fault. The modelling of the gravimetric data allows us to define a minimum depth for the feeder zone of the SEPC of c. 7.5 km.

Figure 12. 2D Gravity modelling through the SEPC along E–W-oriented cross-sections.
5. Fluid inclusion planes studies
Fluid inclusion planes result from the healing of former open cracks and appear to be fossilized fluid pathways (e.g. Roedder, Reference Roedder and Ribbe1984; Lespinasse & Pecher, Reference Lespinasse and Pecher1986; Lespinasse, Reference Lespinasse1999). The fluid inclusion planes occur in sets and are formed as mode-I cracks materializing the σ1−σ2 plane (Lespinasse & Cathelineau, Reference Lespinasse and Cathelineau1995). Their study provides valuable information about local stress in rocks (Lespinasse & Pecher, Reference Lespinasse and Pecher1986) as well as allowing the relationships between tectonic events and fluid percolations to be established.
A total of eight oriented subvertical rock cylinders from SEPC which were used for the AMS studies were chosen and 200 μm doubly polished wafers, cut perpendicular to the cylinders, were prepared. The strike of the fluid inclusion planes was determined on oriented thick sections (related to geographic north) using an image analyser attached to a transmitted light microscope. In each thick section c. 100 planes were measured. The image acquisition and analysis and the mapping of the fluid inclusion planes was performed using the software GeoImagin (http://home.uevora.pt/~pmn/geoimagin/).
Fluid inclusion planes were only studied in quartz since this mineral has a rapid rate of healing (Smith & Evans, Reference Smith and Evans1984; Brantley, Reference Brantley1992), easily trapping fluids as fluid inclusions, which enables a clearer visualization of the microcracks.
Fluid inclusion petrography and microthermometric characterization of the fluids were carried out using a Chaixmeca heating-freezing stage for criometry (Poty, Leroy & Jachimowicz, Reference Poty, Leroy and Jachimowicz1976) and a Linkam stage for thermometry (Shepherd, Rankin & Alderton, Reference Shepherd, Rankin and Alderton1985). The stages were calibrated with a melting point of natural and synthetic fluid inclusions at T<0°C and with manufactured standards Merck Co. Schemlzkorper at T>30°C. The analytical precision was of ±0.1°C and ±1°C in criometry and thermometric studies, respectively. The degree of fill, F lw (volume of liquid phase/total volume) was estimated at room temperature by reference to the volumetric charts of Roedder (Reference Roedder and Ribbe1984) and Shepherd, Rankin & Alderton (Reference Shepherd, Rankin and Alderton1985). Aqueous fluid salinities, expressed in wt% equivalent (eq.) NaCl, were calculated using the melting temperature of the ice and the equation of Bodnar (Reference Bodnar1993). In aqueous carbonic inclusions, the melting temperature of clathrates and the software developed by Bakker (Reference Bakker2003) were used. Molar fractions of CO2 and N2 species were determined in the volatile phase of individual fluid inclusions by Raman analysis performed on a Labram Dilor Jobin Yvon Spex Raman spectrometer coupled to an Olympus optical microscope. The different fluid species were quantified via specific procedures (Prieto et al. Reference Prieto, Guedes, Dória, Noronha and Jiménez2012).
Samples Af31.0, ASM020, ASM001 and ASM004 (G0-type) and ASM006, ASM097, ASM092 and ASM007 (G1-type) were selected from the SEPC for the fluid inclusion planes studies.
Figure 13 depicts rose diagrams showing the fluid inclusion plane directions for each granite type. The analysis of the rose diagrams shows that the G0-type quartz contains fluid inclusion plane sets with a well-expressed NW–SE preferential orientation, and for G1-type the NNE–SSW to NE–SW direction becomes predominant (Fig. 13).

Figure 13. Rose diagrams indicating the preferential orientation of the fluid inclusions planes. Example of oriented double-polished wafers and some studied fluid inclusions representative of the predominant orientations of quartz.
Three samples – Af31.0 and ASM020 (G0) and ASM097 (G1) – were selected for the fluid inclusion characterization. Three main fluid inclusion types (aqueous carbonic, aqueous with low–moderate salinities and aqueous with high salinities) were observed, based on number of phases at room temperature and their phase behaviour on cooling.
5.a. Aqueous carbonic fluids
Aqueous carbonic fluid inclusions were only recorded in the sample ASM020 from G0-type. They are mostly three-phase inclusions (liquid H2O+liquid CO2+CO2 vapour) at room temperature. They generally display dimensions within the range 6–20 μm. The melting temperature of the CO2 (T m CO2) was observed to be between –59.7 and –56.7°C. A homogenization temperature of CO2 (T h CO2) was recorded between +19.9 and +27.4°C (into the liquid phase) and between +24.0 and +24.3°C (into the vapour phase). For Raman microspectrometry studies, some aqueous carbonic inclusions present in sample ASM020 (G0) were selected. CO2 and N2 were the only gaseous species detected. CO2 was the dominant species in the volatile phase ranging from 76.35 to 89.56 mol% and N2 contents ranged from 10.44 to 23.65 mol%.
5.b. Aqueous fluids (H2O+NaCl)
This type (LW1) is the most common in all samples. The data indicate a predominance of low- to medium-salinity aqueous inclusions in both granites of the SEPC, ranging in size from 4 to 25 μm in longest dimension. The ice melting temperature in G0 (T m,ice) was observed as between –8.0 and –0.9°C (LW1), corresponding to low and medium salinity ranging from 0.18 to 11.70 wt% eq. NaCl. In G1, T m,ice ranges between –8.0 and –2.6°C (LW1). The global homogenization observed was always into liquid phase with the temperatures T h observed in the range +134 to +270ºC (G0-type) and +224 to +310ºC (G1-type).
5.c. Aqueous fluids (NaCl–CaCl)
This type of inclusion (LW2) was recorded only in one sample of G0-type. They have moderate to high salinities (between 14.3 and 21.0 wt% eq. NaCl+CaCl) with first ice melting temperatures of <–50°C. These correspond to eutectic temperatures, which might indicate the presence of Ca chloride.
6. Interpretation and discussion
6.a. Significance of magnetic susceptibility and isothermal remanent magnetization values
The SIRM analyses together with magnetic susceptibility values (Fig. 14) show that two distinct groups of magnetic behaviour are evident: G0 and M-group with higher SIRM and K m values; and G1 with lower values. In G0, isothermal remanent magnetization acquisition curves show that, at some sites, the main carrier of the remanence is a ferrimagnetic fraction (low magnetite or Ti-magnetite). These data are also confirmed by the K m values found; at 29 sites, 10 have K m > 10−3 SI. In G1 however, K m < 10−4 SI indicates a paramagnetic behaviour due to ferromagnesian minerals (e.g. biotite) and iron oxides (e.g. ilmenite). This is also shown on the isothermal remanent magnetization curves, which indicates a dominant paramagnetic fraction. The mean ratio of the isothermal remanent magnetization at 300 mT (IRM300) to saturation isothermal remanent magnetization (SIRM), referred to as S 300, provides a comparative measure of the amounts of high-coercivity and low-coercivity remanence (Bloemendal, Lamb & King, Reference Bloemendal, Lamb and King1988). S 300 is 0.960 for the 10 sites of G0, confirming the presence of a ferrimagnetic fraction.

Figure 14. Plot of the relation between SIRM and magnetic susceptibility K for representative samples of G0, G1 and M-group.
In basic rocks from the M-group, the values of K m are typical of those usually found in gabbros and granodiorites. It is due to the high content of ferromagnesian minerals and probably also to the presence of magnetite, as indicated by the shape of the isothermal remanent magnetization curves.
In host rocks and roof pendant rocks, K m and SIRM values demonstrate a wide range. The different shapes of the isothermal remanent magnetization curves emphasize the variety of magnetic structures present in the different lithologies.
The mean values of the ratio of saturation isothermal remanent magnetization to magnetic susceptibility (SIRM/K m) are similar for G0 and M, but not G1. According to several authors (e.g. Thompson & Oldfield, Reference Thompson and Oldfield1986; Sandgren & Thompson, Reference Sandgren and Thompson1990), when ferrimagnetic structures are present SIRM/K m can be used as an indicator of magnetic mineral grain size. Sandgren and Thompson (Reference Sandgren and Thompson1990) indicated that a value of 6.4 kA m−1 corresponds to a magnetite grain size of 8 μm. Based on these authors, the mean value of the ratio of SIRM to magnetic susceptibility of 7.12 kA m−1 obtained in G0 could indicate a similar magnetite grain size.
These data are confirmed by the thermomagnetic experiments, which indicate the presence of magnetite in G0 and the paramagnetic behaviour of G1. The magnetic behaviours of G0 and G1 suggest different redox conditions in the magma genesis; according to Ishihara (Reference Ishihara1977), G0 may be considered as a magnetite-type granite while G1 is an ilmenite-type granite. The magnetite-series granites are scarce in Portuguese Variscan granites. Furthermore, the existence of two different granite series in the same pluton is very uncommon. Magnetite and ilmenite-series granites are primarily governed by the prevailing fO2 (fugacity of oxygen; Ishihara, Reference Ishihara1977). Carmichael (Reference Carmichael1991) established that the redox states of silicic and basic magmas are inherited from their respective source regions. Nevertheless, some granites may acquire their oxidation or reduction state due to specific physico-chemical conditions. The interaction processes of mafic and felsic magma mixing and mingling, which occur in an open system, can also play an important role in increasing the oxidizing conditions of magma chambers (Kumar, Reference Kumar2010).
Menéndez et al. (Reference Menéndez, Azor, Pereira and Acosta2006) proposed a partial melting of intermediate igneous and metasedimentary lithologies in the low–middle crust as the source of G0 and G1 types (although petrogenetically independent) and a mantle source for the M-group.
We consider that the formation of magnetite G0-type required oxidized conditions related to the interaction of the mafic rocks of M-group with felsic magma, whereas the ilmenite G1-type could have been formed by assimilation of organic carbon from the accreted sediments in the lower–middle crust (e.g. Ishihara & Matsuhisa, Reference Ishihara and Matsuhisa1999).
6.b. Magnetic fabric
The degree of magnetic anisotropy increases towards the margin. Magnetic anisotropy is higher in G0 compared to G1 and P of >11% is found in the sites with magnetite. We assume that the increasing magnetic anisotropy towards the margin is related to the magmatic strain increase; even in the sites of G0 that do not have magnetite, the anisotropy is always higher that in G1. This assumption is confirmed by microscope observations that show signs of a post-magmatic deformation in G0 rather than in G1. The degree of oblateness does not increase towards the margin; instead, the strongest oblate ellipsoids are in the central facies and the prolate ellipsoids are mainly present in the western part of G0. The oblate ellipsoids present at most G0 and G1 sites are mainly due to the magnetocrystalline anisotropy of biotite, but can also be related to the oblate shape anisotropy of magnetite grains. The prolate ellipsoids found in the western part form steep contacts with the wall rocks.
The magnetic foliations are steep in both granites and ENE–WSW-striking, defining a dome in G1 but dipping inwards in G0 and outwards in G1. Magnetic lineations exhibit three distinct orientations: subvertical in the east sector of G0; plunging moderated at variable trends in G1; and to the SW in the west sector of G0.
6.c. Emplacement model
To understand granite ascent and emplacement processes it is important to consider the granites of SEPC and the crustal discontinuities that surround them simultaneously.
The northern limit of the Ossa Morena Zone is characterized by a transpressive–transtensive tectonic regime (Harland, Reference Harland1971) with strain concentration along subvertical sinistral shear zones, oriented NW–SE (e.g. Araújo et al. Reference Araújo, Piçarra Almeida, Borrego, Pedro, Oliveira, Dias, Araújo, Terrinha and Kullerberg2013) in the same way as the Coimbra–Córdoba Shear Zone. These NW–SE shear zones, with continuity exceeding hundreds of kilometres, reflect deeply rooted discontinuities in the crust (e.g. Pereira et al. Reference Pereira, Silva, Solá, Chichorro, Dias, Araújo, Terrinha and Kullerberg2013). The occurrence of NE–SW and ENE–WSW conjugate fault systems perpendicular to the regional structures is related to the final brittle stages of the Variscan Orogeny. The late Variscan fracturing is represented by the development of NNW–SSE (right) and NE–SW (left) conjugate pairs, indicating a north–south main compression (Ribeiro et al. Reference Ribeiro, Antunes, Ferreira, Rocha, Soares, Zbyszewski, Almeida, Carvalho and Monteiro1979). Previous right-lateral NE–SW faults, such as the Messejana fault, display left-lateral behaviour at this stage.
The kinematic mechanism described operated from the earliest stages of ductile deformation (at 370 Ma) to the last phase of ductile regional deformation (at 306 Ma), until the final stages of brittle deformation (Ribeiro et al. Reference Ribeiro, Munhá, Dias, Mateus, Pereira, Ribeiro, Fonseca, Araújo, Oliveira, Romão, Chaminé, Coke and Pedros2007). As a working hypothesis we suggest that these NW–SE structures are possible escape zones, inducing local decompression and the consequent initiation of partial melting that, primarily, facilitated granite ascent.
We propose that the ascent of the magma took place in the eastern part of the body, attested by the subvertical G0 magnetic lineations and 2D modelling. The intersection between the Assumar strike-slip fault (associated with the Coimbra–Córdoba Shear Zone) and Messejana fault (Fig. 1) promoted the structural conditions for magma ascent and emplacement. The magma emplacement was controlled by the existing ENE–WSW planar anisotropies that allowed the expansion of the granitic complex and are recorded by the magnetic foliations in the two granitic types. The gravimetric data together with the magnetic fabric indicate that the G0-type is a tabular flat-floored massif, with magnetic foliations dipping towards the interior of the pluton. For the G1-type the combined data show a rooted dome-like structure with outwards dipping magnetic foliations. The feeder zone of the pluton is located towards the eastern part of the pluton, confirming the role of the Assumar and Messejana faults in the process of emplacement.
Granitic bodies such as Fronteira, Ervedal and Vimieiro–Pavia (Gonçalves, Reference Gonçalves1971; Palácios, Reference Palácios1976) define an east–west magmatic set with an alignment consistent with this interpretation.
It is also significant that thermal effects in the host rocks caused by the intrusion of the SEPC are restricted to the roof pendants cropping out in the western part of the SEPC. The lack of thermal overprint on the wall rocks highlights the small thickness of G0-type, also corroborated by the 2D modelling and by the magnetic lineations that plunge moderately.
The emplacement of the two granites was passive and almost synchronous, as shown by their gradational contacts found in the field. Although the magnetic fabric suggests emplacement of the G0-type was first, utilizing subvertical ENE–WSW crustal fractures, the magma flow was mainly SW directed as magnetic lineations show. The G0 emplacement was closely followed by the G1, pushing the G0 laterally which become more anisotropic towards the margin. The G1-type became flattened, acquiring a dome-like structure. This chronological sequence was also proposed by Menéndez et al. (Reference Menéndez, Azor, Pereira and Acosta2006) based on geochemical data. The two granites of SEPC formed a nested pluton.
Stoping is a widely accepted emplacement (e.g. Marsh, Reference Marsh1982; Glazner & Bartley, Reference Glazner and Bartley2006) mechanism, and its applicability to SEPC should be discussed. Stoping occurs when blocks of wall rock are transferred downwards through a pluton, and has been widely used to explain discordant pluton contacts. However, the common signatures of stoping are sharp discordant contacts between plutons and wall rocks and a lack of ductile deformation of the wall rocks (e.g. Glazner & Bartley, Reference Glazner and Bartley2006; Žák, Holub & Kachlík, Reference Žák, Holub and Kachlík2006). The northeast wall rocks of SEPC are deflected by the intrusion which means they were still ductile during the G0 emplacement, ruling out stoping as emplacement mechanism. The expansion of G0 was accompanied by a downwards return of magmatic flow deflecting the wall rocks at the northeast, a process observed in other plutons (e.g. Paterson & Vernon, Reference Paterson and Vernon1995; Paterson, Fowler & Miller, Reference Paterson, Fowler and Miller1996; Sylvester, Reference Sylvester1998).
The Rb–Sr age of 290 Ma (Pinto, Reference Pinto1984) of the SEPC and the lack of solid-state microstructures imply that the emplacement of the SEPC could be considered as late- to post-tectonic.
After emplacement, the SEPC recorded increments of the regional tectonic strain as documented by fluid inclusion planes in quartz. All the fluid inclusion planes are post-magmatic; no relationship with the magnetic fabric could therefore be established. Nevertheless, the fluid inclusion planes (Fig. 13) indicate that the stress field was different in the two granites. The fluid inclusion planes in G0-type, which are parallel to the regional structures, suggest that the stress field during the cooling process was rotated locally to the NW–SE direction. The predominant direction of the fluid inclusion planes of G1-type, NNE–SSW to NE–SW, is compatible with the stress field (NE–SW to N–S maximum compressive stress) prevailing in the final stages of the Variscan Orogeny during the cooling of this granite. The magnetic fabric of the SEPC does not reveal any structural pattern related to the near-solidus thermal contraction of igneous mass or to the fluid inclusion planes directions, as was found in other intrusions (Gil-Imaz et al. Reference Gil-Imaz, Pocoví, Lago, Galé, Arranz, Rillo and Guerrero2006).
The aqueous carbonic fluid inclusions found in the G0-type suggests that there was an interaction between the carbonate host rocks and the G0-type. The high-salinity fluids found in the G0-type may be related to the deep circulation of fluids linked to the neighbourhood of the Messejana fault. The aqueous fluids record the hydrothermal events that took place during the post-magmatic processes.
The kinematical features found in this work therefore seem to describe the continuous sequence of events which occurred during the emplacement and the cooling of the granitic magmas over a short time frame.
7. Conclusions
-
• The SEPC is a nested intrusion composed of two granites, G0 and G1, with different magnetic behaviours, suggesting different redox conditions in the magma genesis. G0 may be considered a magnetite-type granite, while G1 is an ilmenite-type granite. The formation of G0-type required oxidized conditions related to the interaction of the mafic rocks of the M-group with felsic magma.
-
• The feeder zone of the pluton is located in the eastern part of the pluton, confirming the role of the Assumar and Messejana faults in the process of ascent and emplacement.
-
• The magma emplacement was controlled by the existing ENE–WSW planar anisotropies related to the final brittle stages of the Variscan Orogeny, which allowed the expansion of the granitic complex. These are recorded by the magnetic foliations in the two granitic types.
-
• Both gravity modelling and magnetic fabric data indicate that the G0-type is a tabular, flat-floored massif with magnetic foliations dipping towards the interior of the pluton. G1-type forms a rooted dome-like structure with outwards dipping magnetic foliations.
-
• The emplacement of the two granites was passive and almost synchronous, as shown by their gradational contacts found in the field. However, the magnetic fabric suggests the G0-type was emplaced first, closely followed by the G1-type. The G1-type pushed the G0 laterally, which become more anisotropic towards the margin. The G1-type became flattened, acquiring a dome-like structure. The two granites of the SEPC formed a nested pluton.
-
• After emplacement, the SEPC recorded increments of the late Variscan stress field, documented by fluid inclusion planes in quartz.
-
• The Rb–Sr ages of 290 Ma and the lack of solid-state microstructures mean that the emplacement of the SEPC can be considered as late- to post-tectonic.
Acknowledgements
This work was financially supported by PTDC/CTE-GIX/099447/2008 (FCT-Portugal, COMPETE/FEDER). The authors thank Philippe Olivier for the thermomagnetic measurements carried out in Toulouse. We thank Jirí Zak and an anonymous referee for their helpful comments.
Supplementary material
To view supplementary material for this article, please visit http://dx.doi.org/10.1017/S0016756814000569


