


1. Introduction
The Toroud – Chah Shirin (TCS) magmatic arc (Fig. 1a) is one of several mineralized belts in the structural zone of central Iran (Houshmandzadeh et al. Reference Houshmandzadeh, Alavi and Haghipour1978). Magmatic activity in this region relates to the Tertiary northward subduction of the Sabzevar–Darouneh branch of the Neo-Tethys ocean (Yousefi et al. Reference Yousefi, Sadeghian, Wanhainen, Ghasemi and Frei2017). The TCS magmatic arc comprises a 100 km × 10 km uplifted block bounded by the Toroud fault to the south, and the Anjilow fault to the north (Fig. 1b). In this block, NE–SW-trending volcano-intrusive rocks consist mainly of middle- to upper-Eocene andesites and dacites, and Oligocene diorites. Middle Eocene tuff, shale, marl and sandstone are associated with the igneous rocks (Houshmandzadeh et al. Reference Houshmandzadeh, Alavi and Haghipour1978; Fodazi & Emami, Reference Fodazi and Emami2000). Although these geologic relationships are clearly related to subduction (e.g. A Jafarian, unpub. MSc thesis, Univ. Tehran, 1988; Rashidnejad-Omran, Reference Rashidnejad-Omran1992; Imamjome et al. Reference Imamjome, Rastad, Bouzari and Rashidnezhad2009; Khajehzadeh, Reference Khajehzadeh2012; Khalaj, Reference Khalaj2016), the tectono-magmatic processes of magma emplacement in the TCS magmatic arc have not been studied. We shall investigate this aspect along with the changes in magnetic fabric caused by the hydrothermal alteration that accompanied copper mineralization.
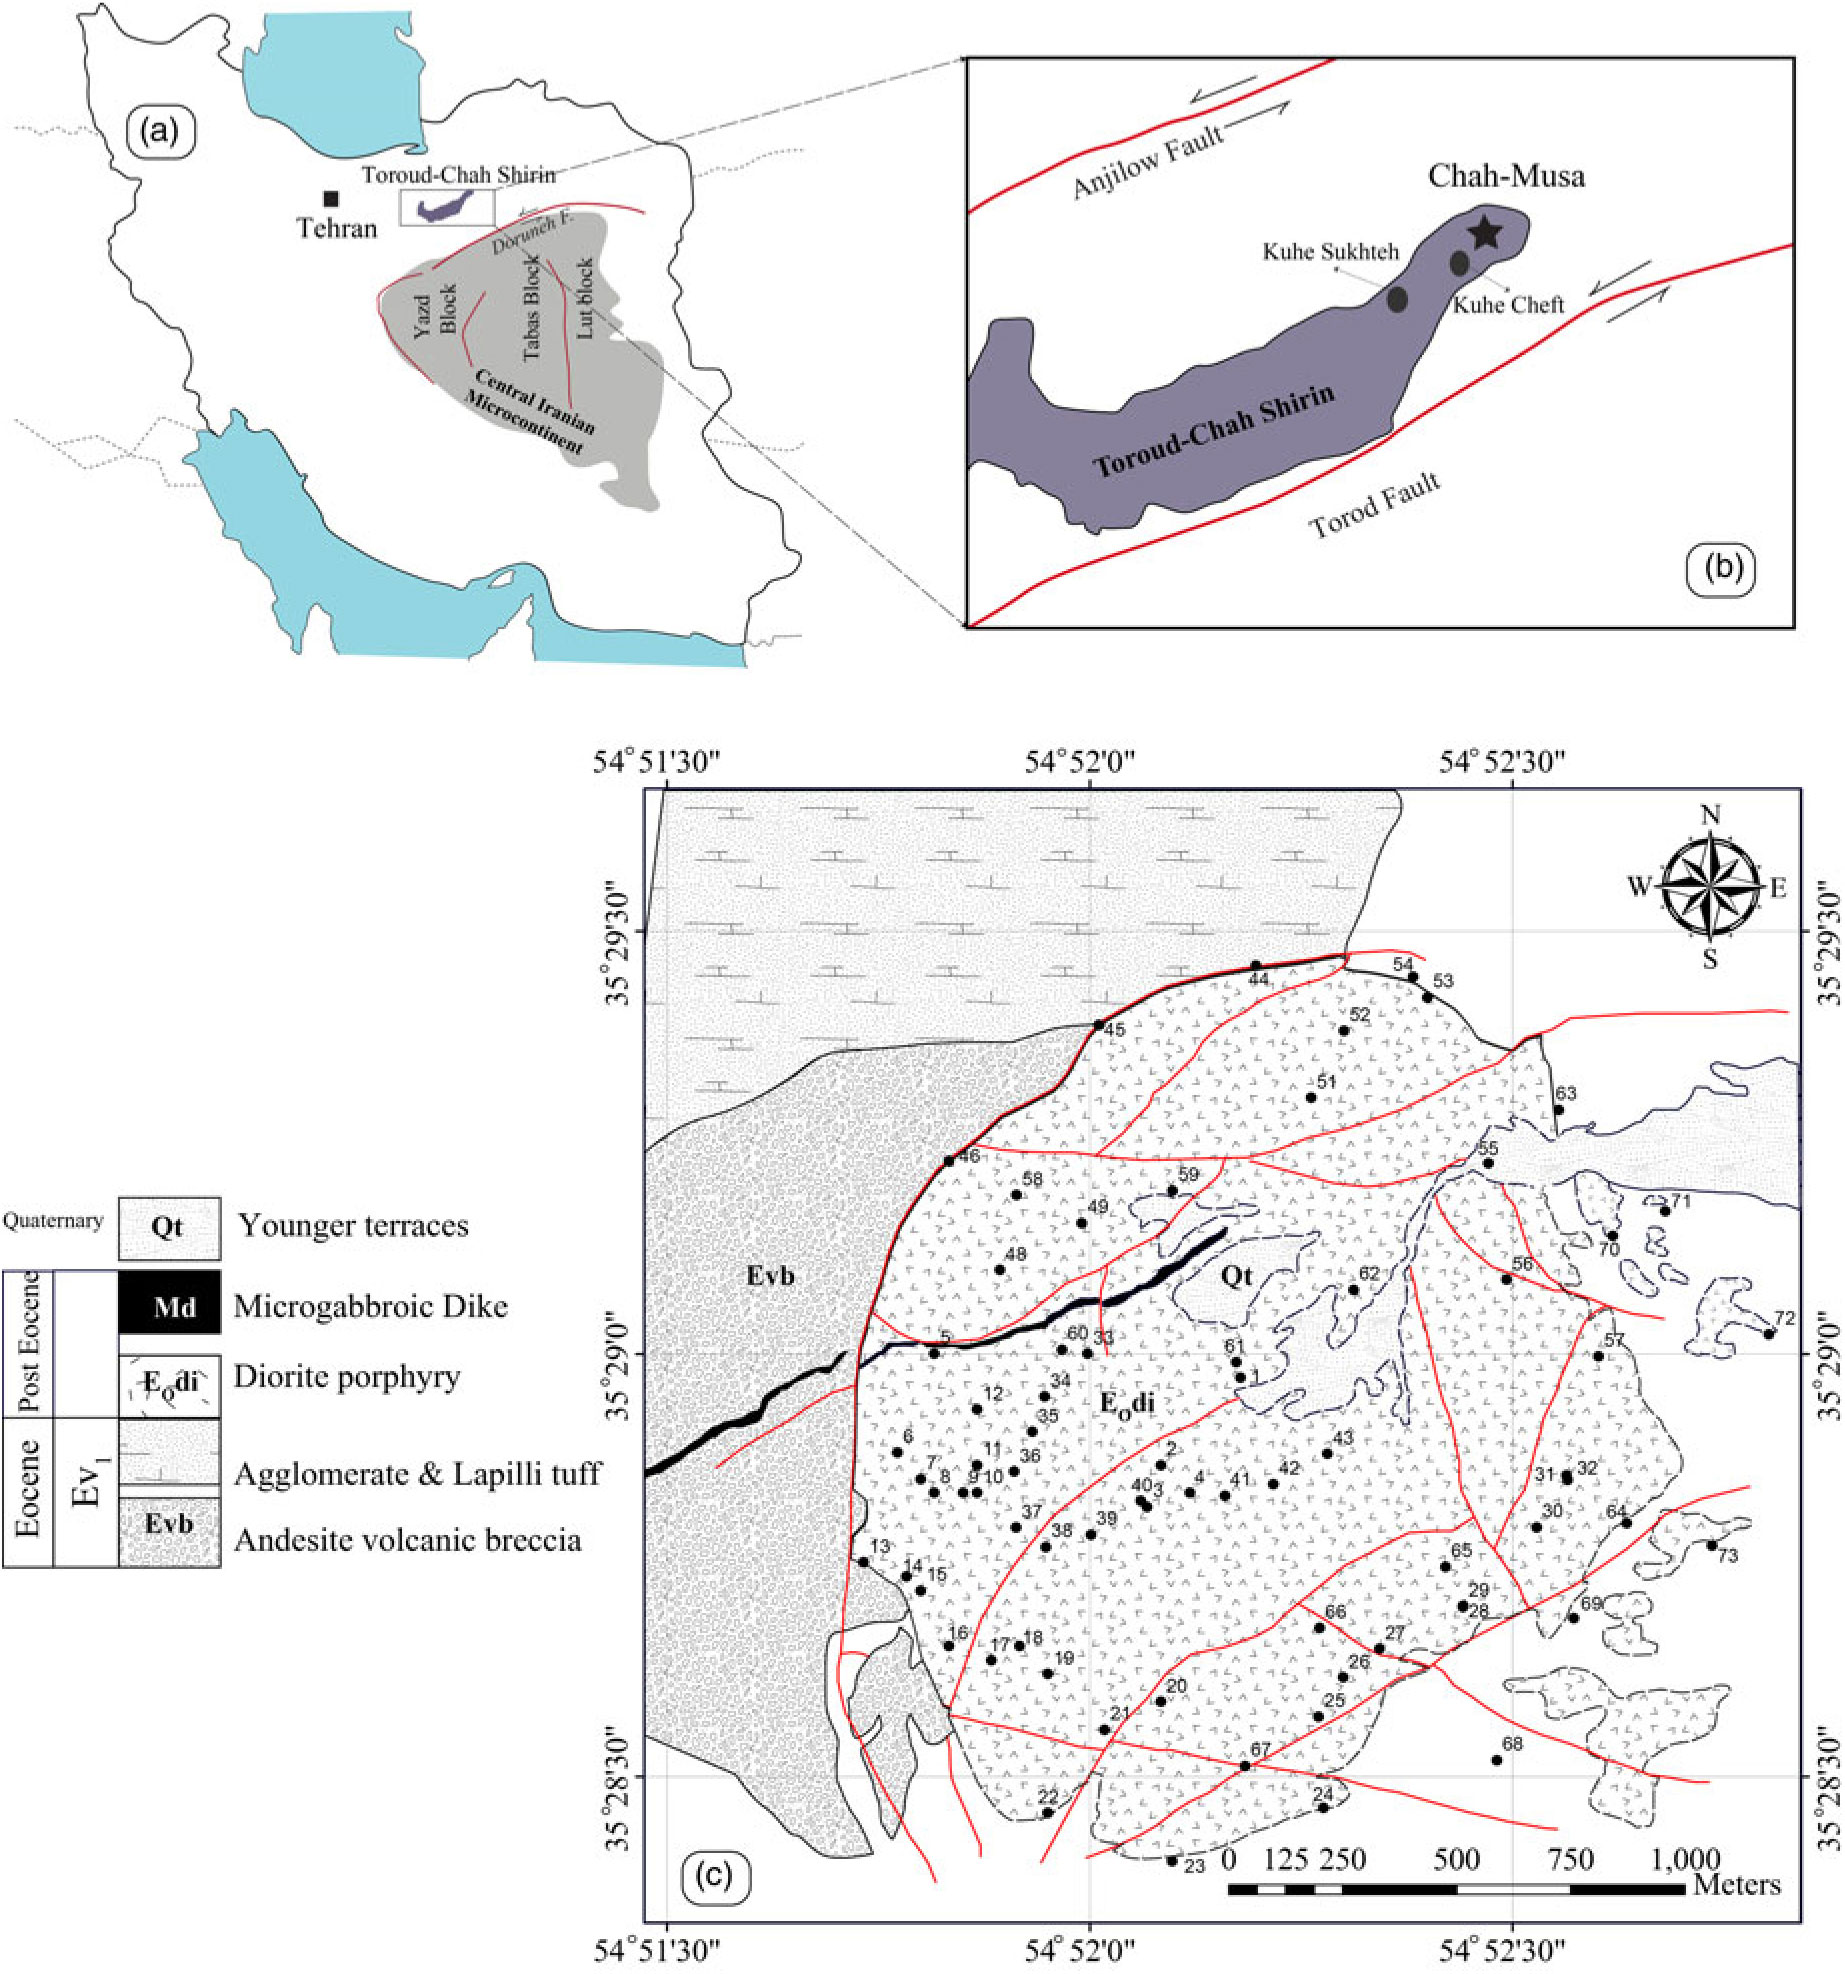
Fig. 1. (a) Location of Toroud – Chah Shirin (TCS) magmatic arc in Iran. (b) Schematic structural map of the TCS arc which is bounded by sinistral NE-striking Anjilow and Toroud regional faults (Houshmandzadeh et al. Reference Houshmandzadeh, Alavi and Haghipour1978). A star denotes the study area. (c) Simplified geological map of Chah-Musa pluton. Labelled black dots show locations where 73 samples were drilled for AMS study.
Shallow emplacement of magma is associated with formation of mineral deposits (e.g. porphyry-copper type), geothermal fields, maturation of hydrocarbon reservoirs in sedimentary basins (e.g. Jones et al. Reference Jones, Wielens, Williamson and Zentilli2007), and even global climate change (Svensen et al. Reference Svensen, Planke and Corfu2008). The TCS magmatic arc hosts many epithermal ore deposits (Rashidnejad-Omran, Reference Rashidnejad-Omran1992; Sengör et al. Reference Sengör, Cin, Rowley and Nie1993; Tajeddin, Reference Tajeddin1999; Shamanian et al. Reference Shamanian, Hedenquist, Hattori and Hassanzadeh2004; Fard et al. Reference Fard, Rastad and Ghaderi2006; Imamjome et al. Reference Imamjome, Rastad, Bouzari and Rashidnezhad2009; Mehrabi & Ghasemi, Reference Mehrabi and Ghasemi2012; Mehrabi et al. Reference Mehrabi, Ghasemi and Tale2015). In this paper we report a detailed petrogenetic investigation of the Chah-Musa district undertaken as a strategy for effective exploration. Geologic information about the Chah-Musa Cu deposit is scarce in spite of its importance. This paper describes the mechanism of emplacement of the Chah-Musa body, a subvolcanic intrusion located in the northern part of the TCS magmatic arc (Fig. 1). This calc-alkaline intrusion (35° 29′ N, 54° 52′ E), which hosts a high copper anomaly, has been previously investigated by several authors (Imamjome et al. Reference Imamjome, Rastad, Bouzari and Rashidnezhad2009; Khajehzadeh, Reference Khajehzadeh2012; Khalaj, Reference Khalaj2016). Since fabric measurements in the field are difficult, the anisotropy of magnetic susceptibility (AMS) technique is here used as a proxy to reveal magma flow directions, feeder zones and mode of final emplacement.
2. Regional geology
The TCS magmatic arc which trends N60–70°E, consists mainly of Palaeogene igneous rocks, although including scattered outcrops of metamorphosed Palaeozoic and Mesozoic rocks. Middle to possibly late Eocene igneous activity (Houshmandzadeh et al. Reference Houshmandzadeh, Alavi and Haghipour1978) consists of: (1) explosively deposited rhyolitic to rhyodacitic tuffs and local andesitic lava flows, associated with marls, tuffaceous marlstones and sandstones; (2) lava flows and pyroclastic rocks of andesite, trachy-andesite and basaltic andesite; and(3) subordinate dacitic–rhyodacitic rocks and hypabyssal intrusive rocks. The TCS magmatic arc is bounded by the Toroud and Anjilow faults that have the same trends, nearly vertical dip and sinistral movements (Houshmandzadeh et al. Reference Houshmandzadeh, Alavi and Haghipour1978). Mehrabi et al. (Reference Mehrabi, Ghasemi and Tale2015) analysedthe spatial distribution of 12 epithermal deposits using Fry (Reference Fry1979) and point pattern analysis in order to infer geologic controls. Their data are consistent with a Riedel shear model in which sinistral NE-striking faults and lineaments (i.e. the Anjilow and Toruod faults) represent the main shear plane, and the NNW and WNW structures represent R and R′, respectively (Fig. 2).

Fig. 2. Landsat image showing the structural model and location of epithermal ore deposit in the TCS belt. The model includes the NE-striking regional sinistral faults (F1, ~70°), sinistral NNW-striking faults (F2, ~340°) and dextral WNW-striking faults (F3, ~280°). The orientation of σH-max, modelled as the acute bisector of the conjugate pair, is ~340° and the majority of veins are modelled as nearly pure extension fractures (T) oriented roughly parallel to σH-max. The model fits well with the Riedel shear model in which sinistral NE-striking faults and lineaments represent the main shear plane (M), and the NNW structures and WNW structures represent R and R′, respectively (Mehrabi et al. Reference Mehrabi, Ghasemi and Tale2015).
The oldest exposed rocks include Eocene volcanic breccia (c. 400 m thick in the west) and red tuffaceous and agglomerate assemblages that crop out especially adjacent to the northern and northwestern parts of the Chah-Musa subvolcanic intrusion (Fig. 3a, c). Eocene tuffaceous rocks (Et) occur along the northern border (Fig. 3a, b). The tuff is dark red to purple thin-laminated (Fig. 3b), containing lithics and interlayers of dacitic lava (Edc). Large isolated outcrops of this flat-lying host rock exist in the eastern margins of the intrusion. Its western margin is surrounded by pyroclastic rocks including andesitic agglomerates (Eag), and volcanic breccias (Evb) contain angular fragments up to 50 cm in size (Fig. 3e). Agglomerates mostly consist of lava fragments of various sizes and shapes. The occurrence of small to large fragments of red tuff (Fig. 3d) in this unit confirms that the agglomerates and breccias are located at the top of the Eocene volcanoclastic sequence.
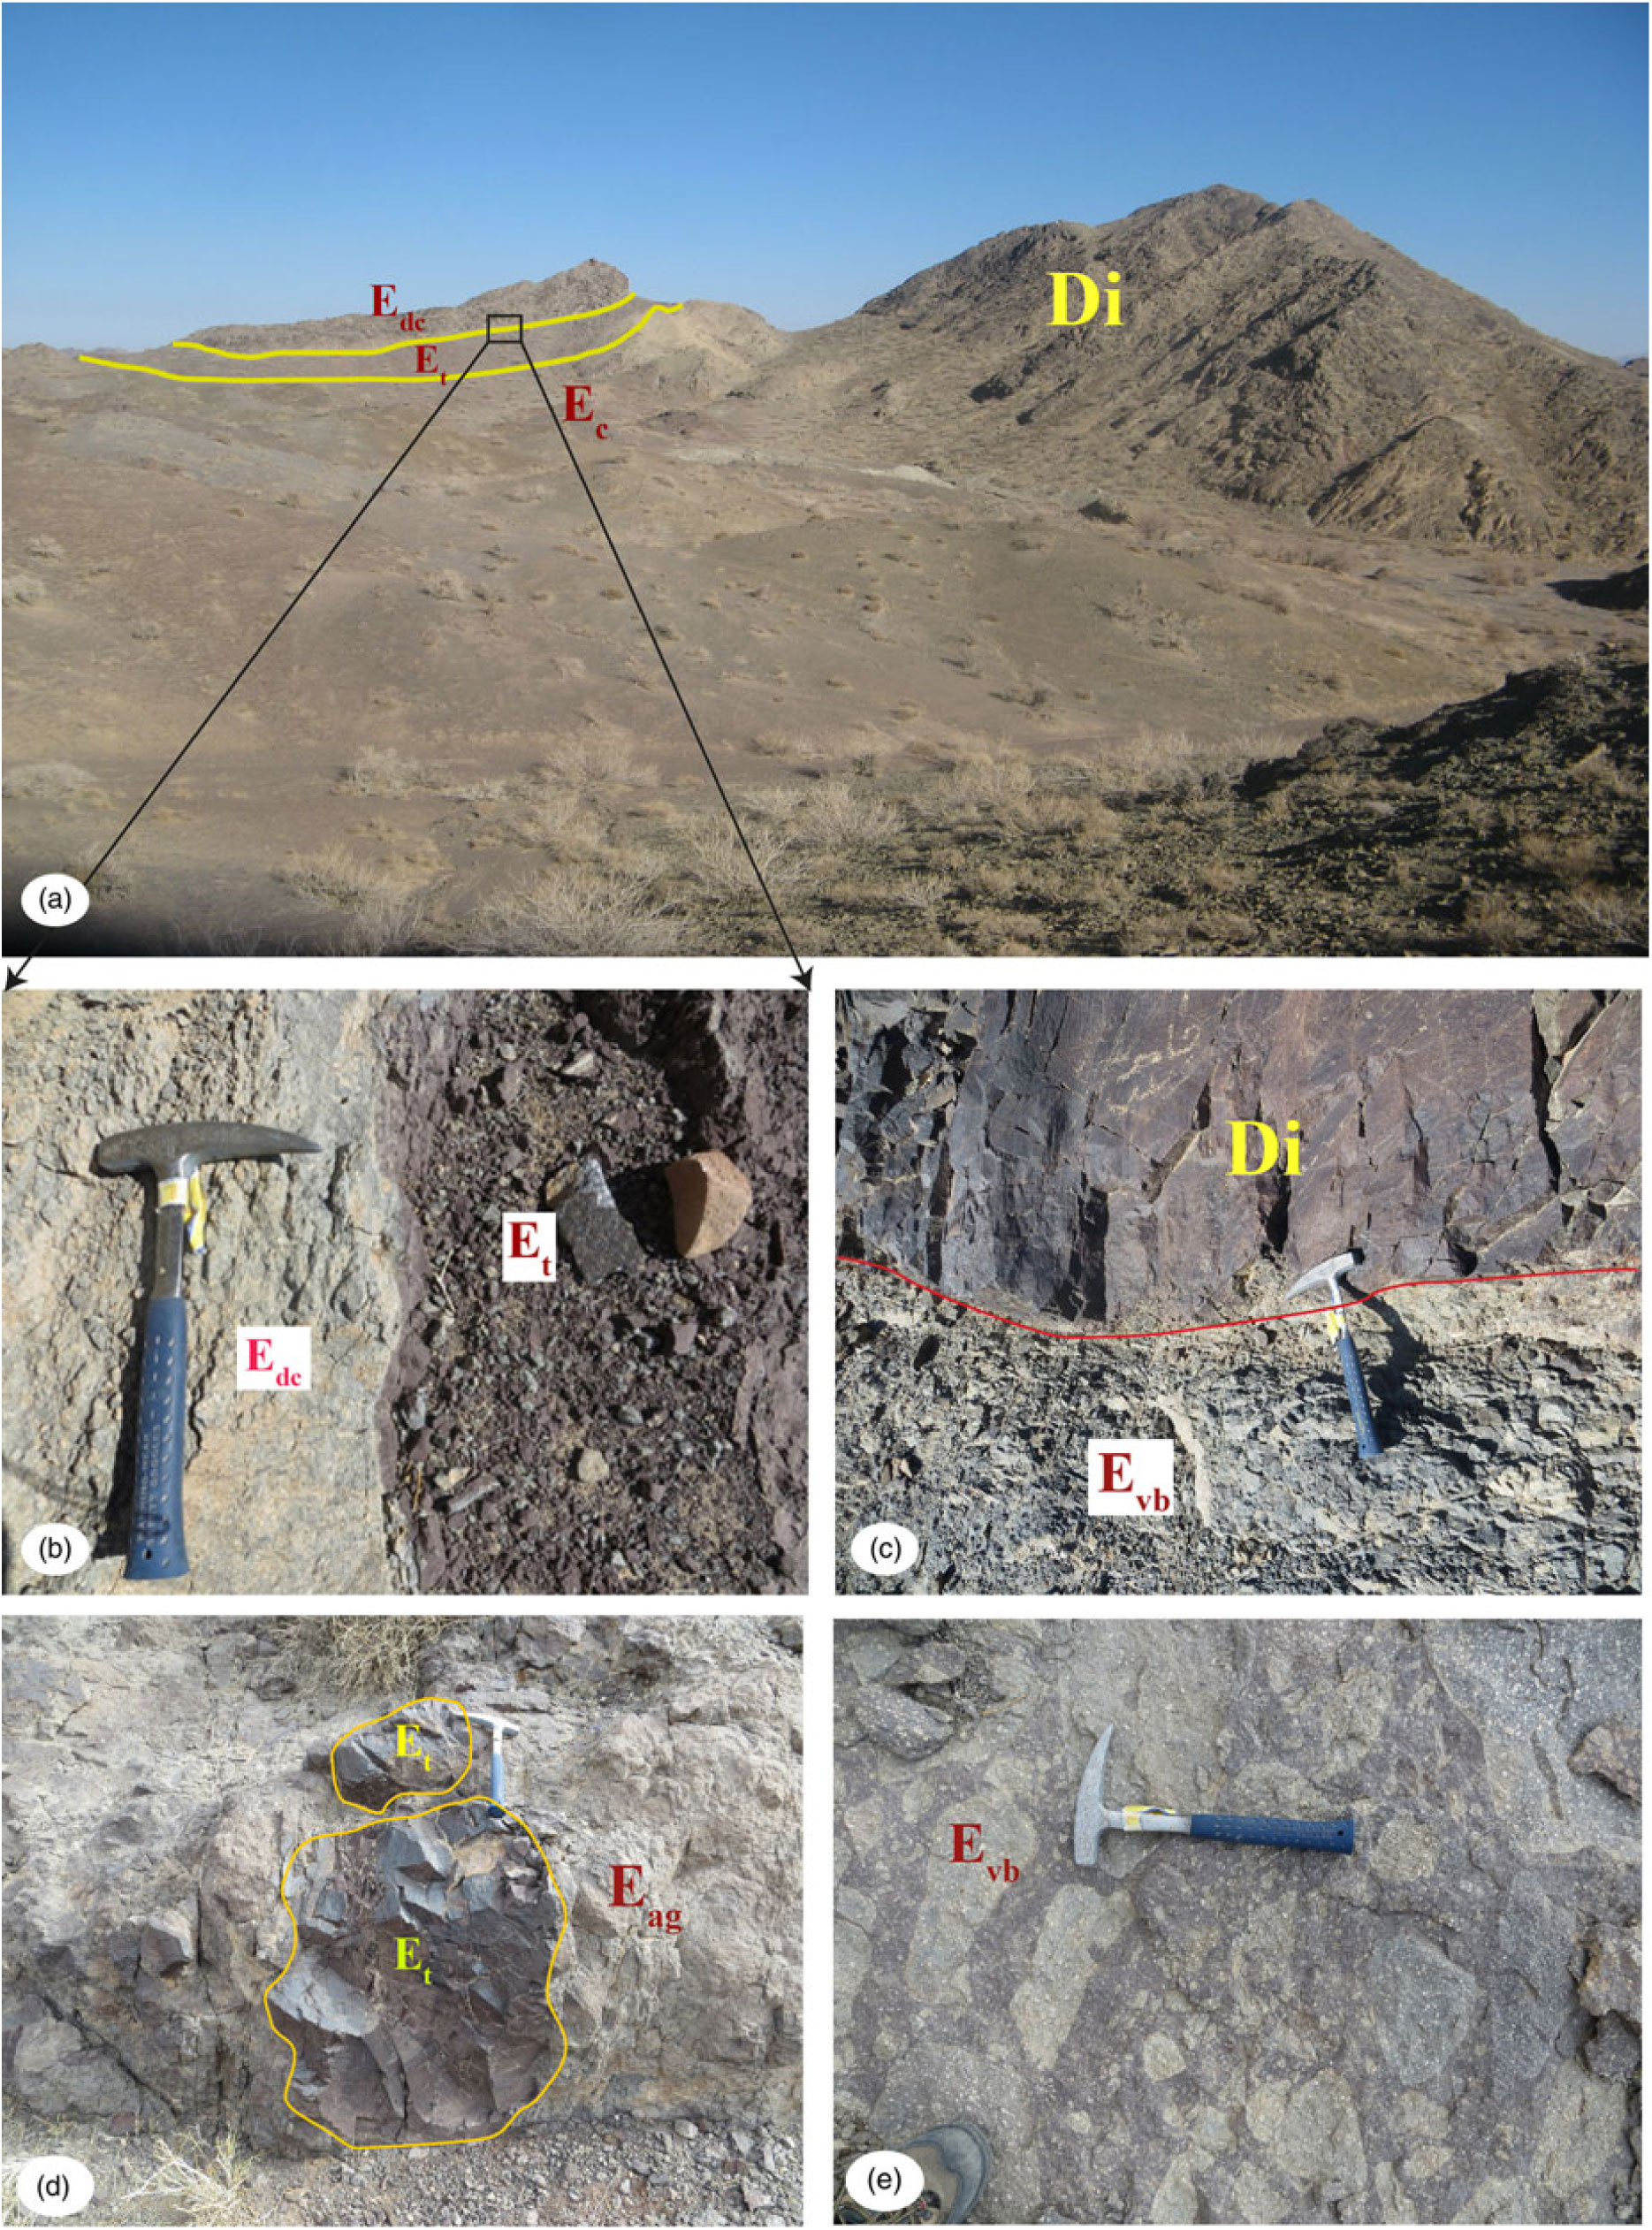
Fig. 3. Field views of the Eocene volcano-pyroclastic sequence (Ev1) that is the main host rock of the Chah-Musa intrusion. (a) Northwestern contact of the Chah-Musa sub-volcanic intrusion parallel to bedding in the country rocks where red tuff and dacitic lava are inclined. (b) Sharp contact between Eocene dacitic lava (Edc) and red tuff (Et). (c) Closer view of the contact of diorite porphyry (Di) with extremely crushed host rocks (Evb) along the western border. (d) Typical agglomerate (Eag) containing large fragments of red tuff (Et). (e) Volcanic breccia at the top of the host sequence.
The Chah-Musa porphyritic hornblende diorite intrusion, emplaced into the Eocene volcanic sequence, is enclosed in a narrow, low-grade contact metamorphic halo consistent with shallow-level emplacement. The intrusion is roughly elliptical (1.5 × 2.3 km; Figs 1c, 4a). Hand specimens exhibit a porphyritic structure with c. 40% phenocrysts (Fig. 4b). Two kinds of contact can be distinguished: (1) a primary, undeformed emplacement contact, moderately dipping to the west, parallel to bedding of the host rocks in the NE part of the intrusion (Fig. 3a); and (2) a western contact associated with extremely crushed host rocks (Fig. 3c) along the inner contact of the intrusion. The latter contact is manifested as onion-skin erosion of the porphyritic diorite (Fig. 4c) that is attributed not to weathering processes but rather, to pressure release expansion due to erosion of the overlying rocks, and creation of curved joints under conditions of radial compressive stress. A mafic dyke of microgabbro, more than 1.8 km in length, 4–10 m in thickness and NE–SW in trend, intrudes the Chah-Musa intrusion and its volcanic host. To the east, the contact is covered by Quaternary alluvium.
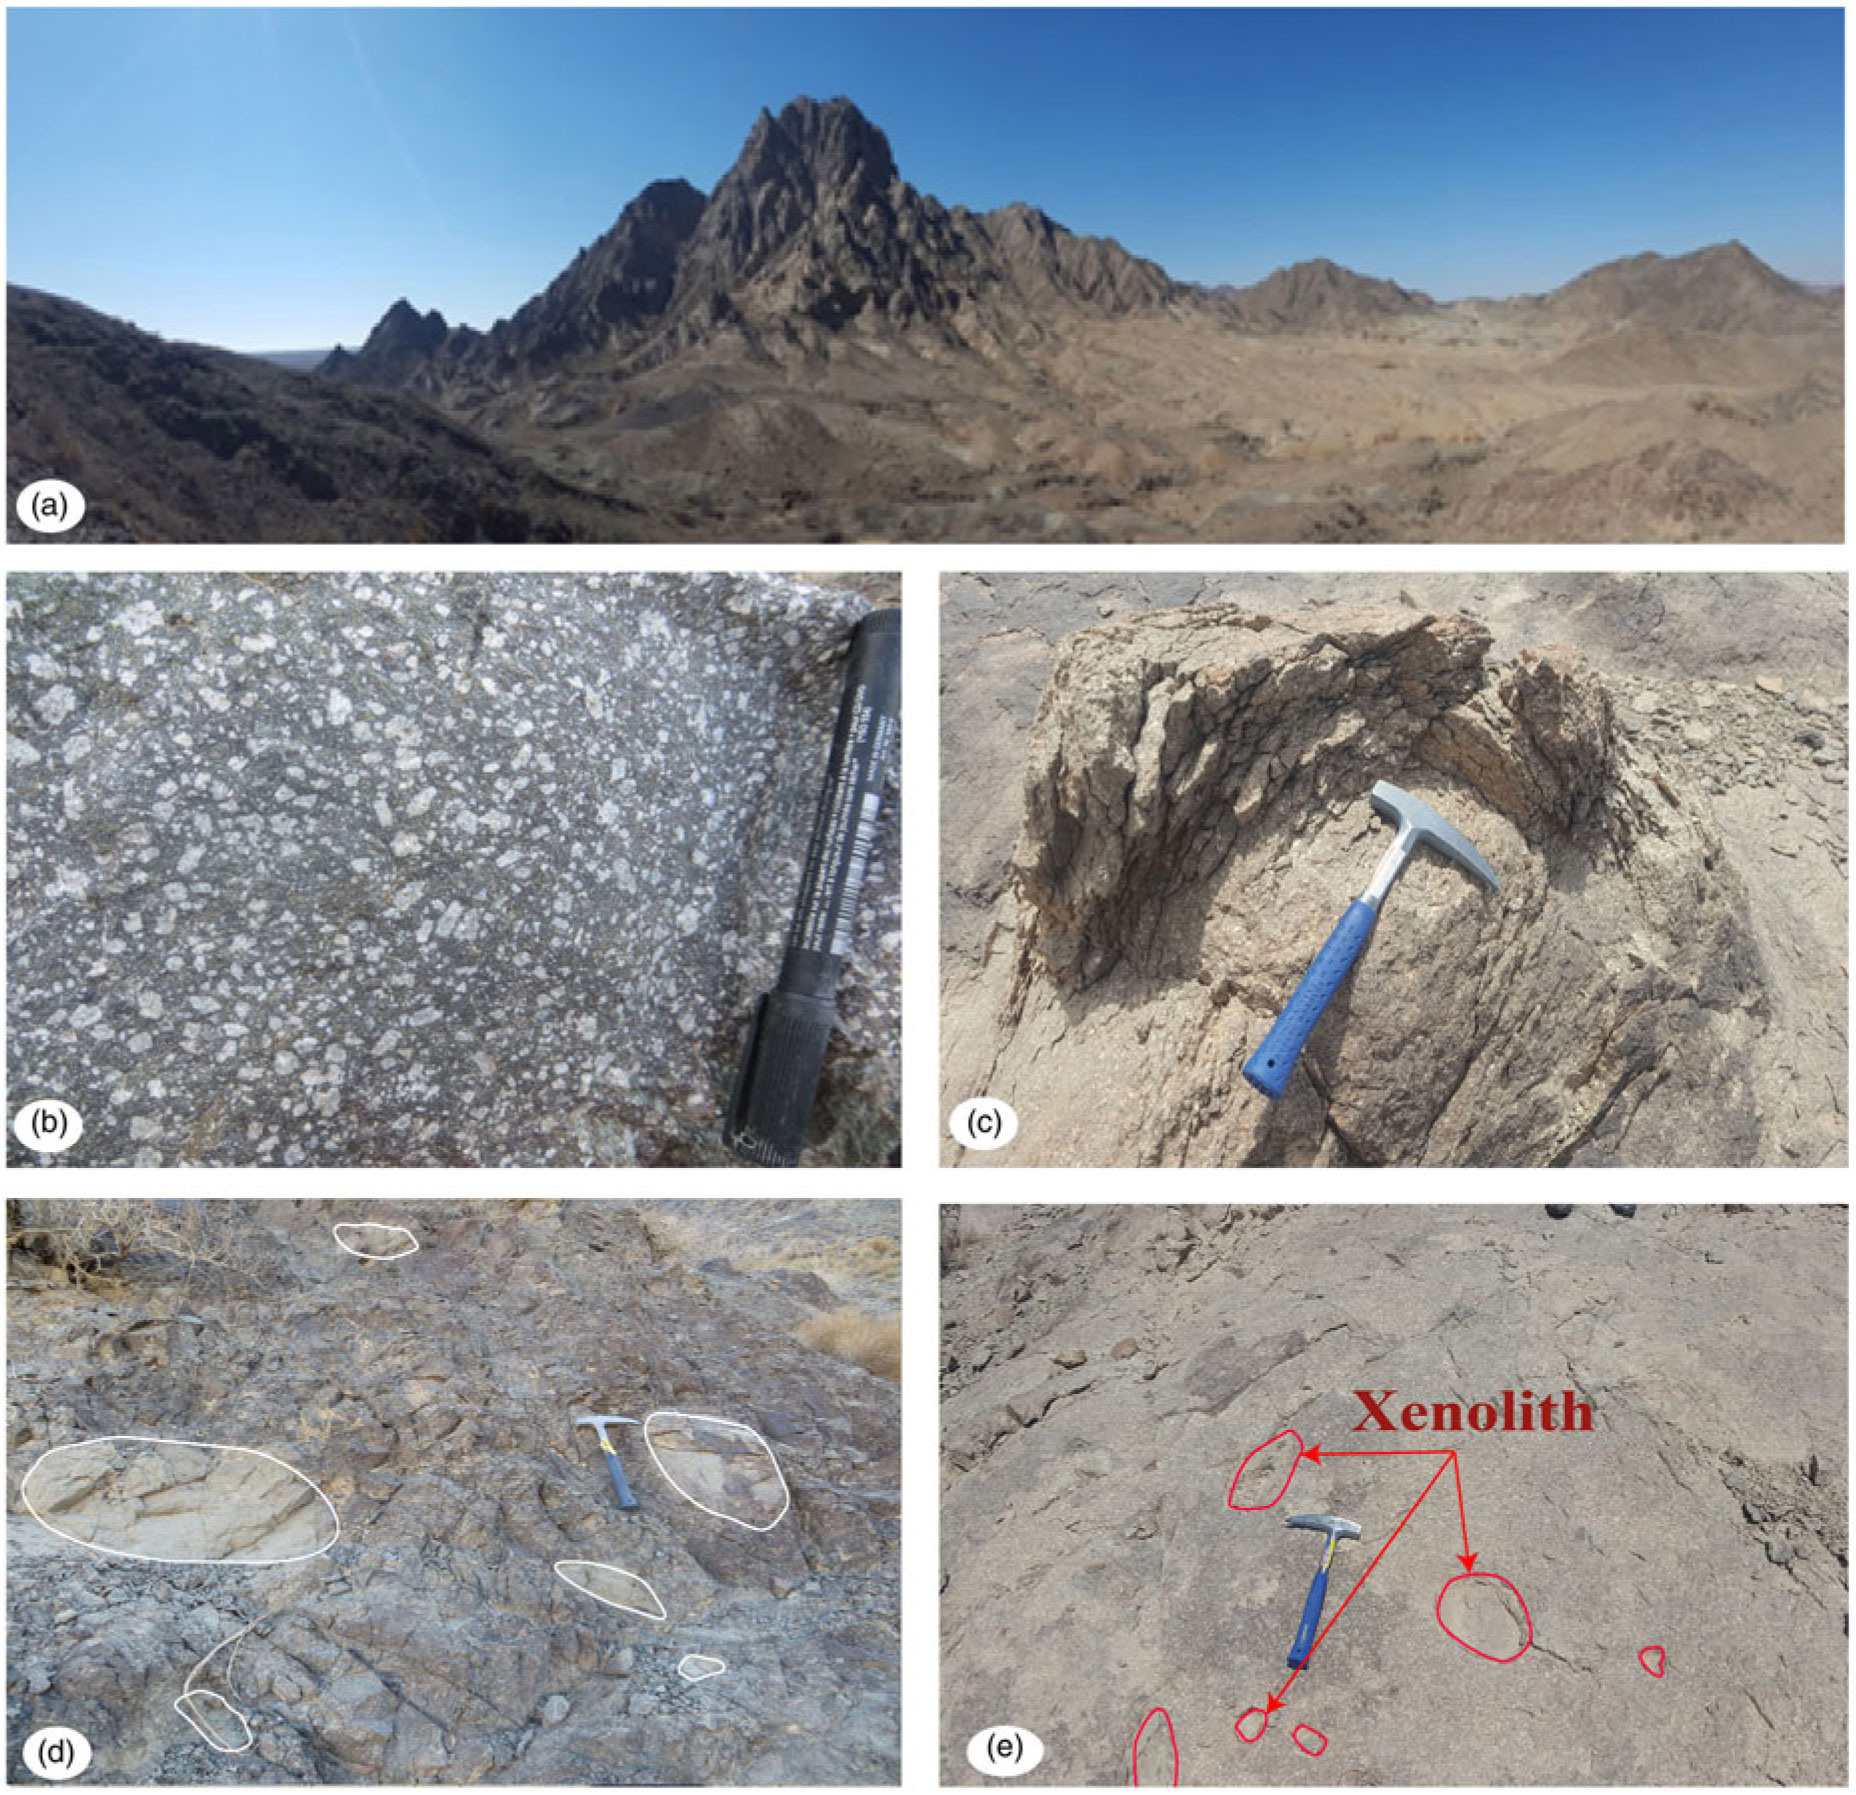
Fig. 4. (a) Field view of the Chah-Musa intrusion. Landscape of the summit and low-elevation flat area of Chah-Musa. (b) Hand specimen of fresh porphyritic diorite containing phenocrysts of plagioclase and needles of hornblende set in a fine-grained matrix. (c) Onion skin erosion of the porphyry diorite at the western inner contact. (d) and (e) respectively show some xenoliths with preferred orientation parallel to the innermost margin, and small randomly disseminated xenoliths at the centre of the intrusion.
The summit of the Chah-Musa body is at the centre of the intrusion, close to station #40 (Figs 1c, 4a). According to field studies, plagioclase phenocrysts, dark hornblende needles and platy biotites occur in the least altered eastern peripheral part of the intrusion. In the central part of the intrusion, of light creamy colour, large plagioclase phenocrysts and opacified hornblende ± biotite are present, consistent with sericite/quartz (phyllitic) alteration (right side of Fig. 4a). Weak chlorite/calcite (propylitic) alteration appears in the outer margin of the intrusion. Intense propylitic alteration (replacement by epidote, chlorite, calcite and pyrite) is observed in boreholes at depths of 70 to 90 m. The soft, light-brown to yellow argillic zone commonly contains hematite, limonite and clay minerals. Propylitic and phyllitic alterations are overprinted by argillic alteration, especially along the main fractures. Supergene processes are responsible for the formation of extensive alteration of hypogene sulphide minerals such as bornite, pyrite, minor chalcopyrite to secondary chalcocite, covellite, digenite, malachite and neotocite (Imamjome et al. Reference Imamjome, Rastad, Bouzari and Rashidnezhad2009).
Elongate xenoliths of different sizes are abundant at the borders of the intrusion (Fig. 4d). Their preferred orientations at the western margin of the intrusion suggest that an increasing strain had been imposed during intrusion. Toward the centre of the intrusion, small xenoliths appear to be randomly distributed (Fig. 4e).
3. Field and laboratory techniques
Fieldwork was aimed at collecting structural data and a representative suite of samples. A minimum of two 25 mm diameter oriented core cylinders were collected at each station. In all, 73 stations provided 674 core samples, 2.2 cm in height (Fig. 1c). After preparation of the latter, the magnetic fabric (AMS) was measured with a Kappabridge MFK1-FA susceptometer (AGICO) at the Geomagnetic Laboratory, Shahrood University of Technology, Iran. The instrument operates at low field frequency (4 × 10⁻⁴ T; 920 Hz). Orientations and magnitudes of the three principal axes of the AMS ellipsoids (K1 ≥ K2 ≥ K3) were obtained for each sampling station, through the tensor average of the individual AMS measurements. Bulk susceptibility (Km) is the mean value of the magnitudes of the three axes of the AMS ellipsoid: Km = 1/3(K1 + K2 + K3). The anisotropy percentage P% = 100[(K1/K3) – 1] and the shape parameter T = ln[K2/(K1/K3)]/ln[K1/K3] (Jelinek, Reference Jelinek1978) were calculated for each sampling station. A positive shape parameter (T < 0) corresponds to an oblate ellipsoid, a negative parameter (T > 0) to a prolate ellipsoid. The magnetic foliation plane contains the K1 and K2 axes, and the magnetic lineation is parallel to K1 in this plane. The values of scalar parameters (Km, P%, T) and the orientation data (foliation and lineation) for each station are given in Table 1.
Table 1. Anisotropy of magnetic susceptibility data of the Chah-Musa intrusion

Locations (Long./Lat.); n = number of measured specimens; Km = mean magnetic susceptibility [10−3SI]; P% and T = anisotropy and shape parameters; K1 = magnetic lineation; K3 = magnetic foliation, plane normal to K3.
In addition, we prepared 73 thin-sections for petrographic and microstructural study. Identification of the basic magnetic mineralogy responsible for the susceptibility and its anisotropy was performed using a CS-2 furnace (AGICO) coupled to a KLY-2 susceptometer located in the Palaeomagnetic Laboratory of the Geological Survey of Iran, Tehran. This device records the susceptibility variation (Km) as a function of temperature from 20 °C to 700 °C. Analysis of the regional tectonics, the AMS measurements and petrographic observations of thin-sections comprise the database for interpretation of the emplacement mechanism of the Chah-Musa intrusion.
4. Petrography and microstructures
Throughout the intrusion, the fresh diorite of the Chah-Musa body displays no evidence for subsolidus deformation, according to the criteria of Paterson et al. (Reference Paterson, Vernon and Tobisch1989) and Vernon (Reference Vernon2000). Microscopic examination reveals a porphyritic texture consisting of plagioclase phenocrysts (>30%), needles of hornblende (10%) and biotite books (5%). Microcrystalline plagioclase and hornblende are abundant in the groundmass (Fig. 5a, b), and quartz, apatite, opaques and zircon are accessory minerals.

Fig. 5. Representative photomicrographs of texture and mineral assemblages of fresh (a, b) and variously altered rocks from the Chah-Musa intrusion. (a) Sieve texture in plagioclase crystals with a clear rim; (b) (a) at plane polarized light (ppl). (c) Diorite containing plagioclase, hornblende with opacified rims, and opaques (#12); (d) (c) at ppl. (e) Diorite with phyllitic alteration in which plagioclase is altered to sericite (#1); (f) (e) at ppl. (g) Diorite with argillic alteration exhibiting complete replacement of plagioclase by kaolinite (#16); (h) (g) at ppl.
Euhedral plagioclase laths up to 2 cm in length commonly display a well-developed zonation. Plagioclase exhibits either a clear rim (Fig. 5a, b) or it has a sieved texture. Disequilibrium textures include sieved or dusty plagioclase (Tsuchiyama, Reference Tsuchiyama1985) or rounded and embayed crystals (Stimac et al. Reference Stimac, Pearce, Donnelly-Nolan and Hearn1990), suggestive of magma mixing or mingling.
Hornblende generally has opaque rims (Fig. 5c, d) or is completely replaced by opaque minerals (Fig. 5g, h). It can be rendered unstable by melt degassing during decompression (Buckley et al. Reference Buckley, Sparks and Wood2006), increase of temperature and/or oxidation of the melt (Rutherford & Devine, Reference Rutherford and Devine2003).
Books of magmatic biotite are commonly observed in the least altered rocks, especially at the eastern margin of the intrusion. Apatite and some zircon commonly occur as inclusions in opaque minerals, in biotite, and in the groundmass as accessory phases. Magnetite is also a common accessory mineral in the least altered rocks, whereas various associations of pyrite, chalcocite and rutile are typically present in the altered equivalents of these rocks. Anhedral interstitial crystals of sparse quartz are present in the groundmass.
Mineral assemblages indicative of weak propylitic, phyllitic and argillic alterations are common. A zone of weak propylitic alteration occurs in the eastern peripheral parts of the intrusion, where mafic minerals have been transformed into chlorite and calcite.
In the zone of phyllitic alteration, in the central part of intrusion, plagioclase and hornblende principally are replaced by sericite (Fig. 5e, f) and quartz, accompanied by various amounts of pyrite. Argillitic alteration, which may totally obscure the primary rock texture, is typically characterized by the presence of kaolinite (Fig. 5g, h) and pyrophyllite.
5. AMS analysis
The anisotropy of magnetic susceptibility (AMS) technique provides a rapid quantitative description of the crystal shape fabric in magmatic rocks (e.g. Gleizes et al. Reference Gleizes, Nédélec, Bouchez, Autran and Rochette1993; Bouchez, Reference Bouchez, Bouchez, Hutton and Stephens1997; Archanjo & Launeau Reference Archanjo, Launeau, Martín-Hernández, Lunemburg, Aubourg and Jackson2004; De Saint-Blanquat et al. Reference De Saint-Blanquat, Habert, Horsman, Morgan, Tikoff, Launeau and Gleizes2006; Schöpa et al. Reference Schöpa, Floess, De Saint-Blanquat, Annen and Launeau2015) and helps to determine the bulk internal structure of a pluton in situations where macroscopic foliation and lineation are weak or absent (Sheibi et al. Reference Sheibi, Bouchez, Esmaeily and Siqueira2012).
5.a. Bulk magnetic susceptibility
Bulk magnetic susceptibility (Km) of rocks, which is the addition of the contributions of the ferromagnetic and the paramagnetic mineral phases (Tarling & Hrouda, Reference Tarling and Hrouda1993), is observed to correlate with field and petrographic observations of alteration. Its magnitude naturally depends on the abundance of the different magnetic minerals, but also on the sizes of magnetite crystals, their chemical compositions, and upon their internal stress and defects (Dunlop & Özdemir, Reference Dunlop and Özdemir1997). Susceptibility correlates with alteration, as observed in the field and by petrography (Fig. 6). For fresh and weakly propylitic samples, in which SI ranges from 10 to 15, magnetite acts as the dominant magnetic carrier. Samples that experienced propylitic alteration have a lower magnetic susceptibility. Magnetite being unstable in phyllitic alteration environments (Reed, Reference Reed and Barnes1997; Corbett & Leach, Reference Corbett and Leach1998; Sillitoe, Reference Sillitoe2010), this explains the susceptibility decrease in our corresponding samples. The lowest susceptibilities (Km < 0.4 SI) correspond to samples that are both argillitized and located in the vicinity of main faults, where only paramagnetic minerals remain. The magnetic susceptibility contour map (Fig. 7) displays an asymmetrical zonation, with maximum values located along the eastern border and minimum values at the centre and along the western border of the intrusion.

Fig. 6. Magnetic susceptibility histogram (in SI) for different types of altered samples from Chah-Musa intrusion.

Fig. 7. Magnetic susceptibility contour map (in SI) of the Chah-Musa intrusion.
5.b. Opaque mineralogy and magnetic susceptibility
Previous studies have shown that the stability of Fe–Ti oxides is very sensitive to the physical and chemical properties of hydrothermal systems. For example, significant amounts of secondary magnetite may appear during the early stages of potassic alteration (Arancibia & Clark, Reference Arancibia and Clark1996), whereas circulation of late-stage acidic fluid associated with the phyllitic alteration tends to destroy the magnetite (Beane & Bodnar, Reference Beane, Bodnar, Pierce and Bohm1995). As a consequence the formation, destruction or variation of grain size of the Fe–Ti oxides, as related to hydrothermal fluids, generates a diagnostic magnetic signature in each alteration zone (Sexton et al. Reference Sexton, Morrison, Orr, Foley and Wormald1995; Sheibi et al. Reference Sheibi, Mirnejad and Pooralizadeh Moghaddam2016). Idealized models have been proposed to describe such relationships in porphyry-copper deposits (Clark et al. Reference Clark, French, Lackie and Schmidt1992; Purucker & Clark, Reference Purucker, Clark, Mandea and Korte2011).
To further explore relationships related to alteration, we investigated temperature-dependent magnetic susceptibility in three selected samples (Fig. 8). The less-altered diorite (site #38) displays a dominant ferromagnetic phase (Fig. 8a). An abrupt decrease from 550 °C is consistent with the presence of nearly pure (Ti-free) magnetite (Riveros et al. Reference Riveros, Veloso, Campos, Menzies and Véliz2014). Figure 8b (sample #16 with phyllitic alteration) exhibits typical low-susceptibility thermomagnetic behaviour where only paramagnetic material is present. From c. 440 °C up to c. 550 °C, the increase in susceptibility is attributed to the formation of magnetite grains during heating, as attested by the sharp decrease at 580 °C. During cooling, a strong increase of susceptibility starting at 580 °C is observed (Fig. 8b), indicating the continuation of magnetite formation at high temperature. Tudryn & Tucholka (Reference Tudryn and Tucholka2004) attributed such a thermomagnetic behavior (like sample #16) to altered pyrite. Their experiments illustrate a case in which a paramagnetic mineral, namely pyrite, that cannot be detected by Curie temperature (T C), can be identified by its transformation into ferrimagnetic phases during heating/cooling experiments. Finally, in the low-susceptibility sample with argillitic alteration (site #39; Fig. 8c) we observe, along with Just & Kontny (Reference Just and Kontny2012), that a ferrimagnetic phase is oxidized into hematite, as attested by some susceptibility remaining above 600 °C.

Fig. 8. Susceptibility vs temperature determination of three representative hydrothermally altered rocks from the Chah-Musa intrusion. (Km in SI; T in °C.) K(T) curves with susceptibility normalized to room temperature.
5.c. Magnetic anisotropy (P%) and shape parameter
Anisotropy degree P% is generally used to confirm or extend the deformation zones characterized by microstructural studies. There is generally a positive correlation between P% and the intensity of strain (Borradaile, Reference Borradaile1991). However, P% may also correlate with bulk magnetic susceptibility (Km), and thus depend on both mineral composition and strain intensity (Rochette et al. Reference Rochette, Jackson and Aubourg1992). In the Chah-Musa samples, P% ranges from 0.6% to 9.1%, but for 70% of the sites, P% lies between 0.6% and 4.8% (Table 1; Fig. 9). The contoured P% values, using a spline and a first-order polynomial function (Fig. 9), are weakly concentric: the lowest P% is located to the NE and SW margins. Higher P% values appear to the SE and in some isolated sites adjacent to the NW margin of the intrusion.

Fig. 9. Anisotropy percentage contour map of the Chah-Musa intrusion.
The T parameter indicates the shape of the magnetic ellipsoid; positive T values (oblate) indicate potential flattening strain, negative T (prolate) indicates potential constrictional strain and T ~ 0 corresponds to plane strain. Roughly concentric isocontours of T exhibit maxima in the outer part of the intrusion, decreasing towards the centre (Fig. 10). Some stations in the eastern half of the intrusion exhibit strongly oblate ellipsoids. Stations characterized by prolate ellipsoids are distributed in the centre of intrusion (near the topographic summit).

Fig. 10. Shape factor contour map of the Chah-Musa intrusion. Selected stereoplots of magnetic fabrics developed in the feeder zone at the centre and roof zone at the eastern area showing the mean K1 and K3 orientations. The anisotropy degree vs ellipsoid shape (P–T) plots of the AMS highlighting variable ellipticity of the magnetic fabric.
6. Magnetic fabric patterns
Magnetic fabric of igneous bodies is characterized by the magnetic lineation K1, and the magnetic foliation perpendicular to K3 (Hrouda, Reference Hrouda1982; Bouchez, 1997, Reference Bouchez2000). Magnetic lineations exhibit a relatively concentric distribution pattern in map view (Fig. 11). With the exception of four stations at the NW and SE borders, lineations plunge shallowly in the outer part of the intrusion, and steeply in the central domain, where susceptibility ellipsoids are dominantly prolate (Fig. 11). This suggests that this central part of the intrusion can be considered as a feeder zone. In a density orientation diagram, K1 is rather scattered with a faint tendency to belong to a girdle and to form a maximum at 43°/53° N (Fig. 12). In map view, dips of foliation are rather concentric and roughly parallel to the contacts of the intrusion. Toward the border of the intrusion (Fig. 13), dips of foliation vary from intermediate to steep (Fig. 13). Due to the more-or-less concentric organization of the foliation planes, an orientation diagram of the foliation poles does not contribute much to the structural information.
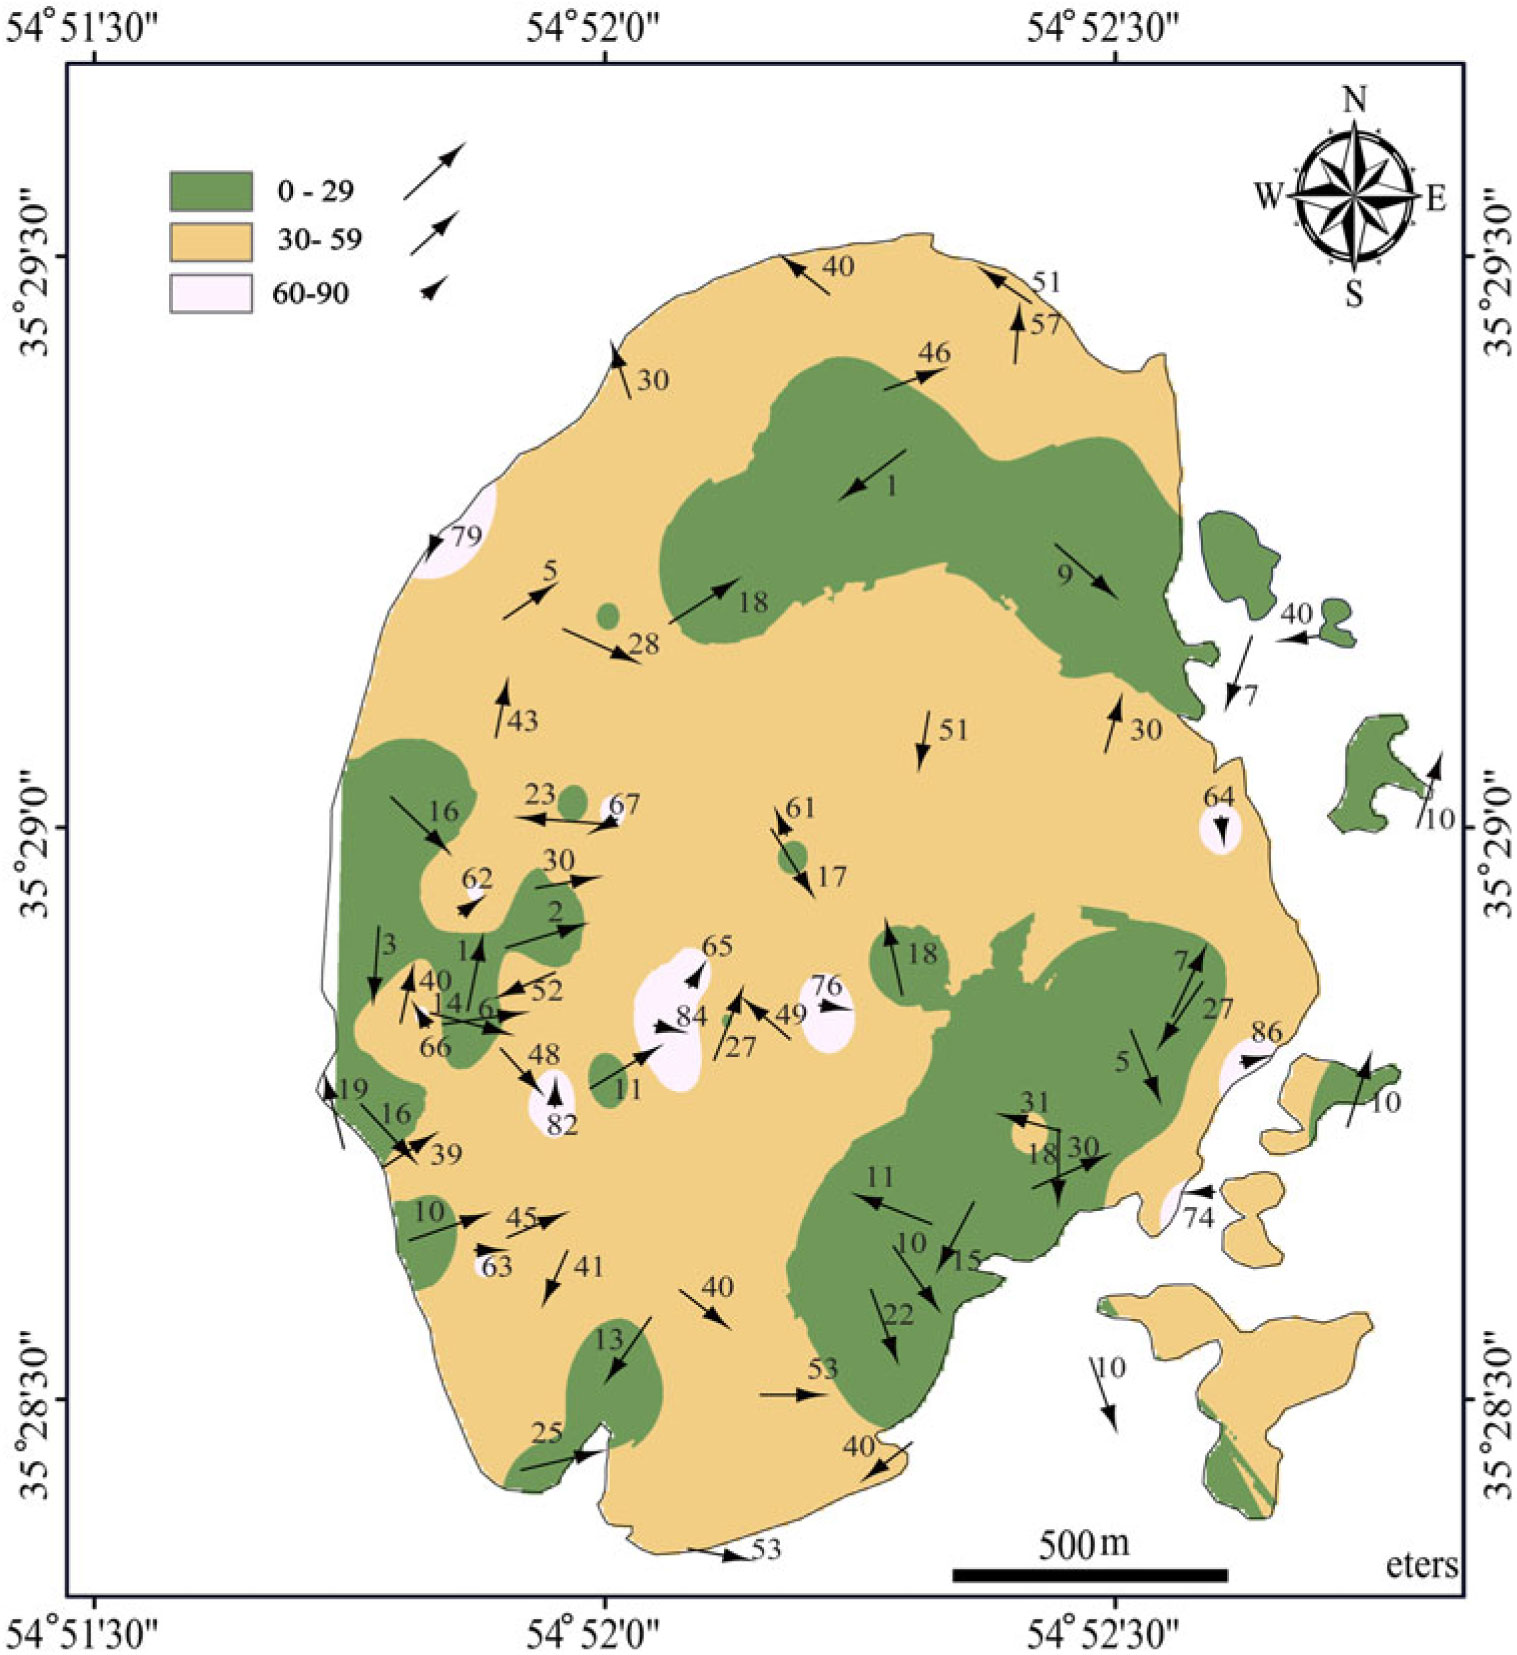
Fig. 11. Magnetic lineation map of the Chah-Musa intrusion. The main magma feeder zone is concentrated in the central area.

Fig. 12. Stereoplots representing lineations (K1) and poles to foliation planes (K3).
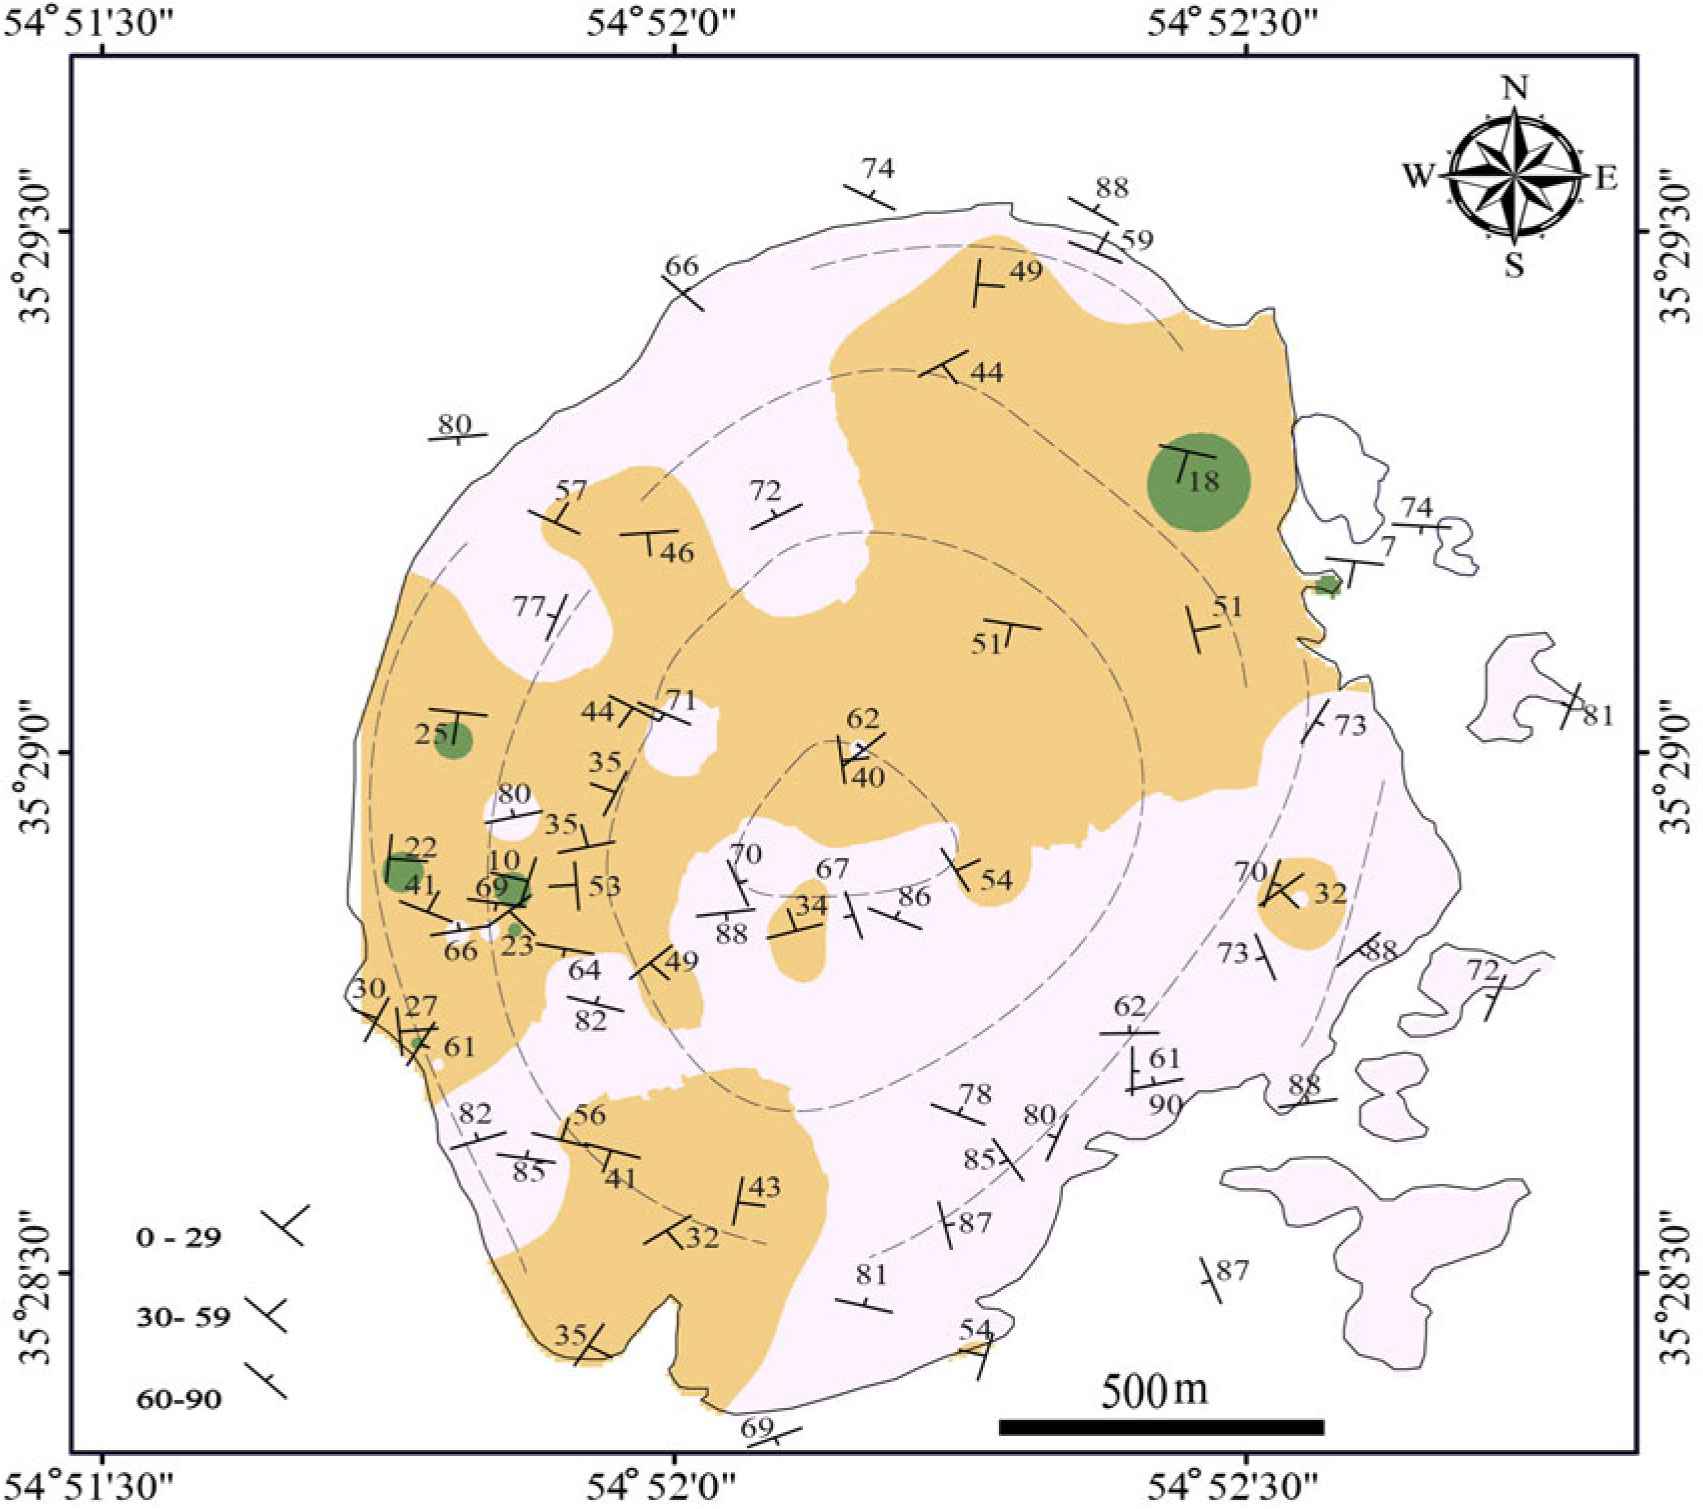
Fig. 13. Magnetic foliation map of the Chah-Musa intrusion. The dashed lines tend to delineate concentric foliation trajectories.
7. Discussion
7.a. Hydrothermal alteration and its effects on the magnetic properties
Anisotropy of magnetic susceptibility (AMS) has been applied to the analysis of hydrothermal alterations associated with magmatic intrusions (e.g. Tapia et al. Reference Tapia, Townley, Córdova, Poblete and Arriagada2016). Previous studies have already pointed out the relationship of hydrothermal alteration to rock magnetic properties (Townley et al. Reference Townley, Roperch, Oliveros, Tassara and Arriagada2007; Astudillo et al. Reference Astudillo, Roperch, Townley, Arriagada and Maksaev2008; Riveros et al. Reference Riveros, Veloso, Campos, Menzies and Véliz2014). For example, Ade-Hall et al. (Reference Ade-Hall, Palmer and Hubbard1971) observed a wide range of opaque mineralogical changes in hydrothermally altered basalt flows. Lapointe et al. (Reference Lapointe, Morris and Harding1986) suggested the application of magnetic susceptibility as a geophysical index of alteration. Nakamura & Nagahama (Reference Nakamura and Nagahama2001) reported magnetic and fractal properties of fractured granites from a drill core approaching the Nojima fault, Japan. Xu et al. (Reference Xu, Wu, Wu and Chen2003) studied hydrothermal alteration of magnetic fabrics of rocks in the Xiaoban gold-bearing shear belt, Fujian Province, China. Magnetic fabrics (AMS) and magmatic fabrics (shape preferred orientations of plagioclase; SPO) were compared in order to test whether these attributes are interrelated (e.g. Bascou et al. Reference Bascou, Camps and Marie Dautria2005) or whether secondary processes such as shock metamorphism and hydrothermal alteration are responsible. Riveros et al. (Reference Riveros, Veloso, Campos, Menzies and Véliz2014) demonstrate a genetic relationship between the hydrothermal alteration processes, Fe–Ti oxide minerals and themagnetic properties of the wall rock in the Escondida porphyry-copper deposit, Chile.
Weathering and alteration may influence the magnetic fabric and, thus, its interpretation. A thorough investigation of the magnetomineralogy is therefore important in the analysis of magnetic fabrics. Hereabove, we have related the magnetic susceptibility to the magneto-mineralogy of the intrusion from a ferromagnetic behaviour in the fresh or less altered samples to a paramagnetic behaviour in the deeply argillitic altered ones. In order to reveal the effect of alteration on the geometry and orientation of the magnetic fabrics, the anisotropy degree vs the bulk magnetic susceptibility is plotted for the variously altered samples (Fig. 14a). Susceptibility and anisotropy degree are strongly correlated, particularly along fault zones where an argillitic alteration is present. As noted above, the degree of anisotropy correlates both with the intensity of deformation and with magnetic mineral nature and composition. Correlation between P% and strain intensity in ferromagnetic granites has been a matter of debate. To apply P% as a gauge of strain intensity, we must first demonstrate that P% is independent of Km (Sen et al. Reference Sen, Majumder and Mamtani2005). Clustering of magnetite crystals can also lead to magnetic interactions, further complicating the interpretation of P% and shape ratios of magnetite crystals (see Archanjo et al. Reference Archanjo, Launeau and Bouchez1995). Figures 7 and 9 reveal that areas with high Km (e.g. northern part of the pluton) have low P%. An inverse correlation pertains to diorite samples in the vicinity of the western contacts and supports an alternative interpretation, namely that the magnetic signature is related to strain during emplacement, which increases when approaching the contact. Moreover, for the Chah-Musa pluton no proportional relationship between P% and Km is observable in Figure 14. Microscope petrography of the diorites reveals no significant clustering of magnetite similar to that in the granites studied by Archanjo et al. (Reference Archanjo, Launeau and Bouchez1995). This agrees with our field observations of an intense deformation of the host rocks and flattened enclaves associated with onion-skin erosion of the porphyritic diorite at the western margins.

Fig. 14. (a) Susceptibility (Km in SI) vs anisotropy (P%); (b) susceptibility (Km) vs T shape fabric; (c) anisotropy (P%) vs T shape fabric.
Plots of shape fabric parameter vs susceptibility (Fig. 14b) and vs the degree of anisotropy (Fig. 14c) exhibit no correlation between shape and type of alteration, shape of the magnetic anisotropy and bulk susceptibility, nor between the anisotropy degree and the susceptibility. Nevertheless, some stations in the central part of the intrusion with steeply plunging magnetic lineations and prolate ellipsoids can be considered as belonging to the main feeder zone (Fig. 10). Proximity to the roof zone is inferred from the predominantly oblate shape of the magnetic ellipsoid (Fig. 10) and the subhorizontal foliations in the east of the intrusion (Fig. 13). Isolated outcrops having flat-lying cover-rocks onto dioritic rocks are present in the vicinity of these stations. It therefore seems that the magnetic ellipsoids do not substantially change in shape after hydrothermal alteration.
7.b. Regional geological context
Much controversy still persists about how enough space is produced to accommodate intrusive bodies in the upper crust. Magmatism that produced the TCS arc is typical of an activity related to the northward subduction of the Sabzevar–Darouneh branch of the Neo-Tethys ocean. In this arc, structures indicate a special aspect of strike-slip faulted terminations. Khademi (Reference Khademi2008) defined two such fault sets in the TCS arc. (i) A mainly compressional set of structures that trend approximately N–S (e.g. east-verging thrust faults and folds involving Palaeozoic and Mesozoic rocks). Dextral and normal shear structures, microfolds, foliations and lineations associated with these structures. (ii) The second set trends NE–SW and includes open gentle folds and younger thrusts verging to the south. These structures involve mainly Cenozoic and younger rocks, but also the older rocks to some degree. The TCS magmatic arc and its bounding faults (Anjilow on the north and Toroud on the south) were involved during the Arabia–Eurasia convergence. A combination of rotation and compression of the Lut block, as part of Central Iran and bounded to the north by the Darouneh fault, led to the transpressional deformation of the studied area (Tadayon et al. 2017, Reference Tadayon, Rossetti, Zattin, Calzolari, Nozaem, Salvini, Faccenna and Khodabakhshi2018).
7.c. Chosen model for the Chah-Musa
The N–S ellipsoidal Chah-Musa intrusion displays rather concentric magnetic lineations and foliations that are consistent with models of ascent and emplacement of elliptical intrusions created by single-blob or nested diapirism, ballooning or laccolith-like emplacement (see Paterson & Vernon, Reference Paterson and Vernon1995). Among these possibilities, only doming (Fink et al. Reference Fink, Malin and Anderson1990; Goto & Tsuchiya, Reference Goto and Tsuchiya2004), diapirism (Ramsay, Reference Ramsay1989) and ballooning or in situ inflation of magma (Sylvester et al. Reference Sylvester, Oertel, Nelson and Christie1978; Holder, Reference Holder1981; Molyneux & Hutton, Reference Molyneux and Hutton2000) are able to explain an elliptical intrusion with onion-skin structure revealed by erosion. Otherwise, mutual similarities make it difficult to distinguish between these emplacement models. Assuming that one of the principal stresses is vertical near the free surface, Anderson (Reference Anderson1951) demonstrated that the three major classes of faults (reverse, normal and strike-slip) result from the three principal classes of inequality that may exist among the principal stresses. If gravity (i.e. vertically-directed force) is dominant, the result is roof uplift and/or doming (associated with laccolith formation), with superimposed normal faulting in brittle regimes, and boudinage in ductile regimes of the host rock (Anderson, Reference Anderson1951). A horizontally directed positive pressure gradient in magma would lead to reverse or strike-slip faulting in a brittle regime or folding in a ductile regime (Anderson, Reference Anderson1951). However, since normal faulting and reverse or strike-slip fault are not observed among the host rocks of Chah-Musa intrusion, we contend that doming was not a mechanism for the Chah-Musa intrusion.
Diapirism is possible in the ductile lower crust. Some authors (e.g. Marsh, Reference Marsh1982; Vigneresse, Reference Vigneresse1995) have questioned diapirism as a viable emplacement mechanism. Gravitational ascent is hampered due to insufficient density contrast, heat energy lost to wall rocks and lacking sufficient buoyancy forces to fracture the brittle crust at the brittle–ductile transition (Vigneresse, Reference Vigneresse1995). However, the porphyry texture of the rock of Chah-Musa body and the absence of plastic deformation of the host rocks clearly indicate an emplacement at a low level of the upper crust. Petford (Reference Petford1996) argues diapirism cannot be achieved for emplacement in the brittle upper crust. Ballooning is the in situ radial inflation of the magma chamber with successively emplaced magmas and bulk shortening of the country rock due to magma injection (Burchardt, Reference Burchardt2009). During ballooning, the crystal mush ascends up to the neutral buoyancy level which is the site of final emplacement (JK Becker, unpub. thesis, Georg-August Univ., 2000). Continued injection of magma causes the balloon to expand gradually. The enveloping rocks show signs of pure flattening wherein finite strain ellipsoids parallel the outer margin of the intrusion at all levels (Ramsay, Reference Ramsay1989). As a consequence, vertical oblate strain ellipsoids are observed in the equatorial areas of the balloon, and gently outward-dipping, oblate strain ellipsoids are observed in the roof zone. Inside the balloon, a concentric, margin-parallel foliation develops, decreasing in intensity towards the intrusion’s centre (Holder, Reference Holder1981; Clemens et al. Reference Clemens, Petford, Mawer and Holness1997). Radial lineations develop from the centre of the intrusion and reveal the direction of inflation (Clemens et al. Reference Clemens, Petford, Mawer and Holness1997).
Microstructural analyses and low magnetic anisotropy observed across the intrusion point to dominant magmatic flow, not to solid-state deformation. The liquid/crystal proportion may have been high during emplacement. Pushed aside volcanic rocks enveloping the intrusion at its western margins, and inclined red tuffs and dacitic lava at its northeastern margin, display, however, some solid-state deformation. Moreover, the high values of P% argue for a radial expansion along the WNW–ESE-trending axis of the intrusion. In addition, the concentric foliations as well as the orientations of long axes of xenoliths parallel to the pluton margins suggest that the strain gradient increased from centre to periphery of the intrusion. Ballooning causes concentric lineations to develop toward the expanding periphery. All of these features point to ballooning as an emplacement mechanism (Fig. 15). The ballooning at Chah-Musa typifies one of the most common emplacement mechanisms of magmatic bodies at high crustal levels (Antolín-Tomás et al. Reference Antolín-Tomás, Román-Berdiel, Casas-Sainz, Gil-Peña, Oliva and Soto2009). Neighbouring plutons such as Kuhe Cheft (Abedini, Reference Abedini2017) and Kuhe Sukhteh (Bakhtavar, Reference Bakhtavar2018) (Figs 1b, 2) share similar attributes.

Fig. 15. Emplacement model of the Chah-Musa intrusion through a ballooning mechanism at contact with pyroclastic rocks. (a) Regional scale of dextral shear zone providing tensional spaces required for magma ascent and emplacement. (b) Subsequent expansion of magma and pushing aside of the host rocks through ballooning of magma against pyroclastic rocks at the rheological boundary between andesitic agglomerate, volcanic breccia (Eag & Evb) and red tuffs (Et); layering in the host rocks is inclined. (c) Geologic cross-sections of the Chah-Musa intrusion and its country rock. Arrows indicate directions of inflation. Ellipses show shape parameter at the feeder zone and roof of the magma chamber.
Structural investigations and models suggest a causal relationship between magma movement and emplacement along strike-slip (Corti et al. Reference Corti, Moratti and Sani2005), tensional (Hutton, Reference Hutton1988), transpressional (De Saint-Blanquat et al. Reference De Saint-Blanquat, Tikoff, Teyssier, Vigneresse, Holdsworth, Strachan and Dewey1998) and transtensional (Guineberteau et al. Reference Guineberteau, Bouchez and Vigneresse1987) faults. Therefore, the study of the internal fabric of a pluton can be critical to constrain our understanding of the regional tectonics, since magmatism can be associated with both compression and extension (Brown & Solar, Reference Brown and Solar1998; De Saint-Blanquat et al. Reference De Saint-Blanquat, Tikoff, Teyssier, Vigneresse, Holdsworth, Strachan and Dewey1998). Tikoff & Greene (Reference Tikoff and Greene1997) observed that, in transpressional zones, lineations do not necessarily correlate with the direction of magma movement, but rather they reflect changes in the final strain and/or deformation processes affecting an entire region. A model for the emplacement of the Chah-Musa subvolcanic intrusion is proposed in Figure 15. In the eastern parts of the intrusion, the shape parameter suggests that flattening is more intense, a fact that can be interpreted as due to magma pressure against the roof. We postulate that emplacement began as a tension gash that opened parallel to the main stratification of the host rocks and orientated consistent with the early regional E–W dextral shear. As magma was continuously feeding the gradually expanding chamber, it pushed aside the host rocks at a rheological boundary, i.e. at its contact with the Eocene volcanic rocks.
8. Conclusions
The main conclusions of this study can be summarized as follows:
1. The Chah-Musa intrusion, in NE Iran, is a roughly elliptical and calc-alkaline pluton that was emplaced into an Eocene volcano-sedimentary sequence at upper crustal levels. Rather high susceptibility magnitudes (Km > 0.4 SI) point to a dominant ferromagnetic behaviour. The intrusion experienced weak propylitic (chlorite and calcite), phyllitic (sericite, quartz and pyrite) and argillitic (kaolinite, pyrophyllite and hematite) alteration. Samples with weak propylitic and phyllitic alterations appear in the outer marginal and central part of intrusion, respectively. The argillic alteration is restricted to main faults and fractures. Magnetic susceptibility measurements reveal a progressive transition from ferromagnetic (fresh or less altered rock) to paramagnetic behaviour (deep argillitic alteration). K–T susceptibility is a proxy for the type of rock alteration. Even in the presence of alteration, the magnetic shape factor and to a lesser extent the degree of anisotropy serve as strain markers. Therefore, primary magmatic fabrics of the Chah-Musa pluton seem not to have been affected by alteration.
2. Together, lab measurements of magnetic anisotropy (P%) and field observations of flattened enclaves, intensity of internal foliation, and deflection of host-rock structures indicate a pluton with concentric symmetry, whose floor plunges shallowly except for a steep plunge in the feeder zone. Dioritic magma had ascended through faults planes and ballooned in situ in a regional tectonic environment of dextral transpression.
Acknowledgements
The authors thank Dr Fardin Musivand for assistance with the fieldwork. We are grateful to Miss Aslani for the basic magnetic mineralogy at the Palaeomagnetism Laboratory, Geological Survey of Iran. Prof. Leon E Long is greatly appreciated for suggestions, reading and editing the revised manuscript. Constructive comments and detailed reviews by Prof. Jean Luc Bouchez are very much appreciated.


