


1. Introduction
Ophiolites, as well as their dismembered equivalents, which generally occur along suture zones in both collisional-type and accretionary-type orogenic belts (e.g. Xiao et al. Reference Xiao, Han, Sun, Lin, Chen, Li, Li and Sun2008; Lister & Forster, Reference Lister and Forster2009; Yellappa et al. Reference Yellappa, Santosh, Chetty, Kwon, Park, Nagesh, Mohanty and Venkatasivappa2012; Santosh et al. Reference Santosh, Xiao, Tsunogae, Chetty and Yellappa2012, Reference Santosh, Shaji, Tsunogae, Ram Mohan, Satyanarayanan and Horie2013; Saccani et al. Reference Saccani, Allahyari, Beccaluva and Bianchini2013), contain important information about partial melting of the oceanic mantle, the ocean–continent transformation process and the tectonic evolution of orogenies (Niu, Reference Niu1997; Cawood et al. Reference Cawood, Kröner, Collins, Kusky, Mooney, Windley, Cawood and Kröner2009; Xiao et al. Reference Xiao, Windley, Huang, Han, Yuan, Chen, Sun, Sun and Li2009 a). Classification of ophiolites has been one of the most important issues in ophiolite studies since the Penrose symposium on ophiolites (Coleman, Reference Coleman1977; Nicolas, Reference Nicolas1989; Cloos, Reference Cloos1993; Lagabrielle et al. Reference Lagabrielle, Guivel, Maury, Bourgois, Fourcade and Martin2000; Dilek & Flower, Reference Dilek, Flower, Dilek and Robinson2003; Cawood et al. Reference Cawood, Kröner, Collins, Kusky, Mooney, Windley, Cawood and Kröner2009; Pearce, Reference Pearce2014). In a recent synthesis, Dilek & Furnes (Reference Dilek and Furnes2011) classified ophiolites into six major groups: continental margin, mid-ocean ridge, plume, supra-subduction zone (SSZ), volcanic arc and accretionary. Using immobile element geochemistry, Pearce (Reference Pearce2014) divided ophiolites into two main types, i.e. mid-ocean-ridge type and SSZ-ridge type. The mid-ocean ridge ophiolites can be subdivided into N-type, E-type and P-type ophiolites, while the SSZ-ridge type ophiolites include a subduction-initiation type, back-arc basin type and ridge-subduction type.
Various types of ophiolite complexes are widely distributed in the Central Asian Orogenic Belt (CAOB), the largest Phanerozoic accretionary orogen in the world (Şengӧr, Natalin & Burtman, Reference Şengör, Natalin and Burtman1993; Jahn, Wu & Chen, Reference Jahn, Wu and Chen2000; Windley et al. Reference Windley, Kroner, Guo, Qu, Li and Zhang2002; Xiao et al. Reference Xiao, Windley, Badarch, Sun, Li, Qin and Wang2004, Reference Xiao, Windley, Huang, Han, Yuan, Chen, Sun, Sun and Li2009 a) (Fig. 1a). The ages of these ophiolites range from Vendian to Mesozoic, indicating the long evolution history of the CAOB (Xiao et al. Reference Xiao, Windley, Huang, Han, Yuan, Chen, Sun, Sun and Li2009 a,b; Wilhem, Windley & Stampfli, Reference Wilhem, Windley and Stampfli2012). In eastern Junggar, which is one of the most important sections of the CAOB, several ophiolites have been identified over the past dozen years, including, from south to north, the Kelameili, Zhaheba–Almantai, Qiaoxiahala and Kuerti ophiolites (Xinjiang BGMR, Reference Xinjiang1993; Zhang et al. Reference Zhang, Niu, Terada, Yu, Sato and Ito2003; Jian et al. Reference Jian, Liu, Zhang, Zhang, Shi, Shi, Zhang and Tao2003; Xiao et al. Reference Xiao, Windley, Huang, Han, Yuan, Chen, Sun, Sun and Li2009 a) (Fig. 1b). Though many studies have been carried out on these ophiolites, their detailed rock associations, geochronology, geochemistry and tectonic incorporation processes are still poorly known. In this contribution, we report detailed field observations, petrography, ages and geochemistry of the Zhaheba ophiolite complex on the northern margin of the Junggar terrane in order to (1) better understand the accretion of individual members of the eastern Junggar terrane and (2) decipher the incorporation process of diverse-type rocks in an ophiolite mélange.
Figure 1. (a) Schematic geological map of the Central Asian Orogenic Belt (CAOB); (b) generalized geological map of the Chinese eastern Junggar and Altai orogen showing the distribution of ophiolites in eastern Junggar and along the Iritish suture zone (modified after Wang et al. Reference Wang, Jahn, Kovach, Tong, Hong and Han2009).
2. Regional geology, field observations and petrography
The Zhaheba ophiolite complex represents the northwestern section of the Zhaheba–Almantai ophiolite belt, which is distributed along the southern margin of the Erqis suture zone in a NW direction (Figs 1b, 2). The main rocks include serpentinite, cumulate, basaltic–andesitic lava and minor tuff and carbonate. The cumulate includes gabbro and minor pegmatitic gabbro, and occurs as small stocks or dykes distributed over several tens to hundreds of square metres. The cumulate intruded serpentinite but no chilled margin has been observed (Fig. 3a). Field observations identified at least 15 cumulate stocks and dykes. The serpentinite crops out in the southwest and is structurally mingled into the lower member of the Devonian basaltic–andesitic sedimentary sequence (Fig. 2, see following descriptions). Occasionally basalt stripes 1–5 m in length and less than 1 m in width can be seen in the serpentinite. Obviously these basalt stripes were structurally mixed into the serpentinite. The serpentinite composes > 90% serpentine, with minor magnetite and spinel (Fig. 3b, c). Magnetite generally occurs in the fissures of the serpentine and is the by-product of sepentinization of dunite or harzburgite (e.g. Zhang et al. Reference Zhang, Santosh, Zou, Li and Huang2013). No relict olivine or orthopyroxene was observed in thin-sections. The gabbro mainly comprises plagioclase (40–70%) and clinopyroxene (30–50%) as well as minor orthopyroxene (5–10%) and occasional olivine (Fig. 3d). Accessory minerals include Fe–Ti oxides and zircon. These cumulates show a massive structure and are medium grained to coarse grained without significant deformation or hydrothermal alteration, with the exception of slight sericitization of plagioclase and serpentinization of pyroxene in several thin-sections. The basaltic–andesitic volcanic sedimentary sequence was locally divided into the lower to middle Devonian Tuorangekuduke Formation (TF) and Wendukala Formation (WF) and the upper Devonian Jianggesayi Formation (JF) (Yuan et al. Reference Yuan, Xiao, Chen, Li and Sun2006). To the northeast of the Devonian sequences are Carboniferous volcaniclastic sedimentary strata in fault contact with the Devonian strata. The TF was divided into three members according to their rock associations, which include tuff and crystal tuff, volcaniclastic rocks and tuff-bearing sandstones (Fig. 2). In the lower member, a small carbonate lens conformably overlying basaltic–andesitic lava was observed, sharing the typical structural features of a seamount. This basaltic–andesitic lava in the TF had been recognized as a member of the Zhaheba ophiolite because of their close spatial relationship (Xinjiang BGMR, Reference Xinjiang1993). Both the Devonian and Carboniferous volcanic sedimentary strata are intensively foliated or show schistose texture.

Figure 2. Geological map of the Zhaheba ophiolite complex (modified after Niu et al. Reference Niu, Shan, Zhang and Yu2007, Reference Xiao, Windley, Huang, Han, Yuan, Chen, Sun, Sun and Li2009 a and Xinjiang BGMR, Reference Xinjiang1993).

Figure 3. Field photographs and microscopic photographs of different members from the Zhaheba ophiolite. (a) Cumulate intruded serpentinite without chilled margin. (b, c) The serpentinite comprises > 90% serpentine and minor magnetite and spinel. (d) The gabbro is mainly composed of plagioclase, clinopyroxene and minor orthopyroxene. Cpx – clinopyroxene; Mt – magnetite; Opx – orthopyroxene; Pl – plagioclase; Spl – spinel; Srp – serpentine.
3. Analytical procedures
3.a. Zircon U–Pb dating and Hf–O isotope analysis
Zircons were separated from a gabbro sample (2013ALT01, 46°32′51“N, 89°2′49”E) and a tuff sample (2013ALT02, 46°33′2“N, 89°2′36”E) collected from the tuff layer in the lower member of the TF. Zircon separation was carried out using conventional magnetic and density techniques. Zircon grains were then hand-picked under a binocular microscope. Zircon grains and zircon reference standards were mounted in epoxy mounts, which were then polished to section the crystals for analysis. All zircons were documented with transmitted and reflected light micrographs as well as cathodoluminescence (CL) images to reveal their internal structures. Zircon ages and Hf isotope compositions were analysed using the laser ablation inductively coupled plasma mass spectrometry (LA-ICP-MS) method at the Tianjin Institute of Geology and Mineral Resources, Chinese Geological Survey. The detailed analytical procedures have been documented in Geng et al. (Reference Geng, Li, Zhang and Zhang2011). Hf isotopes were analysed in the same spot as used for the U–Pb analyses. Data reduction was performed off-line by ICP-MS Data Cal (Liu et al. Reference Liu, Hu, Zong, Gao, Gao, Xu and Chen2010) and Isoplot (Ludwig, Reference Ludwig2003). The weighted mean ages are quoted at the 95% confidence level. Zircon U–Pb age data and Hf isotope compositions are listed in online Supplementary Material Table S1 and online Supplementary Material Table S2, respectively, available at http://journals.cambridge.org/geo.
Zircon oxygen isotopes were measured using the Cameca IMS 1280 SIMS at the Institute of Geology and Geophysics, Chinese Academy of Sciences in Beijing, with analytical procedures similar to those reported by Li et al. (Reference Li, Li, Li, Wang, Liu and Yang2010 a). Measured 18O/16O ratios were normalized by using Vienna Standard Mean Ocean Water compositions (VSMOW, 18O/16O = 0.0020052), and then corrected for the instrumental mass fractionation factor (IMF) using Penglai zircons as a reference standard with a δ 18O value of 5.31‰ (Li et al. Reference Li, Li, Li, Wang, Liu and Yang2010 b). Ten measurements of the Qinghu zircon standard during the course of this study yield a weighted mean δ 18O of 5.44±0.21‰ (2SD), which is consistent within errors with the reported value of 5.4±0.2‰ (Li et al. Reference Li, Tang, Gong, Yang, Hou, Hu, Li, Liu and Li2013). Zircon oxygen isotopic data are listed in online Supplementary Material Table S3 available at http://journals.cambridge.org/geo.
3.b. Mineral analysis
Mineral compositions were determined on polished thin-sections using an automated JEOL 8800 electron microprobe equipped with five wavelength spectrometers at the Guangzhou Institute of Geochemistry, Chinese Academy of Sciences. Operating conditions were 15 keV accelerating voltage and 15 nA beam current with 20 s counting time. Representative mineralogical data are listed in online Supplementary Material Tables S4 and S5 available at http://journals.cambridge.org/geo.
3.c. Whole-rock analysis
Whole-rock major- and trace-element compositions were analysed at the Guangzhou Institute of Geochemistry, Chinese Academy of Sciences. Major elements were analysed using a Rigaku ZSX100e XRF following the analytical procedures described by Li et al. (Reference Li, Liu, Sun, Li, Liang and Liu2004). Analytical precision is generally better than 2%. Trace elements were analysed using a Perkin-Elmer Sciex ELAN 6000 ICP-MS following procedures described by Li et al. (Reference Li, Liu, Sun, Li, Liang and Liu2004). Roughly 50 mg sample powders from each sample were dissolved in high-pressure Teflon bombs using a HF+HNO3 mixture. An internal standard solution containing single element Rh was used to monitor signal drift during ion counting. The USGS standards BCR-1, W-2 and G-2, and the Chinese National standards GSR-1 and GSR-3, were used for calibrating element concentrations of measured samples. In-run analytical precision for most elements was better than 3–5%. The analytical results are listed in Table 1.
Table 1. Geochemical compositions of the serpentinite, cumulate and basalts from the Zhaheba ophiolite complex

Notes: SP – serpentinite; G – gabbro; B – basalt; BA – basaltic andesite; / – under detection limit.
Data for samples 04Z06, 04Z26, 04Z29 and 04Z17 are from Niu et al. (Reference Niu, Shan, Yu, Zhang, Luo and Yang2009 a).
Samples for Nd–Sr isotopic measurements were spiked and dissolved in Teflon bombs with HF+HNO3 acid, and then separated by conventional cation-exchange techniques. The isotopic measurements were performed on a Micromass Isoprobe multi-collector inductively coupled plasma mass spectrometer (MC-ICP-MS) at the State Key Laboratory of Ore Deposit Geochemistry, Institute of Geochemistry, Chinese Academy of Sciences. The detailed procedure has been described by Li et al. (Reference Li, Liu, Sun, Li, Liang and Liu2004). The measured 87Sr/86Sr and 143Nd/144Nd ratios are corrected to 86Sr/88Sr = 0.1194 and 146Nd/144Nd = 0.7219, respectively. The measured 87Sr/86Sr average ratios were 0.710288 for the NBS987 standard and 0.705069 for BCR-1, and the 143Nd/144Nd average ratios were 0.512104 for JNdi-1 and 0.512671 for BCR-1. The analytical results and calculated parameters are listed in Table 2.
Table 2. Sr–Nd isotopic compositions of the basalts from the Zhaheba area

ε Nd(t) = 10000((143Nd/144Nd)S(t)/(143Nd/144Nd)CHUR(t)−1); ε Nd(t) and (87Sr/86Sr)i values of the basalts from the Zhaheba area are recalculated using the age of 401 Ma.
4. Analytical results
4.a. Zircon U–Pb ages
Zircons from the gabbro sample are translucent and colourless. Most grains are short prismatic with lengths ranging from 100 to 150 µm and aspect ratios ranging from 1:1 to 2:1. In CL images, the zircons display wide oscillatory zoning, features characteristic of zircons in mafic magmatic rocks (see inset of Fig. 4a). Thirty analyses were conducted on this sample, and the results show variable U (22–123 ppm) and Th (8–57 ppm) contents with Th/U ratios ranging from 0.4 to 0.8. Twenty-seven analyses on 30 zircons yielded consistent results with a concordant age within analytical error and a weighted mean age of 485.8±2.5 Ma (Fig. 4a; n = 27, MSWD = 3.1). This age is consistent with a previously reported 489±4 Ma zircon SHRIMP U–Pb age for the layered gabbro from the Zhaheba ophiolite (Jian et al. Reference Jian, Liu, Zhang, Zhang, Shi, Shi, Zhang and Tao2003).

Figure 4. Concordia plots of U–Pb data for zircons from the gabbros of the Zhaheba ophiolite and the Devonian tuff. Error ellipses are at 1σ and age uncertainty is quoted at 2σ (mean) level.
Zircons from the tuff sample are transparent and colourless, ranging from 100 to 200 µm in length with length/width ratios of 1–3. According to CL image features, the zircon grains can be divided into two groups. Group 1 (G1) zircons, accounting for about 70% of the total zircons, display wide oscillatory or planar zoning, similar to those zircons crystallized from mafic magmas. The other group (G2) exhibit columnar forms and oscillatory zoning, sharing features with zircons crystallized from silicic magmas (G2, see inset of Fig. 4b). Twenty-nine analyses were performed on zircons from the tuff sample. Among these, eight spots on the G2 zircons yielded older ages ranging from 450 Ma to 500 Ma and are likely to be xenocrysts. The other 21 analyses performed on the G1 zircons yield consistent 206Pb–238U ages with a weighted mean age of 401±2 Ma (MSWD = 3.3). Owing to the discordance between 206Pb–238U ages and 207Pb–235U ages, the Tera-Wasserburg inverse Concordia diagram yields a lower intercept age of 401.4±1.6 Ma (MSWD = 1.8) (see insert of Fig. 4b), which is concurrent with the 206Pb–238U weighted mean age. This age is consistent with the fossils found in the carbonate (Xinjiang BGMR, Reference Xinjiang1993).
4.b. Mineral compositions
4.b.1. Spinel composition
Accessory chromian spinels occur in the serpentinite (Fig. 3d). Most grains are 100 to 300 µm across. The analytical results (online Supplementary Material Table S4 available at http://journals.cambridge.org/geo) show that the spinels have high Cr2O3, FeO and Al2O3 contents, variable MgO, and low NiO and TiO2 contents. The mineral chemistry shows that these primary spinels are chromian spinels with Cr no. (100*Cr/(Cr+Al)) ranging from 44 to 60 and Mg no. (100*Mg/(Mg+Fe)) from 25 to 61. The compositional variation could be owing to either later stage melt/rock interactions and/or post-magmatic process (Oh et al. Reference Oh, Rajesh, Seo, Choi and Lee2010). The uneven surface texture of the spinels observed under back-scattered electron (BSE) imaging suggests possible melt extraction before the emplacement of the mantle residue (Zhang et al. Reference Zhang, Santosh, Zou, Li and Huang2013).
4.b.2. Pyroxene compositions
The orthopyroxene is enstatite and has a rather homogeneous composition (En = 84–86). The clinopyroxenes in this study have very low TiO2 contents (less than 0.5%) and their chemical compositions are similar to that of diopside (online Supplementary Material Table S5 available at http://journals.cambridge.org/geo). The clinopyroxenes from the cumulates have consistent chemical compositions with 41–49 mol. Wo, 46–55 mol. En and 1–7 mol. Fs (Fig. 5a). They show non-alkaline rift-related features according to their Al2O3, SiO2 and TiO2 contents (Fig. 5b, c).

Figure 5. (a) Wo–En–Fs diagram showing the compositions of the clinopyroxene from gabbros from the Zhaheba ophiolite. (b) SiO2 (wt%) v. Al2O3 (wt%) and (c) AlIV (percentage of tetrahedral sites occupied by AlZ) v. TiO2 (wt%) in clinopyroxene from gabbros from the Zhaheba ophiolite.
4.c. Whole-rock elemental geochemistry
4.c.1. Serpentinites and cumulates
The serpentinites have very high loss on ignition (LOI) (> 12%, which is consistent with the intensive serpentinization) and low SiO2 (less than 40%), Al2O3 (mostly less than 1.0%), K2O (0.03–0.06%), Na2O (0.04–0.92%) and TiO2 (0.04–0.05%). MgO and Fe2O3 T contents yield Mg nos ranging from 89 to 91 (Table 1). On the Harker diagram, no significant correlation between Mg no. with other major elements is observed (Fig. 6). They have relatively high Cr (93–103 ppm) and low Ni contents (5–8 ppm) (Table 1). The high LOI (> 12%) and low Na2O, K2O and CaO contents suggest significant hydrothermal alteration which altered the original content of some major elements (Na, K and Ca) as well as the large ion lithophile elements (LILEs) (e.g. Rb, Sr and Ba). However, since there is no marked correlation of LOI with MgO, Al2O3, Fe2O3 T and TiO2, we infer that there was no significant mobility of these elements during the hydrothermal alteration. Thus, these elements can be used for further discussions of petrogenesis. The serpentinites have very low total rare earth element (REE) and most high-field-strength element (HFSE) contents (Table 1). However, they show consistent U-shaped chondrite-normalized REE patterns (Fig. 7), sharing most features of harzburgites from ophiolite complexes (Pearce, Reference Pearce2014; both the chondrite and the primitive mantle values are from Sun & McDonough, Reference Sun, McDonough, Saunders and Norry1989).

Figure 6. Harker variation diagram for the basalts and keratophyres (Mg no. v. SiO2, Na2O, K2O, TiO2, Fe2O3 T, Al2O3, CaO, Cr, Ni and Zr) (four samples reported by Niu et al. Reference Niu, Shan, Yu, Zhang, Luo and Yang2009 a are also included for the major elements).

Figure 7. Chondrite-normalized REE patterns and primitive mantle-normalized incompatible trace-element multi-element diagrams for the serpentinite and gabbros from the Zhaheba ophiolite and the Devonian basalts. The normalization values are from Sun & McDonough (Reference Sun, McDonough, Saunders and Norry1989).
The gabbroic cumulates have SiO2 ranging from 45.87% to 51.27%, and display variable Fe2O3 T (3.24–4.68%), Al2O3 (18.3–19.6%, except sample 2013ALT01-3), CaO (9.54–15.42%), TiO2 (0.12–0.34%), Na2O (2.91–7.38%, except sample 2013ALT01-3) and K2O (0.11–0.46%) owing to crystal fractionation and/or cumulation effects (Table 1). No significant correlation between Mg no. and major elements was observed on the Harker diagrams (Fig. 6). The cumulates have variable total REE contents ranging from 5 ppm to 41 ppm, and similar consistent chondrite-normalized REE patterns with light REE (LREE) enrichment ((La/Yb)N = 1.3–2.8) and pronounced positive Eu anomalies (Eu/Eu* = 1.1–2.2). Sample 2013ALT01-3 shows a humped REE pattern, possibly due to the hornblende effect. The hornblendes are observed in the thin-section. On the primitive-mantle (PM) normalized incompatible element diagram (Fig. 7), all the cumulates are characterized by significant negative Nb anomalies (Nb/La = 0.2–0.4) and variable positive anomalies of Ba, Sr and Eu.
4.c.2. Basalts
The basalts and andesitic basalts have SiO2 ranging from 43.15% to 57.65% (mostly less than 52%, Table 1). Owing to variable hydrothermal alteration, only immobile incompatible elements were used for classification. On the Nb/Y v. Zr/TiO2 diagram, the basalts can be divided into two subgroups, i.e. the alkaline Group 1 (G1) and subalkaline Group 2 (G2). Among the G2 samples, two samples straddle the boundary between basalt and andesite–basaltic andesite (Fig. 8a). Both G1 and G2 exhibit a tholeiitic trend on the FeOT/MgO v. TiO2 diagram (Fig. 8b). On the Harker diagrams, SiO2, Fe2O3 T, P2O5, TiO2, Sr, Zr and Th increase while CaO and Al2O3 decrease with decreasing Mg no. for the G1 basalts. As for the G2 basalts, P2O5, TiO2, Zr and Th increase with deceasing Mg no. (Fig. 6).

Figure 8. (a) Incompatible element (Zr/TiO2 v. Nb/Y) classification diagram for the Devonian basalts and gabbros (Winchester & Floyd, Reference Winchester and Floyd1977). (b) Whole-rock TiO2 v. FeOT/MgO plots for discrimination between the calc-alkaline and tholeiitic series. The calc-alkaline and tholeiitic trends are after Miyashiro (Reference Miyashiro1974).
The G1 basalts have relatively high total REE contents ranging from 124 ppm to 205 ppm while the G2 basalts have 50 ppm to 60 ppm total REEs. G1 basalts have elevated LREEs with (La/Yb)N between 10 and 30 (mostly above 20) and show moderate negative to slight positive Eu anomalies (Eu/Eu* = 0.70–1.14) (Fig. 7). The G2 basalts have relatively flat REE patterns with (La/Yb)N ranging from 4 to 6 and slight positive Eu anomalies (Eu/Eu* = 1.02–1.21) (Fig. 7). On the PM-normalized multi-element diagrams, the G1 basalts show humped patterns with variable negative Nb–Ta anomalies with Nb/La ranging from 0.44 to 0.87, and negative to slight positive Sr anomalies consistent with their Eu anomalies. The G2 basalts have lower incompatible element contents than those of the G1 basalts and display pronounced negative Nb–Ta anomalies with very low Nb/La ratios (~0.11). All these features resemble those of typical arc basalts (Fig. 7).
4.d. Whole-rock Sr–Nd and zircon Hf–O isotopes
Strontium and neodymium isotopic compositions of the representative basalts are listed in Table 2. G1 basalts and G2 basalts have similar Sr–Nd isotopic compositions. They show a narrow range of 87Rb/86Sr ratios (0.0024–0.0452) and 87Sr/86Sr ratios (0.704030–0.705368), corresponding to relatively homogeneous initial 87Sr/86Sr ratios (0.704015–0.705111, except for 2013ALT03H1). They have 147Sm/144Nd ratios between 0.0978 and 0.1394 and 143Nd/144Nd ratios between 0.512707 and 0.512839 and nearly constant ε Nd(t) values from +6.3 to +7.5 (except 2013ALT03H1 that is +1.8).
Zircon Hf isotope compositions of the cumulate sample (2013ALT01) show consistent results (online Supplementary Material Table S2 available at http://journals.cambridge.org/geo; Fig. 9a), with ε Hf (t = 485 Ma) ranging from 13 to 20. The Hf model ages range from 285 Ma to 588 Ma. Some spots yield high ε Hf(t) (> 16) and their TDM ages are younger than the crystallization age for unknown reasons, and these spots are excluded from further discussions. On the histogram of ε Hf(t), the analyses show nearly a Gaussian distribution peaking at 15.7. The measured δ 18O values range from 4.91‰ to 5.73‰, also forming a Gaussian distribution (Fig. 9b). Thus, these zircons have homogeneous oxygen isotopic compositions with a mean δ 18Ozircon value of 5.37±0.23‰ (Fig. 9b).

Figure 9. (a) Zircon ε Hf(t) and (b) O isotope spectra for the gabbros from the Zhaheba ophiolite.
Zircons of ~400 Ma from the tuff sample have a large range of ε Hf(t) values between 1.4 and 9.2 with single-stage Hf model ages ranging from 680 Ma to 920 Ma. The xenocrysts have variable Hf isotope compositions sharing the features of detrital and igneous zircons from the Altai region (Sun et al. Reference Sun, Yuan, Xiao, Long, Xia, Zhao, Lin, Wu and Kroner2008).
5. Discussion
5.a. The individual members of the Zhaheba ophiolite
According to the zircon U–Pb ages of the cumulates and the volcanic rocks, the cumulates and the Devonian lavas were emplaced and erupted at c. 486 Ma and 401 Ma, respectively. The age of the cumulate is broadly consistent with the previously reported age (503±7 Ma) of the Almantai ophiolite in the southeastern section of the Zhaheba ophiolite and the age (416±3 Ma) of the Kelameili ophiolite to south of the Zhaheba–Almantai ophiolite complex (Huang et al. Reference Huang, Niu, Wang, Guo and Yu2012; Xiao et al. Reference Xiao, Windley, Huang, Han, Yuan, Chen, Sun, Sun and Li2009 b, Fig. 1). The volcanic sequences (401 Ma) and the cumulates (486 Ma) (including the serpentinites) are clearly asynchronous. Thus, we suggest that the volcanic sequences are not a member of the Zhaheba ophiolite. The Devonian fossils are consistent with the zircon U–Pb age for the volcanic sequence (Xingjiang BGMR, Reference Xinjiang1993).
According to the ages of the ophiolites in eastern Junggar and the southern side of the Altai terrane (Fig. 1b), the ophiolites can be subdivided into three stages, i.e. the Cambrian Zhaheba–Almantai opiolitic mélange (500–480 Ma) (Jian et al. Reference Jian, Liu, Zhang, Zhang, Shi, Shi, Zhang and Tao2003; Luo et al. Reference Luo, Xiao, Wakabayashi, Han, Zhang, Wan, Ao, Zhang, Tian, Song and Chen2015; this study), the Devonian Kelameili ophiolitic mélange (430–400 Ma) (Xiao et al. Reference Xiao, Windley, Huang, Han, Yuan, Chen, Sun, Sun and Li2009 b, Reference Xiao, Han, Liu, Wan, Zhang, Ao, Zhang, Song, Tian and Luo2014 and references therein) and the Carboniferous Kuerti complex (370–350 Ma) (Zhang et al. Reference Zhang, Niu, Terada, Yu, Sato and Ito2003; Wu et al. Reference Wu, He, Wu, Li and Luo2006).
5.b. Origin of the serpentinite and cumulates
Studies on ultramafic rocks have confirmed that Cr-spinel serves as a potential petrogenetic and tectonic indicator based on its ability to survive during later metamorphism (Hellebrand, Snow & Mühe, Reference Hellebrand, Snow and Mühe2002; Oh et al. Reference Oh, Rajesh, Seo, Choi and Lee2010). Generally the Cr no. of Cr-spinel does not undergo any significant change during subsolidus recrystallization (Arai, Reference Arai1994); therefore, it can be used to determine the degree of partial melting experienced by Cr-spinel-bearing peridotites (Dick & Bullen, Reference Dick and Bullen1984; Hellebrand et al. Reference Hellebrand, Snow, Dick and Hofmann2001). On the Cr2O3 (wt%) v. Al2O3 (wt%) diagram, all the analysed spots plot within the mantle array, similar to those of the Bibong ultramafic bodies in South Korea and ultramafic members of the ophiolites in the Tethys orogenic belt (Fig. 10a) (Oh et al. Reference Oh, Rajesh, Seo, Choi and Lee2010). Fe2+ no. increases with increasing Cr no., though they deviate a little from the mid-ocean ridge (MORB) spinel field (Fig. 10b). Positive correlation between Mg no. and Cr no. was observed, and most spinels plot in the fore-arc peridotite field with some in the overlapping region between fore-arc peridotite and abyssal peridotite (Fig. 10c). The TiO2 content of spinel in the magma varies with the tectonic environment of magma separation. Generally, TiO2 is extremely low in arc/back-arc magma, intermediate in mature mid-ocean ridge magma and high in intraplate magma (Arai, Reference Arai1994; Pearce, Reference Pearce2008). Jan & Windley (Reference Jan and Windley1990) suggested that Alaskan-type complexes and mafic–ultramafic rocks from deeper levels of island arcs generally contain > 0.3% TiO2. Spinels from peridotite genetically related to large igneous provinces (LIP) or ocean island basalts (OIB) have higher TiO2 contents and higher Al2O3 contents than those of the spinels from SSZ-type ophiolites. On the TiO2 v. Al2O3 diagrams, most spinels from the serpentinite show MORB affinity, and some have lower TiO2 contents than those spinels from MORB-type ophiolites (Fig. 10d).

Figure 10. Plot of chromian spinels on discrimination diagrams. (a) Cr2O3 versus Al2O3 (wt%) diagram (after Franz & Wirth, Reference Franz and Wirth2000). (b) Cr no. (100*Cr/(Cr+Al)) versus Fe2+ no. (100*Fe2+/(Fe2++Mg)) of spinels from the Zhaheba ophiolite (after Arai, Reference Arai1994; Barnes & Roeder, Reference Barnes and Roeder2001). (c) Cr no. (100*Cr/(Cr+Al)) versus Mg no. (100*Mg/(Mg+Fe)) of spinels from the Zhaheba ophiolite (after Monnier et al. Reference Monnier, Girardeau, Maury and Cotten1995). (d) TiO2 versus Al2O3 compositional relationships in spinel from the Zhaheba ophiolite (after Kamentsky, Crawford & Meffre, Reference Kamenetsky, Crawford and Meffre2001). BON – boninites; MORB – mid-ocean ridge basalts; SSZ – supra-subduction zone basalts.
The major and trace elements of the gabbroic cumulates are constrained by crystal fractionation and cumulation. According to their REE distribution patterns and the incompatible element diagrams (Fig. 7), the positive Eu and Sr anomalies could be due to the cumulation of plagioclase. Thus, we only use the incompatible element ratios, mineral compositions and isotope compositions to decipher its mantle sources.
First of all, the zircons from the gabbroic cumulates have high ε Hf(t) values (about +16 at 485 Ma), which are above the depleted mantle evolution line. The average δ 18O value of these zircons is 5.37‰, consistent with the normal mantle zircon value of 5.3‰ (Valley et al. Reference Valley, Kinny, Schulze and Spicuzza1998). These features show that the zircons of the gabbroic cumulates crystallized from mafic magma derived from highly depleted mantle sources (DMM-type). The isotope features argue that the cumulates crystallized from basalts that were derived from depleted asthenospheric mantle sources, similar those of mafic sheets from MORB-type ophiolite complexes. On the other hand, as shown in Figure 5c, the clinopyroxenes from the cumulates exhibit rift-related trends. On the Al2O3 v. TiO2+Cr2O3 diagram, all the analysed clinopyroxene spots plot in the overlap area between N-MORB and back-arc basin basalt (Fig. 11a). On the SiO2/100–TiO2–Na2O diagram, most compositions plot into the MORB field with some overlapping between the SSZ-type and N-MORB fields (Fig. 11b). Note that the gabbroic cumulates have significant Nb–Ta troughs on the PM-normalized diagrams and some samples exhibit slight LREE enrichment (Fig. 7). There are two possibilities. One is crustal contamination, particularly by marine sediments. However, there is no correlation between Nb/La and Nb/Th ratios (Fig. 12a), which rules out significant crustal contamination. Moreover, the single-stage Hf model age is similar to the crystallization age of the gabbro. The other possibility is that the mantle source underwent subduction-related metasomatism. However, their Nb/Zr and Th/Zr ratios are similar to MORB and exhibit neither fluid nor melt-related metasomatism trends (Fig. 12b). Therefore, the significant Nb–Ta negative anomalies in the clinopyroxenes are not necessarily related to subduction-related metasomatism. Niu et al. (Reference Niu, Gilmore, Mackie, Greig, Bach, Natland, Dick, Miller and Herzen2002) have pointed out that the significant Nb–Ta negative anomalies of the gabbros from the Southwest Indian Ridge are possibly controlled by both the compositions and modes of the constituent minerals (such as magnetite or ilmenite). Thus, we deduce that the gabbro represents a cumulate part of the ocean ridge lithosphere which did not undergo crustal contamination or subduction-related metasomatism.
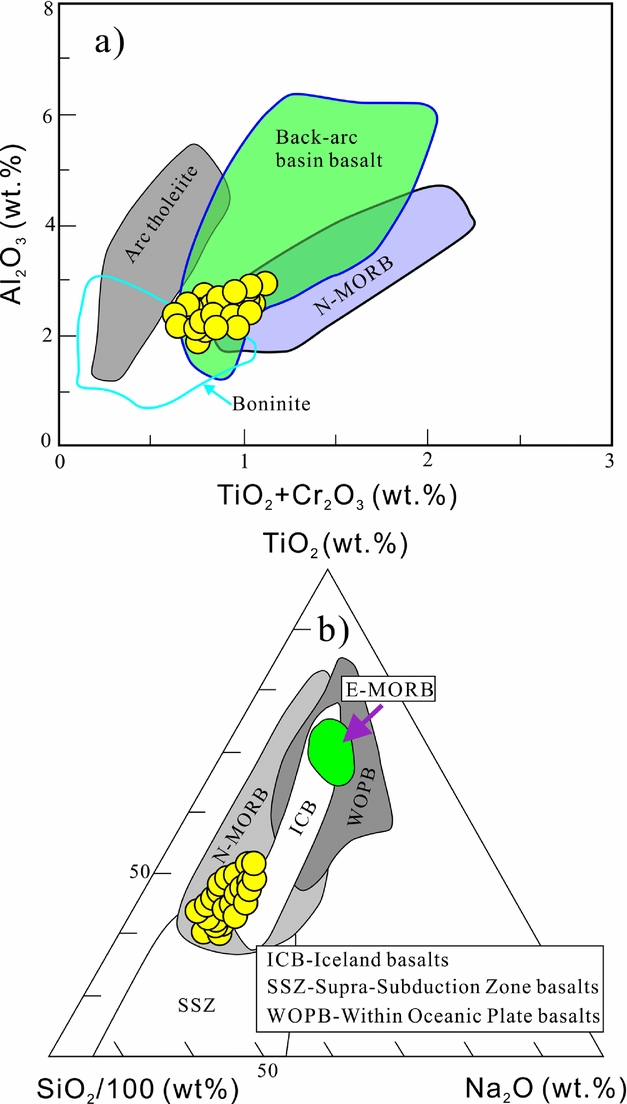
Figure 11. (a) Al2O3 v. TiO2+Cr2O3 diagram and (b) TiO2–SiO2/100–Na2O triangle diagram of clinopyroxene from the gabbro of the Zhaheba ophiolite, with all the analysed spots plotting in the overlap area between N-MORB and back-arc basin basalt and overlapping between the SSZ-type and N-MORB.

Figure 12. (a) Nb/Th v. Nb/La diagram showing the crustal contamination and (b) plot of Nb/Zr v. Th/Zr diagram for the gabbro cumulates of the Zhaheba ophiolite.
5.c. Petrogenesis of the Devonian basalts
According to their geochemistry, the basalts are divided into two subgroups, i.e. alkaline G1 and tholeiitic–calc-alkaline G2. G1 basalts have high Nb (11–24 ppm, mostly above 15 ppm), P2O5 (0.4–0.6%) and Nb/U ratios (11–15, with some up to 60) and variable (La/Yb)N and Yb values, suggesting they are Nb-rich basalts (NEBs) (Defant, Jackson & Drummond, Reference Defant, Jackson and Drummond1992; Polat & Kerrich, Reference Polat and Kerrich2001) (Fig. 13). Two alternative mantle sources have been proposed to account for the origin and distinctive geochemical features of NEBs: (1) an OIB mantle or enriched mantle component occurring in the mantle wedge (e.g. Castillo, Solidum & Punongbayan, Reference Castillo, Solidum and Punongbayan2002); (2) a mantle wedge which was metasomatized by adakites (Defant, Jackson & Drummond, Reference Defant, Jackson and Drummond1992; Defant & Drummond, Reference Defant and Drummond1993; Sajona et al. Reference Sajona, Maury, Bellon, Cotton and Defant1996). The later mechanism likely played an important role in the petrogenesis of the G1 basalts.

Figure 13. (a) (La/Yb)N and (b) YbPM v. Nb diagrams for the basalts from the Zhaheba area, indicating that G1 basalts have features of Nb-enriched basalts (NEBs).
Previous studies demonstrated that NEBs may be derived from a source composed of OIB-like enriched mantle (Castillo, Rigby & Solidum, Reference Castillo, Rigby and Solidum2007; Hastie et al. Reference Hastie, Mitchell, Kerr, Minifie and Millar2011). However, the G1 NEBs have low initial 87Sr/86Sr values (0.704120–0.706133) and high ε Nd(t) values (+1.8 to +7.5). They are different from enriched OIBs. In addition, the NEBs have lower Nb/U (3.44–20.4) and higher La/Nb (1.51–2.54) ratios than OIBs (e.g. Zindler & Hart, Reference Zindler and Hart1986). Therefore, these characteristics rule out an OIB mantle source. Alternatively, we suggest that the G1 NEBs are possibly derived from a mantle wedge metasomatized by adakite-like melts derived from a hot subducted slab (Sajona et al. Reference Sajona, Maury, Bellon, Cotton and Defant1996; Keppler, Reference Keppler1996). Slab melting generates liquids of adakite composition. Some of these erupted as rhyolites, whereas others reacted with mantle peridotite to generate a HFSE-enriched source (Hollings & Kerrich, Reference Hollings and Kerrich2000). This model requires that adakites and NEBs are erupted more or less simultaneously (Defant, Jackson & Drummond, Reference Defant, Jackson and Drummond1992; Sajona et al. Reference Sajona, Maury, Bellon, Cotton and Defant1996). Zhang et al. (Reference Zhang, Shen, Ma, Niu and Yu2008) reported Devonian adakites along the northern margin of the Junggar. The G1 NEBs have varying ε Nd(t) (1.8–7.5) and (87Sr/86Sr)i (0.704120–0.706133) values, which indicates that their source was compositionally heterogeneous (Table 2). The relatively low ε Nd(t) values and high (87Sr/86Sr)i ratios indicate that they underwent assimilation of old crustal materials. This is consistent with significant P and Ti troughs on the PM-normalized diagrams. Thus, the G1 basalts in the Zhaheba area were most likely derived from partial melting of a mantle wedge previously metasomatized by adakitic melts released from a subducted hot slab. Some samples underwent significant assimilation of old crustal materials.
The G2 basalts have high LILE contents and relatively low TiO2, Nb and other HFSE contents, and low Nb/La (< 0.3), Nb/Y and FeOT/MgO ratios (Fig. 8), reflecting the metasomatism of mantle sources by the influx of slab-released fluids and/or melts derived from partial melting of the subducted slab (Saunders, Norry & Tarney, Reference Saunders, Norry and Tarney1991; Stern, Reference Stern2002). This scenario shares most features of arc basalts. On the other hand, the G2 basalts have low (Hf/Sm)PM (0.7–1.0), (Ta/La)PM (0.1–0.2) and Nb/Th (0.6–1.0) ratios, indicating the mantle source for the G2 basalts was mainly metasomatized by fluids related to oceanic crust subduction (Hofmann & Jochum, Reference Hofmann and Jochum1996). Compared with the G1 NEBs, the G2 basalts have low P2O5 contents and Nb/U and (Nb/Th)PM ratios (Table 1; Fig. 14). They all plot in the fields of typical island arc volcanic rocks (Fig. 14). Thus, the G2 basalts derived from partial melting of a mantle wedge previously metasomatized by fluids released from a subducted slab. In the field, the G1 and G2 basalts are interbedded with each other. The field observation indicates that they share a common tectonic setting, which is consistent with their petrogenesis.

Figure 14. (a) P2O5 versus TiO2 diagram. (b) Nb/U versus Nb diagram. (c) (Nb/Th)PM versus (Nb/La)PM diagram. Fields for arc volcanic rocks and Nb-enriched arc basalts (NEBs) are from Defant, Jackson & Drummond (Reference Defant, Jackson and Drummond1992) and Schiano et al. (Reference Schiano, Clocchiatti, Shimuzu, Maury, Jochum and Hofmann1995), respectively.
5.d. Implications for the Palaeozoic accretion process in eastern Junggar
There are three ophiolitic belts in the eastern Junggar, i.e. the Kelameili ophiolite (416 Ma; Hu et al. Reference Hu, Liao, Fan, Chen, Wu, Tian and Wang2014; Fang et al. Reference Fang, Wang, Zhang, Zang, Fang and Hu2015), Zhaheba–Almantai ophiolite (503–485 Ma; Jian et al. Reference Jian, Liu, Zhang, Zhang, Shi, Shi, Zhang and Tao2003; Luo et al. Reference Luo, Xiao, Wakabayashi, Han, Zhang, Wan, Ao, Zhang, Tian, Song and Chen2015; this study) and the Fuyun ophiolite (400 Ma) (Fig. 1b). According to the mineral chemistry and geochemistry of the Almantai and Kelameili ophiolites (Hu et al. Reference Hu, Liao, Fan, Chen, Wu, Tian and Wang2014), they were formed in mid-ocean ridge rather than subduction-related settings.
Both the geochemistry and field observations reveal that the Cambrian–Devonian volcanic–sedimentary sequences along the eastern Junggar represent diverse tectonic settings, including intra-oceanic arc, seamount, accretionary wedge, mid-ocean ridge and deep-sea flysch (Niu et al. Reference Niu, Shan, Zhang and Yu2007, Reference Niu, Shan, Zhang, Luo, Yang and Yu2009 a,b; Xiao et al. Reference Xiao, Windley, Huang, Han, Yuan, Chen, Sun, Sun and Li2009 a). Previous work suggests that the tectonic setting of East Junggar can be defined as intra-oceanic island arc (Xiao et al. Reference Xiao, Windley, Huang, Han, Yuan, Chen, Sun, Sun and Li2009 b). According to the elemental and isotope geochemistry, the ultramafic end member of the Zhaheba–Almantai ophiolite was formed at a mid-ocean ridge. Also, the cumulates derived from asthenospheric mantle and are similar to the gabbros from the mid-ocean ridge.
Recently, Ye et al. (Reference Ye, Zhang, Zou, Zhou, Yao and Dong2015) identified a Devonian Alaskan-type mafic intrusive belt emplaced during 400–380 Ma along the southern margin of the Altai orogen. On the other hand, the ages of the granitoids along the southern margin of the Altai orogen were dated at 460–375 Ma with a peak at c. 400 Ma (Wang et al. Reference Wang, Hong, Jahn, Tong, Wang, Han and Wang2006, Reference Wang, Jahn, Kovach, Tong, Hong and Han2009; Tong et al. Reference Tong, Wang, Hong, Dai, Han and Liu2007; Yuan et al. Reference Yuan, Sun, Xiao, Li, Chen, Lin, Xia and Long2007; Sun et al. Reference Sun, Yuan, Xiao, Long, Xia, Zhao, Lin, Wu and Kroner2008, Reference Sun, Long, Cai, Jiang, Wang, Yuan, Zhao, Xiao and Wu2009; Zhang et al. Reference Zhang, Santosh, Zou, Xu, Zhou, Dong, Ding and Wang2012; Ye et al. Reference Ye, Zhang, Zou, Zhou, Yao and Dong2015). Most of these granitoids show typical I-type granite features, and both whole-rock Nd and zircon Hf isotopes suggest that these granitoids were mainly derived by partial melting of juvenile crust with variable involvement of mantle contributions (Chen & Jahn, Reference Chen and Jahn2002; Wang et al. Reference Wang, Jahn, Kovach, Tong, Hong and Han2009). The Devonian Alaskan-type mafic rocks and I-type granites are interpreted as a continental magmatic arc along the southern margin of the Altai orogen and northward subduction along the Iritish zone (Ye et al. Reference Ye, Zhang, Zou, Zhou, Yao and Dong2015).
As mentioned before (see Section 5.c), the Nb-enriched G1 basalts and the typical arc-signature G2 basalts in the Zhaheba area represent young oceanic slab subduction along the Iritish area. In the tectonic sketch, this is assigned to the Dulate arc system (Figs 1b, 15). Niu et al. (Reference Niu, Shan, Zhang and Yu2007, Reference Niu, Shan, Zhang, Luo, Yang and Yu2009 b) reported ultrahigh-pressure metamorphism, such as the supersilicic garnet and supersilicic pyroxene within the Zhaheba ophiolite complex. Ophiolite, ultrahigh-pressure metamorphic rocks and the Nb-enriched basalts compose a tectonic mélange along the southern margin of the Iritish suture zone (Niu et al. Reference Niu, Zhang, Shan and Yu2008). Similar tectonic mélanges have been identified in other orogens (Furnes, Pedersen & Hertogen, Reference Furnes, Pedersen and Hertogen1991; Ota, Utsunomiya & Uchio, Reference Ota, Utsunomiya and Uchio2007; Xiao et al. Reference Xiao, Windley, Allen and Han2013).

Figure 15. Cartoon illustrating the formation of the ophiolite complexes in eastern Junggar and the accretion process of the Junggar terrane.
We constructed a cartoon model showing the tectonic evolution of the eastern Junggar terrane (Fig. 15).
(1) During Cambrian time (c. 500 Ma), the Palaeo-Asian Ocean subducted northwards beneath the Chinese Altai arc. During this period, a new intra-oceanic subduction zone was initiated and the intra-oceanic arc and accretionary wedge were formed (Fig. 15a). At the same time, the northward subduction along the Iritish zone started, and several arc basalts and scarce arc-signature granites formed in the Altai terrane.
(2) From late Cambrian to early Ordovician time (500–480 Ma), the peridotite was scraped off from the mid-ocean ridge at the fore-arc and the Zhaheba–Almantai ophiolite accreted to the accretionary wedge (Fig. 15b). During this time, accretionary complex and arc-affinity rocks were formed along the southern margin of the Altai terrane during continued northward subduction.
(3) During late Ordovician to Silurian time (480–420 Ma), the high-Mg diorite (458 Ma; Luo et al. Reference Luo, Xiao, Wakabayashi, Han, Zhang, Wan, Ao, Zhang, Tian, Song and Chen2015) intruded the intra-oceanic arc. The Suoerkuduke adakitic andesitic and Nb-enriched basaltic lavas (440 Ma; Shen et al. Reference Shen, Zhang, Wang, Ma and Yang2014) were formed. The Nb-enriched basalts were generated as a result of partial melting of a mantle wedge previously metasomatized by adakitic melts released from this subducted hot slab (Fig. 15c). At the same time, another intra-oceanic subduction zone started, and a new intra-oceanic arc was formed.
(4) The Kelameili ophiolite formed in a MORB setting from Silurian to Devonian times (420–380 Ma) (Hu et al. Reference Hu, Liao, Fan, Chen, Wu, Tian and Wang2014; Fang et al. Reference Fang, Wang, Zhang, Zang, Fang and Hu2015). At this time the former intra-oceanic subduction still continued. Also, the G1 basalts (NEBs) and G2 basalts erupted owing to partial melting of a mantle wedge previously metasomatized by fluids released from a young, hot subducting slab and adakitic melts, respectively (Fig. 15d). The Alaskan-type mafic rocks and I-type granites occurred as a continental magmatic arc along the southern margin of the Altai orogen, and northward subduction occurred along the Iritish zone from Devonian to early Carboniferous times (400–380 Ma). The whole Junggar Ocean most likely closed by middle to late Carboniferous times, because in eastern Junggar, as well as in western Junggar and the southern Altai orogeny, the late Carboniferous–Permian magmatism has typical post-orogenic or intraplate geochemical features and the Permian sedimentary sequences in Junggar exhibit continental facies.
6. Conclusions
(1) The cumulate of the Zhaheba ophiolite crystallized at ~485 Ma, while the basalts in this area erupted at c. 400 Ma. Thus, the basalt sequence and the cumulates are asynchronous and the basalts are not a member of the Zhaheba–Almantai ophiolite. The basalts were generated owing to partial melting of a mantle wedge metasomatized by fluids released from a subducting slab or adakitic melts produced by slab melting.
(2) The cumulate derived from asthenospheric mantle and is similar to the gabbros from the Southwest Indian Ridge. The ultramafic end members of the Zhaheba ophiolite represent residual asthenosphere mantle at a mid-ocean ridge. Their mineral chemistry suggests that the Zhaheba–Almantai ophiolite was MORB-type.
(3) The Zhaheba–Almantai ophiolite accreted to the accretionary wedge along the southern margin of the Iritish suture zone during the roll-back of the subduction zone from north to south. The Kelameili ophiolite was a member of an intra-oceanic accretionary wedge in the Junggar Ocean. The eastern Junggar is a typical Phanerozoic accretionary orogenic belt comprising ophiolites, a seamount, intra-oceanic arc and possible deep-sea flysch.
Acknowledgements
Mr Ru-Fu Ding is thanked for his assistance during the field trip. We really appreciate Prof. Huai-Kun Li for his assistance with zircon U–Pb age and Hf isotope analyses. We are very grateful to Dr Phil Leat and Prof. Wenjiao Xiao for their very constructive reviews that significantly improved the quality of this manuscript. This study is financially supported by the National 305 Project of China (2011BAB06B03-01).
Supplementary material
To view supplementary material for this article, please visit http://dx.doi.org/10.1017/S0016756816000042.


