


I
Investment and consumption are usually presented as the main motivation to buy art. A large part of the literature has shown that, as an investment, artworks were most of the time underperforming stocks and bonds (Baumol Reference Baumol1986; Frey and Pommerehne Reference Frey and Pommerehne1989; Pesando Reference Pesando1993). Works by Buelens and Ginsburgh (Reference Buelens and Ginsburgh1993), Goetzmann (Reference Goetzmann1993), Mei and Moses (Reference Mei and Moses2002) and Renneboog and Spaenjers (Reference Renneboog and Spaenjers2013) have somehow qualified this result by suggesting that art could be an interesting investment if one considers either a given period in time or some specific schools of art. As for the diversification benefits provided by artworks, the literature has yet failed to reach a consensus. Some studies highlight the importance of gains due to diversification (Campbell Reference Campbell2005 and Reference Campbell2008) and others find only limited diversification potential (Renneboog and Van Houtte Reference Renneboog and Van Houtte2002; Worthington and Higgs Reference Worthington and Higgs2004).Footnote 1 In terms of price predictability, David, Oosterlinck and Szafarz (Reference David, Oosterlinck and Szafarz2013) show that the art market is not weak-form efficient.
One of the arguments often advanced for holding collectibles such as artworks is that they are good inflation hedges (Burton and Jacobsen Reference Burton and Jacobsen1999). For example, stamps have been shown to hedge against unexpected inflation (Dimson and Spaenjers Reference Dimson and Spaenjers2011). The literature on artworks as inflation hedges is, however, extremely limited. In times of high inflation, such as during World War II, artworks were often bought because they were thought to help protect against inflation.Footnote 2 This belief was especially strong in occupied countries such as France (Léon-Martin Reference Leon-Martin1943, p. 193). More recent works by academics such as Moulin (Reference Moulin1967) or Oosterlinck (Reference Oosterlinck2011) also suggests that real assets, such as artworks, provide a hedge against inflation, which was prevalent during the occupation. The demand for artworks in occupied countries was such that art markets experienced a boom in Belgium, France and the Netherlands (Moulin Reference Moulin1967; Nicholas Reference Nicholas1995; Euwe Reference Euwe2007; Riding Reference Riding2010; Oosterlinck Reference Oosterlinck2011; David, Euwe, Goldman and Oosterlinck forthcoming). Inflation and inflation expectations are clearly linked to monetary policy. The relationship between prices on the art market and monetary policy has, however, received scant attention. Boyer (Reference Boyer2011) analyses this relationship for a period stretching from 1976 to 2009. She finds that her art index is positively correlated to money supply and inflation but also to the lagged values of these variables.
Even though part of the literature has attempted to link prices of artworks with inflation or the money supply, there is no quantitative study investigating the link between monetary reforms and art prices. In theory, the impact of monetary reforms on the art market may follow two channels. By reducing the quantity of money, monetary reforms have an impact on inflation and inflation expectations. As a result, these reforms may have a direct impact on prices of artworks. But the impact on art markets may also follow a different channel. For the monetary reforms which force holders of banknotes to exchange these for new ones, the reform in itself may lead to a fear that individual wealth will be scrutinized. In this case, demand for artworks may increase because holders of banknotes of dubious origin may wish to buy real goods to avoid the declaration and exchange of banknotes.Footnote 3 The expectation of monetary reforms would thus increase the demand for real goods. After the reform, one may expect this additional demand to plummet. In this case, if supply remains constant prices should drop. Quite logically, to be economically meaningful, the proportion of artworks bought to avoid the declaration would have to be substantial enough. This channel was quite explicitly mentioned during World War II. Indeed, in occupied Belgium, the magazine Comoedia attributed the success of the art market in 1942 to the freshly passed law that restricted the detention of monetary assets.Footnote 4 In his diary the Belgian artist Alfred Bastien also linked the increasing demand for artworks to rumours of monetary reforms which would force the declaration of banknotes (Montens Reference Montens1990).
Fears of large-scale monetary reforms were present during the occupation. However, it was only in October 1944, following the liberation of Brussels, that a large-scale monetary purge, the Gutt plan,Footnote 5 took place. This monetary reform forced not only the declaration of banknotes but also drastically reduced the money supply. The article focuses on this episode and its aftermath to determine if there is indeed a link between monetary reforms and art market prices. The investigation relies on a new art market index constructed on the basis of an original database of close to 3,000 artworks sold between 1944 and 1951 at Giroux, one of the most important art galleries in Brussels.
The balance of the article is organized as follows: Section II presents the Belgian context at the Liberation. Section III presents the dataset and the methodology. Section IV provides the results of the investigation and Section V concludes.
II
In September 1944 the Allied forces liberated Brussels from the Germans. During the occupation the money supply had increased significantly (Banque Nationale de Belgique 1945, p. 11). The amount of paper and deposit money trebled from 50,610 million BEF in May 1940 to 156,457 million BEF in October 1944.Footnote 6 Since the very beginning of the war, Belgian experts had wanted at all cost to find a solution which would avoid repeating the disastrous monetary situation which had followed World War I (Janssens Reference Janssens1976). To deal with the reconstruction of the economy, in June 1942 the Belgian government-in-exile created the Commission pour l'Etude des Problèmes d'Après-Guerre known under its acronym CEPAG (Grosbois Reference Grosbois and Dumoulin1995). One of its members, Adolphe Baudewyns, suggested a monetary purge forcing citizens to deposit all banknotes in denominations higher than 100 BEF at a bank. The amounts deposited would then be converted to credit balances. Part of these balances would be used as a loan to the state, the remainder being freely accessible (Van der Wee and Van der Wee-Verbreyt Reference Van Der Wee and Van Der Wee-Verbreyt2009, p. 362). The suggestion made by Baudewyns eventually served as basis for the Gutt plan. When the government came back from London, on 8 September 1944, Camille Gutt, the finance minister, thus had a plan ready for fighting inflation (Oosterlinck and White forthcoming).
According to Bismans (Reference Bismans and Lebrun1992), this plan answered three major questions: (1) what exchange rates should the Franc Belge adopt? (2) how should the money supply be reduced? (3) which fiscal measures should be taken to drive the clean-up of public finances? The exchange rate of the Franc Belge was fixed by the government at the value of 176 BEF to the pound. This rate corresponded to a limited devaluation of the currency. Gutt's plan to address money supply reduction was set up on 6 October 1944. The plan imposed the following measures: (1) from 9 October on, all 100-and-more-franc notes lost their legal tender status; (2) citizens were allowed, between 9 and 13 October 1944, to convert old notes for an amount equal to 2,000 BEF per person;Footnote 7 (3) bank accounts were totally blocked, except for: either 10 per cent of their total value, or their value at the beginning of the war (9 May 1940) or up to a limit of 1,000 BEF per employee for companies; (4) an initial amount of money (3,000 BEF) would be liberated during the first month followed by others up till 15 January 1949; (5) in total, 40 per cent of the total value of the bank accounts was liberated, the remaining 60 per cent being declared as ‘Definitely blocked’. This liberation occurred gradually, with the last part of these blocked assets being released in December 1948 (BNB 1949, p. 19). The future of the remaining 60 per cent was unknown until October 1945. The law of 14 October 1945 settled the fate of these blocked assets, which were converted into a ‘forced loan’ (Baudhuin Reference Baudhuin1958, p. 43).
From the outset the Gutt plan was heavily criticized by influential notables such as the former prime minister Paul Van Zeeland or Fernand Baudhuin, a preeminent economics professor at the time (Crombois Reference Crombois2000 and Reference Crombois2001). Camille Gutt tried to gain the support of the population by pointing out in a radio broadcast the importance of restoring monetary stability (Van der Wee and Van der Wee-Verbreyt Reference Van Der Wee and Van Der Wee-Verbreyt2009, p. 421). Despite the heavy-handed character of the measures and the opposition to the plan, it would later be considered a success by Maurice Frère, the governor of the National Bank of Belgium from 1944 to 1957, by Gaston Eyskens (Eyskens Reference Eyskens1955), who succeeded to Camille Gutt as finance minister, and more recently by historians (Cassiers Reference Cassiers and Eichengreen1995; Van der Wee and Van der Wee-Verbreyt Reference Van Der Wee and Van Der Wee-Verbreyt2009).
After the first stage of the Gutt plan, the monetary expansion remained under the strict control of the Belgian National Bank (BNB). Between 1944 and 1945, money was liberated for only two reasons: economic reconstruction and the Belgian contribution to the Allied war effort (BNB 1945, p. 6). Until 1949, the growth of the monetary supply as a whole remained regulated. The development of economic activity allowed the BNB to increase the money supply during the last months of 1944 and in 1945 (Janssens Reference Janssens1976, p. 323). In 1946 and 1947, the amount of fiduciary money circulating in the economy remained, however, limited and the expansion very much slowed down. From 1948 onwards, the growth rate of the money supply, although still much regulated, came back to its pre-war level.
III
The data series used in this article have been collected from one source listing all the sales realized at the Galerie Giroux between 1944 and 1951 (Galerie Georges Giroux 1951). The Galerie Georges Giroux was created in 1912 and by 1944 it was well established in Belgium. Part of its reputation was due to the fact that Georges Giroux had been the first to organize a collective exhibition of some famous-to-be artists, les fauvistes brabançons (Paelmer Reference Palmer2004). To ensure long-term supply of artworks, he offered contracts to artists such as Rik Wouters, whom he was sponsoring (Paelmer Reference Palmer2004). This was markedly new for Belgian artists who, at that time, were often struggling to make a living from their art (Elslander Reference Elslander1954).
The source used in this article tracks all paintings, drawings, etchings and sculptures sold at Giroux between December 1944 and May 1951.Footnote 8 Unfortunately, during the war years the gallery was closed and there are therefore no available data for this period.Footnote 9 The catalogue provides a description of the medium used, the size of the artwork and in some cases, the dates of birth and death of the artist and his/her school. The date of auction is given most of the time. The catalogue also records auction sales of gold and silverware. For the sake of consistency, these goods have not been taken into account. In some cases, the date of sale, the price or the size are not mentioned. Allowing for these exclusions, the sample contains 5,390 artworks.
An indication of the activity at Giroux can be given by the total sales revenues per year and by the number of works sold per year. Figure 1 provides these figures. In 1945–6, total sales experienced a slight increase. Then total sales decreased until 1948–9, when they experienced a sharp increase until 1949–50. They decreased again in 1950–1. Moreover, the number of works sold followed the trend of the sales except for 1946–7 and 1948–9, when it moved in the opposite direction.

Figure 1. Number of paintings, drawings, watercolours, engravings and sculptures and total sales, 1944–51 a
Even though Figure 1 provides an indication of the evolution of the market, only a proper price index can account for price changes. Building such an index is not straightforward as the index should capture the price evolution of artworks, which are by nature heterogeneous. Indeed, works of art are produced as differentiated objects and are not substitutable one for another (Gérard-Varet Reference Gérard-Varet1995). To deal with the specificities of the art market, economists rely mainly on two different approaches: the repeated-sales regression and the hedonic regression methods. The repeat-sales regression method uses prices of individual objects traded at two distinct moments in time.Footnote 10 In view of the limited number of repeated sales observed during our period, this approach is not possible because the sample would be too small to be representative. Therefore the article relies on hedonic regressions (HR). In hedonic regressions the price is regressed on various attributes (characteristics) of the objects. This allows us to control for quality changes by attributing implicit prices to the value-adding characteristics. A time dummy captures the pure time effect and is used to compute the price index.
Typically, a HR model takes the following form:
 $${\rm ln}\,p_{kt} = \sum \nolimits_{m = 1}^M \alpha_m X_{mkt} + \sum \nolimits_{t = 0}^T \beta_t \delta_{kt} + \sum \nolimits_{t = 0}^T \sum \nolimits_{\,j = 1}^n \theta_{jt} \omega_{kjt} +\varepsilon_{kt}$$
where p kt is the price of good k at time t, X mkt is the value of the time-invariant characteristic m of artwork k at time t, δ kt is a time-dummy variable which takes one if the artwork k is sold at t and zero otherwise, and ω kjt is the value of the time-variant characteristic j of artwork k at time t. The antilogs of the β t coefficients are then used to construct the hedonic price index.
The key issue when using HR is the specification of the model. Since the price index is constructed on the coefficients of the time dummies, omissions of variables will alter the results. Ginsburgh, Mei and Moses (Reference Ginsburgh, Mei, Moses, Ginsburgh and Throsby2006) summarized the main characteristics to be taken into account as dimensions (height, width), medium (oil, collage, pastel, drawing, mixed media etc.), support (canvas, wood panel, cardboard, paper), signature dummy and a dated dummy. Artist dummy and a dummy capturing the fact that the artist was dead at time of the sale are also common variables (Renneboog and Spaenjers Reference Renneboog and Spaenjers2013). In terms of information availability, one may encounter many additional dummies capturing for example the presence of an artwork in a catalogue raisonné, its presence in a given exhibition, the place of sale (prestigious auction house dummies) or the reputation of an artist at a certain moment in time (by counting the size of dictionary entries).
To perform the regression the sample of observations has been restricted. Sculptures were excluded because of their limited number (2.68 per cent of the database) and the lack of information about their characteristics. Since their size was not mentioned, engravingsFootnote 11 were also excluded. The catalogue description of artworks may be classified into different categories: cardboard, paper, mounted paper, wooden artworks, drawing, dessin réhaussé, charcoal, red chalk drawing, sepia, oil on canvas, oil mounted on canvas, watercolour, wash drawing, gouache, pastel. The final sample contains 4,505 artworks from 1,119 artists. We decided to exclude from the sample the artists for whom fewer than five paintings were auctioned during the period under study. This leaves us with a sample of 3,077 artworks produced by 236 artists.
The following variables were used for the regression:
The dependant variable is the logarithm of the price as mentioned in the catalogue.Footnote 12
Artist dummies: takes the value one if the artwork has been created by the artist in question, zero otherwise.Footnote 13
Date dummies: takes the value one if the artwork is sold during the month in question, zero otherwise.
Medium dummies: these dummies are cardboard, wooden artworks, canvas, mounted canvas, drawing, dessin réhaussé, paper, mounted paper, watercolour, pastel, charcoal, painting on glass, gouache, wash drawing, sepia, red chalk drawing, poster. Although this represents a mixture of supports and media, we stick to this specification since it is the one used in the catalogue.
Size: height and width (measured in cm) as well as height squared and width squared (in cm2) capture the impact of the object's size. The size does not include the frame.
We proceed in two steps to assess the impact of the monetary reform on the art market. In the first step we are interested in the relationship between money supply and prices of artworks. More precisely, we include in our baseline regression the growth of the money supply to determine whether the positive correlation found by Boyer (Reference Boyer2011) holds in our case.
There are many ways to define money. The definition proposed by the European Central Bank distinguishes three monetary aggregates for the Euro area (M1, M2 and M3).Footnote 14 The strictest definition M1 (narrow money) includes currency in circulation and overnight deposits. M2 (intermediate money) is more broadly defined and includes, in addition to the elements already incorporated into M1, deposits with an agreed maturity up to two years and deposits redeemable at a period of notice of up to three months. The broadest definition, M3 (broad money), adds to M2 marketable instruments issued by the Monetary Financial Institution (MFI) sector. These modern aggregates are obviously anachronistic when discussing the 1940s and 1950s. Furthermore, because of data limitation they are impossible to replicate exactly. They nonetheless enable the reader to understand the measures used in this article to proxy the money supply. Two measures will be used: the number of banknotes in circulation and the size of discount loans.
The number of banknotes in circulation is part of the narrow money (M1). The growth of the banknotes in circulation was quite stable over the whole period (and even negative in 1946). This was of course one of the consequences of the monetary purge instituted in 1944. The Avances sur Fonds Publics is the other category for which we have data. These advances represent short-term collateralized loans from the BNB, the equivalent of discount loans. These advances are defined in the BNB statutes as ‘advances on current accounts or short-term loans against the deposit of public national effects guaranteed by the State or by the colony’.Footnote 15 The loans were limited to a period of four months maximum, renewable once. These Avances sur Fonds Publics were used in the BNB yearly reports as a proxy for the credit granted to the private economy. They depended on the situation of the monetary market but most importantly, on the situation and on the needs of the private economy (BNB 1945, p. 13). Strictly speaking, these advances cannot be viewed as overnight deposits and therefore should probably be viewed as part of M2.
In our empirical strategy we first look at our proxy for M2 (the sum of banknotes in circulation and discount loans), then at M1 (banknotes in circulation) and eventually at the discount loans only. In the absence of reliable dataFootnote 16 we have to make the assumption that overnight deposits remained more or less constant over the period. Following Boyer (Reference Boyer2011), we are interested in the relationship between money supply and art prices. Boyer (Reference Boyer2011) finds a positive correlation between the two measures; we therefore expect a similar result following the monetary reforms. In these regressions, we include yearly time dummies rather than monthly ones in order to avoid collinearity issues since our money supply data are reported monthly.
The second step analyses the impact monetary reforms may have on art prices because of the fear that individual wealth will be scrutinized. There is no way to test this hypothesis directly. We therefore rely on indirect means. If people bought artworks because they were anticipating that they would have to declare their wealth as a result of the monetary reforms, then the demand for artworks should disappear after the reform. Black marketeers are known to have been active buyers during the war. To assess the role of economic collaborators in the art market we look at the impact of the repression of economic collaboration on the art market by using as proxy the number of trials for collaboration.
IV
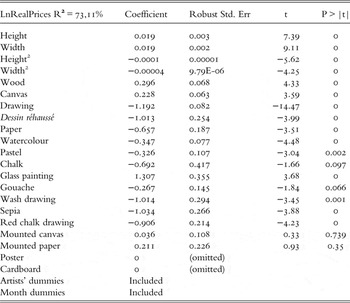
Appendix I summarizes the results of the regression and our baseline model (and Appendix II details the construction of the price index). The adjusted R-square of the model is slightly above 73 per cent and is consistent with the literature (see, for instance, Renneboog and Spaenjers Reference Renneboog and Spaenjers2013). Price is a concave function of the size. All of the media sell at a premium, except for drawings, compared to the two reference categories (cardboard and poster). The dummies related to mounted canvas and mounted paper are nevertheless not statistically significant. The antilogs of the coefficients of the time dummies allow us to construct a price index. The model used to build our index is the baseline model. Figure 2 depicts the evolution of the art index which may be divided into two significant periods.

Figure 2. Evolution of the art index. Index value is 100 for February 1945 a
The first period starts in February 1945 and ends in October 1947. During this period the market experienced a massive downward trend, falling from a value of 100 to 17.96 in just three years. The boom the market had encountered during the war was not sustained after the liberation. ‘Your money will keep all its value’ was the pitch of an advertisement for a Belgian gallery on 10 March 1945.Footnote 17 Our analysis shows how far from the reality this assertion was. After October 1947, no clear trend emerges. The index oscillates between 12.86 (April 1950) and 55.01 (June 1949) and the market is characterized by a very high volatility.
Results of the regression after inclusion of the money supply are given in Appendix III. Surprisingly and contrary to expectations, we find no significant effects of our proxy for M2 and of the growth rate of the banknote supply on the real art prices. However, we find a positive and significant effect of the advances. This suggests that real art market prices were affected by the credit allocated to the private economy. How can this difference be accounted for?
The monetary policy followed by the BNB aimed at limiting the increase in fiduciary money, which explains the stability (and even the negative growth) of the fiduciary money supply. This limitation was such that banknotes in circulation did not cover the demand for money. The BNB 1946 annual report details the consequences of the policy followed by the national bank. According to the BNB, since there was a shortage most of the fiduciary money was channelled to the real economy. As a result, investment on the stock market declined as well as other investment-linked activities. After the monetary reform, the available credit was directly invested into household or industrial equipment.
One can conjecture that after the war, artworks were considered more as a pure investment rather than a consumption (or a real) good. State bonds may have been deposited to obtain loans, which in turn may have been used to buy artworks. In this case, investors would have favoured artworks in comparison to state bonds. This would explain why the art market was not directly impacted by the slow growth of the banknote supply but well by the discount loans. In other words, the positive impact of advances on art market real prices suggests that real prices on the art market are influenced by the credit to the private economy but not by the money supply as a whole.
Anecdotal evidence suggests that, during the war, black marketeers became active buyers on the art market (Milo Reference Milo and Fage1943). Contemporaneous actors believed that the boom in the art market was linked to inflation fears. The price increase observed when monetary reforms were mentioned suggests that there is indeed a strong link between money supply and prices on the art market.
The expectation of monetary purges after the war, created by the example of post-World War I, may have prompted economic collaborators to buy artworks to hide illicit profits. If artworks were only bought to weather the storm created by monetary reforms, then one might expect the demand for artworks to experience a negative shock after these reforms. It is likely that economic collaborators would have refrained from buying artworks to avoid extensive scrutiny of their holdings. One may conjecture that the sales would be linked to the intensity of the repression of economic collaboration. The more intense the repression was, the less important the demand for artworks. The number of trials for collaboration is taken as a proxy for the intensity of the repression. We expect that the more important this number was, the more intense the repression, and the less demand there was for artworks.
To test black marketeers' impact on the art market we add in our regression the number of trials for collaboration. Figure 3 reports the yearly numbers from 1944 to 1949.

Figure 3. Number of trials for collaboration in Belgium, 1944–9
Appendix IV provides the results, which are inconclusive. The coefficient has the expected negative sign but is not significant. This observation may be attributed to several factors.Footnote 18 First, and most importantly, since the number of trials is reported annually it is hard to run a solid and robust statistical analysis. The figures should thus be viewed as an indication. Second, the number of economic collaborators active on the art market may not have been as important as reported. Third, they may have decided to refrain from selling artworks at the height of the repression for fear of attracting attention on their wealth. This would have generated a negative shock on the supply side as well cancelling the negative effect on the demand side of the artworks. Eventually, they may also have relied on sales in foreign countries. In any case, our analysis does not allow us to draw any clear conclusion in this respect.
V
Collectibles are often presented as a good hedge against inflation. Anecdotal evidence tends to indicate that this belief was at least partially responsible for the boom observed in the art market in occupied countries during World War II. Even though the link between inflation and art prices has often been suggested, the link between monetary reforms and real art prices has received scant attention. If indeed the real price of artworks is affected by inflation expectations then it seems logical to assume that dramatic changes in the money supply would also be reflected in the price of artworks. To determine the extent to which monetary reforms play a role in the price of artworks, this article focuses on one of the major monetary reforms implemented in Europe following World War II: the Gutt plan.
The Gutt plan was specifically meant to reduce the money overhang caused by more than four years of occupation. At the time the measures were heavily criticized as being too extreme (Lamal Reference Lamal1945). In practice the plan led to the demonetization of all banknotes with a value higher than 100 francs. As a result these banknotes had to be declared to the authorities, which only allowed them to be exchanged for new banknotes for a value of up to 2,000 francs per household. The plan did not only deal with banknotes but also with checking accounts. These accounts were frozen with only a small fraction made available to their owners.
To assess the impact of these reforms on the art market the article reconstructs, on the basis of an original database of more than 3,000 artworks, an art market index for the period 1945-51. The art market experienced a dramatic crash at the Liberation. Regarding the link with the money supply, the analysis shows that the real prices of artworks are only positively correlated with the credit to the private sector. Banknotes' growth rate does not seem to have a significant impact on the real prices of artworks. Contemporaneous actors often stressed the important buying behaviour of economic collaborators during the war. Black marketeers were apparently seeking to hide their illicit profits by investing in real goods such as artworks. At the Liberation they were, however, likely to avoid buying on the market thus reducing demand. This would have been strongest when scrutiny for illicit profits was at its height. To test if black marketeers had a marked impact on the art market, the number of trials for collaboration is used as a tentative explanatory variable. Results in this respect are inconclusive. Either black marketeers were less active than previously thought or their behaviour remained constant during the whole period of repression of economic collaboration. Monetary reforms, needed to purge the money overhang, dealt a severe blow to the art market. By contracting the monetary base in an extreme way, demand for non-essential goods disappeared. Following the freeze of bank accounts, the main concern for the population became how to manage to get cash to cover the essential needs of the reconstruction.
Appendix I: Results of hedonic regression
The model is estimated using OLS. The dependant variable is the natural logarithm of the prices (in real terms). The model is estimated using heteroskedasticity consistent errors (White's errors).
Number of observations = 3,077
Appendix II: Art price index construction

Appendix III: Money supply effects
Regression 1: Effect of the total money supply (banknotes + advances) on the real prices of art
The model is estimated using OLS. The dependant variable is the natural logarithm of the prices (in real terms). The model is estimated using heteroskedasticity consistent errors (White's errors).
Number of observations = 3,077

Regression 2: Effect of the growth rate of banknotes on the real prices of art
The model is estimated using OLS. The dependant variable is the natural logarithm of the prices (in real terms). The model is estimated using heteroskedasticity consistent errors (White's errors).
Number of observations = 3,077

Regression 3: Effect of the credit to the private economy on the real prices of art
The model is estimated using OLS. The dependant variable is the natural logarithm of the prices (in real terms). The model is estimated using heteroskedasticity consistent errors (White's errors).
Number of observations = 3,077

Appendix IV: Repression effects
Regression run on the 1945–9 sample since our data about the number of trials stop in 1949 (2,256 observations). The model is estimated using OLS. The dependant variable is the natural logarithm of the prices (in real terms). The model is estimated using heteroskedasticity consistent errors (White's errors).


