


I
Irving Fisher's Appreciation and Interest, which was published in Reference Fisher1896, is widely seen as the first comprehensive discussion of the connections between interest rates, exchange rates and inflation (see Dimand and Gomez Betancourt Reference Dimand and Gomez Betancourt2012). Among other things, Fisher postulated that forward-looking investors will demand relatively high nominal interest rates on assets whose unit of account is expected to depreciate, whereas relatively low interest rates are acceptable on assets whose unit of account is expected to appreciate. In doing so, he provided a path-breaking analysis of the uncovered interest-parity (UIP) condition (see e.g. Dimand Reference Dimand1999).Footnote 1 In particular, he undertook, arguably, the first thorough empirical study of the UIP condition by illustrating the relationship between interest-rate differences and exchange-rate changes by means of data from the United States and India (see Lothian et al. Reference Lothian, Pownall and Koedijk2013, p. 6).
Since the transition towards floating exchange rates during the 1970s, a vast body of empirical research has followed in the footsteps of Fisher's pioneering work. However, despite the increasingly close integration of financial markets, across many countries and time periods, high interest-rate currencies have tended to appreciate, rather than to depreciate (see e.g. Engel Reference Engel, Gopinath, Helpman and Rogoff2014, pp. 494ff.). This blatant contradiction to the basic UIP condition is puzzling, insofar as it remains unclear whether large arbitrage opportunities are left unexploited. Currently, there is no consensus as regards the origin of this ‘UIP puzzle’. Whereas the capacity of currency speculators to anticipate future exchange-rate changes has been questioned (see e.g. Engel Reference Engel, Gopinath, Helpman and Rogoff2014, pp. 498ff.), other explanations suggest that the puzzle is an artefact of missing pieces in the basic UIP relationship. Above all, aside from different interest rates, assets denominated in different currencies could be subject to various levels of uncertainty and risk (Lewis Reference Lewis, Grossman and Rogoff1995, pp. 1943ff.; Engel Reference Engel, Gopinath, Helpman and Rogoff2014, pp. 506ff.). To account for this, in principle, interest rates should be corrected by a risk premium, which is typically not directly observable and, hence, often ignored (see e.g. Sarantis Reference Sarantis2006). However, as soon as risk premia vary across time, ignoring their effect could introduce an omitted-variables bias (Fama Reference Fama1984; Ismailov and Rossi Reference Ismailov and Rossi2018).
Irving Fisher seems to have been aware of the challenges to uncover how interest rates react to changes in the underlying unit of account. In particular, in the empirical part of his work, he carefully developed a research design comparing the yields of bonds, which should ideally be similar in all important aspects, but be denominated in different currency standards (see Lothian et al. Reference Lothian, Pownall and Koedijk2013, pp. 8ff.). Fisher found a first example in the United States, where bonds payable in coins (or gold) and currency (or paper money) had simultaneously been issued during the second part of the nineteenth century. For Fisher (Reference Fisher1896, ch. 9), a comparison of the corresponding yields with the dollar price for gold provided one environment in which to check whether interest rates on bonds that only differ in terms of currency denomination are reflected by future exchange-rate changes. Fisher also considered a second example with Indian bonds. Following his research design, and reflecting that considerable monetary fluctuations had occurred between silver and gold-backed currencies, he ideally wanted to compare gold and silver contracts that are simultaneously traded in the same market and are based on the same security (Fisher Reference Fisher1896, ch. 9). He then goes on to draw attention to the Indian case:
Such contracts are fortunately available in the London market of government securities. The loans of India have been raised partly in gold and partly in silver, and both forms of securities are bought and sold in London. The interest on the silver bonds is paid by draft on India. The sums actually received in English money depend on the state of the exchanges. (Fisher Reference Fisher1896, p. 46)
From compiling a table covering three decades worth of annual observations, Fisher concluded that there is a co-movement between Indian gold and silver-bond prices, but that the corresponding return, when expressed in the same currency, is far from being equal. Concurring with the discussion above, in the following paragraph, he seems to suggest that uncertainty and time-varying risk could have prevented a complete equalisation:
The rates realised to investors in bonds of the two standards differed but slightly until 1875, when the fall of Indian exchange began … From 1884 exchange fell much more rapidly than before, and the difference in the two rates of interest rose accordingly … Since the two bonds … are in fact similar in all important aspects except the standard in which they are expressed, the results afford substantial proof that the fall of exchange … was discounted in advance. Of course investors did not form perfectly definite estimates of the future fall, but the fear of a fall predominated in varying degrees over the hope of a rise. (Fisher Reference Fisher1896, p. 48; emphasis added)
Against this background, this article endeavours to contribute to the literature by accounting for the role of time-varying risk in Fisher's example of an UIP condition encapsulated in Indian gold (sterling) and silver (rupee) bonds. Thereto, a new data set with Indian interest and exchange rates at the monthly frequency has been collected in order to conduct a state-of-the-art econometric analysis of the interest-parity condition as regards the loans raised by India in the London market for government securities. The corresponding results uncover a relatively close correlation between rupee-to-sterling interest-rate differences and exchange-rate changes. However, concurring with recent empirical research, the relationship is far from perfect. Particularly large deviations from the UIP condition seem to arise during the 1890s, when India suffered from pervasive levels of uncertainty about the future of its silver-based currency system. Conversely, before the 1890s, when the rupee was an established silver currency, and especially after the 1890s, when the rupee value had finally been anchored to gold, a relatively close correlation arises between sterling-to-rupee interest-rate differences and exchange-rate changes.
The article is organised as follows. The next section contains a synoptic review of the empirical UIP literature. Section iii provides the historical background by discussing India's currency system and its market for government bonds. Section iv discusses the corresponding interest-parity condition between silver and gold bonds around the year 1900. Section v presents the econometric results. Section vi concludes.
II
A vast body of research has found a negative, rather than the expected positive, slope coefficient (β) when regressing international interest-rate differences onto exchange-rate changes. Corresponding surveys can be found in Lewis (Reference Lewis, Grossman and Rogoff1995) or Engel (Reference Engel, Gopinath, Helpman and Rogoff2014). However, β has typically not only the wrong sign, but is also highly unstable across time (Ismailov and Rossi Reference Ismailov and Rossi2018). As mentioned at the outset, this could be the result of unaccounted time-varying risk (Fama Reference Fama1984). Reflecting this view, it has for example been found that the UIP relationship holds better when currency appreciations and depreciations are constrained by a stable fixed exchange-rate regime with relatively low levels of risk and uncertainty (see e.g. Flood and Rose Reference Flood and Rose1996). In a similar vein, Ismailov and Rossi (Reference Ismailov and Rossi2018) suggest that the deviations from the UIP condition are smaller in low-uncertainty environments. Finally, Li et al. (Reference Li, Ghoshray and Morley2012) and Aysun and Lee (Reference Aysun and Lee2014) account for the role of time-varying risk by means of financial time-series models of the GARCH family, and find that this tends to reduce the deviations from the UIP condition.
A small number of contributions have looked at the connections between exchange and interest rates with nineteenth-century data. The focus has thus been on the core currencies of the international gold standard and the years after 1870, including the dollar-to-sterling exchange rate (Goodhart Reference Goodhart1969; Coleman Reference Coleman2012), but also the exchange rate between the pound sterling, the French franc, the German mark, and the Dutch guilder (Herger Reference Herger2018). Concurring with the just-mentioned finding that the UIP condition works better within established fixed exchange-rate regimes, these papers typically found a positive, although not necessarily perfectly proportional, coincidence between high interest rates and currency depreciations. Conversely, the floating exchange rates between gold and silver currencies have received far less attention. With the Indian rupee being one of the most important silver exchanges at the time (see Clare Reference Clare1895, p. 139), it is perhaps not surprising that Fisher (Reference Fisher1896, pp. 46ff.) chose this example to study the relationship between interest and exchange rates. His later book on The Theory of Interest contains a very similar discussion, but adds the years until 1906 to the sample (Fisher Reference Fisher1930, p. 404). Based on these annual observations, Lothian et al. (Reference Lothian, Pownall and Koedijk2013) have estimated a basic UIP regression, which resulted in a negative effect of interest-rate differences between Indian bonds on the rupee exchange rate. However, the corresponding standard deviation was too large to reject neither the hypothesis that the slope coefficient equals zero (e.g. there is no connection between interest-rate differences and exchange-rate changes), nor that it equals one (e.g. there is a proportional connection as suggested by the UIP condition). Finally, a detailed discussion of Indian gold and silver bonds can be found in Flandreau and Oosterlinck (Reference Flandreau and Oosterlinck2012). However, rather than directly testing the UIP condition, they have gauged the market beliefs regarding the survival of bimetallism by looking at the interest-rate spread between these bonds with quarterly data before the 1890s.
III
Until the nineteenth century, numerous gold and silver-based coins circulated in different areas of the Indian subcontinent (Dadachanji Reference Dadachanji1931, ch. 1; Wadia and Joshi Reference Wadia and Joshi1926, ch. 19). It was only after the establishment of British colonial rule that, in 1835, the rupee silver coin became legal tender (Clare Reference Clare1895, p. 139; Dadachanji Reference Dadachanji1931, p. 5). With the important exception of Britain, silver coins used to be widespread in many parts of the world and bimetallic systems, where silver provided one metal of a pair into which a currency was convertible, were quite popular during the nineteenth century (see Eichengreen Reference Eichengreen2008, pp. 7ff.). However, the situation changed after 1870, when major countries such as Germany and France during the 1870s, and somewhat later the United States during the early 1890s, demonetised silver (see Eichengreen Reference Eichengreen2008, pp. 15ff.). Conversely, together with countries such as China and Mexico, India adhered to a silver-based currency almost until the end of the nineteenth century (Clare Reference Clare1895, ch. 24).
Having a silver-based currency gave rise to aggravated levels of uncertainty as regards the exchange rate with respect to the major countries of the classical gold standard (see Clare Reference Clare1895, ch. 5). Considering the case of India, one rupee was officially worth  ${{165} \over {444}}$ of an ounce (oz) of standard silver, whose market value in terms of the pound sterling (or gold) could change each day (see Clare Reference Clare1895, p. 140). For example, with the silver price standing at
  $52{9 \over {16}}$ pence per oz standard on 31 of January 1880, the mint-par equalled
 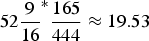 $52{{9} \over {16}}^{\ast}{{165} \over {444}}\approx 19.53$ pence per rupee.Footnote 2 At the monthly frequency, the dashed line of Figure 1 depicts the floating rupee-to-sterling mint-par between 1869 and 1897, based on silver prices quoted in the Banker's Gazette – which supplemented The Economist in reporting financial data.

Figure 1. Sterling-to-rupee exchange rate and mint-par (1869–1906) Source: compiled from the Banker's Gazette, downloaded from The Economist Historical Archive.
Despite the metallic foundation of nineteenth-century currencies, most international transactions were actually arranged by commercial banks and settled by means of bills of exchange, rather than costly transfers of coins or bullion (Eichengreen Reference Eichengreen2008, pp. 24ff.; Herger Reference Herger2018, p. 3). India provided a special case in the sense that the India Council – the colonial government residing in London – arranged regular transactions with England and, hence, adopted a key position in the sterling-to-rupee bills market (see Keynes Reference Keynes1913, pp. 102ff.; Sarkar Reference Sarkar1917, pp. 283ff.; Laughlin Reference Laughlin1896, pp. 126ff.). In particular, in weekly auctions, the India Council sold bills for sterling in London requiring payment in rupees in India. According to demand and supply, the market exchange rate for these ‘Council bills’ could deviate, to some degree, from the mint-par (see Clare Reference Clare1895, p. 141). The solid, grey line of Figure 1 depicts the end-of-the-month sterling-to-rupee Council-bill rate as published in the Banker's Gazette.Footnote 3 Typically, the Council-bill rate was slightly above the silver mint-par (see Figure 1). Arguably, this reflected India's trade surplus with Britain (mainly thanks to large cotton exports), which had to be counterbalanced by net-capital flows to India giving rise to a relatively high demand for Council bills (see Laughlin Reference Laughlin1896, pp. 130ff.; Clare Reference Clare1895, p. 140). However, as long as sterling and the rupee remained convertible into their underlying monetary metal, the Council-bill exchange rate was anchored to the floating mint-par.
Council bills gave rise to payments only after reaching India by mail. Typically, it took around two weeks until payments in rupees were made (Keynes Reference Keynes1913, pp. 104–5). Therefore, like other types of so-called ‘long-bills’ at the time, the rupee-to-sterling exchange rate derived from Council bills encapsulated an implicit interest rate, which compensated the holder for essentially providing short-term credit (see Clare Reference Clare1895, ch. 12; Keynes Reference Keynes1913, p. 105). In an environment with relatively low interest rates, this was not a major concern and Council bills were the preferred instrument for arranging payments with India. Conversely, in a high-interest-rate environment – Keynes (Reference Keynes1913, p. 106) mentions a threshold of around 7 per cent – it became worthwhile to resort to so-called ‘telegraphic transfers’, which provided the holder with almost instantaneous rupee payments, although at a slightly higher exchange rate. However, for the months when the India Council was able to sell telegraphic transfers, the black line of Figure 1 shows that the corresponding exchange rate coincides almost exactly with the Council-bill rate.
During the decades before the advent of the classical gold standard, the relative price between silver and gold had been quite stable (Laughlin Reference Laughlin1896, pp. 161ff.). Hence, exchange-rate uncertainty of silver-based currencies was not a cause for concern. However, the situation changed during the mid 1870s, when the above-mentioned demise of bimetallism – and with it the role of silver as monetary metal – began. Although this transition took several decades, aggravated levels of uncertainty arose in the international currency system when major countries demonetised silver. In particular, the decision of France to limit silver coinage in September 1873, and to abolish it in August 1876, stand out as turning points as regards the future of bimetallism (Flandreau and Oosterlinck Reference Flandreau and Oosterlinck2012, p. 663). The move away from bimetallism by France was indeed associated with an unprecedented reduction of the silver price (Laughlin Reference Laughlin1896, ch. 12). For silver-based India, this led to a substantial depreciation of its exchange rate with, for example, the rupee being worth around 22 pence in 1875, but only around 17 pence in 1889 (see Figure 1). This downward trend was interrupted when, in July 1890, the United States responded to the political agitation to remonetise silver with the passage of the Sherman Act, which included a clause instructing the Treasury to purchase 4.5 million ounces of silver per month (see Fisher Reference Fisher1896, p. 48). However, the uncertainty about the future organization of the American currency system gave rise to major monetary disturbances, leading to the repeal of the purchase clause of the Sherman Act as soon as November 1893 (see Friedman and Schwarz Reference Friedman and Schwarz1963, pp. 104ff.). For the rupee exchange rate, these events manifested themselves in a marked, but short-lived, re-appreciation during the early 1890s.
As noted by Keynes (Reference Keynes1913, ch.1) – who spent a brief part of his career as a civil servant at the India Office in London (see Niehans Reference Niehans1990, p.346) – the ongoing rupee depreciation was seen as an obstruction to trade and investment. Hence, shortly after an international monetary conference in Brussels had failed to reestablish bimetallism in 1892, various plans were unveiled to replace India's silver-based currency system (Dadachanji Reference Dadachanji1931, pp. 23ff.). A first step in this direction was taken in 1893, when Indian mints ceased to freely coin rupees for private persons (Sarkar Reference Sarkar1917, p. 290; Wadia and Joshi Reference Wadia and Joshi1926, pp. 191ff.). This led to an immediate decoupling of the market exchange rate from the silver mint-par (see Figure 1). Furthermore, between September and November 1897, due to a shortage of currency reserves in India, the sale of Council bills had to be suspended for ten weeks (The New York Times, 1897). Soon thereafter, the silver link of the rupee was completely severed. More specifically, an Indian Currency Committee, whose report was published in July 1898, recommended that the rupee value should be fixed in terms of gold (Dadachanji Reference Dadachanji1931, pp. 50ff.). However, to protect Britain's gold holdings, it was eventually decided to install a gold-exchange standard. In particular, the rupee was made convertible at an official rate of 1 shilling and 4 pence, or 16 pence (Dadachanji Reference Dadachanji1931, pp. 69ff; Wadia and Joshi Reference Wadia and Joshi1926, pp. 196ff.). Furthermore, to avoid gold flows to India, the tasks of the above-mentioned Council-bill system were enlarged to stabilise the exchange rate (see Keynes Reference Keynes1913, pp. 106ff.). The India Council achieved this by selling bills at a time-varying exchange rate slightly above 16 pence per rupee, so as to make sure that it was not worthwhile to make transactions in gold due to the corresponding transportation and insurance costs. Taken together, after around a decade of pervasive uncertainty as regards the future organisation of India's currency system, the sterling-to-rupee exchange rate was stabilised during the year 1899, and the floating rupee based on silver was replaced by a stable, fixed exchange-rate regime during the first part of the twentieth century (Keynes Reference Keynes1913, pp. 33ff.; Wadia and Joshi Reference Wadia and Joshi1926, ch. 24).
During the second part of the nineteenth century, India's government bonds were denominated in rupees and sterling (Fisher Reference Fisher1896, p. 388). Some tranches of these rupee and sterling bonds had the same coupon between 3 and 5 per cent and were simultaneously listed in the London financial market. The top panel of Figure 2 illustrates this by means of a price list taken from the May 1877 edition of the Investor's Monthly Manual, which was published in connection with The Economist to disseminate financial data of the London Stock Exchange.Footnote 4 As shown by the last column, some coupon payments were made in sterling by warrant at the Bank of England, e.g. in a currency convertible into gold, whereas others were payable in rupees, e.g. in a currency convertible into silver. Moreover, more than 20 per cent of the rupee bonds were ‘enfaced for payment in London’ (Flandreau and Oosterlinck Reference Flandreau and Oosterlinck2012, p. 656).

Figure 2. Derivation of interest rates on Indian government bonds Source: Investor's Monthly Manual, downloaded from Historical Financial Research Data, International Center for Finance, Yale University.
India was not the only foreign country with government bonds placed in London. Actually, an impressive number of countries were listed in the foreign-government-stocks section of the London financial market. In any case, India provided an example where silver-based rupee-bonds and gold-based sterling-bonds, backed by the same government and traded in the same financial market, were literally quoted side-by-side in the financial press.
For the 1869 to 1906 period, Table 1 provides a list of Indian bonds with frequent price quotations in London.Footnote 5 The corresponding end-of-the-month prices, depicted in the middle panel of Figure 2, are the stepping stone for calculating internal interest rates for gold and silver-based currency. Even with identical coupon payments, for several reasons, this calculation is not trivial. Firstly, since the Investor's Monthly Manual reports all data in pounds sterling, the silver-bond prices need converting into rupees to obtain a genuine silver-currency yield. Following Fisher (Reference Fisher1896, p. 47), the corresponding conversion employs the market exchange rate for Council bills, rather than the floating mint-par. Secondly, the various bonds matured on different dates. Thirdly, interest on most bonds was paid semi-annually, whereas some of the sterling bonds had quarterly interest payments. Fisher (Reference Fisher1896, Reference Fisher1930) essentially ignored these issues by treating each bond as a perpetuity and, hence, calculating a yield given by
 $$i = \displaystyle{{\,p_{\,par}C} \over {\,p_t}},$$
where p par denotes the par-value, C the annual coupon payment, and p t the current bond price.Footnote 6
Table 1. Actively traded tranches of Indian bonds in the London Stock Exchange

Source: compiled from Flandreau and Oosterlinck (Reference Flandreau and Oosterlinck2012) and the Investor's Monthly Manual.
Fisher (Reference Fisher1896, p. 47; Reference Fisher1930, pp. 404–5) looked at several tranches of Indian bonds to compile his annual interest-rate data. In particular, for gold currency (sterling) until 1880, he used the 4%’s, between 1880 and 1884 the  $3 \!{1 \over 2}$%’s, and thereafter the 3%’s. For silver currency (rupees), between 1869 and 1894, he used the 4%’s, and thereafter the
  $3 \!{1 \over 2}$%'s. However, when comparing the 4 and the
  $3 \! {1 \over 2}$% sterling bonds, the different coupon payments seem to give rise to a structural break (see Figure 2). Conversely, at the end of 1894, the 4% rupee paper could be converted into
  $3 \! {1 \over 2}$%’s (Fisher Reference Fisher1896, p. 47), which might be the reason why the corresponding price transition was much smoother. To mitigate against structural breaks, wherever possible, the results of Section v employ bonds with identical coupon payments. In particular, until October 1888, the 4%’s are used. After October 1895, the
  $3\!{1 \over 2}$%’s are used. Between those dates, yields are derived from the 4%’s for silver, and from the
  $3 \!{1 \over 2}$%’s for gold currency.
For the years between 1869 and 1906, the bottom panel of Figure 2 depicts the yields calculated for the bonds of Table 1 according to (1). Whereas the sterling-bond yields were closely tied to their coupon rate, the rupee-bond yields fluctuated heavily and were relatively high. To explain this discrepancy, Irving Fisher drew attention to expectations about future exchange-rate changes. Concretely, the upsurges of rupee yields were thought to reflect the peril of future silver depreciations. According to this interpretation, the development of the rupee-bond yields is a reflection of time-varying ‘silver risk’, meaning the uncertainty resulting from a collapsing silver mint-par. Up until the mid 1870s, the interest rates derived from sterling and rupee bonds followed a parallel movement, but began to diverge thereafter, suggesting that concerns as regards silver bonds increased. As regards monetary history, the mid 1870s were indeed characterised by the demise of bimetallism, which made the future of silver-based currencies highly uncertain. According to the rupee-bond yields, this uncertainty culminated around the unsuccessful attempt of the United States to remonetise silver during the early 1890s. In any case, the parallel movement between the interest rate on sterling and rupee bonds returned only towards the end of the 1890s, when India made the transition from a silver to a gold-exchange standard. However, compared with the 4%’s before the early 1870s, the more or less stable spread between the  $3 \!{1 \over 2}$% silver and gold bonds after 1900 is considerably wider.
IV
The interest-parity condition between Indian gold and silver bonds is approximately given by
 $$i_t^{\pounds} \approx i_t^{rs} + s_{t + h}^e -s_t-\alpha -\sigma _{t + 1},$$
where i t£ denotes the yield on sterling bonds, i trs the yield on rupee bonds, s t the exchange rate from Council bills (transformed into logarithms), and s t+he the corresponding expected value at future date t + h.Footnote 7 Furthermore, α reflects constant, and σt+1 time-varying risk. Equation (2) concurs with other UIP conditions equating the exchange-rate-adjusted return on domestic and foreign currency and accounting for role of uncertainty and risk (see e.g. Chinn Reference Chinn2006, pp. 8–9; Sarantis Reference Sarantis2006, p. 1173; or Li et al. Reference Li, Ghoshray and Morley2012, pp. 168–9).
Often, the data employed in empirical UIP studies are imperfect. Firstly, aside from a changing currency value, interest-rate differences could also reflect a large number of country characteristics, which impact upon such things as default risks. Conversely, the bonds from which i t£ and i trs are derived were both issued by the Indian government and, hence, subject to the same sovereign risk which, thanks to the backing of the British Empire, was arguably negligible (Flandreau and Oosterlinck Reference Flandreau and Oosterlinck2012, pp. 654–5). Secondly, assets denominated in different currencies are often traded in different financial markets with disparate financial regulations, taxes, or transaction costs.Footnote 8 Conversely, all interest and exchange rates appearing in (2) are derived from financial instruments traded in London, which was the world's pre-eminent financial centre at the time (Cassis Reference Cassis2010, pp. 83ff.). Furthermore, the decades around the year 1900 were characterised by free capital movements, low taxes, and a laisser-faire attitude in financial regulation (Obstfeld and Taylor Reference Obstfeld and Taylor2004, ch. 3.1). Thirdly, exchange-rate expectations s t+he are unobserved. In empirical work, usually, rational expectations are invoked such that s t+he = s t+h (see e.g. Li et al. Reference Li, Ghoshray and Morley2012, p. 168). Although this is a far-reaching behavioural assumption, any alternative postulating some form of ‘irrational expectations’ would imply that speculators could make arbitrage profits by borrowing in low-interest-rate currency and investing in high-interest-rate currency (if s t+he ≠ s t+h, the corresponding excess return would on average not even be eliminated by exchange-rate changes). Intriguingly, to assess the fundamental value of Indian gold and silver bonds during the year 1890, a contemporaneous pamphlet written by an experienced foreign-exchange trader, called Ottomar Haupt, draws on this type of argument. In particular, Haupt (Reference Haupt1890) observed that an ongoing appreciation of the rupee caused by the United States’ silver purchases cannot be associated with higher silver-bond interest rates, without inviting arbitrage transactions (see also Flandreau and Oosterlinck Reference Flandreau and Oosterlinck2012, pp. 656–7).
When converting the UIP condition into an empirical equation, coefficients β and γ are introduced, a statistical error term εt accounts for the stochastic nature of econometric relationships, and (2) is rearranged such that interest-rate differences are regressed onto exchange-rate changes, that is
 $$s_{t + h}-s_t = \alpha + \beta (i_t^{\pounds} -i_t^{rs} ) + \gamma \sigma _{t + 1} + {\varepsilon}_t.$$
The basic UIP condition arises when risk is irrelevant, e.g. α = 0 and γ = 0, and interest-rate differences and exchange-rate changes exactly offset each other, e.g. β = 1. In isolation, β = 1 is called ‘unbiasedness condition’ (see e.g. Chinn Reference Chinn2006, p. 9).
A major econometric challenge arises from time-varying risk, which is not directly observable. In financial econometrics, risk measures such as σ t+1 are nowadays commonly captured via the standard deviation of the error term εt+1 of (3), e.g. 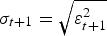 $\sigma _{t + 1} = \sqrt {{\varepsilon }_{t + 1}^2 } $ (see e.g. Tsay Reference Tsay2005, p. 123). Subsequently, the time-series behaviour of this conditional-variance, or ‘volatility’, term is thought to depend on past shocks, e.g. εt2, and its own past observation, e.g. σ t2. An econometric approach, where expected asset returns depend on expected asset risks, leads to a broad class of so-called ‘generalised autoregression conditional heteroscedasticity in mean’, or GARCH-M, models. Differences arise as regards the specification of the ‘conditional-variance equation’. To test the UIP condition, Aysun and Lee (Reference Aysun and Lee2014, p. 86) consider, for example, the GARCH(1,1) model, where time-varying risk depends on its own past value as well as the most recent volatility shock ε 2t. When these variables are defined in terms of deviations from unconditional volatility ϕ 0, we have σ t+12 = ϕ 0 + ϕ 1 (ε t2 − ϕ 0) + ϕ 2 (σ t2 − ϕ 0), where ϕ 0(.) are coefficients to be estimated. Although the GARCH(1,1) model is widely used in empirical finance, it ignores, perhaps, some of the salient features of the Indian currency system at the end of the nineteenth century. As mentioned above, the demise of bimetallism after 1870 gave rise to pervasive uncertainty about the future of silver as monetary metal. In particular, the resulting depreciation questioned the future of India's currency system. Hence, risk could have had asymmetric effects, which are commonly captured via a threshold term ϕ 3 D t, where D t is a dummy variable identifying unexpected rupee depreciations, e.g. ε t < 0. Finally, Li et al. (Reference Li, Ghoshray and Morley2012) have suggested that a component GARCH(1,1) model, or CGARCH(1,1), is warranted to separate transitory from permanent risks in UIP regressions. In doing so, even in the long term, risk is not always equal to ϕ 0, but can move around according to a permanent component obeying the equation q t+1 = ϕ 0 + ϕ 4 (q t − ϕ 0)+ ϕ 5 (ε t2 −σ t2). Meanwhile, transitory (or short-term) risk is still modelled by means of the GARCH(1,1) process introduced above. Taken together, the fully fledged conditional-variance equation, which coincides with the comprehensive CGARCH(1,1) model of Li et al. (Reference Li, Ghoshray and Morley2012, p. 170), is given by
 $$\eqalign{\sigma _{t + 1}^2 & = q_{t + 1} + \phi _1({\varepsilon }_t^2 -q_t) + \phi _2(\sigma _t^2 -q_t) + \phi _3D_t({\varepsilon }_t^2 -q_t) \cr & q_{t + 1} = \phi _0 + \phi _4(q_t-\phi _0) + \phi _5({\varepsilon }_t^2 -\sigma _t^2 ).}$$
The coefficients of (4) are subject to the following restrictions. The transitory and permanent components are stationary and the conditional variance σ 2t is non-negative if | ϕ 1 + ϕ 2 | < 1 and | ϕ 4 | < 1. This property implies that risks arise in a clustered manner, whereby transitory volatility σ t+12 converges to q t with speed ϕ 1 + ϕ 2, and permanent volatility converges to ϕ 0 with speed ϕ 4. Compared with the transitory component, the permanent component is typically highly persistent, e.g. ϕ 4 is close to 1, and ϕ 1+ ϕ 2 < ϕ 4. Otherwise, the model would converge faster in the long term than in the short term and, hence, be unstable (see Li et al. Reference Li, Ghoshray and Morley2012, p. 170). Finally, for unexpected rupee depreciations causing relatively more uncertainty, the coefficient ϕ 3 has to be positive.
The vagaries about unobserved risk map into uncertainties about the appropriate specification of the conditional-variance equation (Sarantis Reference Sarantis2006, p. 1170). However, to concur with the empirical UIP literature, the choice will here be restricted to the GARCH(1,1) of Aysun and Lee (Reference Aysun and Lee2014) where ϕ 3= ϕ 4= ϕ 5=0, and the CGARCH(1,1) including a threshold term (e.g. ϕ 4 ≠ 0) of Li et al. (Reference Li, Ghoshray and Morley2012).Footnote 9
V
Table 2 reports estimates of the conditional-mean equation (3) ignoring, for the moment, the effect of risk, e.g. the restriction γ = 0 is imposed. Column 1 employs Fisher's (Reference Fisher1930) annual data, which cover the 1869 to 1906 period and yield the incorrectly signed coefficient of  $- 1.78 $ for β featuring in Lothian et al. (Reference Lothian, Pownall and Koedijk2013, p. 11).Footnote 10 However, the corresponding standard deviations are large, and no coefficient is significantly different from zero.Footnote 11 Moreover, neither does an F-test reject the UIP condition, e.g. the joint hypothesis that α = 0 and β = 1, nor a t-test the unbiasedness condition, e.g. β = 1.
Table 2. UIP regressions with Indian gold (sterling) and silver (rupee) bonds

Notes: This table reports estimates of equation (3) with dependent variable s t+h − s t and restriction γ = 0. Estimation is by OLS. Heteroscedasticity and autocorrelation robust (Newey-West) coefficient standard errors are reported in parentheses. Significant coefficients at the 10% level are marked by a *; at the 5% level by **, and at the 1% level by ***. The null-hypothesis that the UIP condition holds implies that α = 0 and β = 1. The null-hypothesis that the unbiasedness condition holds implies that β = 1. Significant deviations from these conditions are indicated by a * at the 10% level; ** at the 5% level, and *** at the 1% level. R 2 denotes the regression fit, and N the number of observations. ARCH-LM test refers to the Lagrange multiplier test for ARCH effects according to the test statistic, e t2 = θ 0 + θ 1 e t−12 + ζ t, where e t denotes the residual and ζ t is an error term. The null-hypothesis is θ 1 = 0.
The annual data cover only 36 years. To increase the number of observations, the remaining columns of Table 2 turn to the newly collected monthly data depicted in Figures 1 and 2. As in Lothian et al. (Reference Lothian, Pownall and Koedijk2013), a horizon h of one year (or 12 months) is chosen.Footnote 12 Hence, the 1869 to 1906 period provides in principle 36 years × 12 months = 432 observations. However, as mentioned in Section iii, between September and November 1897, the sale of Council bills was suspended. Hence, the common sample covers 429 observations. With these, similar to the annual data, a negative slope coefficient of −1.25 arises in column 2. By way of contrast, since the coefficient standard deviations are smaller, the UIP and the unbiasedness condition can now be rejected at any conventionally used level.
Recall from the discussion above that nineteenth-century Indian monetary history witnessed periods with aggravated levels of uncertainty as regards the future of the silver-based rupee. To assess the corresponding effects, the sample is split into different periods. Although the worldwide transition towards a gold (and for India a gold-exchange) standard did not occur abruptly, it seems sensible to restrict the sample to observations before September 1888 to ignore the uncertainties about the long-term trend of the silver price around the year 1890, as well as to avoid a comparison between bonds with incongruent coupons. Column 3 of Table 2 reports the corresponding results, which give rise to a positive estimate for β. Furthermore, the unbiasedness condition can no longer be rejected and the UIP condition is only rejected at the 10 per cent level. The mid 1870s were characterised by substantial uncertainties as regards the future of bimetallism. To account for these, column 4 restricts the sample further to observations before August 1876, when silver coinage was abolished in France. The corresponding results give rise to larger, and according to the F-test highly significant, deviations from the hypothesised value of the UIP condition. A converse result arises when restricting the sample to the months between September 1876 and September 1888 in column 5. Column 6 looks at months between October 1888 and December 1998, which were characterised by large swings in the rupee exchange rate. Furthermore, this period also covers interest rates derived from Indian government bonds with incongruent coupon payments (see Figure 2). Given the resulting slope coefficient of −7.49, which reflects a large deviation from the UIP condition, the corresponding data imperfections and/or uncertainties about the future of silver-based currencies had apparently pervasive effects. Finally, column 7 focuses on the gold-exchange period, e.g. the months after 1899, when the rupee exchange rate had been stabilised. This manifests itself in a slope coefficient of 0.63 that is close to one. Indeed, the unbiasedness condition cannot be rejected. However, the UIP condition is still rejected. Taken together, the UIP condition holds relatively well between Indian interest-rate differences and exchange-rate changes. However, large deviations arose in periods with aggravated levels of uncertainty about the future of silver-based currency systems.
Time-varying risk is a widely invoked culprit for deviations from the UIP condition. To see whether this manifests itself in GARCH effects, the bottom of Table 2 reports Lagrange multiplier (LM) tests from regressing the squared residual e t2 on a constant and its own past value (see Tsay Reference Tsay2005, pp. 101–2). Whereas for monthly data, it cannot be rejected that the residuals are conditionally homoscedastic during the gold-exchange period, this hypothesis is clearly rejected when the rupee value followed a fluctuating silver mint-par.Footnote 13 To account for the corresponding risks, Table 3 turns to the GARCH-M model, which encompasses the conditional-mean equation (3) with γ ≠ 0 and the conditional-variance equation (4). GARCH-M models are estimated by maximum likelihood assuming, typically, that ε t follows a normal distribution with mean 0 and unconditional variance σ 2. Since the corresponding routines are recursive, a continuous sample of time-series observations is warranted (see e.g. Tsay Reference Tsay2005, ch. 3).
Table 3. GARCH-M UIP regressions with Indian gold (sterling) and silver (rupee) bonds

Notes: This table reports estimates of the GARCH-M model consisting of the conditional-mean equation (3) with dependent variable s t+h − s t and the conditional-variance equation (4). Estimation is by maximum likelihood assuming that ε t follows a normal distribution with mean 0 and (unconditional) variance σ 2. Starting values are taken from the unconditional-variance estimate σ 2 = ∑t=1T e t2/T, where e denotes the OLS-residual and T the total number of observations. Robust coefficient standard errors are reported in parentheses. Significant coefficients at the 10% level are marked by a *; at the 5% level by **, and at the 1% level by ***. The null-hypothesis that the UIP condition holds implies that α = 0, β = 1, γ = 0. The null-hypothesis that the unbiasedness condition holds implies that β = 1. Significant deviations from these conditions are indicated by a * at the 10% level; ** at the 5% level, and *** at the 1% level. Log-likelihood reports the maximised value of the log-likelihood function and N denotes the number of observations. ARCH-LM test refers to the Lagrange multiplier test for ARCH effects according to the test statistic, e t2 = θ 0 + θ 1 e t-12 + ζ t, where e t denotes the residual and ζ t is an error term. The null-hypothesis is θ 1 = 0.
For the sake of comparison with Lothian et al. (Reference Lothian, Pownall and Koedijk2013), column 1 of Table 3 reports estimates of the widely used GARCH(1,1) model with annual data. From this, a positive coefficient of 0.62 on interest-rate differences arises. Furthermore, the coefficient estimates of the conditional-variance equation are, as expected, positive, which indicates the presence of volatility clustering, and satisfy the stationarity condition | ϕ 1+ ϕ 2 | < 1. However, with only 36 observations, these results are at most indicative. Indeed, none of the coefficient estimates of (3) differ statistically from zero.
The remaining columns of Table 3 turn again to monthly data. Since the estimation of GARCH-M models warrants a continuous sample, and owing to the suspension of Council-bill sales in the year 1897, the results cannot be estimated across the 1869 to 1906 period. By and large, the years around 1897 mark the transition of the Indian currency system from a silver to a gold-exchange standard with much lower degrees of risk and, as discussed above, no pervasive GARCH effects. Hence, the monthly results of Table 3 focus on the silver period.Footnote 14
Table 3 reports the UIP regression with the GARCH(1,1) and CGARCH(1,1) specification discussed at the end of Section iv. By violating the stationarity condition | ϕ 1+ ϕ 2 |< 1, the GARCH(1,1) does not perform well. Conversely, the comprehensive CGARCH(1,1) performs better in terms of satisfying the stationarity conditions of, respectively, | ϕ 1+ ϕ 2 |< 1 and | ϕ 4 | < 1, and the stability condition | ϕ 1+ ϕ 2| < | ϕ 4 |.
It turns out that the GARCH-M models do not remove the UIP puzzle. Rather, the above-mentioned result confirms that the puzzle was largely caused by such things as uncertainty about the future of silver-based currency and/or a comparison between Indian government bonds with incongruent coupon payments.
In particular, when contemplating the 1869 to 1897 period in columns 2 to 3 of Table 3, an UIP puzzle with a wrongly signed slope coefficient arises. However, columns 2 to 3 cover vastly different conditions in the rupee-to-sterling exchange market. As mentioned in Section iii, the early 1890s were characterised by idiosyncratic events in US monetary history, which had repercussions on silver-backed currencies such as the Indian rupee. Therefore, in columns 4 to 5, the GARCH-M regressions are re-estimated with a sample restricted to the period before October 1888. Like the previous results, the UIP puzzle disappears and the unbiasedness condition can no longer be rejected. Furthermore, the coefficient ϕ 3 from asymmetric currency risk is also significant, which is perhaps not surprising given the ongoing depreciation of the rupee during the period under consideration. Then again, the more or less proportional relationship between Indian interest-rate differences and exchange-rate changes seems to have occurred after France had demonetised silver in 1876. Indeed, whereas the deviations from the UIP condition are large when looking at the years before 1876 in columns 6 and 7, the situation changes when looking at the years thereafter in columns 8 and 9.
The counterpart to the period with an ongoing silver depreciation are the months between October 1888 and August 1897, when the rupee witnessed erratic swings in its exchange rate (see Section iii). Columns 10 to 11 of Table 3 report the corresponding results. Regardless of the specification of the conditional-variance equation, and similar to the results of Table 2, the coefficients in these columns are nowhere near a proportional relationship between interest-rate differences and exchange-rate changes. Taken together, the largest deviations from the UIP condition as regards the return on Indian rupee and silver bonds seem to have arisen during the 1890s. In India, these years were characterised by extraordinary uncertainties as regards the transition from a floating to a fixed exchange-rate regime. Indeed, spotting the abnormal behaviour of exchange and interest rates in his annual data during the 1890s, Fisher (Reference Fisher1930, p. 407) reached the conclusion that
until the par was proved actually stable by two or three years’ experience, the public refused to have confidence that gold and the rupee were once more to run parallel. Their lack of confidence was shown in the difference in the rates of interest in the gold and rupee securities during the transition period, 1893–1898…
VI
By analysing the relationship between yields on Indian sterling (gold) and rupee (silver) bonds and the corresponding rupee-to-sterling exchange rate, this article has provided a comprehensive empirical assessment of the uncovered interest-parity (UIP) condition with floating exchange rates of the nineteenth century. In contrast to a large body of research with modern data, across several time periods and econometric specifications, the historical sterling-to-rupee exchange-rate changes and interest-rate differences tend to be positively correlated. The following points could explain why the UIP condition holds relatively well with nineteenth-century Indian exchange and interest rates:
• Firstly, as mentioned in the seminal work of Irving Fisher, Indian interest and exchange-rate data of the late nineteenth century provide a good environment to study the UIP condition. In particular, Indian sterling and rupee bonds were simultaneously traded in the London financial market, suffered from negligible default risks, and were subject to relatively light-touch financial rules and regulations. Conversely, in most modern studies, there are potentially thorny data issues when the UIP condition is tested with different bonds traded in different financial markets.
• Secondly, a proportional relationship between nineteenth-century Indian interest-rate differences and exchange-rate changes did not always arise. Rather, large deviations from the UIP condition seem to have occurred during the 1890s, and to a smaller extent the early 1870s. These periods were characterised by aggravated levels of uncertainty about the future of the silver-based rupee, caused by the demonetisation of silver and the adoption of fixed exchange rates with respect to gold in France, the United States, and during the 1890s India itself. The view that uncertainty and risk, which differ for example between fixed and floating exchange-rate regimes, could be responsible for UIP deviations concurs with a recent strand of the empirical literature on exchange rates.


