


I
Financial markets across much of Asia are still relatively underdeveloped. For example, the aggregated market capitalisation of company shares is generally still low relative to GDP (e.g. Niblock et al. Reference Niblock, Heng and Sloan2014). Consequently, for most companies in Asia, the mobilisation of external capital still takes the form of bank loans rather than selling shares and bonds in regulated securities markets.Footnote 1
A common perception is that securities markets in Asia will emerge as part of the process of economic growth and institutional development. This perception is supported by two strands of research. In economics, studies confirmed a positive correlation between stock market trade activity and economic growth, also across Asia (e.g. Atje and Jovanovic Reference Atje and Jovanovic1993; Roc Reference Roc and Cao1995; Levine and Zervos Reference Levine and Zervos1998; Beck Reference Beck2003). In finance, studies have indicated that institutions supporting the operations of securities markets, particularly legal systems that protect the interests of minority shareholders through e.g. disclosure requirements, enhance corporate governance practices and maximise the impact of securities markets on the mobilisation of savings for investment (e.g. La Porta et al. Reference La Porta1997, Reference La Porta2000).
Implicit in this perception is that securities markets have long been irrelevant in most Asian countries. The levels of economic development and the rates of economic growth were low for a long time and/or the legal systems insufficiently developed to protect minority shareholders in Asian countries. Consequently, the economic development of many Asian countries was long constrained by imperfect financial markets, particularly securities markets, which prevented budding companies from attracting external finance for ventures that could have advanced economic growth.
This perception largely ignores some earlier research on securities markets in less-developed countries that used 1960s and 1970s data to substantiate the argument that there is a linear relationship between the level of economic development and the existence and activity of securities markets (Wai and Patrick Reference Wai and Patrick1973; Drake Reference Drake1977). In essence, these studies found that the development of securities markets was related to the demand for their services, subject to regulation that enhanced institutional trust of market participants and facilitated market operations.
This view is supported by historical studies that found active stock exchanges in pre-war Asia despite low levels of general economic development, for example in Tokyo and Shanghai (Hamao et al. Reference Hamao, Hoshi, Okazaki, Ito and Rose2009; Horesh Reference Horesh2015). In addition, Hannah (Reference Hannah2015, p. 558) found Indonesia to be third in Asia in ranking of countries by the market capitalisation of their listed companies relative to GDP in 1910: Hong Kong (12.86), Japan (0.56), IndonesiaFootnote 2 (0.44) and India (0.35). The roles of the stock exchanges in Hong Kong, Japan and India are known to financial historians. The position of Indonesia is surprising, because the stock market in colonial Indonesia is generally considered to have been negligible (e.g. De Graaf Reference De Graaf2012, pp. 166–8; De Jong and Legierse Reference De Jong and Legierse2022, p. 226). The general understanding is that the stock exchange did not start to play a significant role in Indonesia's financial system until the 1990s (Kung et al. Reference Kung2010). On the other hand, by 1910 over 2,000 joint-stock firms were active in Indonesia, of which 71 per cent had been established domestically with capital invested by resident shareholders (Van de Water Reference Van de Water2018, pp. 67, 69). These numbers suggest that there may have been a sizeable secondary market for securities in Indonesia at that time.
The purpose of this article is to analyse the early development of the securities market in Indonesia in order to establish how it operated, how significant transactions in this market were, and to what degree it contributed to mobilising capital for investment in the shares and bonds of companies operating in Indonesia. The next section explains the formal arrangements that facilitated the registration of joint-stock companies for limited liability status and operations in Indonesia. Section III discusses the ways these companies raised capital privately or through initial public offerings (IPOs), and how this led to the development of securities trading in Indonesia during 1898–1942. Section IV identifies the securities listed and traded in the stock exchanges of Jakarta and Amsterdam, and Section V analyses the integration of both markets in terms of their trading of securities of companies that operated in Indonesia. Section VI discusses changes in market capitalisation and analyses the degree to which the option of stock market listings contributed to the mobilisation of investment capital in Indonesia's less-developed pre-war economy.
II
Following the bankruptcy of the privately owned Dutch United East Indies Company (Vereenigde Oost-Indische Compagnie) in 1796, the company's territories in Indonesia became a colony of the Netherlands. The Dutch government passed the 1838 Law on Commerce (Wetboek van Koophandel), which regulated both the joint-stock and limited liability nature of firms. Subsequently, Netherlands-registered companies increased activities in colonial Indonesia. In addition, entrepreneurs in Indonesia established their own ventures. They could not incorporate them in person in the Netherlands, so the colonial government in Indonesia passed its 1847 Law on Commerce for the Netherlands Indies (Wetboek van Koophandel voor Nederlandsch-Indië).
The 1847 law regulated a variety of matters (Mahy Reference Mahy2013). These included the registration of a limited liability company (Naamloze Vennootschap in Dutch or Perseroan Terbatas in Indonesian Malay), the use of bills of exchange for payments, and bankruptcy proceedings. In effect, the law protected a registered company against unconscionable behaviour by business partners, customers and/or debtors through the legal system in colonial Indonesia. Creditors could take a registered company to the local court (Raad van Justitie or Dewan Keadilan). If a company was insolvent, the court could order public bankruptcy proceedings.
The 1847 law did not compel owners of commercial ventures to register their undertakings. Many continued trading without registration. However, the advantage of incorporation was that company owners were only liable for the company's actions up to the value of the equity they pledged to invest in the company, as indicated by their shareholdings. As legal entities, registered companies could also raise external finance through formal bank lending or issuing bonds. Registration of a company in Indonesia took the form of a company deed (oprichtingsacte or akta pendirian) including the articles of association (statuut or peraturan), directors and main shareholders, drawn up and recorded by an accredited public notary. The notary then submitted the deed for approval to the Department of Justice. Approval and publication of the main details from the company deed would then be published in the Javasche Courant, the government gazette until 1950.
Public notaries would draw up the articles of association of companies in either the Dutch or Malay language. These identified the purpose of the company and its structure, the nominal value of the shares in the company and the main shareholders. A company would have at least the equivalent of what became known as the management board (raad van bestuur or dewan direksi), comprising the managing director (directeur or pengurus) and other senior managers. The Dutch two-tier board system also provided for a supervisory board (raad van commissarissen or dewan komisaris), generally comprising experienced representatives of the business community tasked with supervising the management board on behalf of the shareholders. The law did not specify the need for boards to submit annual reports to shareholders and organise annual meetings of shareholders, but companies with large numbers of shareholders generally did.
Table 1 shows the increase in the total numbers of registered companies operating in Indonesia. From a modest 133 in 1883, numbers increased steadily to over 3,700 in 1920. Many companies had by then been established for speculative purposes. For example, in mining, entrepreneurs had to have a registered company to apply for and execute exploration permits and mining concessions. At a time of high petroleum prices, the number of such permits boomed during 1896–1912, but most did not result in the establishment of mining concessions and productive ventures (Van der Eng Reference Van der Eng and Badia-Miro2015, pp. 231–2). High rubber prices also inspired a spate of new ventures, until prices decreased in the 1920s. The divestment of unproductive ventures was a key reason for the decrease in numbers during the 1920s. Together with significant deflation in the early 1930s, this contributed to an increase in bankruptcies and company closures (Claver and Lindblad Reference Claver and Lindblad2009, pp. 150, 153).
Table 1. Incorporated joint-stock companies in Indonesia, 1883–1940

a Ethnicity identified on the basis of the names of company and/or directors.
b Residual, mainly companies of Dutch-Indonesian and ethnic Indonesian residents of Indonesia.
Sources: 1883 and 1898 from À Campo (Reference À Campo1995, p. 52) and annual ‘Lijst van naamlooze vennoot-schappen’, appendix to ‘Koloniaal Verslag’ (1883–98); 1910, 1920, 1930 and 1940 Van der Eng (Reference Van der Eng2022), based on the Handboek database.
Table 1 indicates that companies were not just Netherlands-incorporated and Dutch-Indonesian firms, but also Chinese-Indonesian firms, Middle Eastern-Indonesian firms and firms operated by other residents of Indonesia. Ethnicity can only be inferred from the names of companies and the names of their directors, because there was no legal requirement to register the ethnicity of owners. Most firms were privately owned and their shares were closely held, because a minority of firms listed their shares for public trading.
III
Early securities trade 1814–98
After 1814, when the British colonial government in Java ended and Dutch colonial government resumed, Indonesia's foreign trade increased, largely conducted by trading companies and auxiliary firms, such as mercantile insurance companies, located in Jakarta, or Batavia as it was then called.Footnote 3 As a consequence, a market for trade-related paper, particularly discounted bills of exchange, emerged in Jakarta (Van den Bergh Reference Van den Bergh1895). A year later, merchant companies established their Trading Society ‘The Association’ (Handels-societeit ‘De Vereeniging’), which in 1818 acquired its own building in the business district along the Kali Besar in Jakarta. The association hosted the market for trade-related securities in its building, known as the Exchange (Beurs or Bursa).
Although use of the association's building for such trading purposes decreased, and the building had fallen into disuse by 1862, securities trading continued in Jakarta.Footnote 4 In the early 1870s, the opportunities to buy securities were constrained by limited supply, but in subsequent decades the trade increased.Footnote 5 Growth was initially sustained by the expansion of private enterprise incorporated in Indonesia, later also by the shares of Netherlands-incorporated companies which investors imported into Indonesia via their brokers and banks. In 1877 the shares of 35 companies were traded in Jakarta; in 1887 the number rose to 64 and in 1897, to 136.Footnote 6 By 1904 there were 26 brokers and commission agents specialising in securities trading in Indonesia, mostly in Jakarta (Adresboek 1904, vol. 2, pp. 1–11; Adresboek 1918, pp. 1276 and 1288); in 1918 the number rose to 87.Footnote 7
The largest of the specialised securities (effecten) brokers, such as Effectenkantoor Dunlop en Kolff (since 1879) and Effectenkantoor Gijselman en Steuр (since 1889), accrued a clientele of buyers and sellers of securities. They issued regular share catalogues that shareholders and potential share buyers perused before deciding to mail in expressions of interest to sell or buy. The broker then arranged the transaction and the exchange of documents at a fee. The agreed price, together with share quotations in the Netherlands from mailed Dutch newspapers, informed the next issue of a broker's catalogue.
Most broking firms in Indonesia were small ventures that combined several business services, for example securities broking with insurance agency and/or accounting services. Several also operated as an ‘administration office’ (administratiekantoor), such as Administratiekantoor Tiedeman en Van Kerchem (1854–1957), the Jakarta branch of an Amsterdam-registered company. The moniker disguises the fact that such ventures had developed in the Netherlands since the late seventeenth century as significant financial intermediaries, also known as ‘trust offices’ (De Jong et al. Reference De Jong2021). There were many such administration/trust offices in Indonesia, mostly for the administration and/or supervision of the management of local ventures of Netherlands-incorporated companies on behalf of their company directors overseas, such as the growing number of privately owned agricultural estates after the 1870s. Gradually, the largest of these enterprises offered multiple business services, including securities broking.
By the 1890s, the securities broking business in Indonesia was still small compared to the Netherlands, where the largest of firms operating in Indonesia incorporated themselves and listed their shares on the stock exchanges of Amsterdam, Rotterdam and The Hague. One reason was that the Netherlands had deep and sophisticated securities markets (Geljon Reference Geljon2005, chapter 4). In addition, there were no limitations on the operations of Dutch-incorporated firms in Indonesia. The depth of the market was relevant, because that made it more likely that the shares ‘emitted’ would actually be subscribed and capital paid up, and that investors could expect the shares and bonds they acquired to be liquid assets that they could trade almost instantaneously in the existing securities markets. The sophistication of the securities market in the Netherlands was important, because it included an established IPO or ‘emissions’ business (emissiebedrijf). This involved companies that arranged the incorporation of firms at public notaries, the underwriting of the IPOs of shares, the sale of shares and bonds, and the registration of security ownership. There were also administration/trust offices that parcelled large-denomination shares into share certificates with smaller denominations for retailing to small investors.
Such capital market services also emerged in Indonesia, as owners incorporated more of their ventures, but on a more modest scale. The largest of the broking firms and administration/trust offices also engaged in the local IPOs, in some cases in cooperation with local banks. The Jakarta-incorporated Nederlandsch Indische Escompto Maatschappij (later known as the Escomptobank), in particular, effectively underwrote several IPOs. One reason for local IPOs was that the Amsterdam exchange required firms to have a minimum capital of ƒ500,000.Footnote 8 Smaller firms in Indonesia seeking IPOs and share market listing could only have their shares traded informally in the Netherlands or formally in Indonesia.
Institutionalised securities trade 1898–1940
During the 1890s, investors incorporated increasing numbers of mining companies in Indonesia and a speculative trade in the shares of these companies emerged, fuelled by rumours about mineral deposits in mining concessions. Some unscrupulous commodity brokers were active in this trade. Specialised securities brokers became concerned about the reputation of their business and agreed on the need for regulation in order to improve transparency in the securities trading business (Bataviaasch Nieuwsblad, 9 March 1923). In 1898 they established the Association for Securities Trade in the Netherlands Indies (Vereeniging voor den Effectenhandel in Nederlandsch-Indië, VEH) in Jakarta. The VEH adopted a regulation for the securities trade, which was modelled on those of the brokers associations in Amsterdam and Rotterdam (De Locomotief, 20 February 1899). A condition of VEH membership was that transactions had to be settled during association meetings and that agreed prices would be recorded and reported.
The VEH mailed out near-daily summaries of the latest share prices agreed in transactions, which were often published in newspapers in Indonesia. The VEH also published an annotated share price catalogue, together with a guide that in 1901 contained the details of 156 companies, as well as a bi-weekly journal with the latest prices of traded securities, information on companies from annual reports, trends in industries and financial and commodity markets (De Locomotief, 5 February 1910).Footnote 9 Salient aspects of these communications were summarised in newspapers and magazines issued throughout Indonesia.
The fact that several company securities were dual listed in Amsterdam and Jakarta created opportunities for arbitrage, but also for speculation through futures trading (termijnhandel) of securities. Already in 1901 there were public calls for the VEH to end this speculation-based futures trading (De Locomotief, 21 January 1902). This issue came to a head during 1906 and early 1907 (De Locomotief, 13 August 1907; De Bree Reference De Bree1916, pp. 445–52). Some owners of mining companies acquired shares of their own companies, driving up share prices, while spreading rumours about new mineral deposits in the mining concessions of their companies. Investors in Jakarta could exercise caution by making immediate enquiries, but investors in Amsterdam only had telegraphed reports of increasing share prices in Jakarta to go on until the mail with newspapers from Jakarta reached Amsterdam a month later. The result was significant, but non-synchronous fluctuations in the share prices of mining companies in Jakarta and Amsterdam. These were exacerbated by the time it took for international payments to take place and for share certificates to be shipped either way. The situation allowed speculators to pocket capital gains in futures trading with mining shares, even though some of the mining ventures were near-insolvent due to mineral depletions. To avoid this happening again, the trading banks in Jakarta established a Liquidation Association (Liquidatie Vereeniging) in 1907. It aimed to achieve immediate liquidation of insolvent mining companies in order to minimise the potentially harmful consequences of speculative futures trading for the securities trade.
This precedent indicated that the securities trade in Jakarta required regulation that not only guided the activities of brokers, but also advocated the interests of buyers and sellers. To that end, the Batavia Trading Association (Handelsvereeniging te Batavia, HVB) – the successor of the 1815 trading society – regulated the securities trade in Jakarta in October 1907. It did so in the interest of its members, many of whom were buyers and sellers of securities. For that purpose, the HVB established a branch organisation, the Batavia Securities Association (De Bataviasche Effectenvereeniging, BEV). It also established formal rules for the operation of a stock exchange (effectenbeurs) to which all brokers registered with the BEV, including VEH members, had to adhere. The HVB opened its building along Kali Besar West in Jakarta for twice daily sessions, referred to as ‘calls’. During each ‘call’, brokers worked through a list of listed securities, one by one calling for offers and takers.
The exchange rules did not prohibit futures trading with securities, but facilitated a substitute arrangement, i.e. loan stocks (prolongatielening) or short-term mortgage lending using securities as collateral, possibly with the option of purchase by the creditor on expiry. The rules stated that the exchange would record futures transactions, particularly the agreed interest rate, if they had been registered at the newly established Office for Securities Giro (Kantoor voor Effectengiro) at the Java Bank, Indonesia's central bank (Bataviaasch Nieuwsblad, 2 October 1907; Indische Mercuur, 28 July 1908). In cooperation with the HVB, the bank had created this office in response to the futures scandal earlier in the year. Its registration requirements were such that the transactions with securities futures took the form of loan stocks administered by the giro office, including loan stocks transactions with creditors in the Netherlands.
The Jakarta exchange was in terms of organisation and regulation independent of all stock exchanges in the Netherlands. Nevertheless, the 1906–7 futures episode demonstrates that brokers and their association kept abreast of trends in the trade of securities of companies, in particular the Amsterdam exchange, specifically of companies operating in Indonesia. Similarly, their counterparts in the Netherlands followed trends in the securities market in Jakarta. The weekly De Indische Mercuur (1878–1940), published in Amsterdam, was of direct assistance to them. It initially analysed market conditions for traders of Indonesian commodities and summarised company reports, and from 1904 it also published communications about securities trading in Indonesia.
A next step in the institutionalisation of securities trading was the absorption of the BEV into the VEH in 1912. This took the form of an agreement that only members of the VEH would trade securities under HVB supervision. That year, the HVB officially registered the rules under which it had been operating the stock exchange since 1907 (Nieuws van den Dag voor Nederlandsch-Indië, 3 May 1910; HVB 1914). Most rules defined the processes by which securities were traded, transactions concluded, and transaction outcomes recorded and communicated. The rules also specified that firms wishing to have their securities traded at the exchange had to have a minimum share capital of ƒ150,000, submit their financial and general reports annually, and pay an annual fee of ƒ100 to ƒ600, depending on their capital. Brokers would be allowed to trade securities of a non-listed firm at the exchange, provided two or more of them asked for permission and submitted the articles of association and last annual financial and general report of the company.
The HVB also assumed the reporting tasks of the VEH, such as mailing out daily overviews of share transactions, and the regular publication of a share catalogue and a journal that analysed annual reports, board mutations, industry and market trends etc.Footnote 10 As with previous VEH publications, these HVB communications about the securities exchange were summarised, discussed or republished in newspapers and magazines in Indonesia, such as Sin Po, a newspaper published in both Malay and Chinese.
Consequently, by 1912 Indonesia had an officially recognised, but self-regulated stock exchange in Jakarta, which would operate on a daily basis for the next 30 years.Footnote 11 The rules under which it operated and the publications which its owners issued aimed to maximise transparency for investors and brokers. These publications provided regular updates on securities trading, the market conditions in which companies operated, and the annual reports and plans of companies. A change was that the HVB and VEH in 1928 also allowed three main trading banks in Indonesia, the Nederlandsche Handel Maatschappij, the Nederlandsch-Indische Handelsbank and the Escompto Maatschappij, to trade securities on the Jakarta exchange.
The development of securities trading in Jakarta echoed in other cities in Indonesia, where commodity brokers also traded securities: Bandung, Banjarmasin, Cilacap, Cirebon, Makassar, Malang, Medan, Manado, Padang, Palembang, Semarang and Surabaya. In a few cities, these brokers formed local associations that established relations with local commercial associations (handelsvereenigingen) to advance their security trading services. Only in the commercial cities Semarang and Surabaya did this lead to the establishment in 1925 of self-regulated stock exchanges that, like in Jakarta, operated in the venues of the local commercial associations.
There are no data, such as share registries, which allow a typification of the buyers and sellers of securities in Indonesia who used the broker services. Nor are there indications of the turnover on shares traded in the exchanges in Indonesia, except qualitative near-daily reports in newspapers summarising exchange activity as ‘dull’ or ‘busy’. The securities that companies listed at the Jakarta exchange increased quickly from 160 in 1910, to 221 in 1912 and 272 in 1914 (Table 2, HVB Verslag 1912, pp. 58–65; HVB 1914, Appendix J). This suggests a growing local appetite for investment in securities.
Table 2. Securities of companies and governments in Indonesia traded at the Amsterdam and Jakarta stock exchanges, 1910, 1929 and 1938

a Preference shares, share certificates or profit shares without voting rights, etc.
Sources: Listed and traded securities identified for 1910 on the basis of monthly quotes in Jakarta in De Indische Mercuur and in Amsterdam in Jaaroverzichten van den Handel in Koloniale Producten (1910); 1929 based on monthly quotes in De Indische Mercuur; 1938 Jakarta from monthly quotes in HVB (1938) and annual quotes of company shares in Amsterdam in a database shared by Abe de Jong (Monash University); 1938 bonds from De Nederlandsche Financier (22 May 1939).
Some other developments underline this impression. Firstly, in 1911, the Jakarta exchange started hosting the trading of a growing number of bonds of companies and central, provincial, regional and city governments (De Graaf Reference De Graaf2012, pp. 166–8). Secondly, in 1912 the Escompto Maatschappij spawned a subsidiary, the Nederlandsch-Indische Effecten- en Prolongatiebank, which specialised in loan stocks (De Bree Reference De Bree1918, pp. 443–8). The bank absorbed this subsidiary in 1921 and continued its activities. Thirdly, from the mid 1920s, the Jakarta exchange hosted the trade of shares of an increasing number of large American companies such as Cities Services, General Motors and Montgomery Ward (Algemeen Handelsblad, 30 August 1938; HVB 1939).Footnote 12 This indicates that the demand for securities exceeded the supply of the securities of local companies and companies listed in the Netherlands.
Indonesia's GDP per capita was still low, but by the 1920s and 1930s the country had a growing number of resident middle- and high-income earners who were potential investors in securities (Leigh and Van der Eng Reference Leigh and Van der Eng2009). For example, probates of deceased estates for inheritance tax in Indonesia reveal that on average during 1930–9, 37 per cent of the assets of the deceased were securities, of which the majority were Indonesian company shares (52 per cent) and Indonesian bonds (24 per cent).Footnote 13 This indicates that high-income earners in Indonesia were exceedingly inclined to invest their savings in securities. It is not unlikely that middle-income earners did the same.Footnote 14
In addition, there were a growing number of institutional investors, such as a range of insurance companies and savings banks (Adresboek 1918, pp. 1268–9 and 1304–5; De Bree Reference De Bree1918, pp. 467–577). Of particular significance was the growing number of company pension funds, particularly during the 1920s–30s. Especially the funds associated with large companies accumulated contributions to offer pension schemes to their employees, regardless of ethnicity (De Telegraaf, 4 June 1938; Ingleson Reference Ingleson2014, pp. 66, 81, 155–6; Wit et al. Reference Wit1961, pp. 73–4). Together, these institutions contributed to the accumulation of funds available for investment.Footnote 15 Communications between these institutional investors and their brokers improved as well, as the expansion of the telegraph and later telephone network reduced their reliance on the mail service and facilitated almost instantaneous interactions between the main cities in Indonesia.
The fallout of the 1929 international crisis forced many companies out of business, as Table 1 indicates, and/or to delist their shares. Many companies stopped paying dividends and restructured operations, which may have discouraged investors. Significant deflation in the early 1930s also forced many companies and governments to redeem bonds as quickly as possible and delist them. On the other hand, investors may have dumped many securities that were snapped up by other investors at a discount, thus increasing trading activity on the exchanges. Either way, the 1930s solidified the role of the securities market in Indonesia as a relatively mature, though still modestly proportioned secondary market: brokers traded shares, bonds and to a degree derivatives on behalf of customers, self-regulation included rules on disclosure and dissemination, the market was cointegrated with a much larger securities market in Europe but remained independently organised, and it was active despite being situated in a still shallow national capital market.
In May 1940, the German occupation of the Netherlands drew Indonesia into World War II. To support the Netherlands, the colonial government mustered all resources located in Indonesia. This included a prohibition on the possession of foreign exchange and all other assets in Indonesia that could be used for foreign payments, including gold, overseas bank deposits and securities (Van Horn et al. Reference VAN HORN2000, pp. 24–7, 86–9). Ownership of all domestic and foreign company shares and debenture certificates had to be registered; certificates had to be deposited and were eventually transferred to the vault of the Java Bank in Bandung. Transfers of ownership became subject to permits issued by the Netherlands Indies Foreign Exchange Institute (Nederlandsch-Indisch Deviezeninstituut, NIDI) supervised by the Java Bank. Only the Jakarta and Surabaya exchanges reopened in December 1940 to a marginal trade of what were effectively changes in the ownership registration of securities. After the occupation of Java, the Japanese authorities closed the Jakarta exchange (Bataviaasch Nieuwsblad, 3 March 1942). They seized and liquidated many assets in Indonesia, but left the stored security certificates largely untouched.
Following the Japanese surrender in August 1945 and the return of the colonial government to Indonesia after September 1945, NIDI resumed its role in Jakarta and took control of the securities certificates recovered in Bandung, before returning them to their owners. The Jakarta stock exchange reopened in 1952 under government regulation, but trading remained marginal and was largely restricted to Indonesian government bonds.Footnote 16 Trading decreased further after all assets of Netherlands-registered companies operating in Indonesia had been nationalised in 1958. In the 1960s the Jakarta exchange was moribund (Canberra Times, 17 March 1971). It was reactivated in 1977, but remained of marginal significance until the 1990s (Kung et al. Reference Kung2010).
In Amsterdam, the securities of companies with assets in Indonesia continued to be traded in the 1940s and 1950s. Most of these companies delisted after 1958 when it became clear that they would not retrieve their assets in Indonesia. Others diversified their activities towards the Netherlands or other countries (Nieuwsblad van het Noorden, 21 February 1959; De Volkskrant, 23 December 1959).
IV
To analyse changes in securities trading and market capitalisation in Indonesia, and to compare these with other countries, this section discusses the degree to which the shares of companies operating in Indonesia were listed and traded on either the Jakarta or Amsterdam exchanges during three benchmark years: 1910 in order to test the Hannah (Reference Hannah2015) estimate of market capitalisation; 1929 as the last year before the crisis caused a spate of bankruptcies and delistings; and 1938 as the last year before World War II.
Table 2 identifies the number of securities listed on the two exchanges of companies active in Indonesia. The total number increased significantly from 1910 to 1929 by 77 per cent, higher than the 38 per cent increase from 1910 to 1930 in the total number of companies in Indonesia in Table 1. Including the dual listings, around 45 to 50 per cent of securities were listed in Jakarta, which indicates that half the listed companies perceived that there was a sufficient demand for their securities to cover the cost of listing on the Jakarta exchange.
Some of the larger companies listed more than one of the securities identified in Table 2, i.e. ordinary shares, preference shares, share certificates and bonds. Most of the smaller companies only listed ordinary shares, and, in the course of the 1920s also bonds. The number of listed government bonds also increased significantly between 1910 and 1929, when the central government and public authorities at all levels in Indonesia increasingly sold bonds to cover current expenditure. The total number of securities decreased significantly by 32 per cent from 1929 to 1938, which is faster than the 24 per cent decrease in the number of companies between 1930 and 1940 in Table 1. This was essentially because the total number of listed bonds decreased by 54 per cent, while the total number of shares decreased by 23 per cent. Essentially, deflation during the early 1930s increased the cost of fixed bond interest payments. Companies and governments therefore tried to redeem bonds where possible and avoid issuing new bonds.
Table 3 shows the main companies by market capitalisation. Clearly, the largest 15 companies that listed equity in Amsterdam or maintained dual listings were bigger than the largest 15 companies that only listed in Jakarta. Excluding the ‘Royal Dutch’, the average size of the first group of companies exceeded the second group by a factor of 30. This is in part related to the capital-intensive nature of companies in the first group, particularly in the oil, shipping and railway industries. It also relates to the scale of operations, because the rubber and tobacco companies in the first group operated estates in underpopulated Sumatra that were much bigger than the estates that tea companies in the second group operated in the uplands of Java. But the essential reason for the difference in size between both groups relates to the greater depth and sophistication of the Amsterdam market, compared to Jakarta, as well as the higher minimum capital required for listing at the Amsterdam exchange, as noted above.
Table 3. Thirty companies operating in Indonesia by market capitalisation in 1929

Note: ƒ1 = c. US$0.40
Sources: See Table 2.
Many companies that listed in Jakarta were relatively small agricultural estates, as well as urban electricity and gas utilities, and companies in coastal shipping, port logistics and tramways. They either did not meet the cut-off for listing in Amsterdam, or their shares had been traded in Jakarta since the 1870s and their securities were well established and trusted among investors in Indonesia.
Table 3 shows that by far the largest of all firms was the ‘Royal Dutch’ oil mining and refining company, better known as Shell. The company had its origins in Indonesia and grew quickly to become the world's largest oil producer in the 1920s. By 1929 it had assets around the world, no longer only in Indonesia, while all other large companies in Table 3 operated almost exclusively in Indonesia.
Table 4 uses the annual average quoted price-to-book ratios, multiplied by their authorised capital to estimate aggregated market capitalisation of listed companies operating in Indonesia. Authorised capital takes no account of the degree to which capital has actually been subscribed and paid-up by shareholders, nor does it take account of the fact that companies also accumulate capital through reinvested earnings and borrowing. However, listings of newly registered firms operating in pre-war Indonesia indicate that most authorised capital was actually subscribed and paid-up.Footnote 17 Company borrowing was limited, as it tended to take the form of bank overdrafts rather than loans for investment in capital goods. Reinvested earnings were therefore a major part of capital formation. It can be assumed that a company's increasing assets benefited its ability to generate excess earnings and pay out dividends, and therefore increased the share price of a company.
Table 4. Market capitalisation of companies in Indonesia, 1910, 1929 and 1938

Notes: ƒ1 = c. US$0.40. 1929 and 1938 exclude the KNMEP ‘Royal Dutch’ company (see main text). Average size defined as total market capitalisation divided by number of listed shares in Table 2.
Sources: Calculated with annual average price-to-book quotes of the shares of companies underlying Table 2, for 1910 from the monthly highest and lowest quotes for Jakarta in De Indische Mercuur and Amsterdam in Jaaroverzichten van den Handel in Koloniale Producten (1910); for 1929 from the monthly highest and lowest quotes for Jakarta and Amsterdam in De Indische Mercuur; for 1938 the from monthly highest and lowest quotes for Jakarta in HVB (1938) and the annual highest and lowest quotes in Amsterdam from a database shared by Abe de Jong (Monash University); authorised capital from Handboek database, augmented with ‘Lijst van Naamlooze Vennootschappen’, annual appendix to ‘Koloniaal Verslag’ (1883–1929); GDP from Van der Eng (Reference Van der Eng2019).
Table 4 confirms that by market capitalisation, the Amsterdam exchange was by far the bigger market for the equity of companies in Indonesia. In the absence of data on turnover, it is not known to what degree the shares of dual-listed companies were traded in Amsterdam or Jakarta. If that was in the same proportions as the market capitalisation of single-exchange listed companies, then Indonesia-financed market capitalisation may have changed from a ratio of 0.09 to Indonesia's GDP in 1910 to 0.07 in 1920 and 0.16 in 1938, leaving ratios of Netherlands-financed market capitalisation to Indonesia's GDP of 0.34 in 1910, 0.59 in 1920 and 0.87 in 1938.Footnote 18 Table 4 also confirms that the average size of firms listed in Amsterdam exceeds that in Jakarta by a factor of 4 in 1910, 8 in 1929 and 5 in 1938.
V
Section III indicated that securities markets in Indonesia and the Netherlands were integrated, but did not specify the degree to which that was the case. Integration is generally established on the basis of the co-movement of stock market indicators over time or the comparability of asset prices across markets (e.g. Korajczyk Reference Korajczyk1996). Figure 1 demonstrates a high degree of integration for 1910, 1929 and 1938. The few outliers are essentially caused by the fact that some shares were traded more in the first half of the year and less in the second half in Jakarta or Amsterdam, or vice versa. Company reports and announcements of dividend payments were generally issued in the middle of the year. This could skew the annual average share quotation in one or the other market.

Figure 1. Price-to-book ratios of company shares traded at both the Amsterdam and Jakarta stock exchanges, 1910, 1929 and 1938 (annual averages, par = 100)
Sources: See Table 2.
Market integration was facilitated by the fact that the monetary policies of the Java Bank in Indonesia kept the exchange rates of the Indonesian guilder and the Dutch guilder at par. But a major reason was that communications between Indonesia and the Netherlands diversified away from dependence on the mail service by ship towards increasing use of the telegraph. Telegraph connections between the Netherlands and Indonesia existed since 1871, but it took several decades for this long-distance, near-instant communication to become affordable and applicable to commercial transactions. Increasingly cost-effective telegraph connections impacted on the operations of Netherlands-registered banks in Indonesia (Mooij Reference Mooij and De Graaf2002). It is likely that this effect also applies to the securities trade in and between both countries.
From 1919, monthly stock market indices were available for the prices of company shares quoted on the Amsterdam exchange. They differentiate different categories of companies, including companies operating in Indonesia. The Netherlands Central Bureau of Statistics (CBS) calculated them. Initially, its ‘Indies securities’ (Indische fondsen) index was based on the share prices of just 25 companies operating in Indonesia, and disaggregated to seven sub-indices: sugar, rubber, tobacco, tea, banking and credit, trade, rail and tramways companies (De Bosch Kemper Reference De Bosch Kemper1925). The CBS changed its methodology a few times, which affected the basket of companies and the base years.
The CBS selection of companies was criticised for not adequately reflecting the nature of companies operating in Indonesia (Van Schilfgaarde Reference Van Schilfgaarde1926). For example, ‘banks’ included companies that were effectively managers of multiple agricultural estates, rather than financial companies. The Central Office of Statistics (CKS) in Indonesia therefore used its own methodology, based on the share prices of 38 companies, aggregated into one general index and nine sub-indices: rubber, sugar, tea, tobacco, estate banks, banks, trading firms, railways and shipping companies. However, the shares of all these companies were not all traded frequently enough on the Jakarta exchange to reach a representative price every month. The CKS therefore used securities quotes in Amsterdam to aggregate these data into indices. Based on Figure 1, this was not an unreasonable course of action.
Figure 2 shows the available stock market indices. The monthly CBS and CKS indices indicate that both methods of aggregating the share prices in Amsterdam yielded comparable results. For 1901–29, Figure 1 also includes an annual unweighted index of the share prices of a larger number of companies operating in Indonesia with shares traded at the Amsterdam exchange. They numbered 19 in 1910 and 60 in 1929. This index deviates to some extent from the CBS and CKS indices, because it includes many smaller companies; nevertheless it fluctuates in a comparable way in overlapping years.

Figure 2. Market indices of the shares of companies operating in Indonesia, 1901–40 (1929=100)
Notes: Based on quotations of the price-to-book ratios at the Amsterdam exchange. The Fliers index series is an unweighted average of all companies operating in Indonesia, using the highest and lowest quotes each year. The CBS subseries with different base years are spliced in overlapping years, using 1929 as reference year. The CBS subseries and the CKS series are based on different baskets of companies, with unknown weights.
Sources: 1901–29 annual index calculated by Philip Fliers (Queens University Belfast); 1918–61 CBS indices (with 1920–4, 1921–5, 1930, 1938 base years) Maandschrift van het Centraal Bureau voor de Statistiek (1925–42); 1924–40 CKS index (with 1928 base year) 1924–37 MCKS 88 (1931) and MCKS 146 (1938), 1938–40 Indisch Verslag (1938–40).
A striking feature of Figure 2 is the volatility of average share prices of companies operating in Indonesia during 1914–40. In part this is a consequence of the time span, which includes major changes in international business, particularly during the war years of 1914–18, which benefited Indonesia's economy, and during the global crisis of 1929–36, which affected the Indonesian economy badly. An important reason is the fact that Indonesia's exports were dominated by primary commodities, which during the time span in Figure 1 were subject to volatile international markets. As most listed companies in Indonesia produced for export and depended on these markets, fluctuations in the annualised stock market index are highly correlated with Indonesia's index of export prices during 1901–40, although during the late 1920s the dividend policies of companies are likely to have moderated this correlation.Footnote 19
VI
This section analyses the significance of the fact that companies operating in Indonesia listed their securities on the stock exchanges in Jakarta and Amsterdam for public trading. It starts by expressing the market value of shares as a ratio of GDP in order to take account of price changes over time due to general inflation, and to indicate an order of magnitude that can be compared with other countries and with Indonesia in recent decades. The downside of doing this is that movements in the ratio are not only caused by changes in the nominator (market capitalisation) but also the denominator (GDP). In addition, for the purpose of analysis, this article extends the time scope on the basis of data on the aggregated nominal value of authorised share capital of all companies operating in Indonesia for benchmark years.
Figure 3 shows the outcomes of interpolation and extrapolation of the market capitalisation ratios in Table 4 with the spliced stock market indices shown in Figure 2. Comparing the total value of nominal authorised capital with total market capitalisation for 1910 (Table 4 and Handboek database) and for 1929 (Table 4) with 1926 and 1930 (Handboek database) suggests that the first is a proxy for the second. On that basis, the increase in the ratio of nominal authorised capital and GDP confirms the narrative in Section III. From 1883 to 1898 there was a significant increase in the capital of companies, reflective of the increasing degree to which entrepreneurs developed activities in Indonesia and had the shares of their companies traded on the Amsterdam stock exchange and the still unregulated securities market in Jakarta.

Figure 3. Ratios of company capitalisation and GDP, 1883–1940
Sources: 1883, 1898, 1913 nominal capital of all incorporated companies from À Campo (Reference À Campo1995, p. 52); 1910, 1915, 1920, 1925, 1926 and 1930 nominal capital of all incorporated companies, Handboek database; 1910, 1929, 1938 market capitalisation of stock market listed firms, see Table 2; Fliers and CBS stock market indices from Figure 2 are used for interpolations and extrapolations; GDP from Van der Eng (Reference Van der Eng2019).
In addition, Figure 3 also reveals significant fluctuations in market capitalisation relative to GDP, reflective of changes of commodity prices in international markets. These not only impacted on share prices through dividends paid or withheld, but also on GDP as it was still highly dependent on agricultural production. The ratio peaked in 1913, but showed a significant trough in 1922 when share prices decreased faster than GDP since 1920 in relation to the oversupply of rubber in global markets. The ratio recovered in the late 1920s, but declined again following the international crisis after 1929 when prices of Indonesia's export commodities decreased faster than its nominal GDP. The increase in 1936–7 and the subsequent decline since August 1937 were related to international investor confidence and concerns spilling over to the Amsterdam and Jakarta exchanges (Bataviaasch Nieuwsblad, 13 October 1937).
The low level of market capitalisation after World War II is largely a reflection of Indonesia's monetary policies. The official exchange rate of Indonesia's guilder/rupiah was significantly overvalued relative to the US dollar and underestimated the purchasing power of the guilder/rupiah in Indonesia. Using the black market exchange rate as a better indicator of the purchasing power of the rupiah in Indonesia, Figure 3 indicates a significantly higher ratio. However, the corrected ratio for 1948 is still only about half the level of 1938, and the correction is not sufficient to compensate for the significant decrease during 1948–52 and the low ratio during the rest of the 1950s. In other words, Figures 2 and 3 indicate that securities buyers in Amsterdam did not regain trust in the recovery of dividends payed by Netherlands-registered companies in Indonesia for reasons discussed in Section III.
Table 5 confirms the estimate of 0.44 by Hannah (Reference Hannah2015) for 1910; the difference is explained by Hannah's correction of the 0.25 ratio of the nominal value of these shares to GDP with a market to par (i.e. price-to-book) ratio of 1.75 that applied to all companies listed on the Amsterdam exchange, not just the companies operating in Indonesia. Based on the data underlying Table 4, these ratios are actually 0.23 and 1.84.
Table 5. Comparison of market capitalisation ratios in Asia, 1910–38

a 1916, refers to Straits Settlements and the Malay states together, estimated on the assumption that average authorised capital of 223 locally registered companies in the Straits Settlements was the same as that of 374 foreign-registered companies.
b 1913.
c locally registered companies only.
– = not in the source.
Sources: Table 2 and main text; Hannah (Reference Hannah2015, p. 558, online appendix 2); Rajan and Zingales (Reference Rajan and Zingales2003, p. 15); GDP Malaya from Shah (Reference Shah2017, appendix 2); GDP Singapore from Sugimoto (Reference Sugimoto2011, p. 141).
Table 5 shows that the estimates in this article are lower than those of Rajan and Zingales (Reference Rajan and Zingales2003) and Hannah (Reference Hannah2015) for Japan. The reason remains speculation at this stage, but a casual interpretation is that this is related to differences in the average types of companies that operated in both countries since 1910. In Indonesia, they were to a greater extent active in resource-intensive export-oriented industries such as agriculture and mining. While in Japan a greater proportion of companies was active in capital-intensive manufacturing companies, for example in the export-oriented textile industry. The estimate for Malaya for 1916 is comparable to Indonesia in 1910, given that Malaya experienced a rubber boom that increased its 1916 nominal GDP by 57 per cent compared to 1910. The estimates in this article for Indonesia and Hannah's estimates for India are significantly higher than those of Rajan and Zingales (Reference Rajan and Zingales2003) for India. The reason is that the latter only counted listed companies in India, and ignored the operations in India of companies incorporated and listed elsewhere, particularly in the UK.
Another possible comparison of the market capitalisation in Figure 4 is with Indonesia since the re-establishment of the Jakarta stock exchange in 1977.Footnote 20 As a ratio of GDP, market capitalisation at the exchange remained less than 0.01 until 1990, before it increased to an average of 0.22 during 1990–9, 0.25 during 2000–9 and 0.45 during 2010–19, with the securities of just over 500 companies on average listed at the exchange during 2010–19.Footnote 21 This compares to an average ratio in Figure 4 of 0.55 during 1901–41, with an average of just less than 500 securities listed at the exchanges in Jakarta and Amsterdam during 1910–38. Of course, Indonesia's real GDP per capita was about 8 to 10 times higher during the 2010s than during 1900–40. However, relative to the total number of registered joint-stock companies, the role of listed joint-stock companies was clearly much more prominent during 1901–40 than during 2010–19.
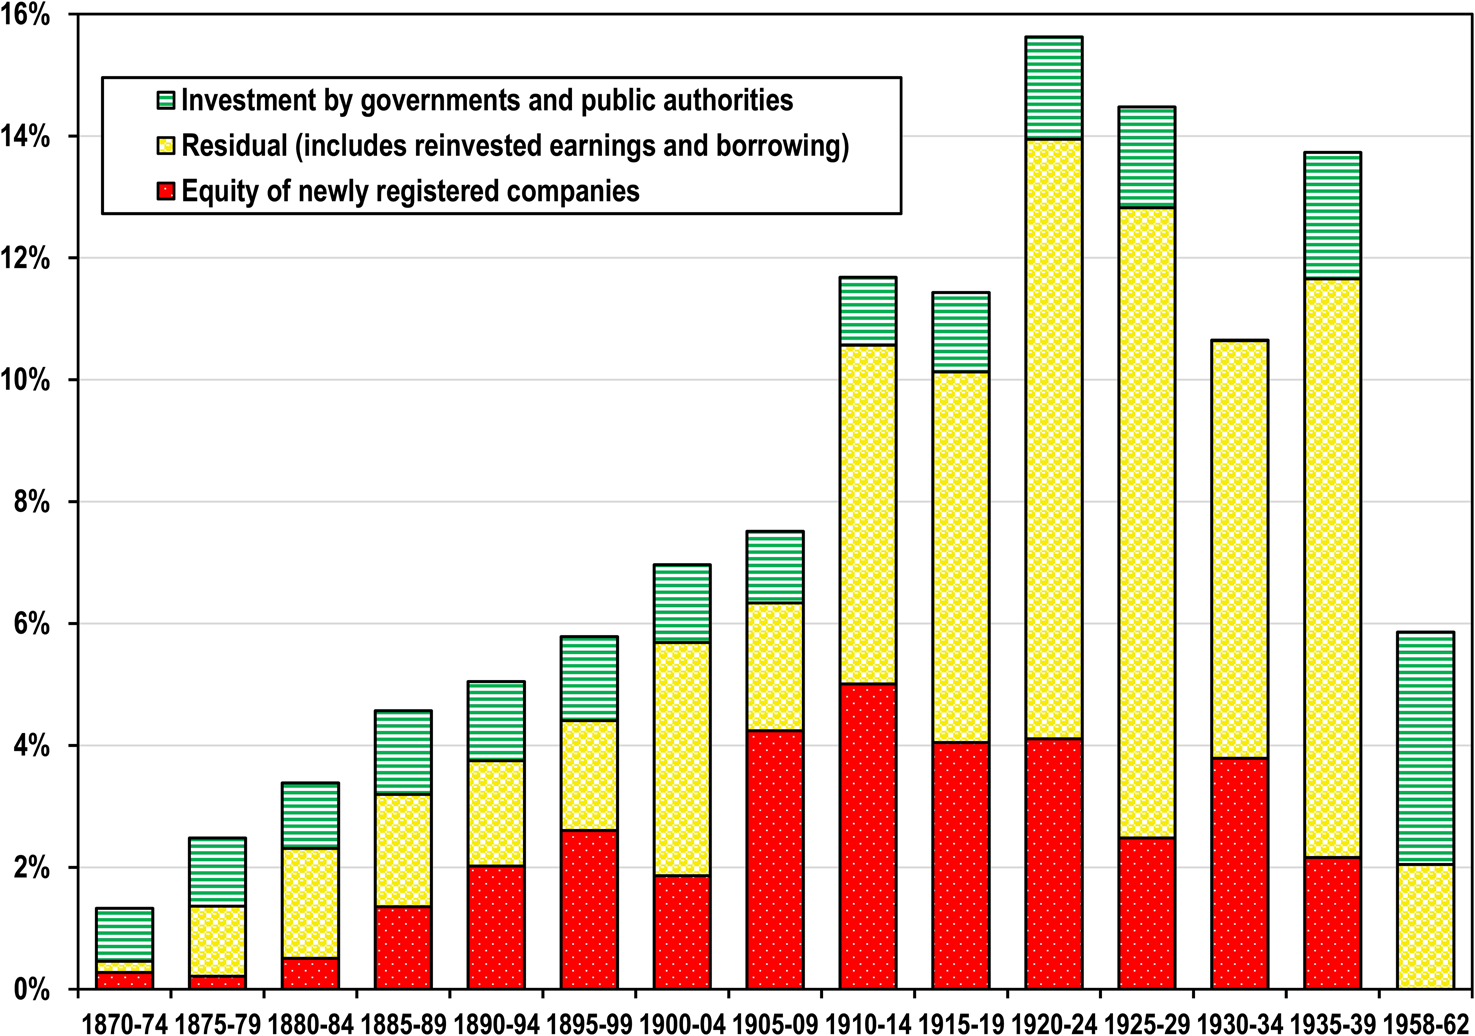
Figure 4. Share of capital formation in GDP, 1870–1962 (percentages)
Notes: Five-year annual averages, based on data in current prices.
Sources: Equity estimated as authorised share capital of newly registered companies from Handboek database; total, government and public authorities gross fixed capital formation and GDP from Van der Eng (Reference Van der Eng2019).
It is necessary to ask whether there was a fundamental difference between the trade of Indonesian securities during 1901–40 and since 1977. Three key differences appear to be that (a) many companies operating in Indonesia during 1901–40 were listed overseas in Amsterdam or dual listed, (b) investors acquired the shares of these companies in both Amsterdam and Jakarta, and (c) the exchange was self-regulated during 1901–40.
The first is not a fundamental difference. Many foreign-owned companies listed on foreign stock exchanges now operate in Indonesia, generally through subsidiaries incorporated in Indonesia, several of which are listed on the IDX. In addition, a growing number of Indonesian companies are dual listed in Indonesia and overseas.Footnote 22 The second difference is also not fundamental, because foreign investors have been acquiring the securities of Indonesian companies as Indonesia's authorities liberalised inward portfolio investment regulations since 1987, to the extent that foreign investors in 2016 held 64 per cent of the total value of equities listed on the IDX (Oxford 2017, pp. 107–8). The third difference is not fundamental either, because the intent of the regulations during both periods was the same: maximising transparency for investors in terms of company operations and securities transactions.
The remaining question is to what degree the existence of the stock exchange in Jakarta, in interaction with the stock exchange in Amsterdam, contributed to the mobilisation of savings in Indonesia and overseas for investment in the securities of companies with operations in Indonesia. One way to do this is by relating accumulated authorised capital of these companies at the time of first listing to gross fixed capital formation and GDP. However, this would be conceptually incorrect, as many companies first listed well after they had established themselves and had grown their ventures through an accumulation of reinvested earnings.
Figure 4 disaggregates gross fixed capital formation as a percentage of GDP and shows that capital formation had long been very low in Indonesia, in line with its low level of GDP per capita and general living standards. The graph also shows that the rate of capital formation increased over time from an average of 1.6 per cent of GDP in 1870–4 to 13.9 per cent in 1935–9, and that most capital formation was related to investment mobilised in the form of authorised capital (i.e. equity) and the residual, which most likely mainly comprised reinvested company earnings. Even though total equity flows in Figure 4 refer to all registered companies, based on the accumulated nominal and market values stocks of equity in 1910 and 1929–30 in Figure 3, we can infer that most equity was mobilised by companies whose equity was listed at the two stock exchanges.
On that basis, Figure 4 supports the thesis that opportunities to list on either stock exchange, together with the public trading of securities, were important factors supporting capital formation in Indonesia. Firstly, public securities trading and the existence of both exchanges created a high degree of confidence among investors and security holders that company shares and other equity, as well as bonds and derivatives, were liquid assets. Secondly, as a result of public trading, securities markets established what the market judged to be fair prices for securities. In the case of equity, these were prices that included information about the degree to which companies added to their productive assets in the form of accumulated reinvested earnings, which – in principle – allowed firms to maximise and sustain dividend payments. Thirdly, Figure 4 shows that the only national accounts data that allow a disaggregation of capital formation after the 1940s reveal that, following the effective demise of the public trading of the equity of companies in Indonesia and the subsequent nationalisation of foreign-owned companies, private investment during 1958–62 decreased to a level relative to GDP comparable to the 1880s.
VII
This article has established that Indonesia had a secondary market for securities since the nineteenth century, and since 1898 a reasonably effective, self-regulated stock exchange that operated independently of the Amsterdam stock exchange, except for interactions related to the dual listings of securities. All indications are that market capitalisation and turnover on the exchange in Jakarta were small, but that both expanded as Indonesia's savings grew. Together with the market in the Netherlands, the securities market in Indonesia contributed increasingly to capital formation during 1870–1940. Both provided investors with the certainty that their investments in securities were liquid.
The article therefore casts doubt on the suggestion that stock exchanges and securities markets in Asia were not effective in the past because economic development and savings were low. In addition, the article confirms the findings of Wai and Patrick (Reference Wai and Patrick1973) and Drake (Reference Drake1977) that functioning institutional arrangements underscore the emergence and development of securities markets, rather than necessarily government regulation. After all, the Jakarta stock exchange was revived in 1952 with government regulation, but that was not a sufficient condition for it to regain its pre-1940 role. Without the exchange supporting the mobilisation of savings for investment, capital formation in Indonesia became more dependent on public investment in the 1950s and 1960s. Public investment was in short supply, which contributed to Indonesia's economic woes until after the late 1960s when the oil boom lifted public expenditure and investment.


