


I
Derivatives now play a major role in the world economy, but some commentators have raised concerns about the potential impact which they could have on financial stability. For example, Warren Buffett has referred to them as financial weapons of mass destruction (Buffett Reference Buffett2002, p.15). By using derivatives it is possible to obtain a large position in an asset by using only a small amount of capital, leading to highly leveraged returns. Any price gains are amplified, potentially leading to high returns to speculators, but any price falls are also magnified, which can quickly lead to insolvency. The widespread use of derivatives may increase risks within the financial system.
This article argues that derivative-like assets played a prominent role in the promotion boom and subsequent downturn in Britain during the 1840s. During this period, which has become known as the Railway Mania, the prices of railway shares increased dramatically, but the market then crashed and share prices fell considerably. The boom was associated with a substantial increase in the promotion of new railway companies, with at least 1,000 new railway lines being projected at this time. These new companies issued partially paid shares, which were essentially future contracts, whereby investors could obtain exposure to an asset by paying a small initial deposit, and by agreeing to make a series of semi-regular payments in the future. The derivative-like structure of these assets meant that investors could obtain highly leveraged positions.
To enable a comprehensive analysis of this episode, which the Economist has described as ‘arguably the greatest bubble in history’ (18 December 2008), a data set of railway securities listed on the London Stock Exchange between 1843 and 1850 has been collected from original newspaper tables. Using this data set, a cointegration analysis has been performed relating fully paid shares and partially paid instalment plan shares, which suggests that there was a spot-future relationship between these assets, implying that the partially paid shares could be modelled as futures. If partially paid shares were analogous to derivatives, then it implies that the leverage which results from the use of derivatives was available to investors during the Railway Mania.
An important consequence of leverage was to amplify the returns which investors experienced. Throughout the boom, which occurred in 1844 and 1845, the market prices of new railway shares were, on average, more than double the amount that investors had paid up in capital. The established railways may have been expected to trade at relatively high prices due to the expectations of high future profits, but the extent of the premium on the new railways was largely due to the structure of the assets which gave investors exposure to price changes for only a small deposit. The results presented in this article indicate that the share prices of new railways actually corresponded to fairly modest returns on the full investments. This is an important point, and one of the main contributions of this study, as it implies that in spite of all the excitement, the market, even at the height of the boom, was predicting modest returns.
Another feature of leverage was to affect the timing with which investors had to make their payments. During the boom shareholders had to initially deposit an average of less than 10 per cent of their total liability. This meant that individuals could potentially subscribe for more shares than they had the capital to fully pay for, which may have encouraged the promotion of more new railway lines than would otherwise have occurred. During the construction phase there were a large number of calls for capital, which meant that investors had to make further payments to the companies. This resulted in deleveraging, and the difficulties which investors experienced in meeting these calls contributed to price declines.
The analysis in this article suggests that the leverage embedded within derivatives has the potential to exacerbate promotion booms, by amplifying positive returns and reducing the amount of capital which must initially be deposited, but it could produce difficulties during a downturn, by magnifying negative returns and enforcing deleveraging when payments are required.
This article adds to several strands of existing literature. There have been some notable studies on the use of partially paid shares. Jefferys (Reference Jefferys1946) discusses the character and denomination of shares, but focuses on how the use of uncalled capital was regarded as a reserve which could be called upon in times of distress. Acheson, Turner and Ye (Reference Acheson, Turner and Ye2012) have noted that the instalment plan feature was attractive to middle-class investors of modest means, and was useful to companies to assure creditors, and to obtain capital without the need to issue new shares. However, neither of these studies have analysed the role of partially paid shares in contributing to an asset price reversal.
Dale, Johnson and Tang (Reference Dale, Johnson and Tang2005) and Shea (Reference Shea2007) have looked at the pricing of partially paid shares during the South Sea Bubble, but have focused on whether they were priced consistently with fully paid shares, which is examined in this article in Section III, rather than on how they contributed to the asset price reversal.
Michie (Reference Michie1981, p. 96) has noted that during the Railway Mania investors were willing to subscribe for shares for which they could not pay in the hope of short-term gains, and Nairn (Reference Nairn2002, p. 9) has stated that the railway stocks were highly geared instruments, but they have not analysed how the structure of the shares leveraged returns, or quantified how they contributed to the boom and bust. Other authors have provided valuable insights into the Railway Mania but not analysed the impact of the partially paid shares. Bryer (Reference Bryer1991) has claimed that the period was a ‘swindle’ on the middle classes. McCartney and Arnold (Reference McCartney and Arnold2003) have disagreed with this critique, and found evidence that railway accounts were not systematically manipulated. Campbell (Reference Campbell2012) has suggested that the pricing of established railways during this time illustrated myopic rationality, whilst Odlyzko (Reference Odlyzko2010a) has argued that this episode is an example of market inefficiency.
This article also contributes to our understanding of the relationship between leverage and asset price reversals, such as that of Kindleberger (Reference Kindleberger2000, p. 14) who has suggested that a boom can be fed by an expansion of bank credit. Allen and Gale (Reference Allen and Gale2000) have argued that using borrowed money to invest in risky assets is relatively attractive because it is possible to avoid losses by defaulting on the loan, which leads to investors bidding up asset prices. Aoki, Proudman and Vlieghe (Reference Aoki, Proudman and Vlieghe2002) have examined the links between house prices, collateral and borrowing in the United Kingdom, whilst Detken and Smets (Reference Detken and Smets2004) have found that real credit and money growth have been relatively strong before and during booms in 18 countries since the 1970s.
This article is organised as follows. The next two sections give a brief overview of the Railway Mania and of the data which have been used. The fourth section considers whether partially paid shares can be viewed as futures contracts. The fifth section analyses how returns were initially amplified, the sixth section considers the impact of subsequent instalment payments, with the final section being a brief conclusion.
II
The first modern railway, the Liverpool and Manchester, was first proposed in 1821 but was not opened until 1830 (Simmons and Biddle Reference Simmons and Biddle1997, p. 272). Within the next decade about 60 other railways obtained Parliamentary authorisation, with most of these projects being promoted in a boom during 1836 and 1837. Odlyzko (Reference Odlyzko2010b) has noted that ‘by any standard other than that of the larger and more famous Railway Mania of the 1840s, the one of the 1830s was giant’. After the boom ended, and these railways were being constructed, share prices remained low and the promotion of new lines was subdued.
However, between 1843 and August 1845, railway share prices rose rapidly. Figure 1 illustrates the pronounced rise in share prices amongst railway companies compared to the more stable pattern observed in non-railway companies. The index of Established Railways rose by 71.7 per cent, and the broader index of All Railways which also included new railways rose by between 93.5 per cent and 98.4 per cent depending on how the delisting of shares is dealt with, as will be discussed later. In comparison there was a rise in the Non-Railways index of just 18.8 per cent.

Figure 1. Market indices of railway and non-railway shares, 1843–50
Notes: Railway share indices calculated from weekly share price tables in the Railway Times (1843–50). Non-Railway share index calculated from weekly share price tables in Course of the Exchange (1843–50). The All-Railway index includes all railway securities. The Established Railway index includes only those railways which were constructed before 1843. The Non-Railway index includes the 22 largest non-railways by market capitalisation. The return of each security i at time t is given by Equation F1.
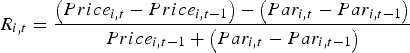 $$R_{i\comma t} = \displaystyle{{\left({Price_{i\comma t} - Price_{i\comma t - {\rm 1}} } \right)- \left({Par_{i\comma t} - Par_{i\comma t - {\rm 1}} } \right)} \over {Price_{i\comma t - {\rm 1}} + \left({Par_{i\comma t} - Par_{i\comma t - {\rm 1}} } \right)}}$$
If the par value of the security was unchanged, then the calculation was equivalent to a simple rate of change of price. If par value increased, due to a call on capital, the return would be zero if the price of the security moved by exactly the change in its par value. To construct each market index, the market return has been calculated by weighting the returns of the component companies by their market capitalisation at the start of the week. This is equivalent to their market capitalisation at the close of the previous week adjusted for changes in capital, as shown in Equation F2.
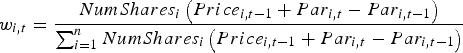 $$w_{i\comma t} = \displaystyle{{NumShares_i \left({Price_{i\comma t - {\rm 1}} + Par_{i\comma t} - Par_{i\comma t - {\rm 1}} } \right)} \over {\sum\nolimits_{i = {\rm 1}}^n {NumShares_i \left({Price_{i\comma t - {\rm 1}} + Par_{i\comma t} - Par_{i\comma t - {\rm 1}} } \right)} }}$$
The market return is the sum of the weighted returns, as shown in Equation F3.
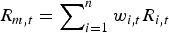 $$R_{m\comma t} = \sum\nolimits_{i = {\rm 1}}^n {w_{i\comma t} R_{i\comma t} }$$
This market return was then used to calculate the market index by Equation F4.
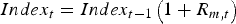 $$Index_t = Index_{t - {\rm 1}} \left({{1} + R_{m\comma t} } \right)$$
Many of the new railway companies delisted during this period. Alternative scenarios are shown on the All Railways index for what shareholders received when the company was no longer quoted in the Railway Times' share list. The first scenario assumes that the investor experienced no loss on delisting, with the other scenario assuming the investor lost his entire investment in that particular asset.
As with some other periods of rapid asset price growth, such as the South Sea Bubble of 1720, the boom of 1825 and the Dot-Com Bubble of the 1990s, there was a substantial increase in the promotion of new companies during the Railway Mania. Pollins (Reference Pollins1954) has summarised the process by which new railways were promoted. Some individuals would recognise the need for improved communication in a particular area, and would finance an initial survey or call a public meeting to arouse support. A provisional committee for the company would then seek capital from subscribers, often by advertising in newspapers.
The total amount that subscribers were obliged to pay to the company was referred to as the nominal value of the share. However, most of the new schemes issued partially paid shares with uncalled capital, which meant that investors paid only a small deposit and would then make future payments when the process of construction required it. The amount that shareholders had already paid to the company at a particular time was referred to as the par value. The difference between the nominal and par value reflected uncalled capital, which was the amount that shareholders were still liable to pay to the company. Uncalled capital could be used in several ways, with banks and insurance companies generally not calling it up except in times of stress, but the railways tended to call it up in regular instalments to finance the construction of their lines.
Once applications from subscribers had been assessed, letters of allotment would be issued to those whom the company accepted, which could be exchanged for scrip on the payment of the deposit, which was the initial par value. The company would then apply for authorisation for their route from Parliament. If authorisation was granted, the scrip could be exchanged for shares in the company. The company would then make further ‘calls’ for capital when the process of construction required it.
Many of the railway companies had their shares traded on the stock market, which allowed initial subscribers to sell the assets which they owned. The listing of these shares occurred without a modern IPO process, which typically raises additional capital by the issue of new shares which had not previously been issued. The number of railway securities listed on the London Stock Exchange, according to the share lists in the Railway Times, underestimates the extent of promotion, as only a small proportion ever achieved a listing, and others chose to only list on regional exchanges. However, the number of listed securities follows the pattern in prices with a lag, as shown in Figure 2.

Figure 2. Number of railway securities listed on the London Stock Exchange, and railway share index, 1843–50
Railway share prices peaked in August 1845, and then fell by 18 per cent during the next three months, just as the promotion of new railway schemes reached unprecedented levels. Many of the railways promoted at the height of the boom never received Parliamentary authorisation, either because they did not fulfil the basic requirements to be able to formally apply to Parliament, or because a competing scheme was preferred. Other companies faced difficulties when they began to lay their line, but the extent of railway construction was still impressive. Estimates by Mitchell (Reference Mitchell1964) suggest that railway investment represented 5.7 per cent of GDP in 1846, 6.7 per cent in 1847 and 4.7 per cent in 1848.
McCartney and Arnold (Reference McCartney and Arnold2001) have noted that not only did many investors lose money in new schemes, but the extensions put forward by established companies were also often commercially unsound. The early lines of the York and North Midland had been earning a return on shareholders' funds of 14 per cent, but the extensions earned only 2.3 per cent. Odlyzko (Reference Odlyzko2011, p. 340) has said that by October 1848 ‘new lines started during the Mania were coming into service, and the disappointing revenues they were earning could not be concealed for long’, which led to another share price crash, and the announcement by several of the major companies that they would suspend some of their planned construction.
The prices of railway shares continued to fall until 1850. To deal with those new railways whose shares were no longer quoted in the share lists of the Railway Times, two scenarios are shown in Figure 1. The first scenario assumes that the investor experienced no additional loss upon the removal of the asset from the share list, which would be valid if the share price had already fallen on the expectation that a delisting would occur, or if the removal just reflected changes in coverage by the Railway Times. The other scenario assumes that the investor lost his entire investment in that particular asset. For the small number of companies where the details of the winding up procedure was reported (see, for example, Railway Times 1846, pp. 522, 550, 599) there was a positive sum returned to shareholders, so it is likely that the first scenario is the upper boundary, and the second scenario is the lower boundary, of what investors would have experienced. The first scenario shows the All Railway index peaking at 1,984, and reaching a trough at 673, which represents a 66.1 per cent decline. The second scenario shows a peak at 1,935 and a trough at 583, which represents a 69.9 per cent decline. Using either approach, the downward movement in prices was substantial.
The growth of the railway industry during this period involved both an expansion by established railways and the launch of new railway companies. The relative importance of each can be seen from Figure 3. The established railways, which have been analysed by Campbell (Reference Campbell2012), expanded considerably during this period, more than doubling their par value between 1843 and 1850. However, those new railways which received Parliamentary authorisation during the Mania went on to constitute a substantial proportion of the railway industry, and represented 39.5 per cent of the railway industry's par value in 1850, making them an interesting area of research.

Figure 3. Total par value of established railways and new railways, 1843–50
III
Data on the number of shares in issue, the nominal value, the par value and the market price of each railway security which was published in the Railway Times' coverage of the London Stock Exchange between 1843 and 1850 have been recorded. The number of ordinary railway securities listed in any particular week averaged 179.6 across the period, peaking at 295 in 1846. The small number of preference and guaranteed stock listed during this time have not been included as such assets are priced differently from ordinary equity, making it inconsistent to include them in any analysis.
When some of the new railway companies were first listed, some of the data on the number of shares, nominal value or par value were not reported. In these cases the next reported data were assumed to be correct for the missing period. If these data were not reported at any future period, the Railway Shareholders' Manual (Tuck Reference Tuck1845) was used to obtain the missing details. If a price was not observed on a particular day, it was assumed that the price did not change during that day, and the last trade is treated as the latest price.
Several additional variables were also included. The value of uncalled capital for each asset was calculated as the difference between the nominal value and the par value of that asset. The risk-free interest rate, which was approximated as the yield on Consols (government debt perpetuities), and the dividend rates were obtained from the Course of the Exchange. Weekly stock prices were also recorded for a sample of the largest 22 non-railway companies from the Course of the Exchange to produce a market index for illustrative purposes.
IV
The new railway companies which were promoted during the Railway Mania issued partially paid shares that were paid for in instalments, rather than issuing fully paid shares which required the full amount of capital to be paid immediately. To analyse the implications of this decision this section will examine the relationship between partially and fully paid shares, with later sections considering the consequences for investors.
It has been suggested by Dale et al. (Reference Dale, Johnson and Tang2005), who considered the South Sea Bubble, that partially paid shares can be modelled as future contracts, as investors subscribed to the shares for a small deposit, and then paid a fixed amount at future dates. To test whether this relationship held during the Railway Mania this section analyses two assets issued by the Great Western Railway (GWR). The GWR has been chosen as it had both fully paid and partially paid shares listed on the market for almost the entire sample period, and longer than any other company.
The stock markets of this era were often illiquid, with Acheson et al. (Reference Acheson, Hickson, Turner and Ye2009) finding that amongst stocks listed in the Course of the Exchange between 1825 and 1870, the percentage of months for which a stock was traded averaged 67.6 per cent. However, trading in the assets of the Great Western Railway was frequent. There were 2,286 trading days of the sample period, between January 1843 and April 1850, when both assets were listed simultaneously on the stock market. On 1,261 days (55.2 per cent) both assets traded, on 616 days (26.9 per cent) only the fully paid shares traded, on 188 days (8.2 per cent) only the partially paid shares traded, and on 221 days (9.7 per cent) neither asset traded. There were 25,000 full shares and 25,000 half shares in issue during this period.
At the beginning of 1843 the ‘GWR Half Shares’ had a nominal value of £50, and a par value of £50, meaning that original subscribers were initially liable to pay up £50, and this full amount of £50 had already been called up. In 1843 the ‘GWR Full Shares’ had a nominal value of £100, and a par value of £65. This meant that shareholders had already paid the company a total of £65, but they were also liable to pay a further £35 at some time in the future. One ‘GWR Full Share’ had the same nominal value as two ‘GWR Half Shares’, so the price of one full share and two half shares are plotted in panel A of Figure 4.

Figure 4. Daily share prices of a GWR full share and two half shares, 1843–50. Panel A, prices observed in market; panel B, par values
The pricing of these assets appears to be related, but the difference between them changes over time. This change can be explained by changes in the par values of the two assets throughout the period, which is illustrated in panel B of Figure 4. The two ‘GWR Half Shares’ retain their par value of £100 throughout the period, but the par values of the ‘GWR Full Shares’ rise in a series of instalments from £65 to £100.
The relationship between fully paid and partially paid shares can be understood by a no arbitrage argument. Investors should receive the same return from purchasing a fully paid up share, or from purchasing a partially paid up share and paying the remaining liability. This suggests that a partially paid share can be modelled as a future contract with a fixed payment in the future, and the fully paid share can be regarded as the underlying security, as suggested by Dale et al. (Reference Dale, Johnson and Tang2005). Equation 1 adapts the standard future pricing relationship, as stated by Hull (Reference Hull2003, p. 50), to this situation and accounts for dividends which can be expressed as a percentage of the future payment.
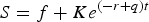 $$S = f + Ke^{(-r+q)t}$$
where: S = price of fully paid share, f = price of partially paid share,
K = size of future payment, r = risk-free interest rate, q = dividend rate
This relationship can be used to explain the relative prices of the two illustrated GWR share classes. At the beginning of 1843 two Half Shares (total nominal value of £100, and par value of £100) could have been purchased for £128. Alternatively, one Full Share (nominal value of £100, and par value of £65) could have been purchased for £90.25. If an investor could have paid up the remaining liability of £35 immediately then the total cost for the Full Share would have been £125.25.
However, the remaining liability could only be paid in instalments at future dates. Dividends were paid in proportion to par value, so the investor in the Full Share would have foregone the dividends due on the uncalled component K. The total cost to an investor would therefore have been equivalent to Ke qt, but when discounted to its present value this would have been Ke (−r+q)t.
Using the actual times of the instalments, and the average interest and dividend rates which prevailed until those times, suggests that the present value of the uncalled liability was £39.15. This meant that the actual present value of a GWR Full Share was £129.40, which was slightly more expensive than the two GWR Half Shares which would have cost £128. However, this difference in pricing is close to 1 per cent and, given that the bid-ask spreads on assets during this period were much larger than in the modern era, is relatively small.
These calculations have been repeated for each day of the sample between 1843 and 1850. The price of two Half Shares, and the present value of one Full Share, discounting the uncalled liability using the actual times, interest and dividend rates which prevailed, are plotted in panel A of Figure 5. It can be seen that when these calculations are performed the relationship between the two assets is extremely strong.

Figure 5. Daily share prices of a GWR full share and two half shares adjusting for uncalled capital, 1843–50. Panel A, prices adjusted for uncalled capital discounted at actual risk-free and dividend rates; panel B, prices adjusted for uncalled capital discounted using alternative scenarios for risk-free and dividend rates
For robustness, the present value of one Full Share was also calculated using various scenarios of (−r + q). Using a value of −10 per cent or 0 per cent, the Full Share appears to be underpriced relative to two Half Shares, whilst using a value of 10 per cent suggests the Full Share is slightly overpriced, as shown in panel B of Figure 5.
It is possible to introduce a more statistical analysis by testing for cointegration. By using the Engle-Granger 2-step approach (Engle and Granger Reference Engle and Granger1987) it is possible to test if the difference between the two series is stationary. This involves regressing the level of price 1 on the level of price 2, and testing the residual using the Augmented Dickey Fuller (ADF) test, which is one widely used approach to detecting stationarity. If the ADF test is significant it is possible to reject the presence of a unit root and conclude that the two series are cointegrated. This test for cointegration has been carried out for the pair of GWR assets discussed above, as shown in Table 1.
Table 1. Engle-Granger 2-Step cointegration test explaining the price of a fully paid share, compared to a partially paid share, for the Great Western Railway

Notes: Engle-Granger 2-step procedure (Engle and Granger Reference Engle and Granger1987) used to test for cointegration between the price of a fully paid share and partially paid share of the Great Western Railway. Price of the fully paid share (Pf) is the dependent variable in all specifications. Column 1 shows the independent variables for each specification. Pp is the price of the partially paid share. Up is the amount of uncalled capital on the partially paid share. Rf is the risk-free interest rate. q is the dividend rate on Great Western Railway shares. t is the time until the call is paid. The cointegrating vector, being the size of the coefficient on the partially paid share from the first step of the regression, is shown in column 2. ADF test of the residuals from the cointegrating relationship is shown in column 3. Critical values for the ADF test of residuals given in Stock and Watson (Reference Stock and Watson2003, p. 557). A significant ADF test rejects the presence of a unit root in the residual and suggests that the variables cointegrate. Number of observations in all specifications is 2,284. Daily share prices and par values obtained from weekly share price tables in the Railway Times (1843-50). Significance shown by *** p < 0.01, ** p < 0.05, * p < 0.1.
Various specifications of the cointegrating relationship have been analysed for robustness. The independent variables, namely the price of the partially paid share (P p), the uncalled capital in the partially paid share (U p), the risk-free interest rate (R f) and the dividend rate of the GWR, are initially included individually. Other specifications include only the implied fully paid price of the GWR partially paid share, which has been calculated by summing the price of the partially paid share and the discounted value of uncalled capital. Alternative scenarios for values of the discount term (−r + q) were analysed, but the closest approximation to the actual values of (−r + q) would have been between 0 and 10 per cent. Finally, the implied price of the partially paid share, using the observed market risk-free rate, approximated by the yield on Government Consols, and the actual GWR dividend rates, has also been considered in another specification. In each specification the ADF test strongly rejects the presence of a unit root in the residual of the first-stage regression, implying that the fully paid and partially paid shares were cointegrated once uncalled capital has been controlled for.
The cointegrating vector has also been estimated for each of the specifications. A vector with a value of 1 would suggest that the partially paid share was priced, on average, the same as the fully paid share. A vector greater than 1 would suggest that the fully paid share may have been overpriced, and a vector below 1 may suggest the fully paid share was slightly underpriced. The cointegrating vector was estimated using Dynamic OLS, which includes past, present and future values of the change in X in the regression, as this is efficient in large samples as suggested by Stock and Watson (Reference Stock and Watson2003, p. 557), with the results shown in Table 1.
When just the prices of the assets are considered the cointegrating vector is 1.12, but when the liability of uncalled capital is included as a separate variable the vector becomes 1.01, and when the risk free and dividend rates are included as additional variables the average vector is 0.99. When the fair price of the asset is calculated using scenarios of r and q the cointegrating vector ranges between 1.07 and 0.99, with the use of actual values indicating a vector of 1.02.
Although these results suggest some small deviation from a price ratio of 1.00, they should be placed within the context of the large bid-ask spreads which were prevalent during this era. For example, on 1 August 1845 the closing prices offered on GWR shares ranged between £223 and £225 on the partially paid shares which had £80 paid up, and between £120 and £122 on the half shares which had £50 paid up, as reported in The Times (1 August 1845, p. 7), which implies bid-ask spreads of up to 1.7 per cent.
In addition, as was noted above, both assets did not trade every day. On the 55.2 per cent of days when both assets were traded the average price ratio of fully paid shares to partially paid shares was 1.012. On the other days, when at least one of the assets did not trade and the price was assumed to have remained constant from the last day that a trade had taken place, the ratio rose to 1.017. Consequently, liquidity and transaction costs may explain much of the small deviation between the prices of the different assets. There was also uncertainty about the timing of calls, and future interest rates and dividends, meaning that some deviation was likely.
This analysis suggests that investors priced very similar assets consistently throughout the asset pricing ‘bubble’. This may be another example of ‘myopic rationality’ (Campbell Reference Campbell2012), where investors price different assets consistently, but fail to forecast future developments. This is an interesting finding in itself, but the confirmation of the no arbitrage relationship of Equation 1 is also of importance. The results in this section suggest that it is possible to use the observed price of a partially paid share and, by adjusting it to take account of the present value of uncalled capital, estimate the price of an equivalent fully paid share. This makes it possible to take the observed price of the partially paid shares of new companies, and estimate the implied price of equivalent fully paid shares, allowing an analysis of the implications for investors of the new railways' decision to only issue partially paid shares.
V
The discussion in the previous section has suggested that there is evidence that the partially paid shares listed during the Railway Mania can be modelled as future contracts. One of the characteristics of these types of derivatives is the leverage which results from their structure. Investors effectively borrow the funds from the counterparty, and obtain exposure to the movements of the underlying asset by paying only a small initial amount. If partially paid shares can be modelled as derivative-like assets, then it suggests that the leverage which results from these asset classes was available to investors during this period. This section will consider the impact that this leverage had on returns, initially examining returns throughout the period before considering returns after a railway had received Royal Assent from Parliament.
Investors who subscribed to new railways were asked to pay the par value of the share as a deposit. This was confirmed by a manual check of company prospectuses, which were available for 83 of the railways in the sample. For 68 railways the deposit was exactly the same as the par value stated when the railway was first listed on the stock market. For 15 railways the par value was higher than the deposit, indicating that an additional call for capital had been made between the time of subscription and when the railway was listed on the stock market. There was not a single case where the deposit was at a premium to the par value.
Investors would then be liable to pay calls up to the amount of the nominal value of the shares when the company requested it. If an investor subscribed to all new railway schemes, and then paid all subsequent calls when they were due, their cost at any particular time can be calculated as the sum of the par values of all new companies. This implies that a simple measure for estimating the return to investors in new railways, at any particular time, was the price/par ratio, as shown in Equation 2.
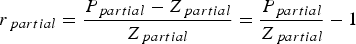 $$r_{\,partial} = \displaystyle{{P_{\,partial} - Z_{\,partial} } \over {Z_{\,partial} }} = \displaystyle{{P_{\,partial} } \over {Z_{\,partial} }} - 1$$
where: r = return, P = price, Z = par value
A price/par ratio of 1 suggested that the current market price equalled the amount which had already been invested. A price/par ratio of 2 suggested that the original investors had made a 100 per cent return, whilst a price/par ratio of 0.5 suggested investors had lost 50 per cent of their original investment.
Using information from the Railway Times (1844, p. 1309; 1845, pp. 1288-9), Tuck's Railway Shareholder Manual (1845, 1847 and 1848) and Scrivenor (Reference Scrivenor1849), each of the railways has been allocated to a portfolio according to when it received authorisation from Parliament, which culminated with the granting of Royal Assent, usually in the July or August of a particular year. A portfolio has also been constructed of railways which did not obtain authorisation at any time during the 1840s. The number of companies in each portfolio is shown in Figure 6.

Figure 6. Number of new railways grouped into portfolios according to the year in which they received Royal Assent, 1844–50
The price/par ratio of each portfolio was calculated on a daily basis between 1844 and 1850, and illustrated in panel A of Figure 7. These calculations show that the size of the return which subscribers to new schemes could obtain during the boom was substantial. The peak price/par ratio of those railways authorised in 1844 was 2.16, those authorised in 1845 was 4.36, those authorised in 1846 was 3.05, those authorised in 1847 was 1.09, and those not authorised was 3.03.

Figure 7. Price/par ratios of new railways, 1844–50. Panel A, market price/par ratios; panel B, implied price/par ratios adjusted for the discounted sum of future calls
The high returns available to investors from subscribing to new railway schemes is consistent with commentary during the period, such as the remark by the Railway Investment Guide (1845, p. 10):
it will be obvious that the party who has had certain shares allotted to him, which rise to a premium (as they almost invariably do, at least for a time), has the whole of that premium for his profit. By this means, persons possessing only sufficient capital to pay the deposit, may more than double it in a day.
The high initial premiums experienced on those companies which would not be authorised indicates that investors were not able, ex ante, to accurately forecast which lines would be approved, which may be another example of their myopia (Campbell Reference Campbell2012). This is consistent with media commentary at the time, which often complained about the unpredictability of Parliamentary decisions. For example, the Railway Times (1844, p. 557) commented:
of the four committees which have sat and closed their labours the decisions have been so different as if they had been chosen to be as far apart as East, West, North and South. The first committee in their decision selected the right line, the second committee selected the wrong line, the third adopted both competing lines and the fourth rejected both lines. What actually passed in the minds or from the mouths of the Committee in their deliberations is a secret not to be acquired.
However, throughout 1846 and early 1847, when most delisted, these companies consistently traded below par, and at a lower price/par ratio than any of the other portfolios, implying that once their future became clearer their prices fell most.
The pricing of the new railways in general seems to have had more to do with market expectations of the railway industry than the authorisation status of the individual railway. The peak in prices for those which were authorised in 1844, 1845, 1846 and those not authorised all occurred in 1845, when the prices of all railway shares were peaking. Prices then fell thereafter, even for those companies which would go on to receive authorisation in 1846. Although this could be interpreted as a lack of discrimination on the part of investors, it may also be seen as a response to the changing expectations of dividends which were expected from the railway industry (Campbell Reference Campbell2012).
These calculations have shown the returns which investors actually experienced given the partially paid nature of the shares. If investors had been required to pay the total cost of the asset immediately, rather than in instalments, their return would be given by Equation 3. The cost of the fully paid share can be implied by adjusting the par value to include the discounted sum of future calls. The price of the fully paid share can be implied by adjusting the price of a partially paid share according to the futures pricing relationship.
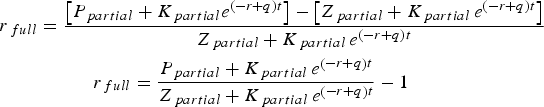 $$\eqalign{r_{\,full} &= \displaystyle{{\left[{P_{\,partial} + K_{\,partial} e^{\left({ - r + q} \right)t} } \right]- \left[{Z_{\,partial} + K_{\,partial} \, e^{\left({ - r + q} \right)t} } \right]} \over {Z_{\,partial} + K_{\,partial} \, e^{\left({ - r + q} \right)t} }} \cr & \quad \quad \quad r_{\,full} = \displaystyle{{P_{\,partial} + K_{\,partial} \, e^{\left({ - r + q} \right)t} } \over {Z_{\,partial} + K_{\,partial} \, e^{\left({ - r + q} \right)t} }} - 1}$$
where: r = return, P = price, Z = par value,
K = size of future payment, r = risk-free interest rate, q = dividend rate
A risk-free rate of 3 per cent, which was close to the yield on Government Consols, was used to discount the value of future instalments to their present value. These new companies could not pay a dividend until they had completed construction, and began operation, so the dividend rate was set to 0 per cent. Some companies did pay interest on calls of about 4 per cent, but robustness tests indicate that a change in the discount rate has little impact on the calculations.
If an asset eventually became fully paid up during the sample period between 1843 and 1850 then the actual times when the instalments were due was used. If an asset delisted before becoming fully paid up then it was assumed that the instalments had been due in five equal payments within the next two years after the asset delisted. As the average time to becoming fully paid up was 3.3 years, and most assets were listed for at least several months before delisting, this seems to be a reasonable assumption.
The price for each equivalent fully paid share, when the partially paid share is considered as a future contract, has been calculated for each day of the sample. The implied market capitalisation and par value for each portfolio have been used to calculate the implied price/par ratios shown in panel B of Figure 7.
The calculations indicate that the average price/par ratio of the equivalent fully paid shares of new railways was much lower than was actually obtained from the partially paid shares. The peak price/par ratio of equivalent fully paid shares for those authorised in 1844 was 1.29, those authorised in 1845 was 1.24, those authorised in 1846 was 1.13, those authorised in 1847 was 1.09, and those not authorised was 1.12. In each instance the results suggest that the returns which investors would have experienced from investing in fully paid shares would have been relatively low, but due to the leveraged nature of the partially paid shares the returns which they actually experienced were substantial.
To test whether there was a significant difference between the returns from partially paid and fully paid shares, the average returns for each have been calculated, and t-tests performed, as shown in Table 2. To ensure consistency between different companies the returns are calculated between the initial subscription and when the first call was made after Royal Assent had been granted. Many of the initial proposals which petitioned Parliament were directly competing projects, so to estimate whether the return implied on each individual company was fair it would be necessary to account for the possibility that some of the companies would not receive authorisation and investors would lose a substantial proportion of their deposits. Restricting the sample to those companies which had already received authorisation removes this difficulty.
Table 2. Returns on new railways' shares between initial subscription and when the first call was made after Royal Assent

Notes: Return on partially paid shares calculated as the return on the initial investment which investors would have received if they sold their shares on the day that the first call for capital was made after Royal Assent had been granted to the company's plans. Return on fully paid shares if partially paid shares treated as futures adjusts the price of partially paid shares for uncalled capital discounted at a risk-free interest rate of 3 per cent, and calculates the hypothetical return which investors would have received if only fully paid shares had been issued. Difference calculated as return on partially paid shares minus return on fully paid shares if partially paid shares treated as futures. Significance shown by *** p < 0.01, **p < 0.05, *p < 0.
Using the date of the first call after Royal Assent tends to underestimate the effects of leverage, which were greatest during the speculative stage before authorisation was received. The inclusion of the additional call increases the par value of the share, and consequently reduces the leverage ratio. For example, most companies initially required investors to deposit a par value of less than 10 per cent of the nominal value, but after the first call after Royal Assent the average par value had increased to 24.4 per cent of the nominal value.
As the first call also came late in the year of authorisation, or near the start of the next year, only those companies which were authorised in 1844 have prices included from the midst of the boom. For those authorised in 1845, 1846 and 1847, the first call generally came after prices had started to fall. Despite these effects, the impact of leverage on returns can still be seen.
Table 2 shows that the size of the return to subscribers in those new schemes which received authorisation was substantial. The mean return on companies authorised in 1844 was 57.5 per cent, those authorised in 1845 was 36.0 per cent, those authorised in 1846 was 21.8 per cent and those authorised in 1847 was −19.6 per cent, giving an average for the period of 33.7 per cent. In contrast, the average returns which would have been experienced if only fully paid shares had been issued for those authorised in 1844 was 16.6 per cent, those authorised in 1845 was 8.7 per cent, those authorised in 1846 was 6.6 per cent, and those authorised in 1847 was −2.7 per cent, giving an average of 9.1 per cent.
The difference between the return experienced on fully paid and partially paid shares was then calculated, and the standard error of the difference was estimated to produce a t-statistic which reveals whether there was a significant difference between the returns actually experienced, and the notional return if all assets had been fully paid up. The mean difference for those authorised in 1844 was 40.9 per cent, those authorised in 1845 was 27.3 per cent, those authorised in 1846 was 15.2 per cent, and those authorised in 1847 was −17.0 per cent, giving an average of 24.6 per cent. The difference for those authorised in 1844 and 1845, and for the overall period, was significant, indicating that the leveraged structure of the shares significantly increased investor returns.
To check these results for robustness the analysis was repeated using various scenarios for discounting future instalments to present value. Discount rates of −10, 0, and 10 per cent were used to ensure that the results were not highly sensitive to assumptions about the implied present value of future payments. The mean difference, and corresponding standard error, between the returns from a partially paid share and the returns from a notional fully paid share estimated using these scenarios are shown in Table 3. A change in the discount rate does have some effect on the difference but it is relatively small and the overall conclusion remains unchanged.
Table 3. Difference between actual and nominal returns of new railways between initial subscription and when the first call was made after Royal Assent using alternative scenarios for the discount rate

Notes: Mean difference calculated as return on partially paid shares minus return on fully paid shares if partially paid shares treated as futures. Alternative scenarios, for the interest rate at which uncalled capital is discounted, are shown. Significance shown by *** p < 0.01, ** p < 0.05, * p < 0.1.
These results suggest that the returns for underlying ordinary shares were not particularly high, but the return which was experienced was considerable because the full premium was embedded in an asset on which only a fraction of the capital had been paid. The impact of uncalled capital was to magnify the returns experienced by investors in new companies. Thus the dramatic returns which investors experienced at this time from investing in new companies were largely due to the effects of leverage.
VI
The use of leveraged derivatives also affected when investors had to provide payment. When investors subscribed to a new railway scheme they were liable for the full nominal value of the share, but they were only required to pay up the initial par value. As shown in Figure 8, the nominal amount of capital which investors had subscribed for increased dramatically during the boom years of 1844 and 1845. However, only a small fraction of this was paid up, as shown by the much more gradual increase in par value during these years. Rather than investing large amounts of capital, investors were actually increasing their liabilities at this time.

Figure 8. Total par value and nominal value of railway shares listed on London Stock Exchange, 1843–50
The ability to obtain exposure to the price movements of assets without having to immediately find the total capital required may have contributed to the number of new railways promoted at this time, and to the enthusiasm with which investors subscribed to the new schemes. This meant that the number of both ‘bubble’ companies and legitimate new enterprises was higher than would have been the case if all of the capital had been required immediately.
This was understood at the time, with several changes being made to the deposit which companies were required to collect before Parliament would consider their proposals. Since 1837, Parliament had required a deposit of 10 per cent, but in an attempt to make railway investment easier it was proposed that this should be reduced to 5 per cent in February 1844 (Hansard 1844, 72, c. 232). However, with the increase in projected schemes thereafter, it was raised to 10 per cent again in July 1845 (Evans 1849, p. 16).
The Economist (5 April 1845, p. 310) warned:
it is one of their peculiar characteristics but yet not less ultimately dangerous and deceptive on that account, that from the delay of procuring the act and getting it into operation the period when the main bulk of capital is required is remote from that when the greatest excitement and speculation exists, and no immediate check is therefore experienced by calls of capital.
When payments were eventually demanded, the resulting deleveraging may have contributed to a decline in prices. Investors were required to make regular and sizeable payments on their partially paid shares during the construction phase, especially between 1846 and 1848, as shown in Figure 9.

Figure 9. Railway share index and weekly railway calls, 1843–50
The Times (30 July 1845, p. 4) had issued warnings at the height of the Mania about the extent and impact of future calls for capital. They said:
soon or late the day will come when an untold proportion of this year's scripholders will be doubly pressed, no longer able to suffer the sums they have already paid to remain buried in the earthworks of an unfinished line, much less to pay up the quick recurring calls of the company.
The Economist (21 October 1848, p. 1187) noted:
every fresh call that was made upon exhausted shareholders was attended by one of two effects – either the shares themselves upon which the call had been made were sold in order to avoid payment, or some other shares were sold in order to raise the money for that purpose. There was constantly an increasing number of sellers, and a constantly diminishing number of buyers.
This led to the result that ‘lines in course of construction in place of increasing in price as more and more capital became invested in them, have after each new call fallen about as much as they should have risen’.
To estimate the impact of calls on share prices, the determinants of the annual returns of all railway stocks included in the Railway Times' share lists of the London Stock Exchange have been analysed in Table 4. The dependent variable is the percentage change in share price from t−1 to t, with one observation per stock per year. The percentage change in par value between t−1 and t is included as an independent variable. Other variables have been included as control variables to ensure robustness.
Table 4. Regressions analysing the determinants of annual returns of railways, 1843–50

Notes: The dependent variable is the annual return on individual railway stocks, calculated as the change in the logarithm of the share price from January of year t-1, to January of year t, adjusted for the increase in par value during this time. D.ParValue is the change in the logarithm of the par value of that asset from t-1 to t. The Beta of each firm has been estimated by regressing the weekly returns of each asset minus the risk-free rate, against the weekly returns of the market portfolio minus the risk-free rate. The market portfolio has been approximated by the non-railways' market index and the risk-free rate by the yield on Consols, which were government debt perpetuities. Size is the total par value of the firm at t-1. Price/Par is the price to par value ratio at t-1. Liquidity is the percentage of weeks on which a stock traded between t-1 and t. DDiv is the percentage point change in the dividend/par ratio between t-1 and t, after dividend payments have commenced. F1.DDiv is the percentage point change in the dividend/par ratio between t and t + 1. F2.DDiv is the percentage point change in the dividend/par ratio between t + 1 and t + 2. Robust SRobust standard errors in parentheses. *** p < 0.01, ** p < 0.05, * p < 0.1.
Beta, measuring the sensitivity of a stock to a market portfolio, has been a standard risk factor in financial models since Sharpe (Reference Sharpe1964). The Beta of each asset in this analysis has been estimated by regressing the weekly returns of each asset minus the risk-free rate, against the weekly returns of the market portfolio minus the risk-free rate. The market portfolio has been approximated by the non-railways' market index and the risk-free rate by the yield on Consols, which were government debt perpetuities. To improve the estimate of Beta only stocks which had at least 30 price observations are included. Fama and French (Reference Fama and French1992) have argued that size and the market/book ratio are also important risk factors. In this analysis size has been measured by the total par value of the firm at t−1, and the market/book ratio has been approximated by the price/par ratio at t−1. Pastor and Stambaugh (Reference Pastor and Stambaugh2003) have found that liquidity also influences returns. In this article liquidity has been measured as the percentage of weeks on which a stock traded between t−1 and t.
Previous research has suggested that the most important reason for declining share prices at this time was the declining profitability and dividend payments of the railways. Arnold and McCartney (Reference Arnold and McCartney2004, pp. 398-9) have found that average return on equity peaked in 1844 at 5.07 per cent, and fell to 2.37 per cent by 1849. Campbell (Reference Campbell2012) has found that dividends peaked in 1847, and has argued that changes in expected dividends were influential in share price changes during this period, so dividend changes between t–1 and t, t and t + 1, and t + 1 and t + 2 have been included. The inclusion of these additional variables reduces the sample size as not all of the data are available for all of the assets, particularly dividend rates which could only be obtained for a subsample of companies from the Course of Exchange, and most of the new companies did not pay any dividends until near the end of the sample period.
The results shown in Table 4 indicate that there is a significant and negative relationship between the returns on railway stocks and increases in the par value of those stocks. These results are robust to the inclusion of the other control variables discussed above. Beta, size, liquidity and future dividend changes are all significant determinants of returns, but the change in par value variable remains significant even when they are included, and for the smaller sample sizes.
The results imply that calls for capital, which increased the par value of railway stocks, were associated with negative returns. The coefficients vary between −0.07 and −0.18 depending on the specification, meaning that a 1 per cent increase in par value would have led to between a −0.07 and −0.18 per cent change in price.
An example may illustrate the impact of this relationship. If an asset began the year with a price and par value of £20, and the company made a call of £5 during that year, the price and par value should have both increased to £25 if there had been no negative impact from the call. However, the negative relationship indicates that the 25 per cent increase in par value would have led to between a −1.8 and −4.5 per cent change in prices. Consequently, the price of the asset should have traded at between £23.88 and £24.56 if the other control variables had no impact.
This example shows that the calls had some impact on prices. However, the explanatory power of the change in par value variable is very low, with an R2 value of less than 1 per cent, indicating that it was not the most important determinant of the share price declines which occurred. Other factors, particularly dividend changes, were also significant and have much greater explanatory power, which supports the argument of Odlyzko (Reference Odlyzko2011) that calls had only a transitory influence on the price declines, compared to the role played by the low profitability of the firms.
VII
Using an extensive data set, this article has analysed how the use of partially paid shares influenced the promotion boom which occurred during the British Railway Mania. This article makes several contributions to our understanding of how partially paid shares are related to the boom and bust of asset price reversals.
Firstly, it has shown that even during a period which is often regarded as being irrational, investors still priced similar assets consistently, with the partially paid and fully paid shares issued by the Great Western Railway moving in a manner which would be expected from a futures relationship. This is in contrast to Dale et al. (Reference Dale, Johnson and Tang2005), who have found that such consistency of pricing did not occur during the South Sea Bubble, although their findings have been disputed by Shea (Reference Shea2007).
Secondly, this article has found that the leverage embedded within partially paid shares significantly increased the returns to investors in new railways during the railway boom. This deepens our understanding of why partially paid shares were attractive to speculators, as noted by Michie (Reference Michie1981, p. 96), and adds to our understanding of how nineteenth-century asset pricing reversals developed, particularly to the existing literature on the Railway Mania such as Bryer (Reference Bryer1991), McCartney and Arnold (Reference McCartney and Arnold2003), Campbell (Reference Campbell2012) and Odlyzko (Reference Odlyzko2010a), which has not highlighted the role of partially paid shares.
Thirdly, this article has found that the instalment plan feature of the partially paid shares may have contributed to the subsequent share price declines. Although this feature initially made it easier for investors to speculate in new railway schemes, when payments were subsequently required the resulting deleveraging was associated with price declines. Although other variables, such as dividend declines, may have been more influential, the impact of calls was found to be significant, which has not been noted in the existing literature.
The recent Housing Bubble was similar to the Railway Mania in a number of ways. Leverage was widely available to individuals who wanted to invest in property. During the boom these investors earned high returns as price rises were amplified, and many decided to invest in multiple properties leading to a large expansion in the construction of new houses. However, the boom was unsustainable and many investors are now experiencing price falls and struggling to make payments.
It is possible that such a pattern may be repeated in future. The use of leverage can exacerbate both the boom and bust in asset price reversals, and it may be wise for policy makers to continually monitor changes in the use of leverage. The increasing use of derivatives, which are generally highly leveraged, may present particular threats, and it may be worthwhile reviewing how they are regulated.


