


1 Introduction
Gender differences in behavior under competitive pressures on the one hand, and in attitudes towards competition on the other, have been recognized for over a decade now (Gneezy et al. Reference Gneezy, Niederle and Rustichini2003; Niederle and Vesterlund Reference Niederle and Vesterlund2007; Balafoutas and Sutter Reference Balafoutas and Sutter2012; Wozniak et al. Reference Wozniak, Harbaugh and Mayr2014; Brandts et al. Reference Brandts, Groenert and Rott2015). The existing literature has predominantly focused on one particular dimension of competition, which is a rivalry for resources (Stigler Reference Stigler, Eatwell, Milgate and Newman1987). There is, however, another dimension that seems to have escaped scholarly attention. Competition typically entails a ranking of relative performance, since high-ranking performance determines the winner(s) in competitive environments. If socially recognized, such a performance ranking yields a ranking in terms of social status, as defined by Ball et al. (Reference Ball, Eckel, Grossman and Zame2001). This ‘social’ aspect of the recognition is important. If a ranking is only privately known, then no social status is involved.
Competition often creates a social-status ranking amongst the competitors. For example, competition for highly regarded jobs or promotions involves a rivalry for resources where some people are successful and others not; but it also implies applicants being ranked relative to others with the successful applicant obtaining higher social status than those who did not get the job or promotion. This ranking is social because the successful applicant is known and the employer (and often others) knows those who did not succeed.Footnote 1
In this paper we study gender differences in the reaction to status ranking in isolation from the rivalry dimension of competition. In particular, we focus on how performance is affected by the anticipation that one will be compared to others by a peer and compare this to cases where no such social ranking takes place.
Little is known about the consequences for gender inequality of the status-ranking dimension of competition as such. In natural environments rivalry for resources and status ranking are typically interlinked. However, there are many instances in which the status ranking is much more salient than in others. This holds, for example, in professions that are at least partially protected from the market like the judiciary, the military, NGOs, the churches and universities. In these organizations people in high positions typically enjoy high status, whereas the payoff differences with respect to people in lower positions are often not large.Footnote 2
Even if one could not distinguish in the field between rivalry for resources and status ranking, the two are in principle distinct phenomena that can have differential effects and, hence, could affect men’s and women’s behavior differently. A better understanding of gender differences in performance therefore requires an analytical distinction between the two dimensions. Aside from improving our understanding, it is important to note that this distinction is also highly relevant from a policy perspective. The likelihood of success of any policy aiming to diminish the gender gap may depend very much on whether a rivalry for resources or status ranking are causing performance differences. Consider a policy aiming to reduce the rivalry for resources while maintaining the social ranking of performance. An organization could, for example, reduce the restrictions on the number of promotions and base them solely on merit, independently of how many others are promoted. Being promoted will then increase one’s social status without reducing other high performers’ chances, i.e. without there being any rivalry for resources. If the cause of the gender gap lies in the effects of social ranking, then this policy is likely to fail.
It is well documented that attitudes towards status differ across gender, with men usually found to attribute more importance to status than women (Frank Reference Frank1999; Carlsson et al. Reference Carlsson, Gupta and Johansson-Stenman2009; Mujcic and Frijters Reference Mujcic and Frijters2013), though the reverse has also been reported (Johansson-Stenman et al. Reference Johansson-Stenman, Carlsson and Daruvala2002; Alpizar et al. Reference Alpizar, Carlsson and Johansson-Stenman2005). Here, we do not focus on the importance attributed to status per se. Instead, we address the complementary matter of gender differences in performance given that one knows that a performance comparison will take place that will reflect one’s status ranking. The anticipation of a social ranking has been shown to affect performance (De Botton Reference De Botton2004; Wilkinson and Picket Reference Wilkinson and Picket2010), but gender differences in this effect have not been addressed. What we do know is that, when men and women are ‘forced’ to compete for resources and the ranking of performance is not made salient (i.e., the status dimension of competition is not obvious), then performance differs across gender for some environments but not for others (Niederle and Vesterlund Reference Niederle and Vesterlund2011). This leaves open the question whether the performance differs between men and women when the status-ranking dimension is more salient.
We use laboratory experiments to isolate the effects of status ranking. Our design makes it possible to hold constant the rivalry-for-resources dimension of competition and to vary the dimension we are interested in. Our experimental design has two treatments, differing only in the second of three parts.Footnote 3 For both treatments, part 1 consists of a task where participants’ monetary payoff is based purely on the individual score (i.e., performance), so that there is no competitive aspect to the incentive scheme. There are two groups of participants. One group does the task of part 1 and then skips part 2. Their performance on the task serves as a benchmark to which we compare that of the participants in the other group. The participants in the other group also do the task in part 1 and then in part 2 have to report their scores to a peer seated in a separate office. This peer does not know what task was undertaken.
We conduct two treatments in a between-subject design. In the ‘Status Ranking’ treatment (SR), each participant in part 2 individually and privately reports to the same peer and (truthfully) reads aloud his/her score as well as the ranking among the other participants in the group. This allows the peer to compare performances in the task. This particular way of making the rank public (‘social’) aims at creating social recognition by making it salient and tangible to participants. As argued above, status ranking does not stem from receiving feedback about relative position; it is the recognition of one’s ranking by others that creates a social status.
In the ‘Conformity’ treatment (CF), each participant reports to a different peer and (truthfully) reads aloud the score, but not the rank. This treatment distinction uses the fact that status is inherently positional to isolate the mere effects of having to report one’s result to a stranger from the effects of social-status ranking, i.e., being compared to others by a stranger (a possibility pointed out by Heffetz and Frank Reference Heffetz, Frank, Benhabib, M.Jackson and Bisin2008). Importantly, in both treatments all participants who have to report to a peer are informed about this before starting on the summation task.
Our results show markedly distinct outcomes for men and women. For those participants who do not have to report to a peer and for those under conformity (CF), gender differences in performance are small and insignificant. In contrast, under status ranking (SR) men attempt many (and significantly) more summations and solve many more correctly than women. In this sense men perform better than women. Moreover, when women know beforehand that a social ranking of their performance will take place, they reduce the number of attempted summations. We can unequivocally attribute the observed performance differences to the social ranking, because no gender difference is observed when they do not report their score, nor under conformity, where participants report their score to a third party who cannot compare this score to that of others.
The remainder of this paper is organized as follows. The next section briefly reviews the literatures on gender differences in preferences for competition, stereotype threat, and status rankings and relates them to this study. Section 3 presents our experimental design and procedures, and Sect. 4 describes our results. A concluding discussion is offered in Sect. 5.
2 State of the art
There is by now an extensive literature on gender differences in behavior in relation to competition (for overviews, see Croson and Gneezy Reference Croson and Gneezy2009; Niederle and Vesterlund Reference Niederle and Vesterlund2011). This has addressed both performance differences when men and women compete and gender differences in the willingness to enter a competitive environment. In this literature, the focus is on the rivalry-for-resources aspect of competition. A competitive environment typically involves one or a few of the best performers obtaining a monetary prize, whereas the other participants do not earn anything.
Regarding gender differences in behavior under competitive pressures, a first influential study (Gneezy et al. Reference Gneezy, Niederle and Rustichini2003) shows for a maze-solving task that when forced to compete for resources women do not perform better than in a non-competitive environment where earnings are based solely on individual performance. In contrast, such competition strongly improves performance by men. This result is only observed when men and women participate in a mixed-gender competition, however. A similar effect is observed when 10-year olds compete in running contests (Gneezy and Rustichini Reference Gneezy and Rustichini2004).Footnote 4 With respect to the issue of gender differences in attitudes towards competition, the seminal work by Niederle and Vesterlund (Reference Niederle and Vesterlund2007) establishes that women have a lower willingness to enter competition than do men.
The first studies linking experimental measures of competitiveness to actual education and labor market outcomes have only recently started to appear. These show that (differences in) competitiveness help explain why women sort out of jobs with competitive compensation regimes (Flory et al. Reference Flory, Leibbrandt and List2015); predict whether Chinese students choose to participate in a competitive entry exam for prestigious universities (Zhang Reference Zhang2013); predict future salary expectations of American college students (Reuben et al. Reference Reuben, Wiswall and Zafar2017); and can partially explain gender differences in academic career choices of Dutch high school students (Buser et al. Reference Buser, Niederle and Oosterbeek2014).Footnote 5
To the best of our knowledge, nothing is yet known about the differential gender impact of the status-ranking dimension of competition. In previous studies, the status ranking aspect of competition was in a sense ‘hidden’, with the focus being primarily on the possibility of winning a monetary prize by being amongst the best performers.
The psychology literature has offered various explanations for effects of status ranking per se and for gender differences in these effects. We briefly discuss the related concepts of ‘social evaluative threats’ and ‘stereotype threat’. A conceivable effect of status ranking for both men and women is that it creates anxiety about an anticipated comparison. This anxiety can be caused by ‘social evaluative threats’, i.e., situations where the social self in humans is endangered. Such threats give rise to large levels of individual cortisol responses due to a fear of failure in the eyes of others (Dickerson and Kemeny Reference Dickerson and Kemeny2004). There is, however, no evidence that these physiological responses are gender related.Footnote 6 This, and the lack of previous studies on gender-specific performance effects of (social) status anxiety are somewhat surprising, because there is ample evidence of gender differences in ‘stereotype threat’, i.e., cultural beliefs about gender-specific performance. Such stereotype threats can cause distinct social evaluative threats for men and women and may therefore differentially affect performance. Indeed, stereotype threat is considered to be an important cause of gender differences in self-assessment of ability and career aspirations (with men scoring higher in both; Correl Reference Correll2004; Thébaud Reference Thébaud2010; Reuben et al. Reference Reuben, Rey-Biel, Sapienza and Zingales2012).
Stereotype threat may lead to evaluation anxiety when conducting tasks that are considered to be negatively associated with one’s gender (Steele Reference Steele1997). Simply knowing that a negative gender stereotype exists may be sufficient to cause anxiety (Goffman Reference Goffman1963; Howard and Hammond Reference Howard and Hammond1985; Steele and Aronson Reference Steele and Aronson1995), which inhibits performance (Sarason Reference Sarason1972; Hunt and Hillery Reference Hunt and Hillery1973; Michaels et al. Reference Michaels, Blommel, Brocato, Linkous and Rowe1982; Wigfield and Eccles Reference Wigfield and Eccles1989; O’Brien and Candall Reference O’Brien and Candall2003). Hence, stereotype threat could conceivably cause gender differences, both in the performance under competition for resources and in the effects of anticipated status ranking. In our study, we exclude this possibility. We are careful not to prime stereotype threat. Furthermore, our design allows us to isolate any effects of pre-existing stereotype threats related to gender. The results, however, indicate no evidence of such effects.
There are a few non-laboratory studies that look at the effects of giving ranking information to workers without pecuniary consequences. Blanes-i-Vidal and Nossol (Reference Blanes-i-Vidal and Nossol2011) study data from personnel records for warehouse workers of a German wholesale and retail organization, in which workers were paid piece rates and received private ranking information on their pay and productivity. Using a quasi-experimental research design they find that providing this information leads to a large increase in workers’ productivity. In contrast, Barankay (2012) finds a negative effect of providing ranking about feedback. He presents the results from a randomized control trial with furniture salespeople who are privately informed about their performance rank. He finds that privately giving rank information without any pecuniary consequences decreases sales considerably for men, but not for women. Note that the private nature of the ranking information in both of these field experiments means that they do not measure the impact of social-status ranking that we are interested in.
3 Experimental procedures and design
The experiment was run at the laboratory of the Universitat Pompeu Fabra (UPF) in Barcelona between April 2014 and May 2016. There were six sessions with 13 and six with 18 participants, for a total of 186 participants; 144 were ‘active’ participants (A- and B-players; see below), while the rest had a passive role (C-players; see below). All participants were recruited on a voluntary basis from the UPF subject pool using the ORSEE recruitment software (Greiner Reference Greiner2004). If more volunteers showed up than needed for the session, participants were randomly selected and the remainder was sent off with a €7 show-up fee.
The experiment was partly computerized.Footnote 7 Instructions were handed out on paper and are reproduced in part I of the Electronic Supplementary Material (ESM). The experiment consists of three parts. In part 1 (computerized), participants undertake an individual task. In part 2 (not computerized), some active participants are required to report their result to otherwise inactive players. Part 3 (computerized; discussed in ``Appendix 2'') involves pairs of participants playing dictator games. Instructions for parts 2 and 3 were distributed after completion of the previous part.
Sessions lasted approximately 50 min. At the end of each session, participants were paid their earnings (which were contingent on their decisions in parts 1 and 3) in private. For active participants, average earnings including the €7 show-up fee were €23.47 (€24.08), ex(in)cluding two outliers (as explained below). Inactive participants received a €20 participation fee.
3.1 Player types
Before entering the laboratory, participants are randomly allocated to the three types of players, denoted by A, B and C. Only types A and B enter the laboratory and do the tasks described below. C-players are taken to separate rooms and remain inactive throughout the experiment. In every session there are six A-players and six B-players. Depending on the treatment (see below), there are either six or one C-player.
3.2 Task
Part 1 is the same in all sessions and is taken from Weber and Schram (Reference Weber and Schram2017). Participants are presented with a sequence of pairs of 10 × 10 matrices filled with two-digit numbers. These matrices appear at the lower half of their computer monitor (Fig. 1).
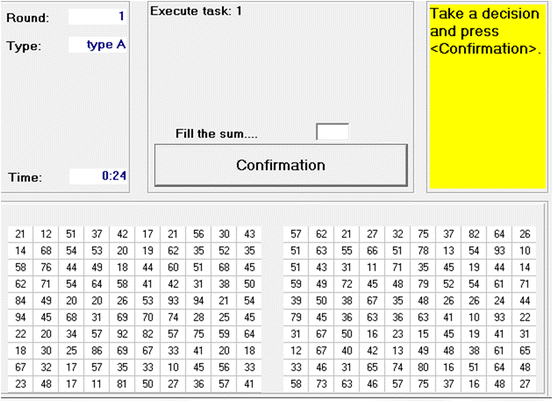
Fig. 1 Screenshot part 1. Notes The instructions inform participants that the numbers in the cells were ‘randomly generated’ (cf. SM). Drawing from a uniform distribution would have led to a high probability of very high sums. To avoid this, for each cell, we first drew a random number between 40 and 99, say X. Then, we drew a random number (uniformly) between 10 and X. This gives a far lower probability of high numbers (the chance of a number being 75 or more is approximately 0.06)
For each pair of matrices each participant has to individually search to find the highest number in the left matrix and the highest number in the right matrix and to calculate the sum of these two numbers. This sum must be entered in the window at the center-top of the monitor.Footnote 8 A correct answer yields one euro. We apply this piece-rate remuneration in all of our treatments. After a number has been entered, two new matrices appear, regardless of whether the sum was correct or not. The task continues for 15 min. The piece rate remuneration that we apply aims at minimizing the rivalry for resources in all of our treatments. Any treatment differences that might occur can then be attributed to the social status dimension of competition.
B-players are instructed about the summation task and perform the task without further interaction with other players. A-players are informed before the task that they will be required to report their performance to a C-player after completion. Performance is measured as the number of correct summations. The A-player instructions also emphasize the importance of doing well in this task by mentioning that it has been shown to correlate positively with success in professional life.Footnote 9 Participants were told that we would provide evidence of this claim upon request after the experiment. For this purpose, we had available copies of Koedel and Tyhurst (Reference Koedel and Tyhurst2012), which is a resume study linking math skills to labor market outcomes.
After finishing the instructions, each A-player is individually taken to a C-player and reads aloud a text stating that s/he will return after the task to report her/his score (i.e., performance). This is done to create the anticipation of having to later report to the C-player. The text used is given in SM. The experimenters taking the A-players to see the corresponding C-player were always a man and a woman.
3.3 Treatments
We start with the distinction between two treatments that differ only in whether C-players are able to compare the performance of A-players. These are denoted as the ‘Status Ranking’ (SR) treatment and the ‘Conformity’ treatment (CF-NR, which denotes ‘Conformity-No Ranking’). In SR, there is only one C-player. In part 2 of the experiment, each A-player reports (one at a time) to this C-player and reads aloud the number of correct summations and the own rank amongst the A-players (cf. the upper panel of Fig. 2).
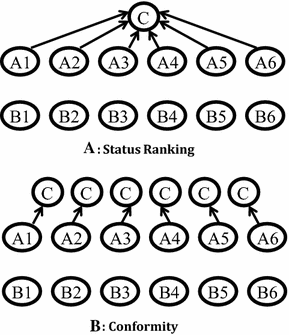
Fig. 2 Experimental design. Notes A- and B-players individually do the summation task. Then A-players report privately to C-player(s) (indicated by arrows). Panel A shows the Status Ranking (SR) treatment where each A-player individually goes to the (same) C-player and reports his or her own score and rank amongst A-players. Panel B shows the Conformity (CF) treatment where each A-player individually goes to his or her ‘own’ C-player and reports the score
The conformity treatment was designed with the idea that simply reporting one’s score to a peer might already induce social evaluative threat and affect behavior. In Sect. 3.3 of their excellent overview of the literature on status, Heffetz and Frank (Reference Heffetz, Frank, Benhabib, M.Jackson and Bisin2008) write: “Indeed if we assume that status depends on actions, status-seeking individuals are expected to change their behavior in predictable ways depending on whether their actions are visible to others. The observation that they often do, however, is consistent not only with preferences for status, but also with any preferences where others’ opinions are important (e.g. because of considerations of reputation, shame, fear of punishment, etc.). This should be borne in mind when interpreting the evidence below”. In other words, our status-ranking treatment may confound the effects of social status with other effects related to a wish to ‘conform’ to a peer’s opinions.Footnote 10 To study the status effect in SR, we use CF to isolate such other effects.
To control for such ‘conformity’ effects, we use the CF-NR treatment, where there are six C-players, each seated in a separate room. Each A-player in this treatment reports (one at a time) to a different C-player and reads aloud the number of correct summations, but does not report anything related to the player’s ranking (see the lower panel of Fig. 2). When reporting, A-players use printed (truthful) texts provided by us (cf. SM). In both SR and CF-NR, B-players do not report to C-players. Their performance serves as a behavioral benchmark of isolated play without reporting.
Note at this stage that there may be two differences between the CF-NR and SR treatments. In SR, the social ranking is not only known to others (i.e., C-players), but also to the A-players themselves. In CF-NR, A-players do not know (and, hence, cannot report) their social ranking. To separate the effects of reporting and knowing the own social ranking, we add a treatment in which each A-player is informed about her own rank but knows that every A-player will report to a distinct C-player, i.e., there is no social ranking. We denote this treatment by CF-PR (‘Conformity-Private Ranking’).
In all treatments, C-player instructions inform them that they will be told the result of either one (CF-NR/CF-PR) or six (SR) participants. They are not informed about the task, but are told that high scores indicate better performance than low scores.Footnote 11 A-players know that the C-players do not know the task. After all A-players have reported their scores, C-players are paid €20 and dismissed.
The choice to induce social ranking via a face-to-face encounter with a peer deserves further discussion. Of crucial importance is that—as argued above—social status requires that the ranking is public (i.e. socially recognized).Footnote 12 An alternative would have been to organize the interaction between the A- and the C-player through the computer. This would have, however, seriously reduced the saliency of the social aspect of status in the SR treatment. A disadvantage of our approach may be that face-to-face interaction introduces various possible channels through which our main results might emerge. We hope to have diminished the number of channels by introducing only minimal contact between the two participants involved (the A-player reads aloud a one-line text prepared by us and the C-player is not allowed to respond). We consider a further investigation of possible channels by which this face-to-face encounter might cause treatment effects an interesting topic for future research.Footnote 13
3.4 Pilot
Before running the 12 sessions of this experiment, we organized four pilot sessions (in March 2014). These differed from the final experiment on two accounts. First, participants were given 10 min instead of 15 min to do the summation task. We increased the amount of time given to create more leeway for differences in performance. Second, A-players did not go to the C-players between reading the instructions for part 1 and starting the summation task. We introduced this to make the reporting of their result to a peer more prominent.
4 Results
Our presentation of the results focuses on gender differences in performance in the various treatments, distinguishing between attempted summations and performance (i.e., the number of correct summations). Because all tests reflect pairwise comparisons between independent samples of individuals, we apply (two-sided) permutation (a.k.a. randomization) t tests using Monte-Carlo resampling with 5000 repetitions (henceforth, PtT) throughout the analysis.Footnote 14 PtT do not make assumptions about the underlying distributions and the number of observations needed for trustworthy inference is (much) lower than for the tests more commonly used in experimental work. For example, Moir’s (Reference Moir1998) study in this journal already shows the success of these tests with as few as eight observations per treatment cell. Our numbers of observations per cell vary between 16 and 52 (note that by design we have more observations for players of type B) and all tests of our main hypotheses are based on 26–72 observations. We provide a further discussion of our tests in ``Appendix 3'', which also provides supportive evidence for our results using data from related experiments in Amsterdam (cf. fn. 6).
In presenting our results, we first investigate whether privately knowing one’s own rank has an effect on the numbers of attempts and performance. We then continue with considering the effects of social-status ranking on the number of attempts and performance. An overview of our summary statistics is presented in “Appendices 1 and 2” reports the effects of experienced status ranking on choices in the dictator game.
4.1 The effects of private ranking information
To check whether knowing one’s relative position (without anyone else knowing) has an effect, we compare the CF-NR and CF-PR treatments. Figure 3 compares attempts and performance across gender for these two treatments. It shows that the ordering between men and women on both measures is reversed when subjects know that they will be privately provided with information about their ranking amongst the A-players. Differences are small, however. None of the within-gender differences in attempts or performance between CF-NR and CF-PR are statistically significant (PtT; all p > 0.24; N = 20 for women, N = 16 for men). More importantly, there are no significant gender differences in attempted summations or performance for either conformity treatment (PtT; attempts: in CF-NR p = 0.374, N = 18; in CF-PR p = 0.292, N = 18; performance: in CF-NR p = 0.242, N = 18; in CF-PR p = 0.509, N = 18). For this reason, we pool the data for the CF-PR and CF-NR treatments from here onwards, unless indicated otherwise.
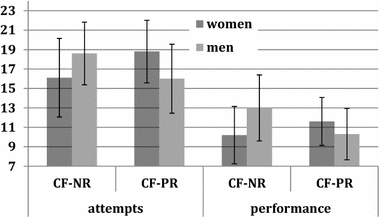
Fig. 3 Attempts and performance in conformity treatments. Notes Bars show number of attempts at calculating summations (left) and performance (number of correct summations, right), separately for women and men. CF-NR: Conformity treatment without knowing own rank; CF-PR: Conformity treatment with knowing own rank. Error bars show 95% confidence intervals
4.2 The effects of anticipated status ranking
When further analyzing the data, we leave out two outliers in the SR treatment with more than 100 attempted summations (see SM, part II). Including them would further strengthen our results. Figure 4 presents the main results of this paper. The results for type B show that women make insignificantly more attempts and have insignificantly lower performance than men when they do the summation tasks without having to visit a C-player (PtT; p = 0.757 for attempts, p = 0.887 for performance; in both cases N = 72). This is an important benchmark indicating that for this task our participants experience no unaccounted-for stereotype threat related to gender (cf. Sect. 2).Footnote 15
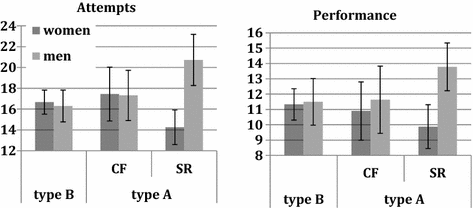
Fig. 4 Attempts and performance. Notes Bars show the number of attempts at calculating summations (left panel) and performance (number of correct summations, right panel), separately for women and men. CF Conformity (CF-NR and CF-PR pooled); SR Status Ranking. Error bars show 95% confidence intervals
In the conformity treatments—i.e., when participants know that they will report their result to a peer but also know that this C-player will not be able to compare this result to others’ performance– the differences between men and women are very small and statistically insignificant (PtT; p = 0.951 for attempts, p = 0.658 for performance; in both cases N = 36).
The most remarkable result is observed for the treatment where A-players report to a C-player and know that this peer will be able to compare their performance to others (SR). Here, women make many fewer attempts and have much lower performance than men and these gender differences are highly significant for both attempts (PtT; p < 0.001; N = 34) and performance (PtT; p < 0.001; N = 34). The observed gender difference in performance in SR is a direct consequence of the difference in attempts because the fraction of attempted summations that is correct does not differ between men and women in SR (PtT; p = 0.789; N = 34).Footnote 16
The ‘dif-in-dif’ result shown in Fig. 4 is a direct consequence of the difference in the way men and women react to the introduction of conformity or status ranking. When introducing conformity in CF (having to report to others without being compared), women slightly increase their attempts but have lower performance (compared to the behavior of B-players who do not report). These differences are far from statistically significant, however (PtT; p = 0.548 for attempts, p = 0.692 for performance; in both cases N = 72).Footnote 17 Men (slightly) increase their number of attempts and have almost the same performance; again these effects are statistically insignificant (PtT; p = 0.496 for attempts, p = 0.933 for performance; in both cases N = 36).Footnote 18
When introducing social-status ranking in SR, a comparison to the ‘non-reporting’ B-players shows that women reduce their number of attempts and performance, while men strongly increase attempts and performance. For women, the first effect is statistically significant (PtT; p = 0.044, N = 68) while the effect on performance is insignificant (PtT, p = 0.172, N = 68). For men, both effects are statistically significant (PtT; p = 0.003 for attempts, p = 0.050 for performance; in both cases N = 38). These results allow us to conclude that the gender difference we observe in a situation where anticipated status ranking may affect behavior is caused by men increasing the number of attempted summations and women decreasing it.
To investigate the effect of status ranking within gender, the most direct comparison is between our treatments CF-PR and SR. Recall that the only difference between these two is that each participant reports his or her score to a different peer in CF-PR while all six participants report to the same C-player in SR. The effects we find are remarkable. An anticipation of status ranking makes women significantly reduce the number of summations they attempt (PtT for attempts, p = 0.010, N = 26). The reduction in performance is not significant (PtT for correct, p = 0.221, N = 26). For men, the numbers of attempts and performance both increase significantly (PtT, p = 0.047 for attempts, p = 0.028 for correct, in both cases N = 26).
5 Conclusions
Our experimental study abstracts from rivalry for resources and focuses on the effects of social status resulting from the social ranking of performances. We find that men make more attempts and increase their performance in anticipation of status ranking. Women, on the other hand, make fewer attempts and perform more poorly when they know they will be compared to others. This results in a large and statistically highly significant gender gap.
Our findings suggest that anticipated ranking of social status alone is an important element in observed gender differences in real-world competitive environments. Previous studies have shown that women tend to ‘opt out’ of competitive situations (Niederle and Vesterlund Reference Niederle and Vesterlund2007). Our results imply that finding ways to make women ‘opt in’ may not suffice to bridge the gender gap. In fact, our study shows that—if the status ranking inherent to competition is salient—forcing an opt-in will make women slow down in trying to perform their task and will make men excel.
Though being compared to others is particularly disadvantageous to women, the aggregate effect across men and women may not be negative. In our experiments, total productivity (measured by the total number of correct summations for one man and one woman) is on average 22.8 for participants who do not report to anyone, 22.5 for those in conformity and 23.7 for those anticipating status ranking. This suggests that such ranking has negative effects on gender equality without negatively affecting economic efficiency. Efficiency and equity could both be enhanced if one could diminish the effect of social-status ranking on women while maintaining the stimulating effect it has on men.
Our focus in this paper has been on generating causal evidence on the gender effects of social-status ranking. The question arises what are the mechanisms underlying this phenomenon. Tentative interpretations of our findings are that either women choke under status pressure, or that status ranking with peers demotivates women. The fact that in anticipation of status ranking women make fewer attempts hints at the latter, though it raises the follow-up question of why this demotivation occurs. It is also possible that women simply become more careful in performing their task, in the sense of pondering their decisions more before submitting them to the computer. Finally, the observability inherent in social status comparison might induce in women a desire to conform to a gender norm (similar to the ‘acting wife’ phenomenon reported in Bursztyn et al. Reference Bursztyn, Fujiwara and Pallais2017). At this stage it is unclear, however, why this would appear in our Status Ranking treatment and not in Conformity. A solid explanation of the effects we find is beyond the scope of this paper, but it deserves further investigation in future research.
Given the increasing labor participation of women, such gender differences and the ‘hidden’ factor of social-status ranking under competition need to be addressed. A first step would be to reduce for women the performance comparison with others in working environments. This can be done, for example, via fixed promotion standards based on individual performance without comparison to peers. An example of this practice is that in many North American universities, tenure decisions are not made in direct comparison to other candidates who are simultaneously up for tenure, but to a set of standards expected for a tenured position. Our results suggest that that if this procedure reduces the salience of status ranking, it lead to better performance by women than in universities where they have to apply and compete for vacant tenure positions (as is often the case in Europe).
Finally, to the best of our knowledge, this is the first study that isolates the effect of social-status ranking from the rivalry dimension of competition. More research is needed to establish the consequences of what we find here, that even when rivalry for resources is held constant, simply being compared to others has an opposite effect on men and women, leading to gender differences in performance and resource allocations. An interesting direction for future research would be to make both dimensions of competition salient. Our hunch is that they would reinforce each other in creating more advantageous environments for men than for women.
Acknowledgements
Much of the work reported in this paper was done while the first and third authors were visiting the University of Pompeu Fabra and the Institut d’Anàlisi Econòmica in Barcelona. We are grateful to both institutions for their hospitality. We also thank the Research Priority Area Behavioral Economics of the University of Amsterdam, the Spanish Ministry of Economics and Competitiveness through Grant: ECO2014-59302-P and through the Severo Ochoa Program for Centers of Excellence in R&D (SEV2015-0563) and the Generalitat de Catalunya (Grant: 2014 SGR 510) for financial support, Veronica Benet-Martinez for providing us access to the laboratory of the Universitat Pompeu Fabra in Barcelona, and Pablo Lopez-Aguilar, Eva Maciocco, Elia Soler Pastor, Silvia Soriano and Imma Triano for help in organizing the experiments. We are grateful to seminar participants at University Ca’ Foscari in Venice, University of Padua, University of Amsterdam, Heidelberg University, European University Institute, and the Universidad Carlos III de Madrid, and Jos Bosch, Thomas Buser, Marii Paskov, Christina Rott, Aljaz Ule, and Matthijs van Veelen for comments at various stages of this project.
Appendix 1: Summary statistics
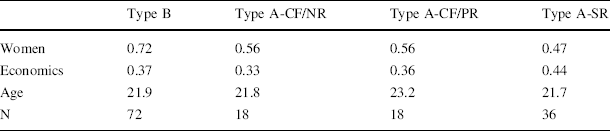
Table 1 shows participants’ characteristics across types and treatments.
Table 1 Participants’ characteristics
|
Type B |
Type A-CF/NR |
Type A-CF/PR |
Type A-SR |
|
|---|---|---|---|---|
|
Women |
0.72 |
0.56 |
0.56 |
0.47 |
|
Economics |
0.37 |
0.33 |
0.36 |
0.44 |
|
Age |
21.9 |
21.8 |
23.2 |
21.7 |
|
N |
72 |
18 |
18 |
36 |
Women: fraction of female participants; Economics: fraction of participants with a major in economics or business; Age: average age; N: number of participants
Table 1 shows that the fractions of participants with a major in economics and business are similar across types. We distinguish between these majors because these are the fields in which students are most likely to have experienced tasks similar to the summation task. The differences are statistically insignificant (Fisher’s exact test, p = 0.11). The average age is also statistically indistinguishable across types (Kruskal–Wallis, p = 0.44).
The distribution of women is similar across A-types. The differences are statistically insignificant (Fisher’s exact test, p = 0.86). Women seem somewhat over-represented amongst B-types however. Across all four categories, the differences are marginally significant (Fisher’s exact test, p = 0.07). Note that this does not cause problems for our analyses, because they all either compare genders within types or compare types within gender.
Appendix 2: Experienced status ranking and bargaining
The main text focuses on the effects of an anticipated status ranking. Here, we discuss the effects of experienced status ranking. The literature on such effects is scarce. Most influential in economics has been the work by Ball and Eckel (Reference Ball and Eckel1996, Reference Ball and Eckel1998) and Ball et al. (Reference Ball, Eckel, Grossman and Zame2001). In their experiments, high status is induced to some participants by calling them forward and awarding them with a gold star. In subsequent interactions, high-status participants obtain a larger share of the resources than low-status participants. This is observed both in the ultimatum game (Ball and Eckel Reference Ball and Eckel1996, Reference Ball and Eckel1998) and in markets (Ball et al. Reference Ball, Eckel, Grossman and Zame2001). The interpretation given in these papers is that a high social status creates a feeling of ‘entitlement’ to resources, even if the status is unrelated to the task in which the resources are generated (Ball et al. Reference Ball, Eckel, Grossman and Zame2001). These studies do not address possible gender differences in this effect.
Design
In part 3 of our experiment, each A-player is paired with a B-player and each B-player is paired with a different A-player. This is illustrated in Fig. 5. This pairing scheme aims at avoiding direct-reciprocity influences on participants’ behavior. Each participant plays two dictator games, once as a dictator, once as a recipient. The dictator divides €10 between herself and the recipient with which she is paired. For example, A2 divides €10 between herself and B2 and B6 divides €10 between herself and A1. After all decisions have been made, a random draw determines whether dictator decisions by the A-players or the B-players are paid out.
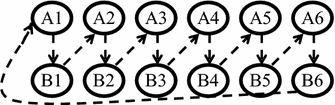
Fig. 5 Dictator pairing. Notes: Arrows give pairings, pointing from the dictator to the recipient
Results
We first investigate whether our data replicate Ball and Eckel (Reference Ball and Eckel1996, Reference Ball and Eckel1998), Ball et al.’s (Reference Ball, Eckel, Grossman and Zame2001) ‘entitlement’ results. In our experiment bargaining is represented in its most simple form: the dictator game. The Ball et al. entitlement results predict that having been ranked highly in the summation task will make one offer less as a dictator. We would then expect lower offers by the top-ranked participants of type A-SR than for top-ranked types B or A-CF. This is because the former type knows that they scored well when being socially ranked and the latter types scored well but were not socially ranked (in fact, types A-CF-NR and types B did not even know their ranks). On average, the amount offered by these top-ranked types is 3.00, 3.33 and 1.88 for type B, type A-CF and type A-SR, respectively. As predicted, we find that those who were socially ranked offered least in the subsequent bargaining.Footnote 19 The pairwise differences in dictator giving between the socially ranked (and top-3) dictators and each of the other two categories is marginally statistically significant (PtT, p = 0.065, N = 55 when comparing type A-SR to type B; p = 0.095, N = 34 when comparing type A-SR to type A-CF). This is in line with the entitlement results by Ball and Eckel (Reference Ball and Eckel1996, Reference Ball and Eckel1998), Ball et al. (Reference Ball, Eckel, Grossman and Zame2001).
Figure 6 shows per player type the average amount (out of €10) given by men and women to the recipient, separately for players with a rank in the top 3 and those in the bottom 3.
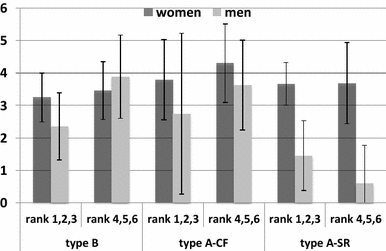
Fig. 6 Dictator Allocations. Notes: Bars indicate the amount in euros given by the dictator to the recipient (s)he was paired to. Rank 1, 2, 3 (4, 5, 6) indicates that the participant was amongst the top 3 (bottom 3) in own group in terms of performance. Recall that only type A-SR and type A-CF-PR players knew their rank. The numbers of observations are larger than or equal to eight in all categories, except men in type A-SR with rank 4–6 (N = 5) and women in type A-SR with rank 1–3 (N = 3). Ties were treated as follows. In CF and SR the participant that reached the (tied) number of correct solutions first was ranked above the other. For type B, all those tied were given the same rank. Error bars show 95% confidence intervals
At first sight, the largest differences between men and women are observed for participants who had been subjected to social ranking (note that the numbers of highly ranked women and lowly ranked men in SR are low, however). Irrespective of whether they scored highly or lowly, men seem to give less than women after having been socially ranked. We again test for gender differences using permutation t-tests. Table 2 presents the p values that these tests yield.
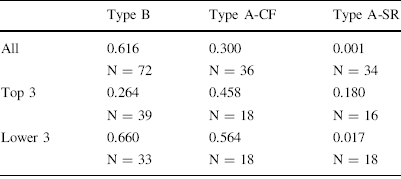
Table 2 Test results for gender effects in dictator allocations
|
Type B |
Type A-CF |
Type A-SR |
|
|---|---|---|---|
|
All |
0.616 N = 72 |
0.300 N = 36 |
0.001 N = 34 |
|
Top 3 |
0.264 N = 39 |
0.458 N = 18 |
0.180 N = 16 |
|
Lower 3 |
0.660 N = 33 |
0.564 N = 18 |
0.017 N = 18 |
Cells show the p value of an PtT test on equal mean contributions by men and women for the type depicted in the column and the ranks depicted in the row
The results in Table 2 show only few gender effects in dictator giving. The one important exception is that men who have scored badly in the summation task (i.e., lower half in the ranking) offer significantly less than women after having been subjected to social ranking. The sizable difference between men and women observed for top-ranked subjects (cf. Fig. 6) in SR is statistically insignificant, possibly due to the low number of women in the sample. In short, men tend to give less than women when ranked, but especially so after having been publicly ranked lowly.
Appendix 3: Robustness of our results
The numbers of observations we use for our statistical tests are at the lower end of what one typically observes in the experimental literature. In this ``Appendix 3'', we first argue that they nevertheless allow for valid inference when using permutation t-tests. Then, we use additional data obtained from a related experiment to show that our conclusions are robust to enlarging the data set.
Permutation t-tests
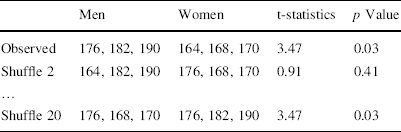
Permutation (a.k.a. randomization) tests (Fisher 1935) are based on reshuffling treatment labels in a data set. Consider the case of a t-test for differences in means. The idea for reshuffling starts from noting that an observed t-statistic may be seen as a draw from all possible t-statistics. Table 3 provides an example. Assume that we observe the height (in cm) of three men and three women as depicted in the first row. We want to investigate whether men are taller than women.
Table 3 An example of permutation t-tests
|
Men |
Women |
t-statistics |
p Value |
|
|---|---|---|---|---|
|
Observed |
176, 182, 190 |
164, 168, 170 |
3.47 |
0.03 |
|
Shuffle 2 |
164, 182, 190 |
176, 168, 170 |
0.91 |
0.41 |
|
… |
||||
|
Shuffle 20 |
176, 168, 170 |
176, 182, 190 |
3.47 |
0.03 |
Applying a t-test to the observed heights would lead us to believe that men are significantly taller at the 5%-level. The low number of observations (six) should make one doubt the normality assumption underlying this t-test, however. There are 20 possible distributions of the six heights between three men and three women. Of these (only) the observed distribution and ‘shuffle 20’ give a t-value of 3.47 or higher. Even if heights are distributed randomly between men and women, there is then a 10% chance that a t-test would conclude that men are taller. This is an exact probability. This Fisher test shows us that—based on these six observations—we cannot conclude that men are taller than women.Footnote 20
For our sample, there are too many observations to check all possible reshuffles of the data. In this case, one can randomly draw a set of these (in our case we took 5000 reshuffles, or ‘permutations’) and use the distribution of the resulting t-statistics to investigate how likely the observed value is to occur. Because of this Monte-Carlo resampling, p values are estimated with a margin of error. In cases where the upper bound of the 95% confidence interval for the p value exceeded the chosen size of the test, we therefore increased the number of replications until the standard error of p was below 0.0015.
Because this test is based on exact statistics, the numbers of observations needed is much lower than in traditional parametric and non-parametric tests. For given sample size, the test has the highest power in comparison to related tests (Siegel Reference Siegel1956; Moir Reference Moir1998). Moir (Reference Moir1998) reports a Monte-Carlo study that shows very reliable results for as few as eight observations per treatment category. The smallest cell count we base our tests on is 16.
The Amsterdam sessions
We ran a related experiment at the CREED laboratory in Amsterdam in June, 2015. The main purpose of this study is to investigate the physiological mechanisms involved in the effects of status ranking. For this reason, we also gathered saliva samples. Otherwise, the sessions and treatments were structured exactly like in the Barcelona experiment. The results of the Amsterdam experiment will be presented in a separate study. We thank our co-author Carsten de Dreu for agreeing to let us report some behavioral findings here.
96 subjects participated in eight sessions (four CF-PR and four SR). Adding these to the Barcelona data gives us 236 observations and cell counts between 23 and 69. Figure 7 shows the observed numbers of attempts and performance. By and large, the results mirror those observed in Barcelona alone.
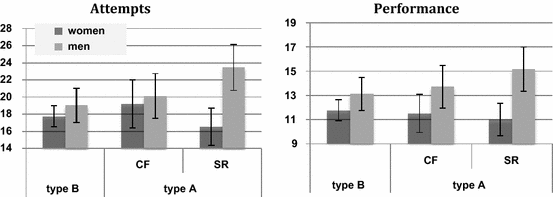
Fig. 7 Attempts and Performance
Both for attempted summations and performance, when there is social-status ranking, the difference between men and women is highly significant (PtT, p < 0.01, N = 58 in both cases). The biggest difference between Figs. 7 and 4 in the main text appears to be that a (smaller) gender difference may also exist for types B and A-CF. For attempts, the differences observed in Fig. 7 are not significant, however (PtT, p = 0.25, N = 119 for type B; PtT, p = 0.66, N = 60 for type A-CF). For performance, the gender effects are marginally significant (PtT, p = 0.09, N = 119 for type B; PtT, p = 0.09, N = 60 for type A-CF).
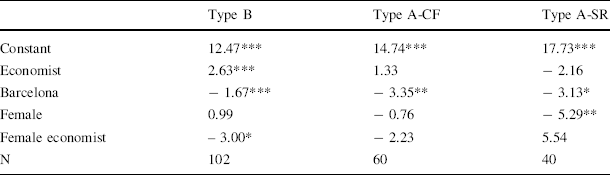
When aggregating the data across the two locations, one needs to take into account that there were differences between the two subject pools. In particular, Dutch participants were across-the-board better at doing the summation task and relatively more economists participated in Amsterdam than in Barcelona. Because such differences might interact with gender effects, we ran linear regressions of performance (i.e., the number of correct summations) on a series of background variables, including gender. We did so separately for each type of player. The results are presented in Table 4.
Table 4 Performance
|
Type B |
Type A-CF |
Type A-SR |
|
|---|---|---|---|
|
Constant |
12.47*** |
14.74*** |
17.73*** |
|
Economist |
2.63*** |
1.33 |
− 2.16 |
|
Barcelona |
− 1.67*** |
− 3.35** |
− 3.13* |
|
Female |
0.99 |
− 0.76 |
− 5.29** |
|
Female economist |
– 3.00* |
− 2.23 |
5.54 |
|
N |
102 |
60 |
40 |
Cells report the coefficients of linear regressions of the number of correct summations on the independent variables depicted in the rows
*/**/***Depicts statistical significance at the 1%/5%/10%-level. The total number of observations is reduced due to missing observations on background variables
These results provide further evidence of the effects observed in the Barcelona experiment. After correcting for background variables, we only find significant gender differences when participants were subjected to social-status ranking. There are no gender effects in performance when subjects do not report their score to anyone, nor when they each report to different C-players. When there is ranking of social status, women perform much worse than men. The marginal effect is more than five fewer correct summations. The results also show that Spanish participants have lower performance than the Dutch in all roles.
All in all, the additional data from Amsterdam provide further evidence that our conclusions in the main text cannot be attributed to the numbers of observations.


 Open access