


1 Introduction
In the behavioral sciences, scholars have invoked loss aversion to explain behavioral patterns that appear to contradict traditional economic theories (Kahneman & Tversky, Reference Kahneman and Tversky1979; Thaler & Johnson, Reference Thaler and Johnson1990; Hardie et al., Reference Hardie, Johnson and Fader1993; Haigh & List, Reference Haigh and List2005; Jarrow & Zhao, Reference Jarrow and Zhao2006; Looney & Hardin, Reference Looney and Hardin2009; Chrisman & Patel, Reference Chrisman and Patel2012). For a loss-averse individual, the disutility of a loss is larger than the utility of an equivalent gain. Although the evidence base for loss aversion has been challenged [e.g., Walasek and Stewart (Reference Walasek and Stewart2015), Gal and Rucker (Reference Gal and Rucker2018) and Yechiam (Reference Yechiam2019)], scholars and practitioners working in the private and public sectors have argued that loss aversion can be harnessed to induce behavioral changes (Convery et al., Reference Convery, McDonnell and Ferreira2007; Thaler & Sunstein, Reference Thaler and Sunstein2008; Jakovcevic et al., Reference Jakovcevic, Steg, Mazzeo, Caballero, Franco, Putrino and Favara2014; Homonoff, Reference Homonoff2018).
One application is the loss-framed incentive contract, in which incentives are framed as losses from an earnings benchmark rather than as gains from a zero earnings default (Hossain & List, Reference Hossain and List2012; Imas et al., Reference Imas, Sadoff and Samek2016). For example, rather than offer a worker $1 for every unit of output, a firm can offer a loss-framed contract that pays workers $B for a performance benchmark of B units from which $1 would be subtracted for every unit short of the benchmark. As long as the worker does not exceed the benchmark, the contracts pay the same for a given level of performance. Given this equivalency, traditional economic theory predicts no difference in expected productivity under the two contracts. The theory of loss aversion, however, assumes workers assess outcomes relative to reference points, which differ under the two contracts. Loss-averse workers will work harder to avoid losses from $B than to achieve similar gains from $0 in the gain-framed contract.
Consistent with this prediction, 21 of the 26 experiments that contrast productivity under loss-framed and gain-framed contracts report that loss-framed contracts induce greater productivity (Fig. 1). The average effect is 0.19 SD, with a third of the studies reporting effect sizes of about a half standard deviation (SD) or larger. Even after weighting the studies by the precision of their estimates in a meta-analysis, the summary estimated average effect size is 0.16 SD.
Yet despite the experimental evidence pointing to a substantial productivity impact from a simple change in framing, loss-framed contracts are rare outside behavioral science experiments. If the impacts of loss-framed contracts were only observed in cases in which workers received the benchmark earnings up-front, a plausible explanation is that employers find it costly, financially or socially, to claw back the lost earnings from workers. Yet more than half of the experiments do not endow the workers with the earnings in advance; they simply change the contract wording. We can detect no difference in the estimated effect sizes between studies that advance the earnings and those that do not
 ; see Sect. 2.2.2. In other words, with little cost, loss-framed contracts appear to be able to increase effort exerted by workers (or other agents, such as citizens targeted by government programs that aim to incentivize the supply of positive externalities). Indeed, this promise has inspired some behavioral scientists to encourage private and public sector actors to adopt loss-framed contracts. For example, in an incentive program to encourage South Africa citizens to exert more effort to drive carefully, the designers framed the incentives as losses (“loss aversion lotteries”) because people have a “tendency to be especially troubled by the risk of losing things that already belong to them.”Footnote 1
We postulate three reasons why, despite the abundance of evidence for productivity gains associated with loss-framed contracts, there is a paucity of such contracts in the private and public sectors: (1) the estimates that form the evidence base exaggerate the true effects or are not externally valid; (2) workers prefer gain-framed contracts, and thus any productivity gains at the intensive margin may be more than offset by increased costs at the extensive margin (i.e., employers offering gain-framed contracts attract more workers); and (3) the framing effect does not persist over time (most studies observe behavior for short time periods). In our study, we focus on the first two reasons and find evidence consistent with them both.
In our meta-analysis, we observe that the average estimated effect masks substantial heterogeneity in effect sizes between laboratory and field experiments. Whereas laboratory experiments suggest that loss framing increases productivity by nearly 0.33 SD, the summary effect size for field experiments is 0.02 SD (Fig. 1). The laboratory experiment estimates are also much more variable, and thus the summary effect is much less precisely estimated among the laboratory experiments. Whether the difference between laboratory and field experiments reflects different types of workers, different types of working environments, or publication biases, these patterns imply that real-world organizations may expect more modest impacts from loss-framed contracts than implied by the academic literature.
To shed more light on the performance of loss-framed contracts and worker preferences for these contracts, we designed a real effort laboratory experiment in which workers had an opportunity to select their contract after working under both contract types. In the experiment, workers were randomized to work under a loss-framed contract and then a gain-framed contract, or vice-versa (i.e., within-worker design). Our estimated effect size of 0.12 SD is roughly two-fifths the summary effect size of prior laboratory experiments and closer to the summary effect size from field experiments.
Furthermore, when given the opportunity to choose the contract framing, only one in five workers chose the loss-framed contract. Three out of four workers chose the gain frame, and the rest reported indifference. This pattern, in which a minority of workers report preferring the loss frame, is consistent with prior claims (Lazear, Reference Lazear1991), survey studies (Tannenbaum et al., Reference Tannenbaum, Valasek, Knowles and Ditto2013; Evers et al., Reference Evers, Inbar, Blanken and Oosterwijk2017), and two field experiments (Brownback & Sadoff, Reference Brownback and Sadoff2020; Van der Stede et al., Reference Van der Stede, Wu and Wu2020). However, two other incentivized experiments report that workers prefer loss-framed contracts (Imas et al., Reference Imas, Sadoff and Samek2016; de Quidt, Reference de Quidt2018). In Sect. S.2.1, we show how the designs and preference metrics used by these two studies can mask a majority preference for gain-framed contracts.
Furthermore, we observe that the loss-framed contract effect is only detectable among the minority of workers who prefer the loss-framed contract. The estimated effect among the rest of the workers is indistinguishable from zero, in both practical and statistical senses. If the loss-framed-contract-preferring workers were more productive than the average worker, employers could offer loss-framed contracts to screen for productive workers. However, we find that loss-frame-contract-preferring workers are less productive under the gain-framed contract; a loss-framed contract only brings their average performance up to the average performance of the other workers. Even if the loss-framed contract cannot serve as a screen for high-productivity workers, it may serve as a commitment device for low-productivity workers (Imas et al., Reference Imas, Sadoff and Samek2016). To exploit this commitment device, however, an employer would have only two options. It could offer two types of contracts simultaneously within the organization and let workers select their preferred contract. Or it could separate its operations into two units, each offering a different contract. In many contexts, the organizational complexities and fixed costs implied by such strategies could easily dominate the modest performance benefits from loss-framed contracts.
Our experimental results also suggest that the difference between the summary effect size estimates from laboratory and field experiments may not be an artifact of the laboratory context per se, but instead may arise from the mix of underpowered designs and publication bias. Underpowered designs produce highly variable estimated effect sizes. This variability yields an exaggerated picture of the true effect size when combined with a bias against publishing estimates that are statistically insignificant or estimates of an unanticipated sign. Adjusting for this bias through a simple trim-and-fill method yields a summary effect size for laboratory experiments of 0.02 SD, which matches the summary effect size for field experiments.
In summary, our meta-analysis and experimental results imply that the effects of loss-framed contracts on productivity may be real. Yet these effects are also likely to be, on average, modest and heterogeneous in ways that are difficult to exploit in a cost-effective manner. In the next section, we present the meta-analysis. We present our experimental design and results in Sect. 3. In Sect. 4, we discuss our results and outline paths for future research.
2 Meta-analysis
2.1 Methods
The meta analysis was performed in R using the package meta (Schwarzer et al., Reference Schwarzer, Carpenter and Rücker2015).
2.1.1 Inclusion criteria
We sought to identify all studies, published or unpublished, that have the following features: (1) an experimental design in which (a) isomorphic loss-framed and gain-framed incentive contracts were (b) randomized within or across workers, providing an unbiased estimator of the average effect of loss-framed contracts rather than gain-framed contracts (this criterion rules out, for example, an early study (Luft, Reference Luft1994) that allowed workers to choose their contract and a recent study (de Quidt, Reference de Quidt2018) that allowed workers to opt out); (2) a real or stated behavioral outcome measure of productivity; and (3) publicly accessible data or sufficient statistical details in the published article to allow for inclusion of the study in a meta-analysis. If an article provided neither data nor sufficient details, we contacted the authors to obtain the data or estimates of the requisite parameters for inclusion in the meta-analysis (see next section for a description of required inputs). Although we did not explicitly exclude un-incentivized experimental designs (i.e., hypothetical choices), all studies that met the inclusion criteria also used incentivized designs.
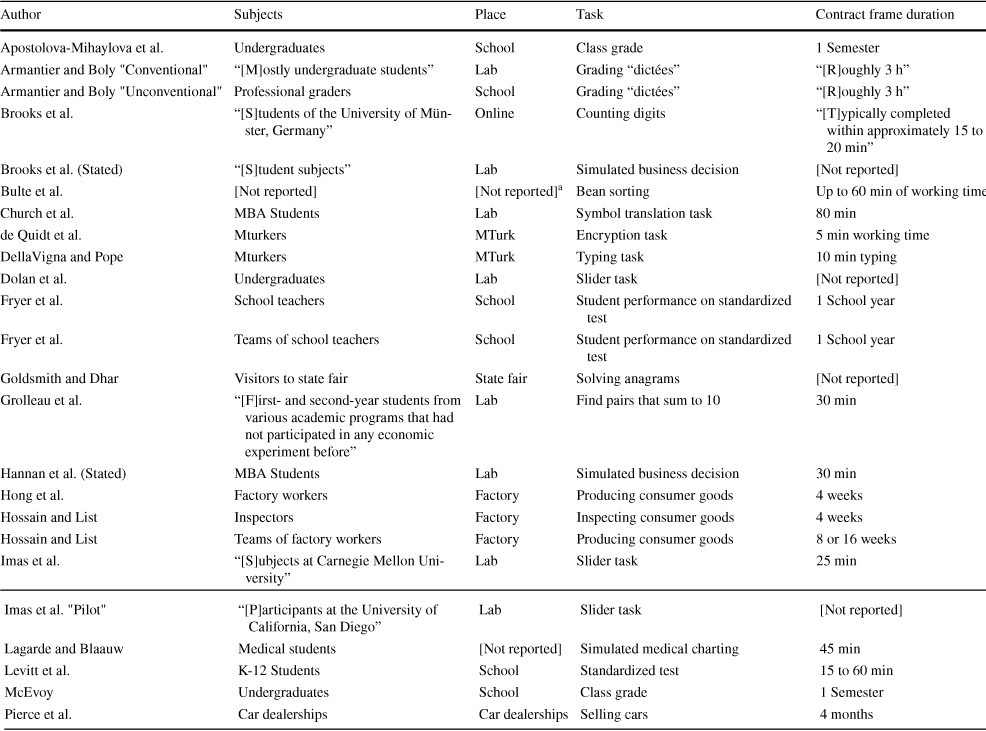
Using Google Scholar, we searched for publications that met our inclusion criteria by using combinations of the terms “loss framing” or “penalty” and “real effort” or “work”. When we found publications that met one or more of the inclusion criteria, we used their bibliographies and Google Scholar’s list of citations for the publication to identify additional publications that met the inclusion criteria. In all, 134 publications were identified as warranting closer investigation to see if they met all three criteria. The criteria were applied sequentially and the evaluation stopped as soon as the publication failed to meet an inclusion criterion. Additional publications that met our criteria were identified by readers of earlier versions of our manuscript, including a referee, or audience members at presentations. Twenty publications containing 26 experiments met our inclusion criteria, 18 of which used a between-subject design (median number of subjects is 158). Table 1 reports how many studies were excluded by each criterion. The complete list of 114 excluded publications is available at https://osf.io/3nqgd/.
Table 1 Number of publications excluded by each criterion
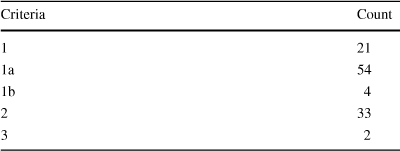
|
Criteria |
Count |
|---|---|
|
1 |
21 |
|
1a |
54 |
|
1b |
4 |
|
2 |
33 |
|
3 |
2 |
Table 2 Details of meta-analysis studies
|
Author |
Subjects |
Place |
Task |
Contract frame duration |
|---|---|---|---|---|
|
Apostolova-Mihaylova et al. |
Undergraduates |
School |
Class grade |
1 Semester |
|
Armantier and Boly "Conventional" |
“[M]ostly undergraduate students” |
Lab |
Grading “dictées” |
“[R]oughly 3 h” |
|
Armantier and Boly "Unconventional" |
Professional graders |
School |
Grading “dictées” |
“[R]oughly 3 h” |
|
Brooks et al. |
“[S]tudents of the University of Münster, Germany” |
Online |
Counting digits |
“[T]ypically completed within approximately 15 to 20 min” |
|
Brooks et al. (Stated) |
“[S]tudent subjects” |
Lab |
Simulated business decision |
[Not reported] |
|
Bulte et al. |
[Not reported] |
[Not reported]a |
Bean sorting |
Up to 60 min of working time |
|
Church et al. |
MBA Students |
Lab |
Symbol translation task |
80 min |
|
de Quidt et al. |
Mturkers |
MTurk |
Encryption task |
5 min working time |
|
DellaVigna and Pope |
Mturkers |
MTurk |
Typing task |
10 min typing |
|
Dolan et al. |
Undergraduates |
Lab |
Slider task |
[Not reported] |
|
Fryer et al. |
School teachers |
School |
Student performance on standardized test |
1 School year |
|
Fryer et al. |
Teams of school teachers |
School |
Student performance on standardized test |
1 School year |
|
Goldsmith and Dhar |
Visitors to state fair |
State fair |
Solving anagrams |
[Not reported] |
|
Grolleau et al. |
“[F]irst- and second-year students from various academic programs that had not participated in any economic experiment before” |
Lab |
Find pairs that sum to 10 |
30 min |
|
Hannan et al. (Stated) |
MBA Students |
Lab |
Simulated business decision |
30 min |
|
Hong et al. |
Factory workers |
Factory |
Producing consumer goods |
4 weeks |
|
Hossain and List |
Inspectors |
Factory |
Inspecting consumer goods |
4 weeks |
|
Hossain and List |
Teams of factory workers |
Factory |
Producing consumer goods |
8 or 16 weeks |
|
Imas et al. |
“[S]ubjects at Carnegie Mellon University” |
Lab |
Slider task |
25 min |
|
Imas et al. "Pilot" |
“[P]articipants at the University of California, San Diego” |
Lab |
Slider task |
[Not reported] |
|
Lagarde and Blaauw |
Medical students |
[Not reported] |
Simulated medical charting |
45 min |
|
Levitt et al. |
K-12 Students |
School |
Standardized test |
15 to 60 min |
|
McEvoy |
Undergraduates |
School |
Class grade |
1 Semester |
|
Pierce et al. |
Car dealerships |
Car dealerships |
Selling cars |
4 months |
aWhile Bulte et al. do not report the location of the study in their published paper, their IRB protocol states “Data collection will occur in the lab”. We thus categorize it as a laboratory experiment
The label ‘stated’ for two of the laboratory experiment identifies the two experiments that used stated effort rather than real effort
Table 2 lists the included studies and their attributes, including the subjects, setting and task. Some of the publications in the meta-analysis report multiple effect sizes. Hossain and List (Reference Hossain and List2012), Armantier and Boly (Reference Armantier and Boly2015), and Imas et al. (Reference Imas, Sadoff and Samek2016) report on multiple experiments within the same publication. Levitt et al. (Reference Levitt, List, Neckermann and Sadoff2016), and de Quidt et al. (Reference de Quidt, Fallucchi, Kölle, Nosenzo and Quercia2017) report multiple treatments. Where we report multiple effect sizes from a study, we distinguish each effect with a term in quotation marks that matches the term used by the authors to describe the experiment or treatment. Table S.1 in the Supplemental Materials reports which estimates within the included studies were excluded and why.
2.1.2 Estimator
We standardized the treatment effects reported in each study by the pooled standard deviation. To calculate this standardized mean difference (SMD), we employed Hedges (Reference Hedges1981, Reference Hedges1982) method, which corrects for bias in the estimation of standard error (meta’s default). Thus, all estimated treatment effects are reported in proportions of a standard deviation. To calculate a 95% confidence interval (CI) of the standardized mean difference, we multiply the standard error of the SMD by the Z score.
To estimate a summary effect size and its confidence interval, we used an empirical Bayes regression estimator, which employs a random-effects model for both the subgroup effect and differences within the subgroup (Raudenbush & Bryk, Reference Raudenbush and Bryk1985). van der Linden & Goldberg (Reference van der Linden and Goldberg2020) have shown the empirical Bayes method is superior to models for which random effects are only employed for the within-subgroup differences. In contrast to a fixed-effects estimator, the random-effects estimator does not assume that the (unobserved) true treatment effect is constant, but rather permits it to vary from study to study, i.e. it allows the effect of loss-framed contracts to vary according the particulars of the study, e.g. setting, task contract details. Thus the summary effect we seek to estimate is not a single true treatment effect, but rather the mean of the population of true treatment effects (i.e., the studies in the meta-analysis are assumed to be a random sample from this population). We allow for a distribution of treatment effects because prior studies have argued that loss-framed contracting effects are likely to be heterogeneous. For example, loss-framed contracting may be ineffective when the goal is unattainable (Brooks et al., Reference Brooks, Stremitzer and Tontrup2017) or in tasks requiring special knowledge to succeed (Luft, Reference Luft1994; Goldsmith & Dhar, Reference Goldsmith and Dhar2011). For details on the way in which the random-effects estimator weighs observations and estimates standard errors, as well as the assumptions it makes with regard to meta-analysis methods, see Schwarzer et al. (Reference Schwarzer, Carpenter and Rücker2015).
We estimate a summary effect size for all 26 estimates, as well as effect sizes conditional on whether the studies were laboratory or field experiments. As other experimentalists have done (Gangadharan et al., Reference Gangadharan, Jain, Maitra and Vecci2021), we create a third category for lab-in-the-field, which are on the continuum between laboratory and field experiments (we thank the editor for suggesting this categorization). To test the null of homogeneous effects across studies within the overall group or subgroups (laboratory, field or lab-in-the-field), we employ the method proposed by Higgins and Thompson (Reference Higgins and Thompson2002). First, we calculate the squares of the differences between each study estimate and the summary estimate. Then we find their weighted sum, Q, and the probability that Q resulted from a chi-square distribution with (number of studies-1) degrees of freedom. We then calculate S, the sum of the fixed-effects weights minus the sum of the square of the weights divided by the sum. Tau Squared,
 , is the difference between Q and the degrees of freedom divided by S. The test across subgroups is analogous, with the subgroups’ estimates in place of the studies’ estimates. The Q for the test across subgroups is the weighted sum of the squared differences between each subgroup’s estimate and the joint estimate. There are three subgroups, so there are two degrees of freedom.
 is used in place of
 .
.
 is the sum of squared errors
 scaled to lie between 0 and 100%. Higher values of
 imply more heterogeneity.
2.2 Results
Figure 1 plots the standardized treatment effect estimates, along with their respective CIs. The summary estimated effect from loss-framed contracts is an increase in performance by about one-sixth of a standard deviation: 0.16 SD (95% CI [0.05, 0.27]). This estimated effect, however, may mask heterogeneity in effects conditional on the study designs.
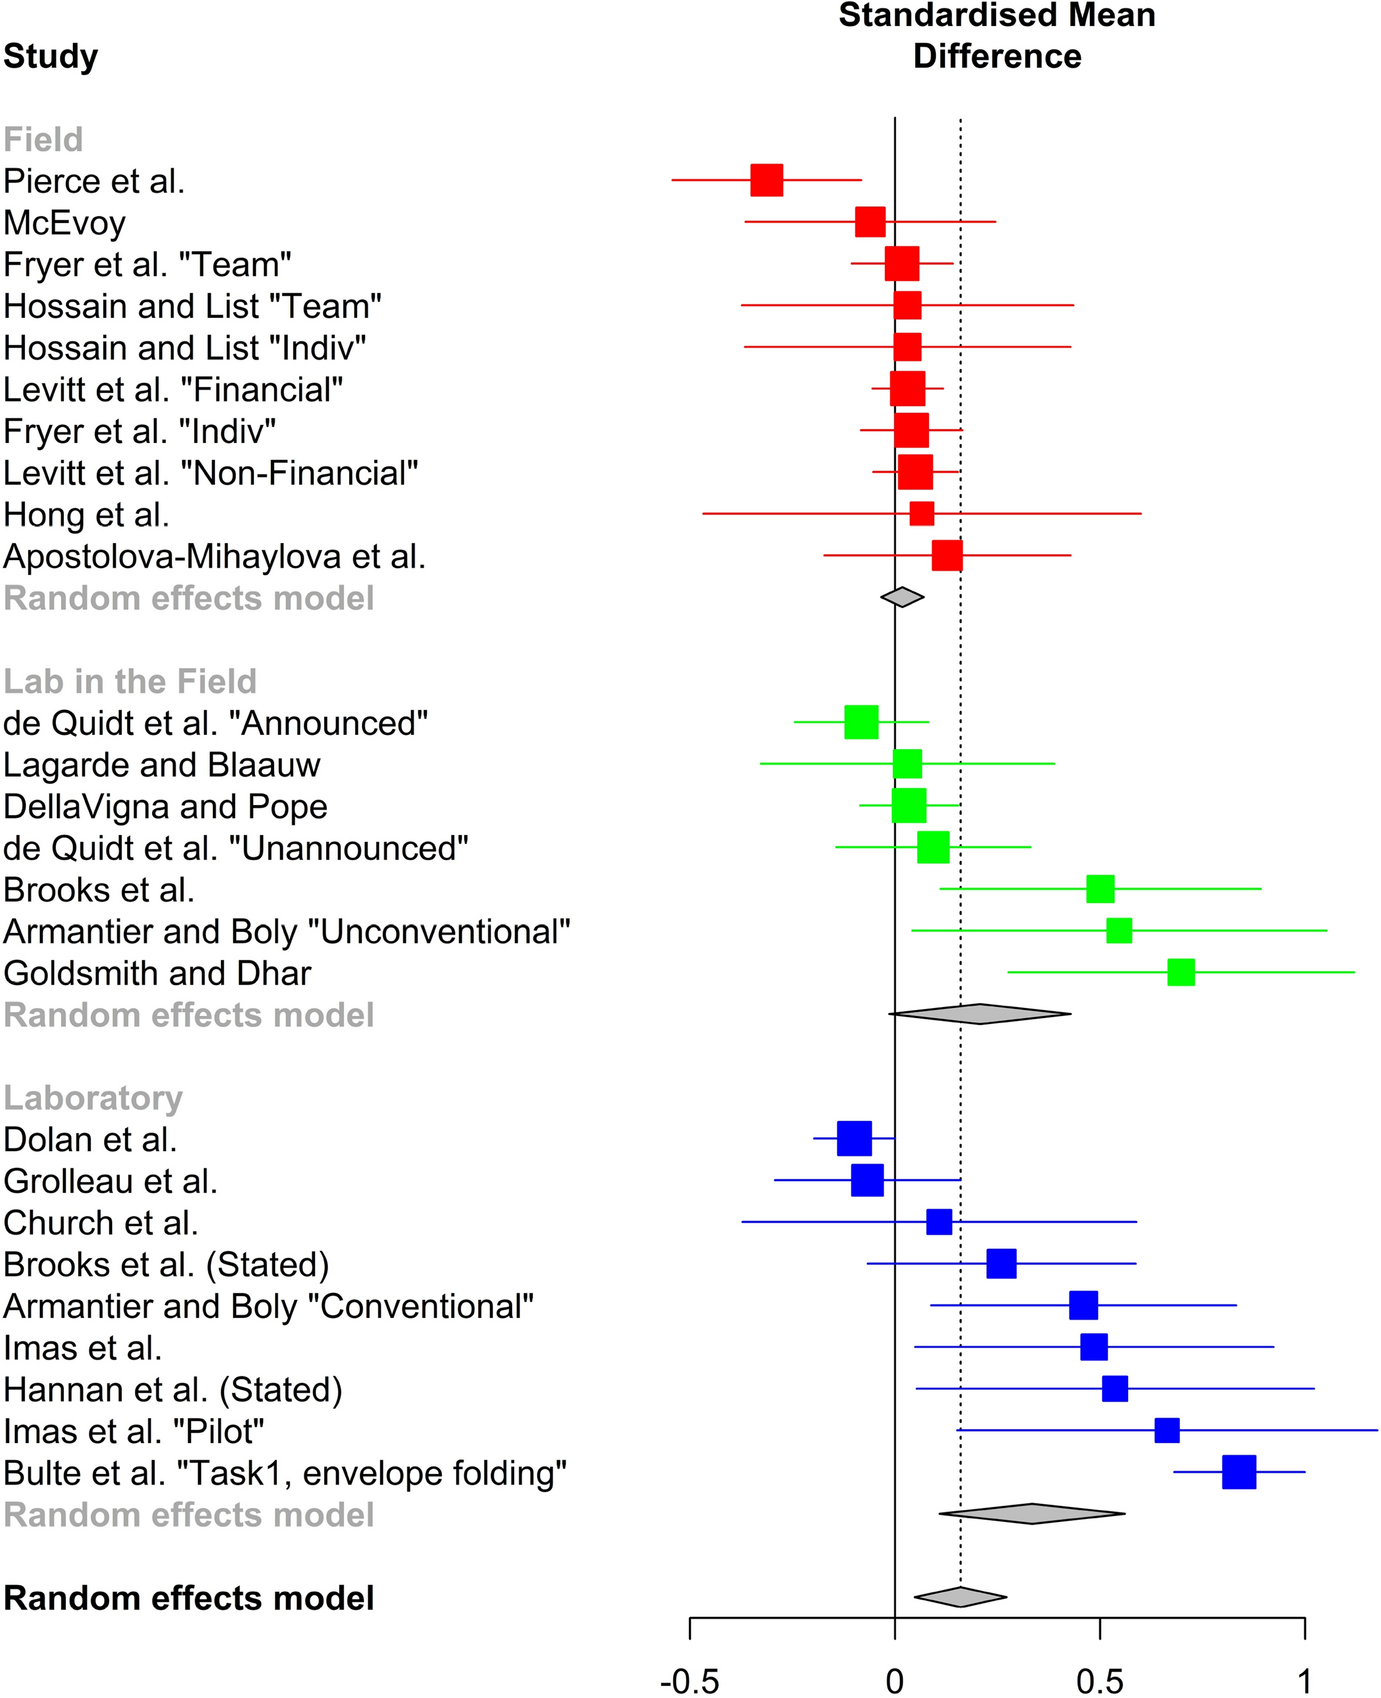
Fig. 1 Meta-analysis of experimental studies estimating the effect of loss-framed contracts on productivity (effort). The squares represent the mean estimated effects for each experiment, standardized as fractions of the pooled standard deviation. Larger squares imply larger sample sizes. Lines through the squares represent 95% confidence intervals. The centers of the parallelograms represent the estimated summary effect sizes, by type of experiment and overall (dotted vertical line). The width of the parallelograms represent the 95% confidence interval. See Methods for explanation of study designations in quotation marks
2.2.1 Heterogeneity: laboratory versus field experiments
An important design attribute is whether the experiment was conducted in a laboratory setting or in the field. Some prior publications have questioned the external validity of laboratory experiments, particularly those that, like some of the publications in Fig. 1, use student workers (Levitt & List, Reference Levitt and List2007; Galizzi & Navarro-Martinez, Reference Galizzi and Navarro-Martinez2018). One might ask whether a framing applied to subjects engaged in small-stakes labor in front of an experimenter in a laboratory might affect behavioral mechanisms in ways that differ from naturally occurring field contexts with employees or contractors.
To shed light on this question, Fig. 1 also presents estimated treatment effects conditional on whether the studies were field experiments, laboratory experiments or lab-in-the-field. In two of the laboratory experiments (Hannan et al., Reference Hannan, Hoffman and Moser2005; Brooks et al., Reference Brooks, Stremitzer and Tontrup2012), subjects do not engage in real effort but choose “work levels” that result in variable payoffs (labeled “(Stated)” in Fig. 1). Removing these two studies does not change our inferences.
For laboratory experiments, the summary estimated effect size is 0.33 SD (95% CI [0.11, 0.56]). For lab-in-the-field, the summary estimated effect size is 0.21 SD (95% CI [− 0.01, 0.43]). In contrast, the summary effect size for field experiments is 0.02 SD (95% CI [− 0.03, 0.07]). The differences across categories are statistically significant
 . Moreover, a measure of variation in effect size estimates across studies (
 ) is substantially larger among the laboratory experiments. In fact, in a test of the null of homogeneity in effect sizes across studies, we can easily reject the null for laboratory experiments
 and the intermediate lab-in-the-field category
 , but not for field experiments
 .
.
One of the laboratory studies is not a peer-reviewed article, but rather was published as part of a government report that includes the results of many experiments (Dolan et al., Reference Dolan, Metcalfe and Navarro-Martinez2012). Given that one has to look carefully to find the loss-framed contract experiment in the report, it is not surprising that this experiment is not typically cited by later articles in Fig. 1. Another laboratory study (Grolleau et al., Reference Grolleau, Kocher and Sutan2016) was missed in an earlier version of this meta-analysis because the result that loss-framing has a noisy, negative estimated effect on productivity is not apparent from the title, abstract and conclusions, which focus on how loss-framing increases cheating. Thus, when most scholars think about the loss-framed incentive contract literature, these two studies are not typically part of the mix. Removing them from the meta-analysis (see Fig. 6) yields a larger summary estimated effect size for laboratory experiments of 0.52 SD (95% CI [0.33, 0.71]) and much lower measure of heterogeneity
 . The summary estimated effect size for all studies increases to 0.19 SD (95% CI [0.07, 0.30]).
2.2.2 Heterogeneity: piece-rate versus threshold contract designs
The effect of a loss-framed contract may be heterogeneous conditional on the details of the contract. Specifically, contracts can state either a single “threshold” or a “piece-rate”. In the former, unless a worker achieves a threshold, she incurs a penalty. In the latter, the worker is penalized the piece-rate for every unit her output is under a target quota. For instance, a threshold contract might state that unless a worker produces 20 units she will be penalized $10; In contrast, a piece-rate contract might state that the worker is penalized $1 for every unit she falls short of producing 20. A worker who produced 15 units would be penalized $10 under the threshold contract, but only $5 under the piece-rate contract.
Figure 2 presents estimated treatment effects conditional on whether the experiment used piece-rate or threshold contracts. For piece-rate contracts, the summary estimated effect size is 0.15 SD (95% CI [− 0.01, 0.31]). For threshold contracts, the summary estimated effect size is: 0.17 SD (95% CI [0.01, 0.33]). Supplement Fig. S.4 has the full meta-analysis.
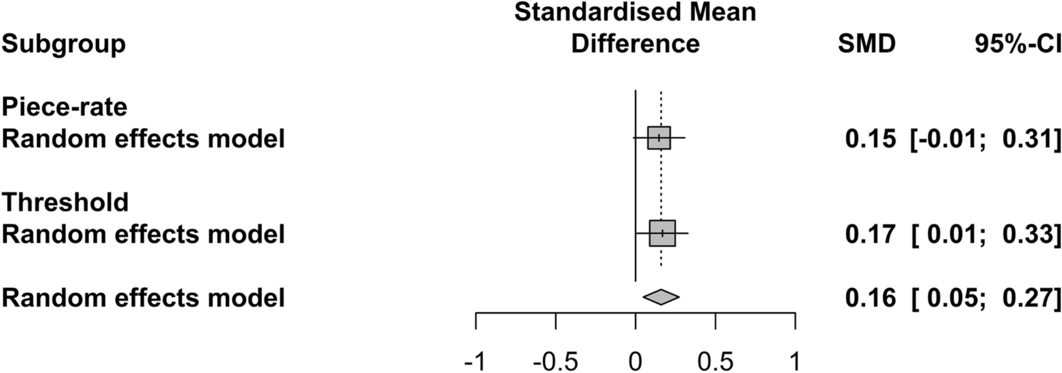
Fig. 2 Comparison of effect size between piece-rate and threshold contracts
2.2.3 Heterogeneity: loss-framed contracts that pay in advance versus post-effort
Figure 3 presents estimated treatment effects conditional on whether the workers in the loss-framed contract received the reward in advance rather than merely been told they would get the reward after expending effort. The estimated effect size is larger when the workers get the reward in advance: 0.24 SD (95% CI [0.01, 0.46]) versus 0.08 SD (95% CI [− 0.02, 0.17]), but the difference is not statistically significant
 . Figure S.5 has the full meta-analysis.
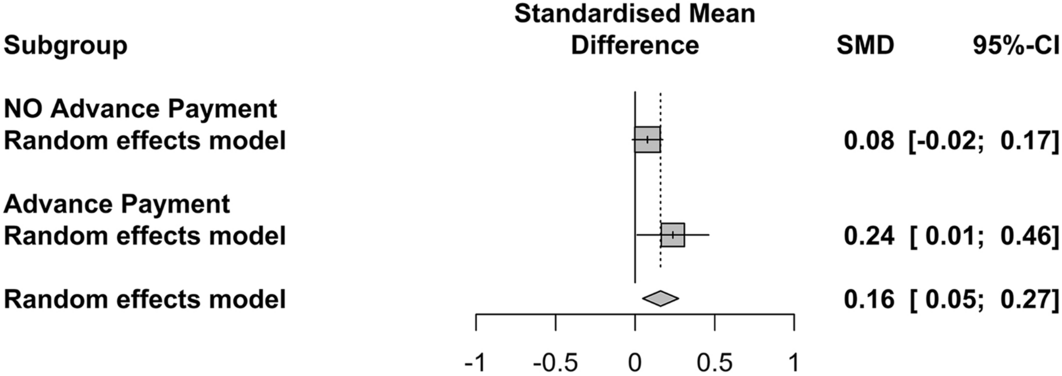
Fig. 3 Comparison of effect size of advanced payments
2.2.4 Potential publication biases
In Fig. 4, the study effect sizes are displayed in a funnel plot that illustrates the relationship between effect sizes and standard errors. In the absence of publication bias or systematic heterogeneity, 95% of the data would be expected to lie within the funnel-shaped lines radiating from the top. An asymmetric distribution reflects the possibility of publication bias or a systematic difference between small and large studies.
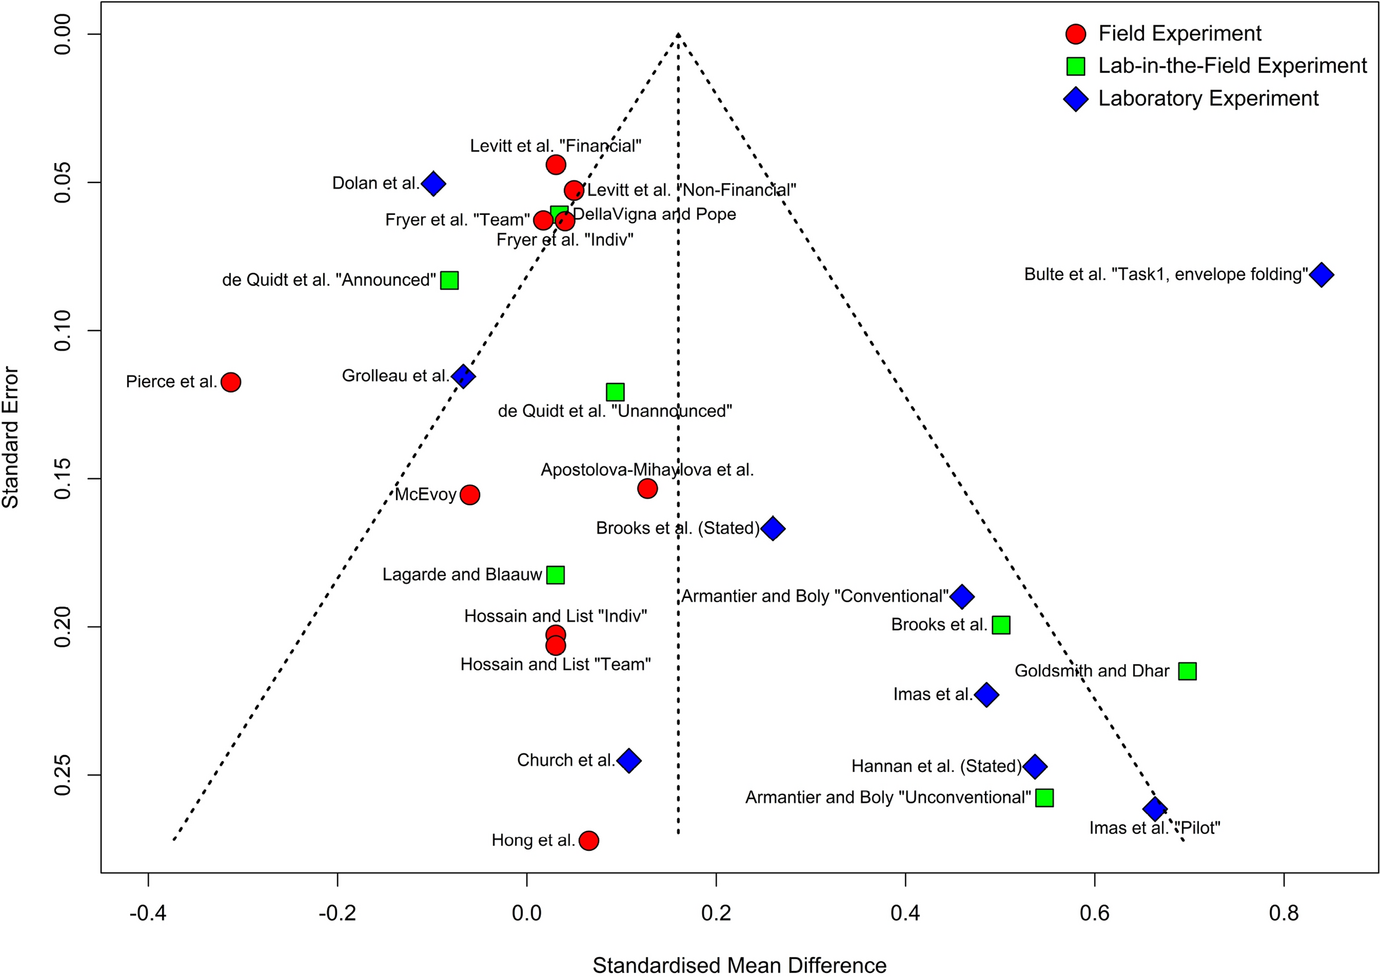
Fig. 4 Funnel plot of estimated effect sizes. Estimated standardized effect sizes and their standard errors. The dotted vertical line is the summary estimated effect from loss-framed contracts
Visual inspection of the plot reveals a clear asymmetry, with a shift toward larger estimated treatment effects as the standard error gets larger. To supplement the visual inspection, we run two popular tests that test the null hypothesis of no asymmetry: the regression-based Thompson–Sharp test (Thompson & Sharp, Reference Thompson and Sharp1999), and the rank-correlation Begg-Mazumdar test (Begg & Mazumdar Reference Begg and Mazumdar1994). Both reject the null of no asymmetry (
 ). We also implement the non-parametric Duvall-Tweedie trim-and-fill method (Duval & Tweedie Reference Duval and Tweedie2000a, Reference Duval and Tweedie2000b) and find evidence of asymmetry (see Supplement 2.1 for details on tests and results).
The less precisely estimated effects come from studies with smaller sample sizes. We know of no theory that predicts that small studies will systematically yield larger estimated treatment effects. In our meta-analysis, however, the small studies are mostly laboratory studies. Thus one explanation for the asymmetry is that the loss-framed contracting is more effective in laboratory experiments, implying that the results in laboratory environments are not generalizable to the field.
Another explanation for the asymmetry is publication bias. There is a widely discussed bias in all of science, including the behavioral sciences, to produce, submit, and publish results that are large in magnitude and statistically significant at conventional thresholds (e.g. Rosenthal, Reference Rosenthal1979; Ioannidis, Reference Ioannidis2005; Duval & Tweedie, Reference Duval and Tweedie2000a; Duval & Tweedie, Reference Duval and Tweedie2000b; Simmons et al., Reference Simmons, Nelson and Simonsohn2011; Maniadis et al., Reference Maniadis, Tufano and List2014; Miguel et al., Reference Miguel, Camerer, Casey, Cohen, Esterling, Gerber, Glennerster, Green, Humphreys and Imbens2014; Simonsohn et al., Reference Simonsohn, Nelson and Simmons2014; Open Science Collaboration, 2015; Baker, Reference Baker2016). In other words, the difference between the estimated effects of laboratory and field experiments in Fig. 1 may not reflect weak external validity of laboratory experiments, but rather a stronger publication bias among laboratory experiments. Such a bias is plausible: field experiments, on average, are more novel and costly than laboratory experiments, and thus may be more likely to be published even when the treatment effect is small or statistically insignificant. Moreover, laboratory studies may be underpowered compared to field studies. The median sample size for the laboratory experiments is 114 and it is 120 for the lab-in-the-field experiments. In contrast, the median sample size for the field experiments is 236. If laboratory experiments are only published when they yield statistically significant results, and such studies tend to be underpowered, then the only estimates that will appear in the published literature will be exaggerated compared to their true values (so called Type M error)—because if the true treatment effects were small, only inflated estimates will pass the statistical significance threshold and be published (Button et al., Reference Button, Ioannidis, Mokrysz, Nosek, Flint, Robinson and Munafó2013; Gelman & Carlin, Reference Gelman and Carlin2014; Ioannidis et al., Reference Ioannidis, Stanley and Doucouliagos2017).
When we adjust for potential publication biases, the adjusted summary effect sizes are nearly identical to the summary estimated effect size for field experiments. To adjust for publication biases, we rely on the same trim-and-fill method that we used to detect the publication bias. The method not only detects asymmetry, but also adjusts the summary estimate by “filling” in missing publications to generate symmetry (Fig. S.2; see Supplement 2.1 for details). Note that in the presence of p-hacking, this method may under-adjust for publication bias (Simonsohn et al., Reference Simonsohn, Nelson and Simmons2014). After this adjustment, the estimated summary treatment effect is centered on zero: 0.00 SD (95% CI [− 0.14, 0.14]). Even if we assume that working in the laboratory is fundamentally different from working in the field or that the workers in laboratory studies are different from workers in field studies—and thus the two types of experiments should not be pooled—the trim-and-fill adjustment applied only to the laboratory studies yields a similar summary effect size: 0.02 SD (95% CI [− 0.19, 0.23]).
In conclusion, one’s inferences about the effect of loss-framed contracts on productivity differ greatly depending on whether one uses laboratory or field experiments or whether one adjusts for potential publication biases in laboratory experiments or not. The heterogeneity in effect sizes across laboratory and field experiments could result from a mix of underpowered designs and publication biases among the laboratory experiments or from working conditions within the laboratory experiments that differ from the working conditions in the field experiments. In other words, in a laboratory experiment designed with sufficiently high statistical power and field-like working conditions, the loss-framed contract’s effect size may be more similar to the summary effect size observed in the field experiments. To shed more light on this conjecture, and to explore preferences for contract types, we design a new experiment.
3 Experiment
3.1 Methods
Based on the results from the meta-analysis, we sought an experimental design with three features: (1) laboratory control combined with the realism of a real-effort task that included tradeoffs between working and taking breaks; (2) high statistical power; and (3) an opportunity for workers to express their preferences for framing under informed and incentivized conditions. We chose to use a piece-rate incentive contract because it matches real-world incentive contracts more closely, because there are challenges to designing threshold contracts (see Supplement S.1.2), and because the meta-analysis we conducted at the time provided weak evidence that piece-rate contracts may yield larger treatment effects than threshold contracts. The updated meta-analysis in Fig. 1, which includes more recent studies, shows that there is no difference, economically or statistically, between the two contract designs.
3.1.1 Opportunity costs for real effort
Gächter et al. (Reference Gächter, Huang and Sefton2016) have questioned whether real-effort tasks actually measure effort. Workers might derive utility from the task itself or may not be offered any option during the experiment except to exert effort. In the nine laboratory experiments in the meta-analysis, for example, only Dolan et al. (Reference Dolan, Metcalfe and Navarro-Martinez2012) allowed workers to leave after completing four screens of sliders, and none offered workers any option other than the work activity during the experiment.Footnote 2 In the tax literature, an outside option is routinely offered during the work tasks (Dickinson, Reference Dickinson1999; Blumkin et al., Reference Blumkin, Ruffle and Ganun2012; Kessler and Norton, Reference Kessler and Norton2016) because such options have been shown to affect worker effort (Corgnet et al., Reference Corgnet, Hernán-González and Rassenti2015; Erkal et al., Reference Erkal, Gangadharan and Koh2018).
In our experiment, we use the design of Eckartz (Reference Eckartz2014), which has two features that make behavior in the task more likely to reflect effort in settings outside of the laboratory. First, the task is tedious and thus workers are unlikely to derive utility from the task itself. Second, workers can opt to take paid breaks by pushing a button at the bottom of the screen, as shown in Fig. 5. In our experiment, a break lasted 20 s and workers received USD $0.30 for each break. The break payment value was chosen to make cash payments easier, and the break length was chosen so that taking a break was about a third to a half as profitable as we anticipated working to be. The grid, entry box, and OK button disappeared from the screen for the duration of the break, so that workers could not work on the task while they were on break. The button to take a break was removed from the screen when there were fewer than 20 seconds left in the round to prevent workers from collecting the 30 cents without losing the 20 seconds of work time. Workers could take as many breaks as they wanted (they did take breaks; see supplementary materials). In Eckhart’s study, offering breaks was shown to increase responsiveness to incentive contracts. Blumkin et al. (Reference Blumkin, Ruffle and Ganun2012) and Erkal et al. (Reference Erkal, Gangadharan and Koh2018) employ similar buttons that allow workers to stop or take a breaks.
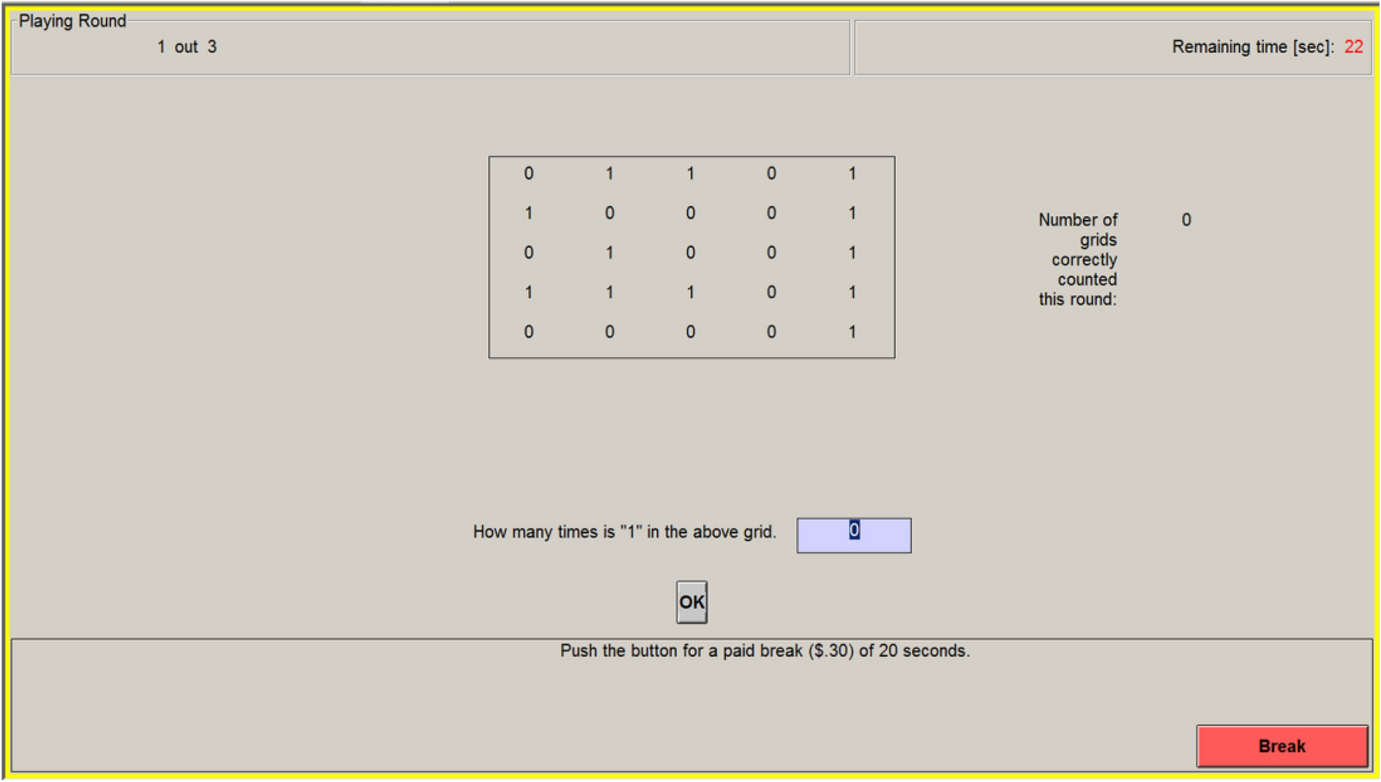
Fig. 5 Screen shot of effort task. Workers were presented with 25 digits in a
 . Each digit was either a “0” or a “1,” chosen at random. Workers were rewarded for entering the correct number of 1s into a box on the screen, and clicking the “OK” button using a mouse. If the worker entered the correct number, the word “Correct” appeared in green at the top of the screen, the number of correctly answered grids displayed to the right of the grid increased by one, and the grid immediately refreshed. If the entry was incorrect, the word “Incorrect” appeared in red at the top of the screen, and the worker stayed on that grid until the correct number was entered
In the gain-framed contract, workers were informed they would be paid USD $0.25 for each correct grid, up to 100, at the end of the round. In the loss-framed contract, workers were paid USD $25.00 in cash at the beginning of the round, and informed that, for each grid they were short of 100, USD $0.25 would be collected from them at the end of the round. Immediate cash payments were used to increase saliency and because of a concern that paper losses, as opposed to real losses, could dilute loss aversion (Imas, Reference Imas2016).
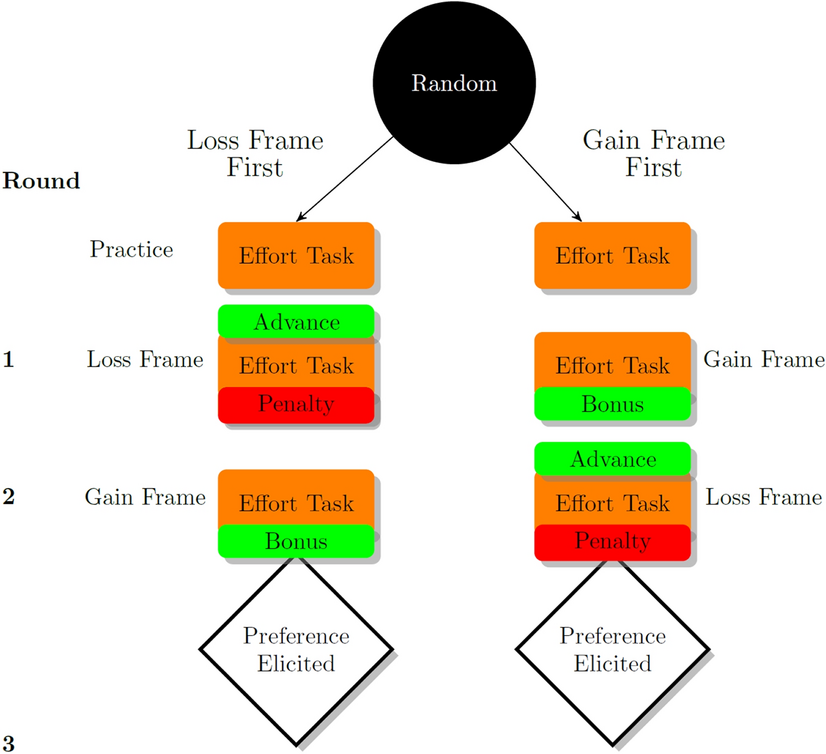
Fig. 6 Experimental design. “Advance” refers to the payment provided in advance, prior to the effort task under a loss-framed contract. “Penalty” refers to the reduction in the advanced payment, based on performance. “Bonus” refers the end-of-round payment, based on performance
The experiment comprised one practice round of work to familiarize workers with the task, followed by three paid rounds (Fig. 6). In the first round, workers worked under one of the contract frames, and in the second round they worked under the other contract frame (randomized order). Then, they were asked under which of the two contract frames they would prefer to work in the third round. Workers were also allowed to enter no preference, in which case they were randomly assigned a contract frame. We do not analyze this third round; it served to incentivize the revelation of workers’ true preferences for contract framing.
3.1.2 Power analysis
We had no strong priors about the mean number of grids that workers could complete in the time allotted or its standard deviation, so we waited until the first three sessions were completed and used the data on the 33 subjects (dropping one worker who spent a whole round on break) to estimate the mean in the gain-framed contract (29.66), its standard deviation (5.74), and the intra-worker correlation between grids completed in the gain-framed contract and grids completed in the loss-framed contract (0.66). We used a simple analytical formula for power, with an adjustment for the within-workers design. We set power equal to 80%, the Type 1 error rate to 0.05, and the minimum detectable effect size equal to the lower bound of the 95% CI of the summary effect for the laboratory experiments in an earlier version of the meta-analysis that included fewer studies (0.16 SD). Those parameters yield a required sample size of 255 workers.
3.1.3 Other details
The experiment was conducted using z-Tree software (Fischbacher, Reference Fischbacher2007). The experiment consisted of one practice round, followed by three paid rounds (Fig. 6), each of 4 minutes in length. After the practice rounds and ensuring that all workers understood the task, workers were informed that there would be three paid rounds and the payment scheme (contract) would be explained before each round. In the first two paid rounds, a worker worked one round under a gain-framed contract and the other round under a loss-framed contract. To control for learning effects, the contract order was randomized at the session level. Order was randomized at the session level, rather than at the worker level, because of concerns about within-session spillovers (interference) among workers: the upfront payment under the loss-framed contract might be observed by gain-framed contract workers and that observation of differential treatment across workers could have affected their productivity.
The experimental sessions were conducted in ExCen (the Experimental Economics Center) laboratory at Georgia State University. Each session lasted between 60 and 75 minutes. Workers earned $23.50 on average. In total, 268 undergraduate-student workers participated (see Table 3 for demographics). Cash was handled immediately before and after each round, a process that is labor-intensive. The experimental protocol required the ratio of staff-to-workers to be constant across sessions. Two sessions (16 workers) in early fall 2016 were run with fewer laboratory personnel than the experimental protocol required and thus were eliminated immediately from the study. If these sessions are included, the estimated effect of loss-framed contracting is reduced by 21% (0.7 rather than 0.9 additional grids; see Result 1). This research was approved by the Institutional Review Board of Georgia State University (Protocol: H16459). All participants gave informed consent of their participation in the study.
Table 3 Demographic characteristics of workers
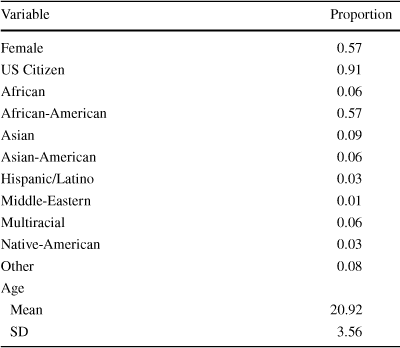
|
Variable |
Proportion |
|---|---|
|
Female |
0.57 |
|
US Citizen |
0.91 |
|
African |
0.06 |
|
African-American |
0.57 |
|
Asian |
0.09 |
|
Asian-American |
0.06 |
|
Hispanic/Latino |
0.03 |
|
Middle-Eastern |
0.01 |
|
Multiracial |
0.06 |
|
Native-American |
0.03 |
|
Other |
0.08 |
|
Age |
|
|
Mean |
20.92 |
|
SD |
3.56 |
3.2 Results
3.2.1 Result 1: Treatment effect of loss-framed contract
The mean number of completed grids was 0.91 higher under the loss-framed contract (paired comparison of means 95% CI [0.18, 1.63]; Table 4), a difference that is statistically significant in a paired t-test
 . Using a covariate-adjusted regression estimator to control for the starting frame and round (Table 6, column 1), the estimated effect is 0.89 (95% CI [0.23, 1.55]. This estimated effect implies a standardized effect size of 0.12 SD, which is about one-third of the summary estimated effect size from prior laboratory experiments (Fig. 1) and within the confidence interval of the trim-and-fit adjusted estimated effect size for laboratory experiments (Sect. 2.2.4). This small estimated treatment effect is not an artifact of the within-subject design: using only the first round data implies an effect size of 0.16 SD. This result suggests that the large difference between the estimated loss-framed contract effects in laboratory and field experiments is more likely an artifact of publication biases and underpowered designs, rather than the low external validity of laboratory experiments.
Table 4 Productivity by frame and round
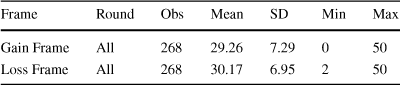
|
Frame |
Round |
Obs |
Mean |
SD |
Min |
Max |
|---|---|---|---|---|---|---|
|
Gain Frame |
All |
268 |
29.26 |
7.29 |
0 |
50 |
|
Loss Frame |
All |
268 |
30.17 |
6.95 |
2 |
50 |
Note that, although loss aversion is the purported mechanism behind the estimated effects in the studies in the meta-analysis, we take no stand on whether or not our framing effect is driven by loss aversion or some other mechanism. For example, the loss-framed contract may induce greater effort through worker preferences for conformity or pro-sociality: the loss-framed contract communicates an expectation that a worker ought to achieve the benchmark performance level and workers seek to comply with that expectation (Brooks et al., Reference Brooks, Stremitzer and Tontrup2012). Our results neither support nor refute the existence of loss aversion. The study was designed to assess the performance of loss-framed contracts.
3.2.2 Result 2: Subjects' contract preferences
When given a choice of working under the gain-framed contract or the loss-framed contract, two-thirds of workers expressed a preference for the gain-framed contract (Table 5).
Table 5 Frame preferences
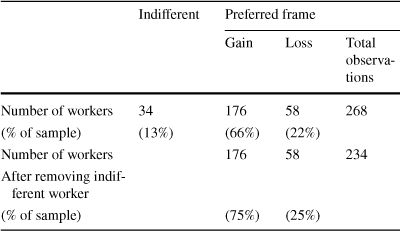
|
Indifferent |
Preferred frame |
|||
|---|---|---|---|---|
|
Gain |
Loss |
Total observations |
||
|
Number of workers |
34 |
176 |
58 |
268 |
|
(% of sample) |
(13%) |
(66%) |
(22%) |
|
|
Number of workers |
176 |
58 |
234 |
|
|
After removing indifferent worker |
||||
|
(% of sample) |
(75%) |
(25%) |
||
3.2.3 Result 3: Heterogeneous treatment effects
The productivity-enhancing effect from loss-framed contracts was concentrated in the subgroup of workers who expressed a preference for the loss-framed contract (Table 6, col. 2). We report treatment effect estimates conditional on whether or not the worker expressed a preference for the loss-framed contract. In the first row is the estimated loss-framed contracting effect conditional on the worker expressing a preference for the gain-framed contract or indifference. The estimated effect is small, 0.18. In contrast, the estimated loss-framed contracting effect for workers who expressed a preference for a loss-framed contract is large (0.18 + 3.28 = 3.46, 95% CI [1.98, 4.94]). As a robustness check, in column 3, we re-estimate the regression, breaking out the small subgroup of workers who expressed indifference. The inferences are identical.
Table 6 Estimated effect of loss-framed contracts on grids completed
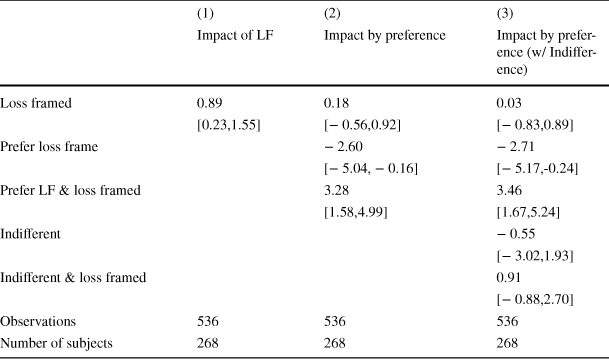
|
(1) |
(2) |
(3) |
|
|---|---|---|---|
|
Impact of LF |
Impact by preference |
Impact by preference (w/ Indifference) |
|
|
Loss framed |
0.89 |
0.18 |
0.03 |
|
[0.23,1.55] |
[− 0.56,0.92] |
[− 0.83,0.89] |
|
|
Prefer loss frame |
− 2.60 |
− 2.71 |
|
|
[− 5.04, − 0.16] |
[− 5.17,-0.24] |
||
|
Prefer LF & loss framed |
3.28 |
3.46 |
|
|
[1.58,4.99] |
[1.67,5.24] |
||
|
Indifferent |
− 0.55 |
||
|
[− 3.02,1.93] |
|||
|
Indifferent & loss framed |
0.91 |
||
|
[− 0.88,2.70] |
|||
|
Observations |
536 |
536 |
536 |
|
Number of subjects |
268 |
268 |
268 |
95% CI in brackets, based on heteroskedastic-robust standard errors, clustered by worker. Tables S.2–S.4 in the supplementary materials present results with alternative clustering assumptions for the variance estimator. All regressions also included dummy variables for order effects (= 1 if started in loss frame), and for round effects (= 1 if second round), whose estimated coefficients are suppressed for clarity
Results 2 and 3 suggests that an employer that exclusively offers loss-framed contracts in a market in which competitors offer gain-framed contracts would be at a disadvantage unless loss-framed-contract-preferring workers are more productive; in other words, unless employers could offer loss-framed contracts to screen for productive workers. The data, however, do not support a screening function for loss-framed contracts (Result 3.2.4).
3.2.4 Result 4: Productivity effect on loss-frame-preferring workers
The subgroup of workers who preferred the loss-framed contract are less productive, on average, in the gain-framed contract than other workers, and the loss-framed contract only served to increase their productivity to match the other workers’ productivity. In Table 6, column 2, the estimated coefficient in the second row reflects the productivity difference, in the gain-framed contract condition, between the 20% of workers who prefer the loss-framed contract and the other workers. The negative value (− 2.60) implies that the loss-frame-preferring subgroup is less productive, on average.
Thus the output of the loss-frame-preferring workers under the loss-framed contract is similar to the output of the gain-framed contract preferring workers under the gain-framed contract:
 0.86 (95% CI [− 1.23, 2.95]). In other words, the loss-framed contract appears to make the subgroup of loss-frame-preferring workers equally productive as the other workers.
Although the loss-framed-contract does not appear to serve as a screen for high-productivity workers in our context, it may serve as a commitment device for low-productivity workers (Imas et al., Reference Imas, Sadoff and Samek2016). To exploit this commitment device, however, an employer would have to offer two types of framing simultaneously within its organization and let workers select their preferred framing, or separate its operations into two units, each offering a different framing. In many contexts, the organizational complexities and fixed costs implied by such strategies could easily dominate the modest performance benefits from loss-framed contracts.
4 Discussion
We sought to understand preferences for contract framing for two reasons. First, heterogeneity of preferences might shed light on the paucity of loss-framed contracts in the field. Second, the literature has yielded ambiguous conclusions about worker preferences for contract framing. An older literature suggests that people are hesitant to apply, or work under, contracts that implicitly label people as low performers (Baker et al., Reference Baker, Jensen and Murphy1988) and penalize low performance, rather than reward high performance (Lazear, Reference Lazear1991). In the loss-aversion context, Imas et al. (Reference Imas, Sadoff and Samek2016, p. 1271) write that “[s]tandard behavioral models predict a tradeoff in the use of loss contracts: employees will work harder under loss contracts than under gain contracts; but, anticipating loss aversion, they will prefer gain contracts to loss contracts.”
Consistent these predictions, Luft (Reference Luft1994) reports evidence that subjects in a laboratory experiment preferred gain-framed contracts and that the preference increased with experience. In a field experiment in which workers expressed their preference for contracts and willingness to pay to work in the opposite frame, workers preferred the gain frame and were willing to pay more, on average, to move from the loss-framed contract to the gain-framed contract (Brownback & Sadoff, Reference Brownback and Sadoff2020). In a different laboratory experiment in which subjects could choose their contract type each period, Gonzalez et al. (Reference Gonzalez, Hoffman and Moser2020) find that subjects in the employee role are no more productive when assigned the loss frame rather than the gain frame. They report that 80% of subjects chose the gain-framed contract in more than 90% of the periods. In a non-experimental field study in which factory workers worked under mixed-frame contracts (i.e. there are stipulations for both bonuses and penalties), Van der Stede et al. (Reference Van der Stede, Wu and Wu2020) report that workers were more likely to quit after receiving a penalty.
In contrast two studies with payoff-equivalent contracts and incentivized elicitations of preferences for the contracts conclude that people prefer loss-framed contracts (Imas et al., Reference Imas, Sadoff and Samek2016; de Quidt, Reference de Quidt2018). Imas et al. (Reference Imas, Sadoff and Samek2016) first ran a between-workers design (N = 83) in which workers completed a slider task under a loss-framed contract or a gain-framed contract. The reward was a t-shirt. Performance was either sufficient to keep/receive the t-shirt or it was not. The authors estimate that the loss-framed contract increased effort by about 0.5 SD. In a second experiment with different workers and a between-workers design (N = 85), workers were endowed with $5, and then presented with the opportunity to participate in the slider task for a t-shirt reward. Workers were offered either a gain-framed or a loss-framed contract, and then participated in the equivalent of a random-price auction in which they expressed their willingness-to-pay (WTP) to work for the t-shirt. If the random price was greater than their stated WTP, the workers waited for others to complete the task. If the price was less than or equal to their stated WTP, the worker engaged in the task. Imas et al. report that the average WTP was $2.54 for the loss-framed contract and $1.76 for the gain-framed contract. They conclude, “[s]urprisingly, rather than a preference for the gain contract, we find that people actually prefer loss contracts.” (Reference Imas, Sadoff and Samek2016, p. 1272). To explain this apparent preference for loss-framed contracts, the authors hypothesize that loss-framed contracts serve as a commitment device.
Although a higher average WTP for the loss-framed contract is one metric of group preferences, it may be sensitive to outliers in small sample sizes and it does not reveal whether more people prefer the loss-framed contract or the game-framed contract. If the margin by which loss-frame-preferring people are willing to pay more for their preferred contract is larger than the margin by which gain-frame-preferring people are willing to pay more for their preferred contract, then it is possible for
 even if most people prefer the gain-framed contract (see more details in supplementary materials). In our design, workers chose directly between a loss-framed and gain-framed contract, and thus there is no ambiguity about the proportion of people who prefer each contract type.
In contrast to Imas et al. (Reference Imas, Sadoff and Samek2016), de Quidt (Reference de Quidt2018) elicits contract choice rather than WTP. Six-hundred and eighty-seven mTurk workers are randomized into two groups. One group chooses between working on a task under a loss-framed contract or doing their next-best alternative activity, which is unknown to the experimenter The other group chooses between working on the same task under a gain-framed contract or doing their next-best alternative activity. The acceptance rate was higher, by 11 percentage points, for the loss-framed contract. Based on that experiment, and some variations in which the salience of the framing is varied, the author concludes (p. 523) that there is “no evidence of the predicted distaste for penalties [loss-framed contracts].”
Yet in both the Imas et al. and de Quidt studies, workers express their preferences for contracts under an information asymmetry: they were likely familiar with a gain-framed contract, but they may never have seen, much less worked under, a loss-framed contract. Their choices may thus have included a value for experiencing (sampling) a novel form of incentive contract. We believe that, prior to expressing a preference, workers should be familiar with both contracts, and then given an opportunity to choose which contract they wish to work under in subsequent rounds of the same task. We achieve that level playing field with our design, in which workers experience both contracts prior to choosing directly between a loss-framed and gain-framed contract (and the order in which they experienced the contracts is randomized). Thus, there is no ambiguity about the proportion of people who prefer each contract type.
In sum, based on a meta-analysis and a new experiment, we conclude that the productivity effects of loss-framed incentive contracts may not be as large as they appear in the behavioral science literature. Moreover, in our experiment, the productivity-enhancing effect of loss-framed contracts is concentrated among a minority of workers (~ 20%) who prefer loss-framed contracts over gain-framed contracts. These workers, on average, are less productive than workers who either prefer gain-framed contracts or are indifferent between the two contracts. Organizations that only offer loss-framed incentive contracts would experience higher costs of recruitment and replacement than similar organizations offering gain-framed contracts, with no countervailing increase in average worker productivity. These organizations could offer both types of contracts, and let workers choose their preferred contract, but the costs of administering two parallel payment systems might outweigh the benefits.
In addition to attempting to replicate our results, future studies should extend the post-treatment assignment period. Our experiment and all the studies in our meta-analysis have very short time horizons in which worker output was observed. In most of the studies, including all but one of the studies eliciting contract preference, the experimenters observe behavior for fewer than two hours (see Table 2). Longer time periods may yield different inferences about worker preferences for contract frames and about the impacts of contract frames on productivity. For example, although Brownback and Sadoff (Reference Brownback and Sadoff2020) reported that workers preferred gain-framed contracts to loss-framed contracts, they also reported that workers become more favorable to loss-framed contracts after experiencing them. Longer time horizons are also needed to determine if the modest effects of loss-framed contracts decline (or grow) with repetition over longer horizons. For example, in one study, loss aversion could not be detected in contexts in which workers experienced repeated losses and gains (Erev et al., Reference Erev, Ert and Yechiam2008). Should the loss-framed contract productivity impacts be ephemeral, the potential gains from field applications of loss-framed contracts in naturally occurring environments would be even smaller.
Acknowledgements
The authors thank the editor, Lata Gangadharan; two anonymous referees; Alex Reese-Jones and Jon de Quidt for comments on the working paper; all the researchers, who provided data included in the meta-analysis; Glenn Harrison and Susan Laury their input into the experiment design; Prithvijit Mukherjee and Sean Bokelmann for assistance running sessions. Ferraro acknowledges support from USDA National Institute of Food and Agriculture (#2019-67023-29854).
Data availibility
All data for the meta-analysis and experimental analyses are available at https://doi.org/10.17605/OSF.IO/J5MA8.
Material availability
The instructions and z-tree code to replicate the experiment are available at https://doi.org/10.17605/OSF.IO/J5MA8.
Code availability
All code for the meta-analysis and experimental analyses are available at https://doi.org/10.17605/OSF.IO/J5MA8.
Declarations
Conflict of interest
The authors declare that they have no conflict of interest.


 5×5grid


 Open access